Introduction
Obesity is a leading health problem worldwide, which is associated with leptin resistance, insulin resistance, and hyperlipidemia [1].
It has been reported that the HFD is associated with metabolic disorders (weight gain, insulin and leptin resistance), disturbed serum profiles (hyperglycemia, hyperinsulinemia, hypercholesterolemia, hypertriglyceridemia) and abnormal liver aminotransferase activity as well as histopathological changes (hepatic steatosis and pericentral fibrosis) similar to humans with the non-alcoholic susceptibility gene NAFLD phenotype [2, 3].
The administration of a high-fat diet for 24 h could result in a change in glucose metabolism, triggering a reduced level of circulating leptin and thus contribute to a high-fat diet in promoting weight gain [4].
Leptin resistance is defined as decreased leptin receptor sensitivity with a consequent reduction in leptin appetite suppression and subsequent obesity [1].
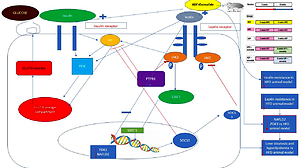
The binding of leptin to its receptor in the hypothalamus enhances the Janus kinase JAK2/signal transducer and activator of the transcription (JAK2/STAT3, anorectic signal) signaling pathway inducing a satiety state, through activating cytokine signaling 3 suppression (SOCS3) that ends the leptin signaling effect on JAK2/STAT3 by terminating the JAK2 activity through ubiquitination [5]. Therefore, abnormal food intake is a state of disturbance of the suppressor SOCS3 effect on leptin-JAK2/STAT3 signaling [6, 7].
Protein tyrosine phosphatase 1B (PTP1B) is another negative regulator of leptin via dephosphorylation of the upstream activator molecules JAK2 and STAT3, representing the direct substrate of PTP1B [8].
Obesity and insulin resistance are targeted by glucagon-like peptide-1 (GLP-1) receptor agonists (exenatide; exendin-4) the common standard therapy used for hyperglycemia [9]. The liver is one of the primary target organs for GLP-1 agonists to exert their plasma-lowering effect in hyperglycemia via the insulin-regulated glucose transporter GLUT4 [10]. GLUT4 regulates body adiposity through crosstalk genes between leptin and insulin signaling promoting GLUT4 translocation and glucose transport in an insulin receptor substrate-1 (IRS-1)/phosphatidylinositol 3-kinase (PI3K) dependent manner [11].
According to our knowledge, no previous studies have investigated the effect of ADF and/or exenatide on the brain leptin signaling pathway and leptin resistance.
Pyruvate dehydrogenase kinase isoenzyme 3 (PDK3), which is a part of the pyruvate dehydrogenase complex (PDC), and the non-alcoholic susceptibility 2 gene (NAFLD2) are two novel adipogenesis regulators that have an apparent role in the pathogenesis of obesity and could contribute to liver steatosis [12, 13]. However, no study has reported the effect of ADF and/or exenatide on their expression in HFD-induced liver steatosis.
The objective of the present study is to investigate the effects of ADF and/or exenatide, administered once daily for 8 weeks to mice with HFD-induced obesity and insulin resistance, on brain leptin resistance, insulin sensitivity and hepatic steatosis.
Material and methods
Experimental animals
Sixty male Swiss mice (22 ±4 g) were purchased from Vacsera (Egypt). The Research Ethics Committee approved the protocol of the present study at the Faculty of Medicine, Suez Canal University with approval number 4264 according to the National Institute of Health Guide (National Institute of Health Publications No. 80-23, Revised 1978) for the care and use of laboratory animals for the experimental procedure.
Drugs and chemicals
Exenatide injection (BYDUREON vials (2 mg/2 ml solution), AstraZeneca Pharmaceuticals, Wilmington, DE, USA) was diluted with sterile saline [14].
Dietary protocols
HFD was used to induce obesity and insulin resistance [2]. Animals were fed the HFD for 8 weeks (Supplementary Figure S1 B). The HFD composition was as follows (g/kg): powdered NPD 365, lard 310, casein 250, cholesterol 10, vitamin and mineral mix 60, as described previously [15–17]. Mice subjected to ADF received NPD alternating with HFD, every other day, modified from Smith et al. [18].
Experimental design
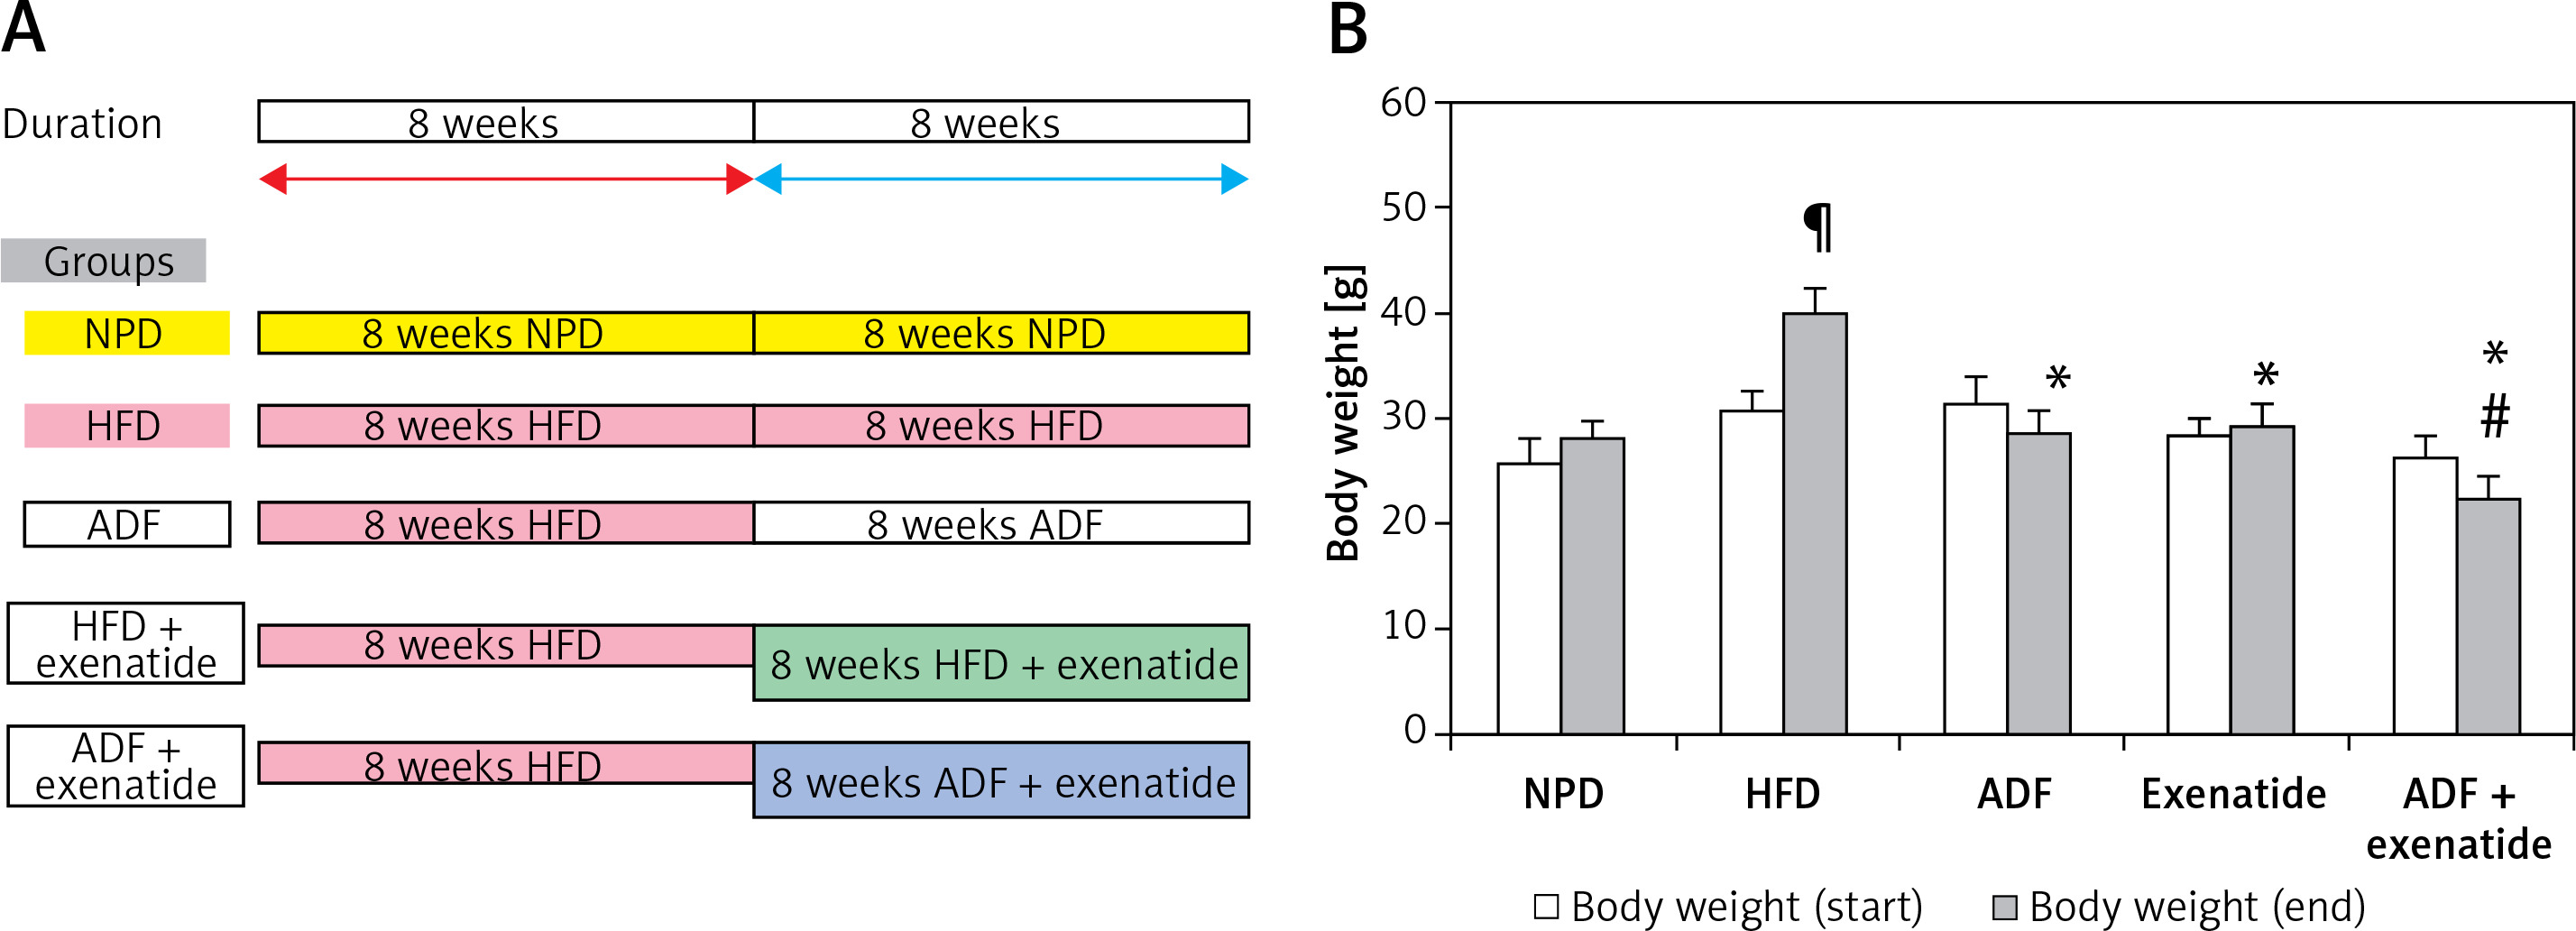
The mice (n = 60) were randomly divided into 6 groups (n: 10/group) and assigned to groups as follows: Group (i): mice fed with NPD. Group (ii) exenatide control (NPD mice received exenatide, 10 μg/kg, s.c.) [14]. Group (iii) HFD control, mice fed HFD [18]. Group (iv) ADF treated mice fed ADF regime: (NPD/ADF) every other day. On day 1 they received as much HFD food as desired during the entire 24-h period. On day 2 they received NPD food and so on [18]. Group (v) exenatide treated, HFD mice received exenatide (HFD + exenatide, 10 μg/kg, s.c.) [14]. Group (vi) ADF and exenatide treated, HFD mice fed on ADF regimen and received exenatide (ADF + exenatide, 10 μg/kg, s.c.). All animal groups were fed the HFD for 8 weeks before they received the corresponding treatment (ADF and/or exenatide) for 8 additional weeks (Figure 1 A). For exenatide groups, drug administration was every 24 h. Body weight was measured at the start and at the end of the study.
Figure 1
A – The dietary protocol. B – Mice’s body weight at start and end of the study. Values are mean ± SD (n = 10), analyzed by one-way ANOVA followed by Tukey’s multiple comparisons test. ¶,*,#p < 0.05; ¶compared with NPD control group, *compared with HFD control group, #compared with exenatide treated group
NPD – normal palatable diet, HFD – high-fat diet, ADF – alternate-day high-fat diet.
Serum levels of sugar and insulin resistance
FBG was tested using (Bio diagnostics, Cairo, Egypt) with an automated analyzer (Cobas 6000, Cobas c501, Roche).
Serum fasting insulin level was determined by an ELISA mouse kit (catalog #90080; Crystal Chem, Downers Grove, IL). Insulin resistance was determined using the Homeostatic Model Assessment of Insulin Resistance (HOMA-IR) index, which was calculated according to the formula: fasting insulin (μU/l) × fasting glucose (nmol/l)/22.5 [19].
Blood and tissue sample collection
At the end of the study, sera were collected from anesthetized mice (80 mg/kg ketamine HCL, i.p.) and stored at –80°C until further assayed. Serum samples were tested for activities of the liver enzymes alanine aminotransferase (ALT) and aspartate aminotransferase (AST) and lipid profile was measured with a spectrophotometer. Then, brain and liver biopsies were taken, one part from which was fixed in neutral formalin 10% (v/v) and then paraffin-embedded for further histopathology and immunohistochemistry. Other parts of the brain and liver biopsies were processed for real-time polymerase chain reaction (qRT-PCR), western blotting, and ELISA assays [20].
Assessment of brain leptin level
Brain tissue was homogenized and centrifuged using the supernatant to assess leptin content by ELISA kit (Elabscience Biotechnology, USA, Catalog #: MBS012834).
Estimation of brain leptin receptor and liver PDK3, GLUT4 and NAFLD2 genes’ expression by qRT-PCR
Expression profiling of brain leptin receptor (F: 5′-AGA ATT GTT CCT GGG CAC AAG -3′; R: 5′-ACACTCATCCTCACAGGTTCC-3′), and liver PDK3 (F: 5′-TGGAGATGGTGCCGCTAATG-3′; R: 5′-TG-TGGTGTTGATTCAGCAAC-3′), GLUT4 (F: 5′-GAGCCTGAATGCTAATGGAG-3′, R: 5′GAGAGAGAGCGTCCAATGTC-3′), and NAFLD2 (F: 5′-GCCAGTTACTGTCCTCTCTTG-3′, R: 5′-CCCTGGGCAGCTATGTTTAT-3′) genes was carried out using qRT-PCR following the guidelines of the Minimum Information for Publication of Quantitative Real-Time PCR Experiments (MIQE). All reactions were run using SYBR Green Master Mix (Applied Biosystems) under the following thermal cycling parameters: 95°C for 10 min (1 cycle), 95°C for 15 s, and 60°C for 1 min (40 cycles). Gene-specific primer pairs were designed with Gene Runner Software (Hasting Software, Inc., Hasting, NY) from RNA sequences from the gene bank as described previously [16].
Relative expression of studied gene mRNA was calculated using the comparative 2–ΔΔCt method of analysis as described by Livak and Schmittgen [21]. All values were normalized to β-actin, which was used as the control housekeeping gene, and reported as fold change over background levels detected in the diseased groups. [16].
Estimation of brain JAK2, STAT3, SOCS3, PTP1 and liver IRS-1 and PI3K protein expression by Western blot technique
The brain JAK2, STAT3, SOCS, PTP1B proteins, and the liver IRS-1 and PI3K proteins were assessed by Western blot technique achieved by extraction from tissue homogenates using ice-cold radioimmunoprecipitation assay (RIPA), using the V3 Western Workflow Complete System, Bio-Rad Hercules, (CA, USA) as described previously [22]. Protein bands were visualized using enhanced chemiluminescence (Pierce ECL Western blotting substrate) and Alliance gel doc (Alliance 4.7 Gel doc, UK). UV Tec software (UK) was used to semi-quantify protein bands. All protein bands were normalized against β-actin protein. Band intensity was analyzed by the ChemiDoc imaging system with Image Lab TM software version 5.1 (Bio-Rad Laboratories Inc., Hercules, CA, USA).
Lipid profile and liver enzymes
The serum total cholesterol (TC), triglycerides (TG), low-density lipoprotein cholesterol (LDL), and high-density lipoprotein cholesterol (HDL) were measured by the enzymatic colorimetric method [23, 24], and the liver enzymes alanine aminotransferase (ALT) and aspartate aminotransferase (AST) were measured by the kinetic method described by Bergmeyer and Hørder 1980 (Bio diagnostics, Cairo, Egypt), with a Roche P800 automatic biochemical analyzer (Roche, U.S.A.) [25].
Liver histopathological examination
Livers were dissected and fixed in a 10% phosphate-buffered paraformaldehyde solution. Tissues were dehydrated and embedded in paraffin and sectioned at 4 μm, stained with H&E, and then examined blindly under a light microscope. The severity and extent of steatosis were observed for each case. The findings were classified into the following degrees: grade (0): no change; grade (1): mild steatosis, occasional ballooning degeneration in zone 3, mild lobular inflammation with or without mild portal inflammation; grade (2): moderate steatosis in 33–66% of lobules, ballooning degeneration in zone 3, moderate lobular inflammation with mild to moderate portal inflammation; grade (3): severe steatosis in > 66% of lobules, marked ballooning especially in zone 3, scattered lobular acute and chronic inflammation with moderate portal inflammation and perivenular and pericellular fibrosis limited to zone 3 [26].
Statistical analysis
Data are expressed as mean ± SD. The difference between groups was analyzed using one-way analysis of variance (ANOVA) and the Kruskal-Wallis test followed by Tukey’s post-hoc test for multiple comparisons. The difference between group means was considered statistically significant when the p-value < 0.05. Data were analyzed using SPSS, version 17 (SPSS Inc., Chicago, Illinois, USA).
Results
There are no significant differences between the NPD and exenatide control group in regards to all the studied parameters.
Effect of ADF and/or exenatide on body weight
Weight of mice was assessed at the start and at the end of the experiment. HFD-fed animals’ body weights were significantly higher than NPD-fed animals. The combined ADF and exenatide group showed lower weight when compared with the exenatide treated group (Figure 1 B; p < 0.05).
Effect of ADF and/or exenatide on lipid profile
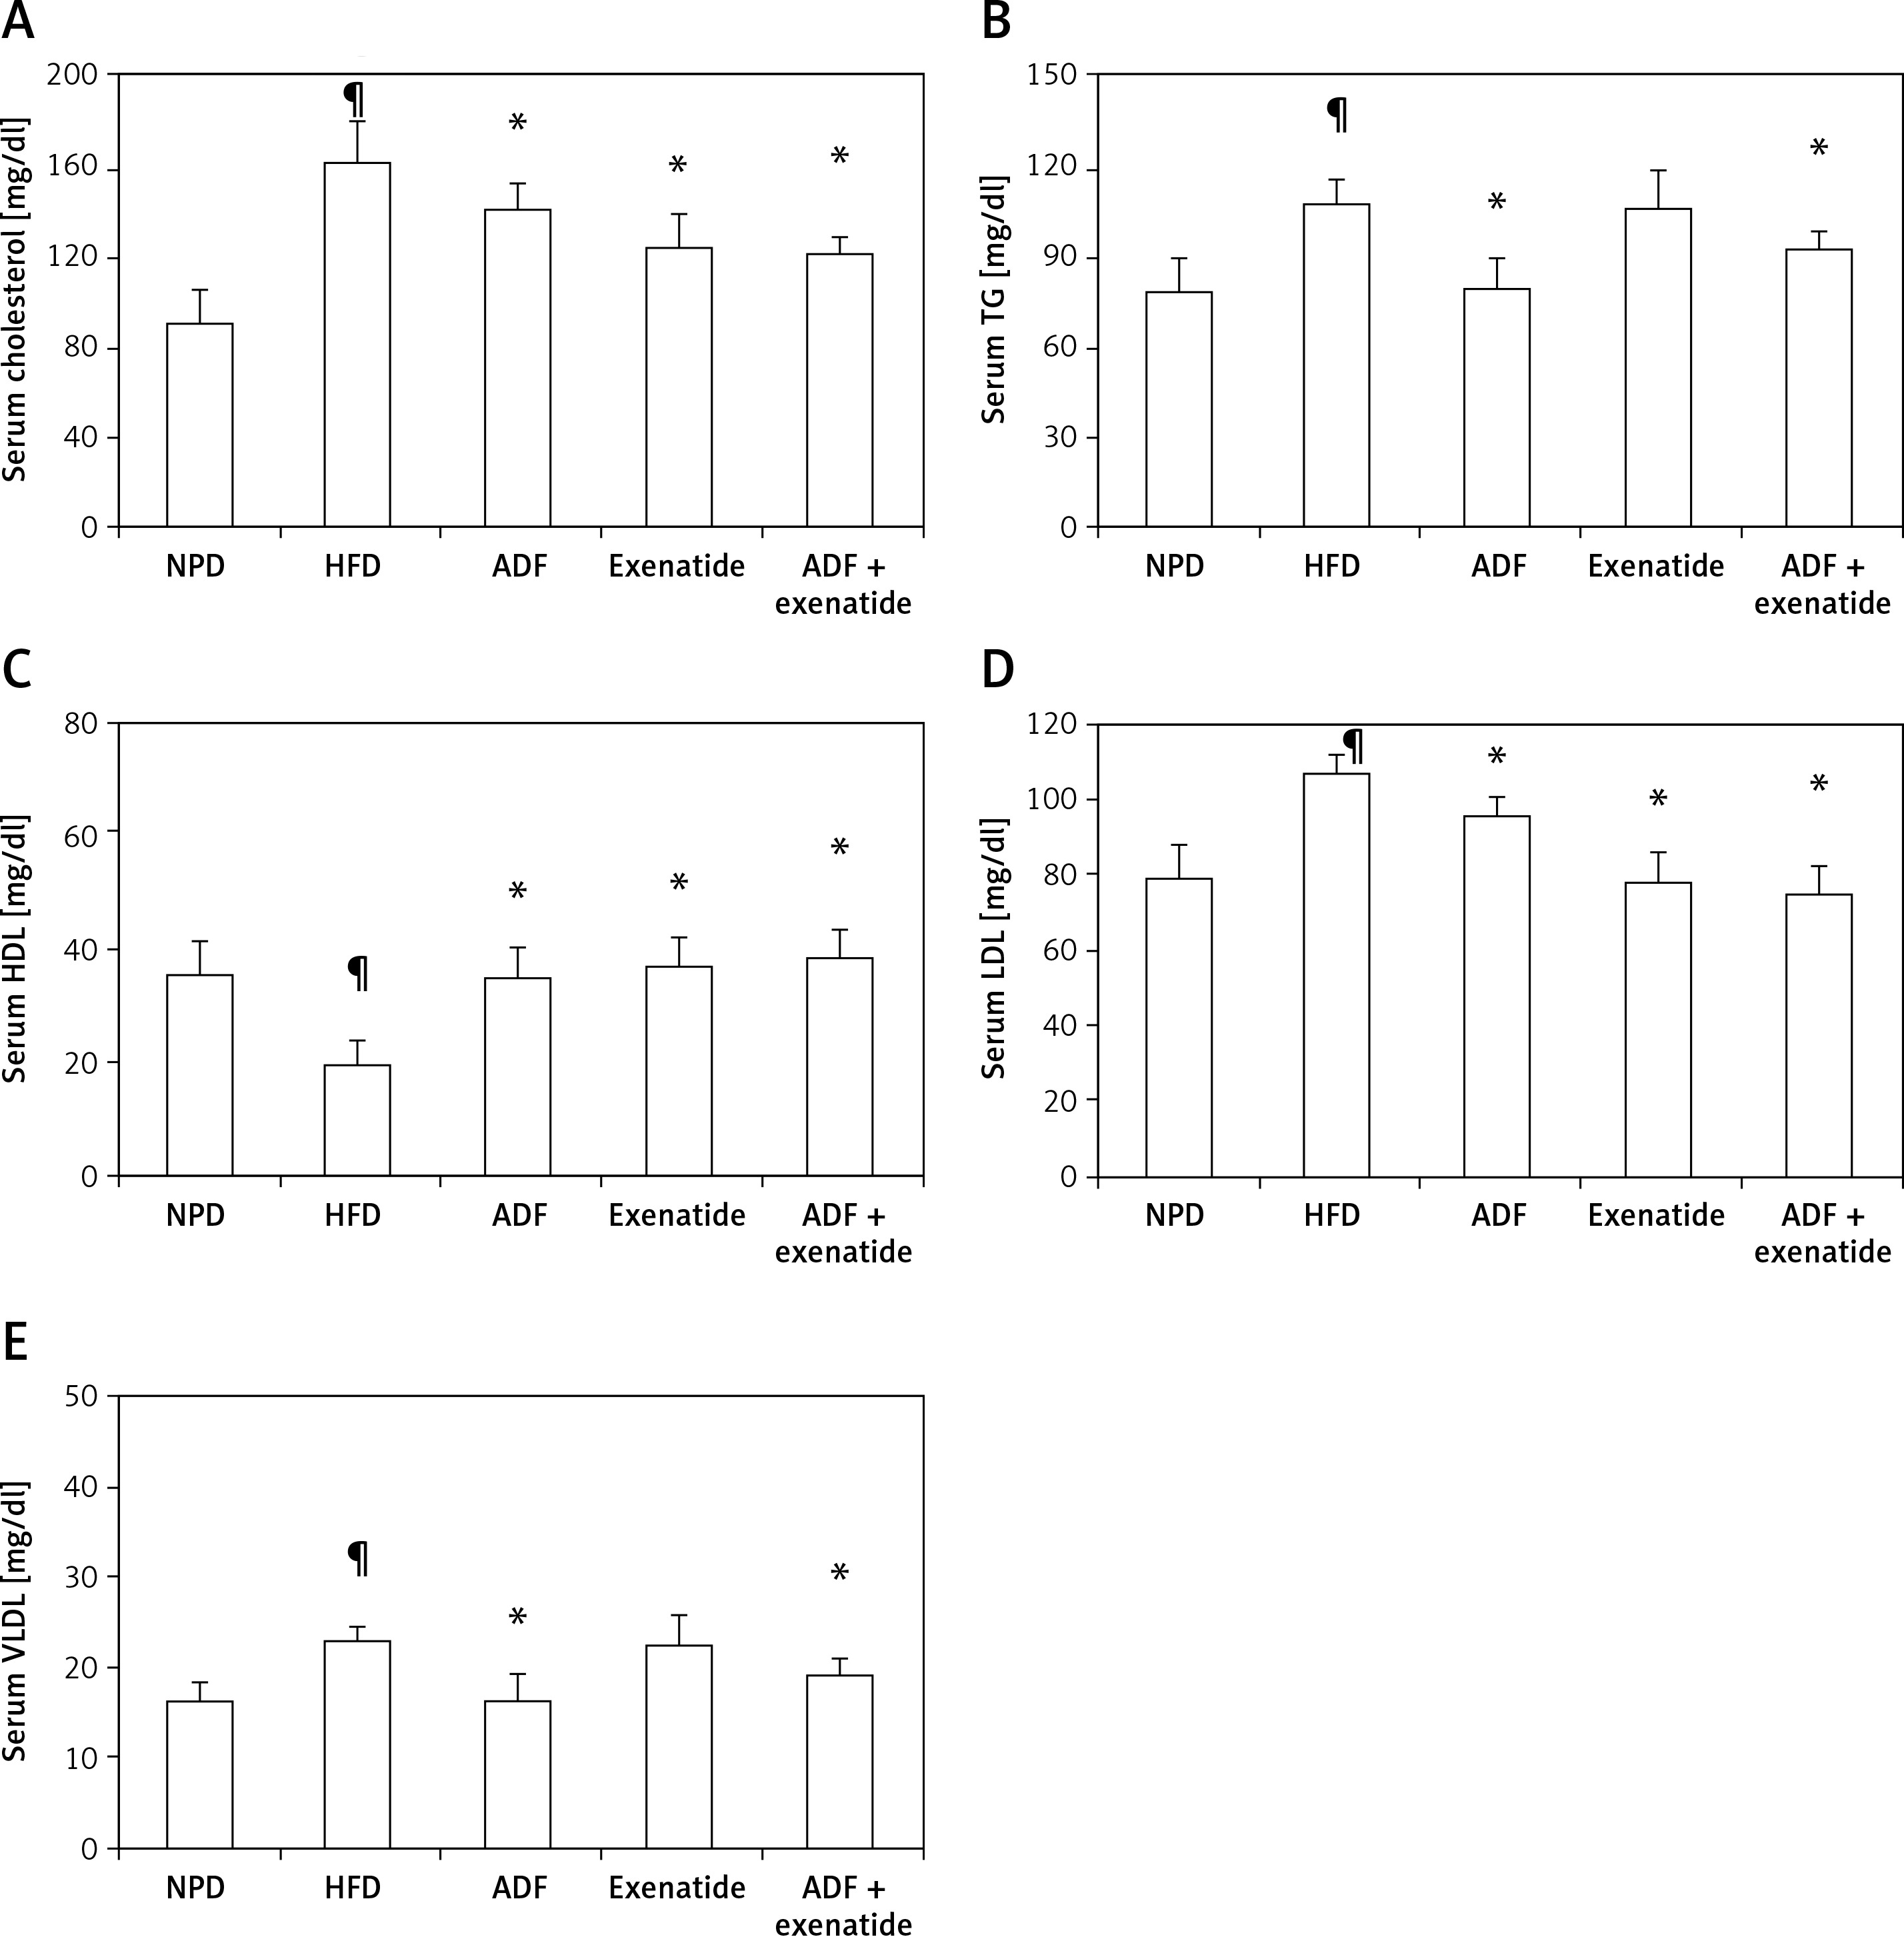
Figure 2 shows a significant increase in the lipid profile parameters TC, TG, LDL, and VLDL but a decrease in HDL in the HFD group compared to NPD treatment with ADF alone and the combined ADF + exenatide had reduced elevated lipid profile parameters and normalized HDL compared to the HFD group (p < 0.05). The same significant effect on TC, HDL, and LDL levels was also exerted by exenatide treatment (p < 0.05).
Figure 2
Effect of ADF and/or exenatide on lipid profile parameters in HFD-induced obesity in mice. Effect of ADF and/or exenatide on lipid profile parameters in HFD-induced obesity in mice. Values are mean ± SD (n = 10), analyzed by one-way ANOVA followed by Tukey’s multiple comparisons test. ¶,*,#p < 0.05; ¶compared with NPD control group, *compared with HFD control group, #compared with exenatide treated group
TG – triglycerides, HDL – high-density lipoprotein, LDL – low-density lipoprotein, VLDL – very low-density lipoprotein, NPD – normal palatable diet, HFD – high-fat diet, ADF – alternate-day high-fat diet.
Effect of ADF and/or exenatide on leptin resistance
Effect of ADF and/or exenatide on brain leptin level and expression
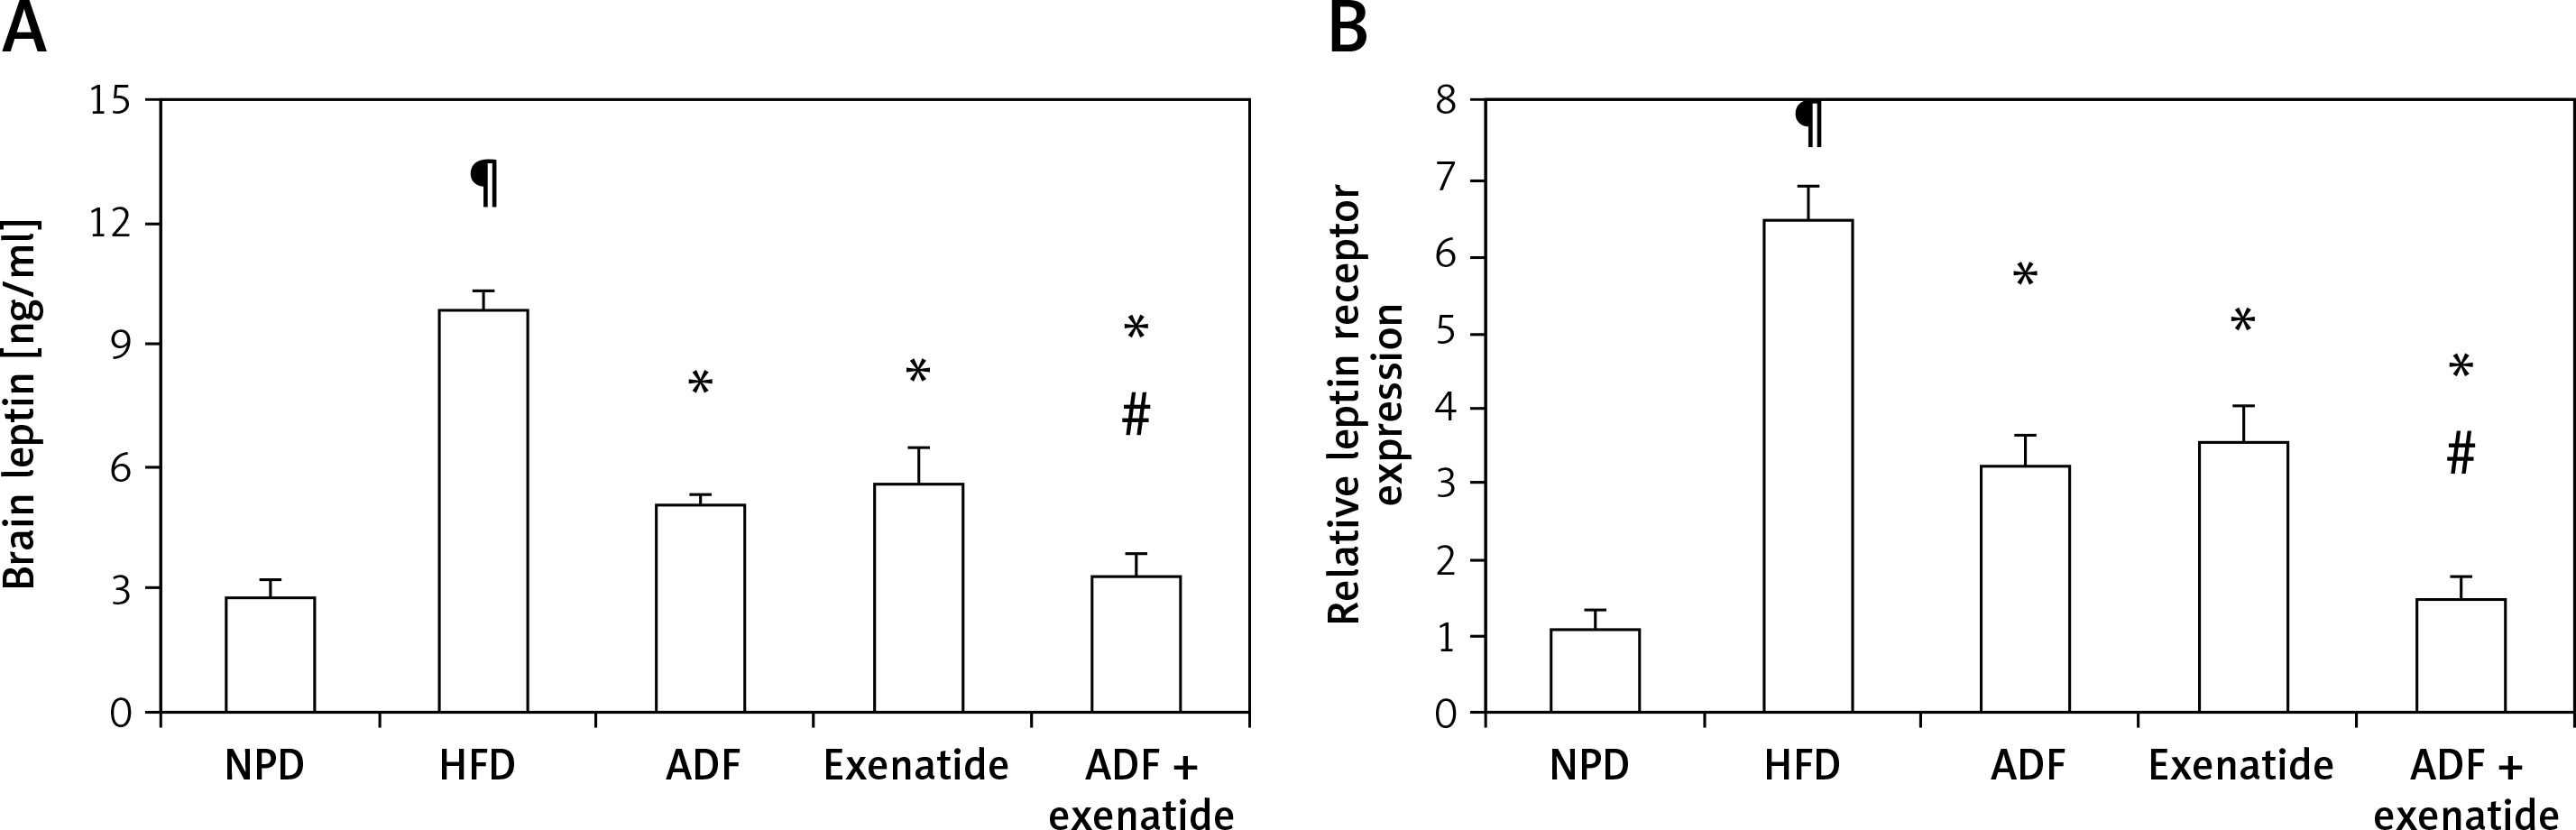
Figure 3 shows that HFD was associated with higher brain leptin level (Figure 3 A) and mRNA expression of leptin receptors in comparison with the NPD control group (p < 0.05, Figure 3 B). Treatment with ADF and/or exenatide revealed effectiveness in reducing the leptin level and the expression of leptin receptors compared to the HFD control group. The combined ADF/exenatide treated group downregulated (p < 0.05) the high levels of leptin and leptin receptor expression compared to exenatide-treated group.
Figure 3
Effect of ADF and/or exenatide on brain leptin content and receptor expression in HFD-induced obesity in mice. High calorie fed obese mice showed HFD-enhanced brain leptin level and receptor expression. A – ELISA detected leptin “ng/ml”, B – qRT-PCR, relative expression of leptin receptor gene in HFD-induced leptin resistance in mouse brain. Values are mean ± SD (n = 10), analyzed by one-way ANOVA followed by Tukey’s multiple comparisons test. ¶,*,#p < 0.05; ¶compared with NPD control group, *compared with HFD control group, #compared with exenatide treated group
NPD – normal palatable diet, HFD – high-fat diet, ADF – alternate-day high-fat diet.
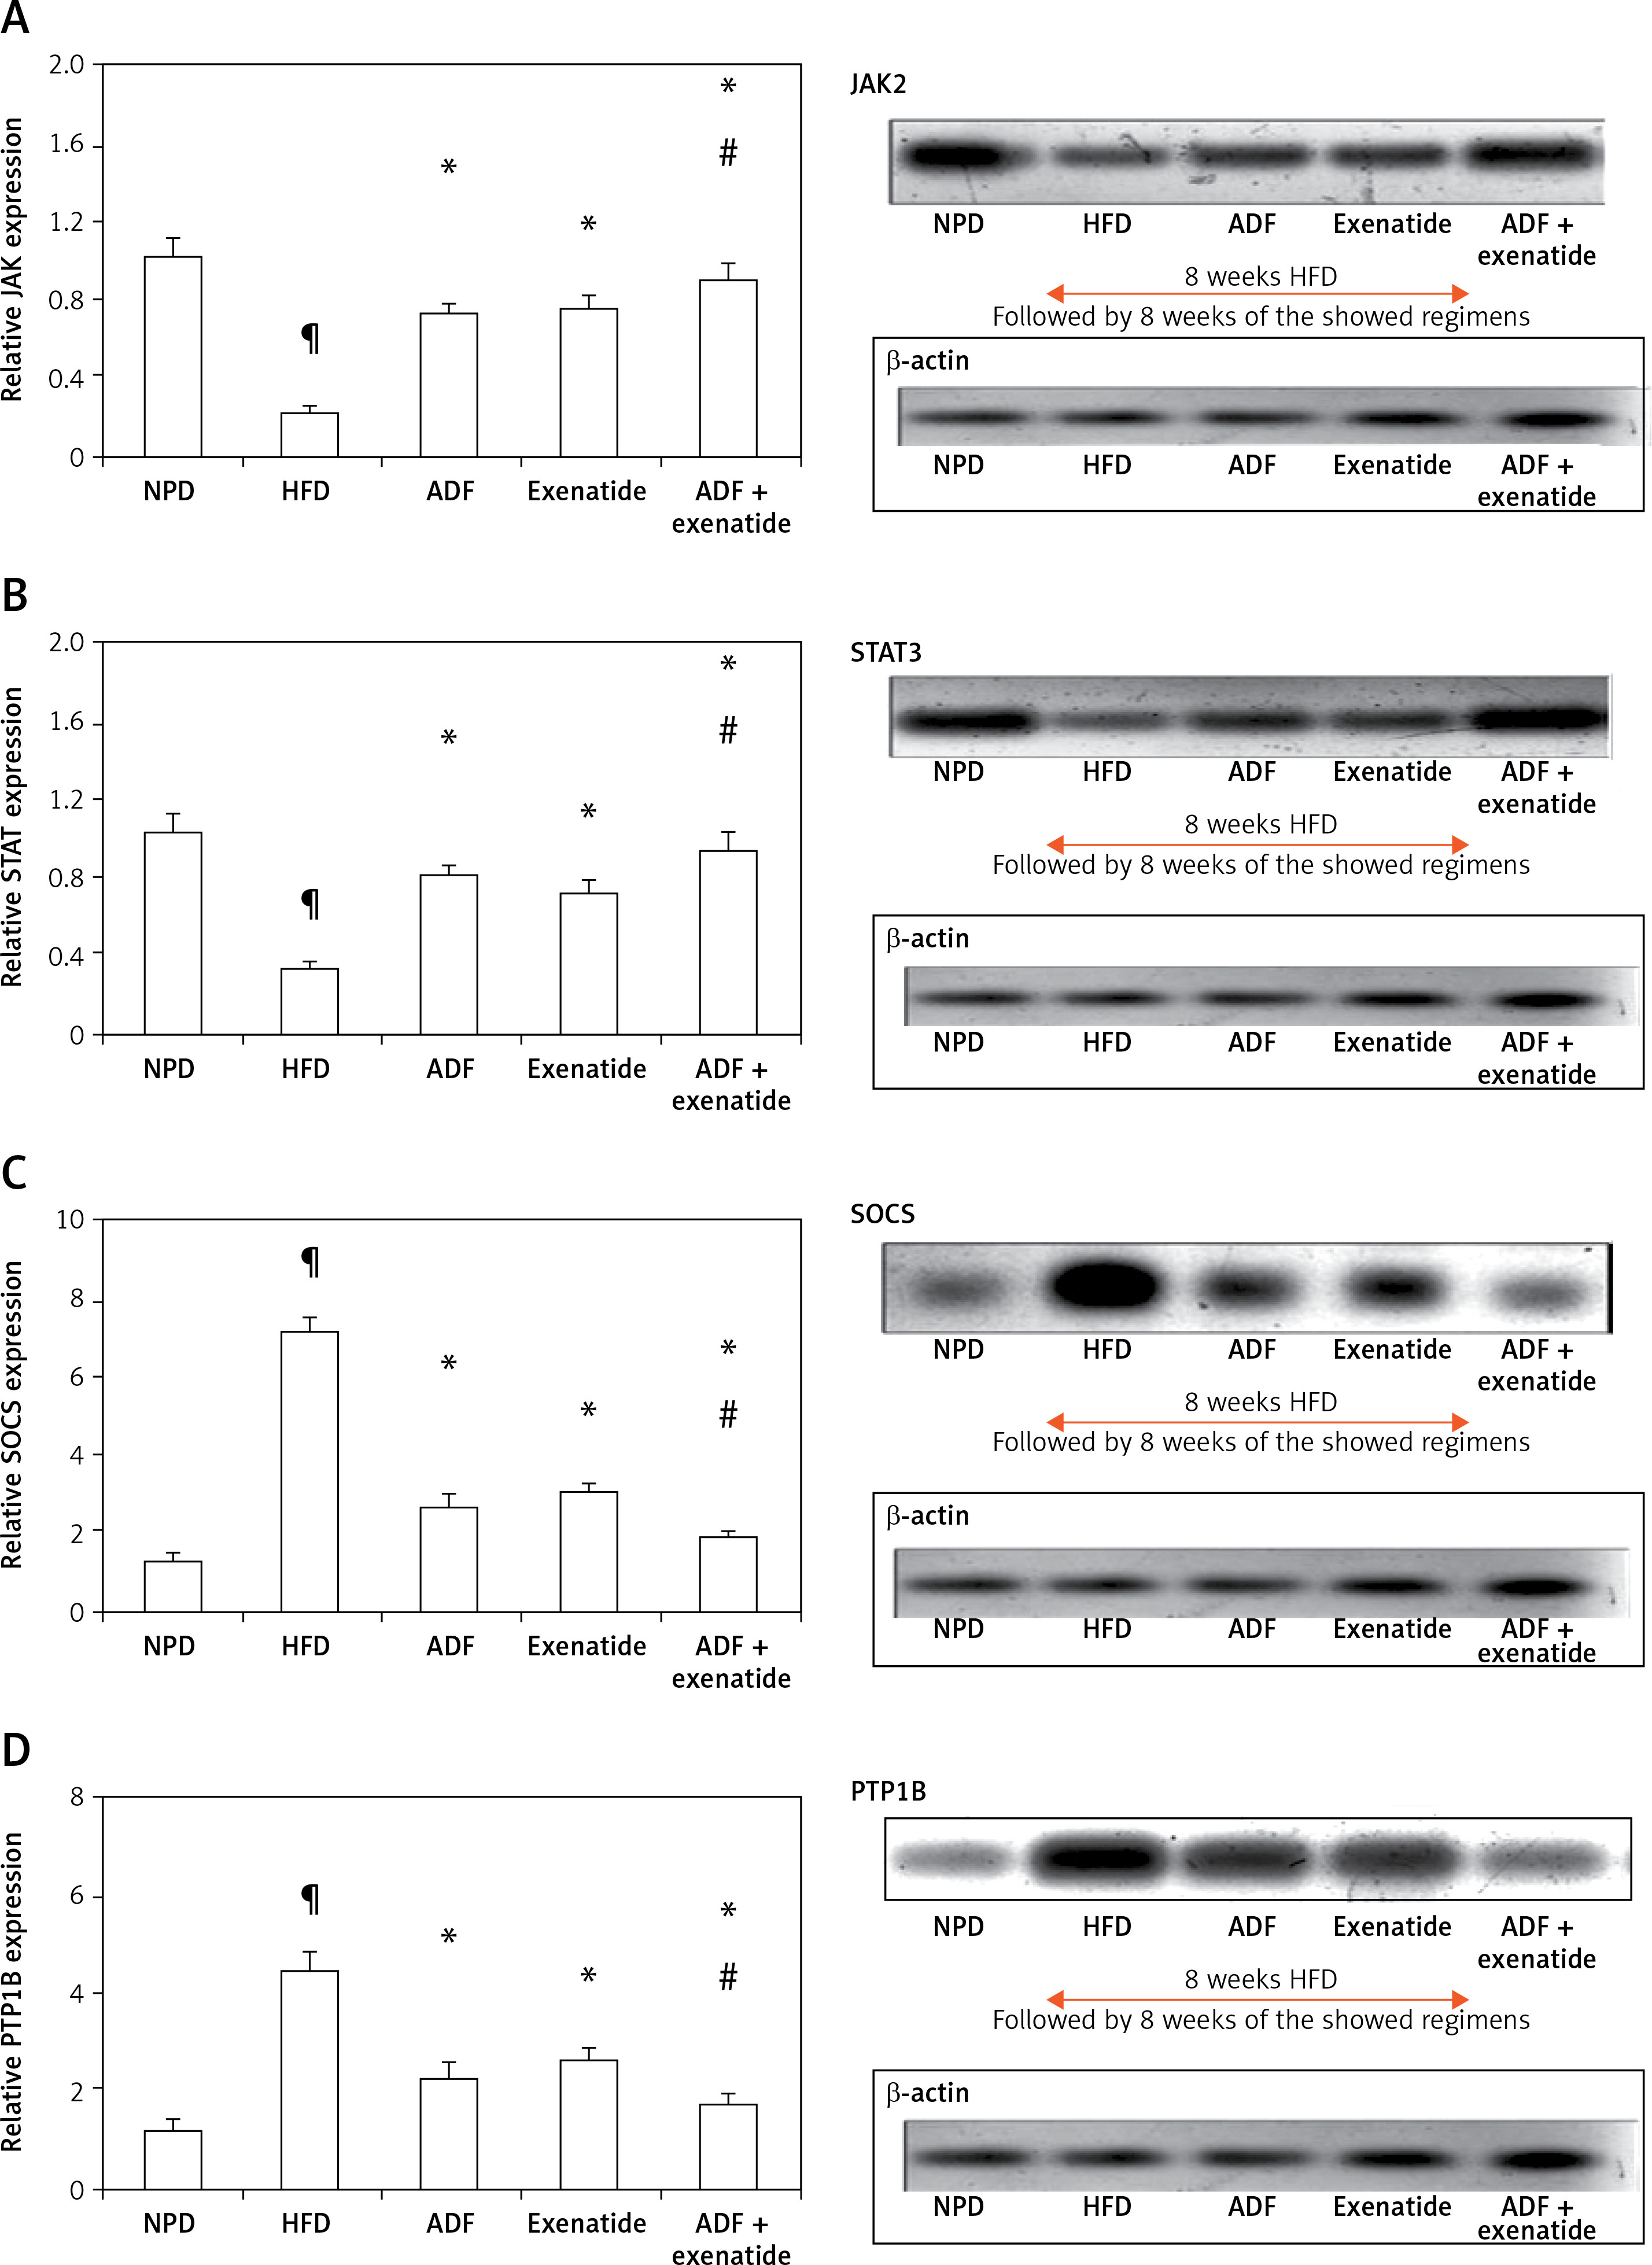
Effect of ADF and/or exenatide on brain leptin-sensitive cytokine receptor signaling: JAK2, STAT3, SOCS3 and PTP1B pathway
Figure 4 illustrates that expression of the leptin-sensitive proteins JAK2 (Figure 4 A) and STAT3 (Figure 4 B) was lower in HFD-fed mice in comparison to NPD-fed mice, with higher protein expression of the inhibitors SOCS3 (Figure 4 C) and PTP1B (Figure 4 D) (p < 0.05). Treatment with ADF and exenatide revealed effectiveness in increasing JAK2/STAT3 and inhibiting SOCS3 and PTP1B proteins in comparison with the HFD group and exenatide groups. It was more beneficial in upregulating the leptin-sensitive JAK2/STAT3 and attenuating the severity of the activated SOCS3 and PTP1B signaling pathway compared to the exenatide treated group (p < 0.05, Figure 4) leading to decreased weight (Figure 1).
Figure 4
Effect of ADF and/or exenatide on brain leptin-related pathway protein expression levels in HFD- induced obesity in mice. Effect of ADF and exenatide on: A – JAK2; B – STAT3; C – SOCS, D – PTP1B protein expression level in mice brain. Values are mean ± SD (n = 10), analyzed by one-way ANOVA followed by Tukey’s multiple comparisons test. ¶,*,#p < 0.05; ¶Compared with NPD control group, *compared with HFD control group, #compared with exenatide treated group
JAK2 – Janus kinase/signal transducer-2, STAT3 – activator of the transcription 3, SOCS – cytokine signaling 3, PTP1B – protein tyrosine phosphatase 1B, NPD – normal palatable diet, HFD – high-fat diet, ADF – alternate-day high-fat diet.
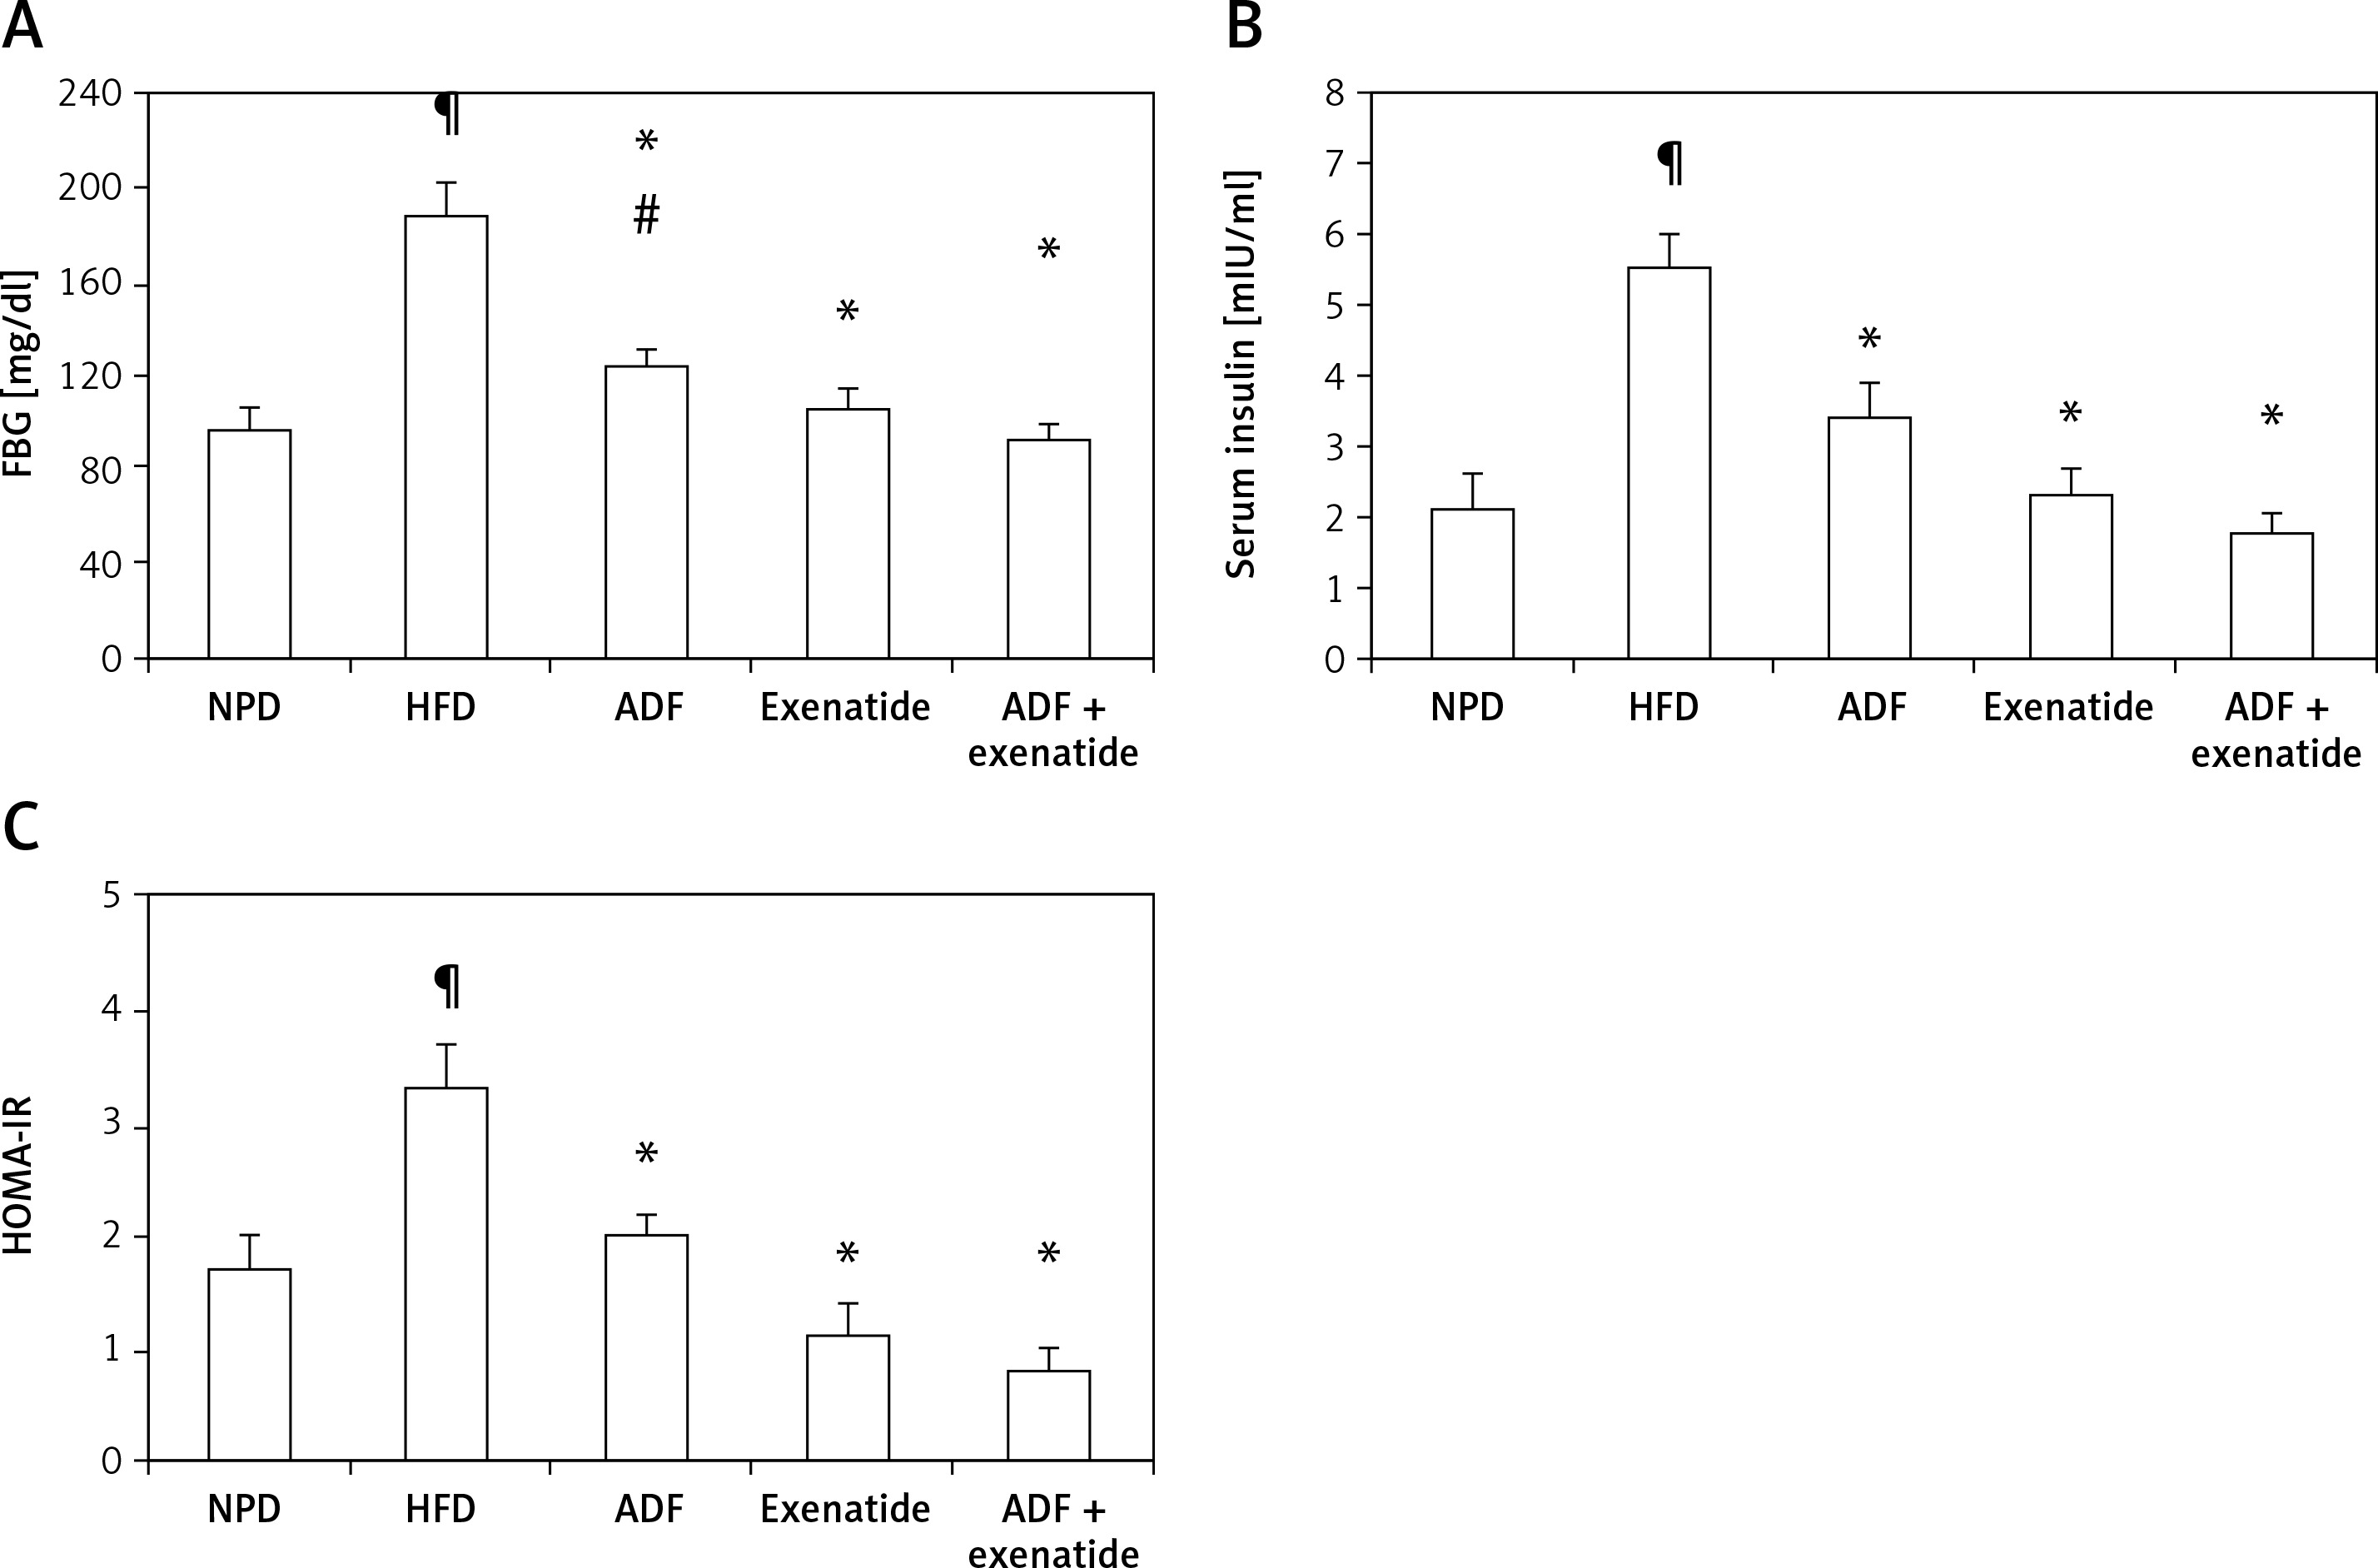
Effect of ADF and/or exenatide on insulin resistance
Effect of ADF and/or exenatide on insulin resistance markers
Figure 5 illustrates the elevation exerted by HFD, compared to the control group, on FBG (Figure 5 A), insulin (Figure 5 B) and HOMA-IR levels (Figure 5 C) to confirm the diabetic, insulin resistance model. A significant decrease in FBG is observed after the administration of ADF and/or exenatide. However, ADF combined with exenatide showed a statistically significantly lower FBG level compared to the exenatide treated group. Treatment with ADF and/or the GLP-1 agonist exenatide improved insulin level resistance and HOMA-IR (p < 0.05) compared to the HFD group.
Figure 5
Effect of ADF and/or exenatide on fasting blood glucose and insulin resistance in HFD-induced obesity in mice. Values are mean ± SD (n = 10), analyzed by one-way ANOVA followed by Tukey’s multiple comparisons test. ¶,*,#p < 0.05; ¶compared with NPD control group, *compared with HFD control group, #compared with exenatide treated group
HOMA – homeostatic model assessment, IR – insulin resistance, FBG – fasting blood glucose, NPD – normal palatable diet, HFD – high-fat diet, ADF – alternate-day high-fat diet.
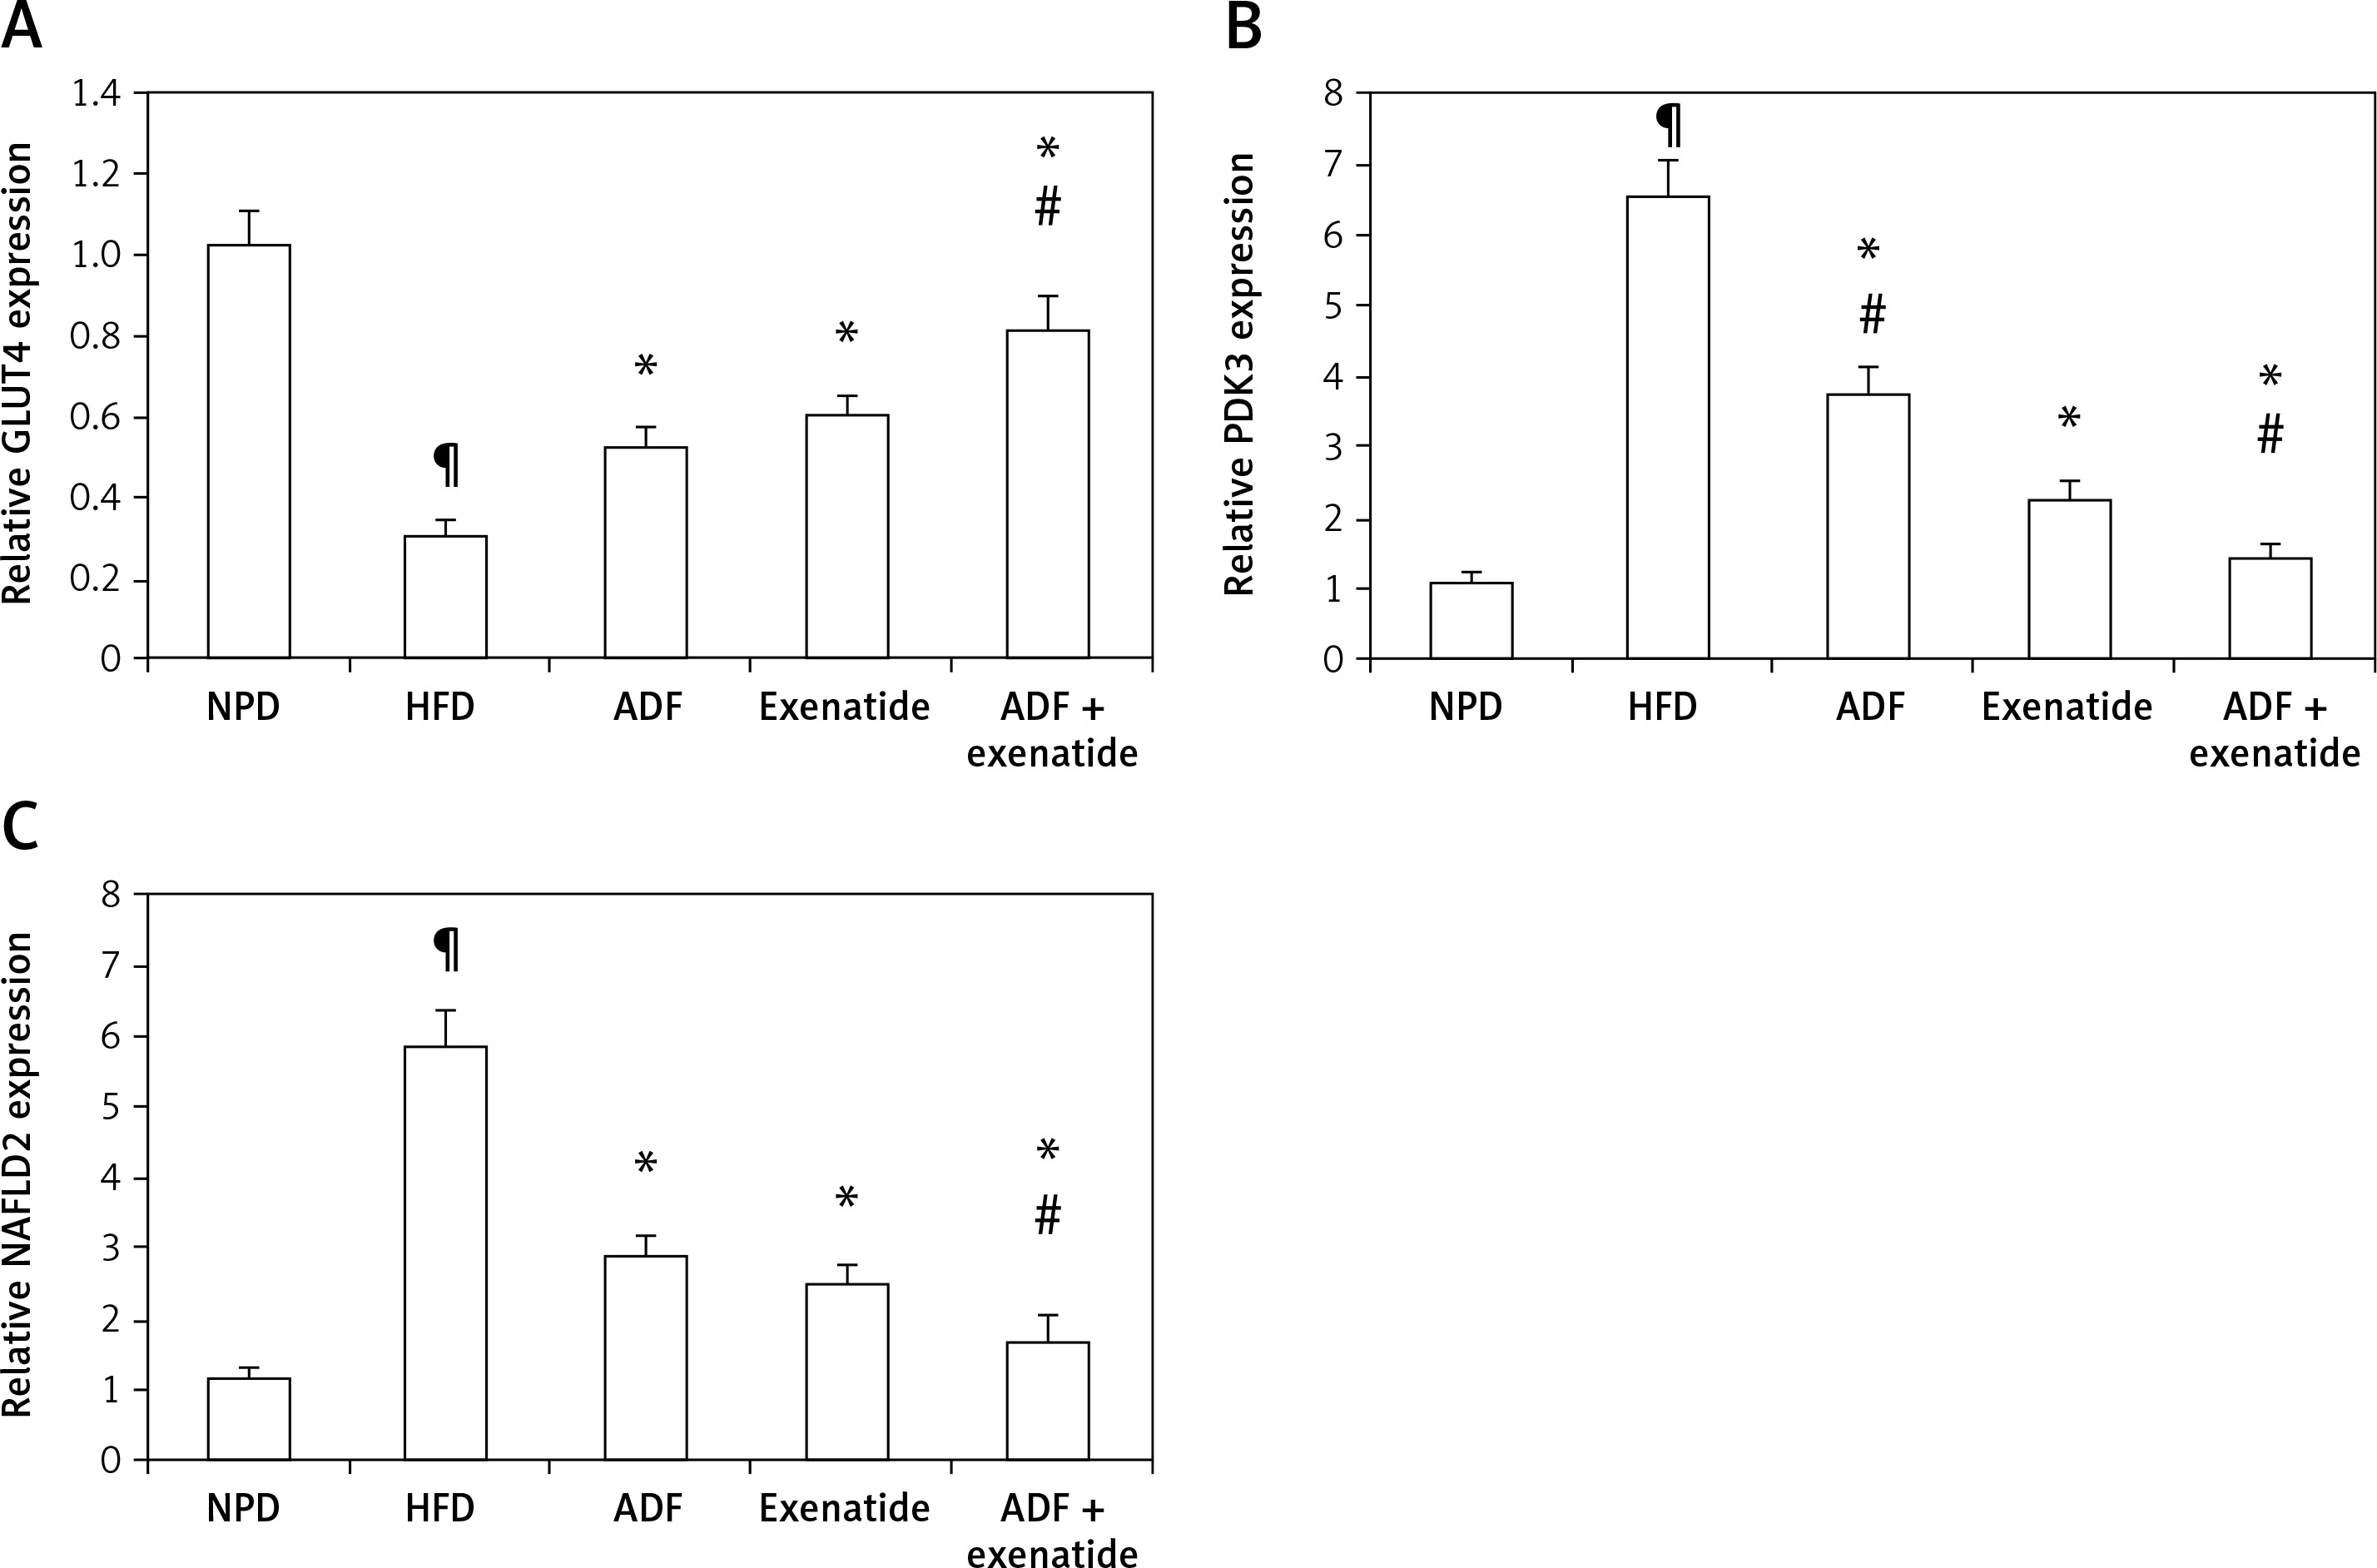
Effect of ADF and/or exenatide on insulin signaling pathway
Figures 6 and 7 A show the effect of ADF and exenatide on mouse liver relative expression of insulin resistance genes IRS-1/PI3K/GLUT4 in HFD-induced obesity and insulin resistance liver mice. Liver IRS-1 (Figure 6 A), PI3K (Figure 6 B), and GLUT 4 Figure 7 A) expression was lower in HFD-fed mice in comparison to NPD-fed mice. ADF and exenatide revealed effectiveness in increasing the expression of the IRS-1/PI3K/GLUT4 signaling pathway in comparison with the HFD group. Combined ADF and exenatide treatment was more beneficial in activation of the IRS-1/PI3K/GLUT4 genes signaling pathway compared to the exenatide treated group (p < 0.05), decreasing the fat deposit.
Figure 6
Effect of ADF and/or exenatide on liver insulin phosphorylation signal protein expression levels in HFD-induced obesity in mice. A – IRS1 is insulin transmitting signals to intracellular pathways. B – PI3K. Values are mean ± SD (n = 10), analyzed by one-way ANOVA followed by Tukey’s multiple comparisons test. ¶,*, #p < 0.05; ¶compared with NPD control group, *compared with HFD control group, #compared with exenatide treated group
IRS1 – insulin receptor substrate 1, PI3K – phosphatidylinositol 3-kinase, NPD – normal palatable diet, HFD – high-fat diet, ADF – alternate-day high-fat diet.
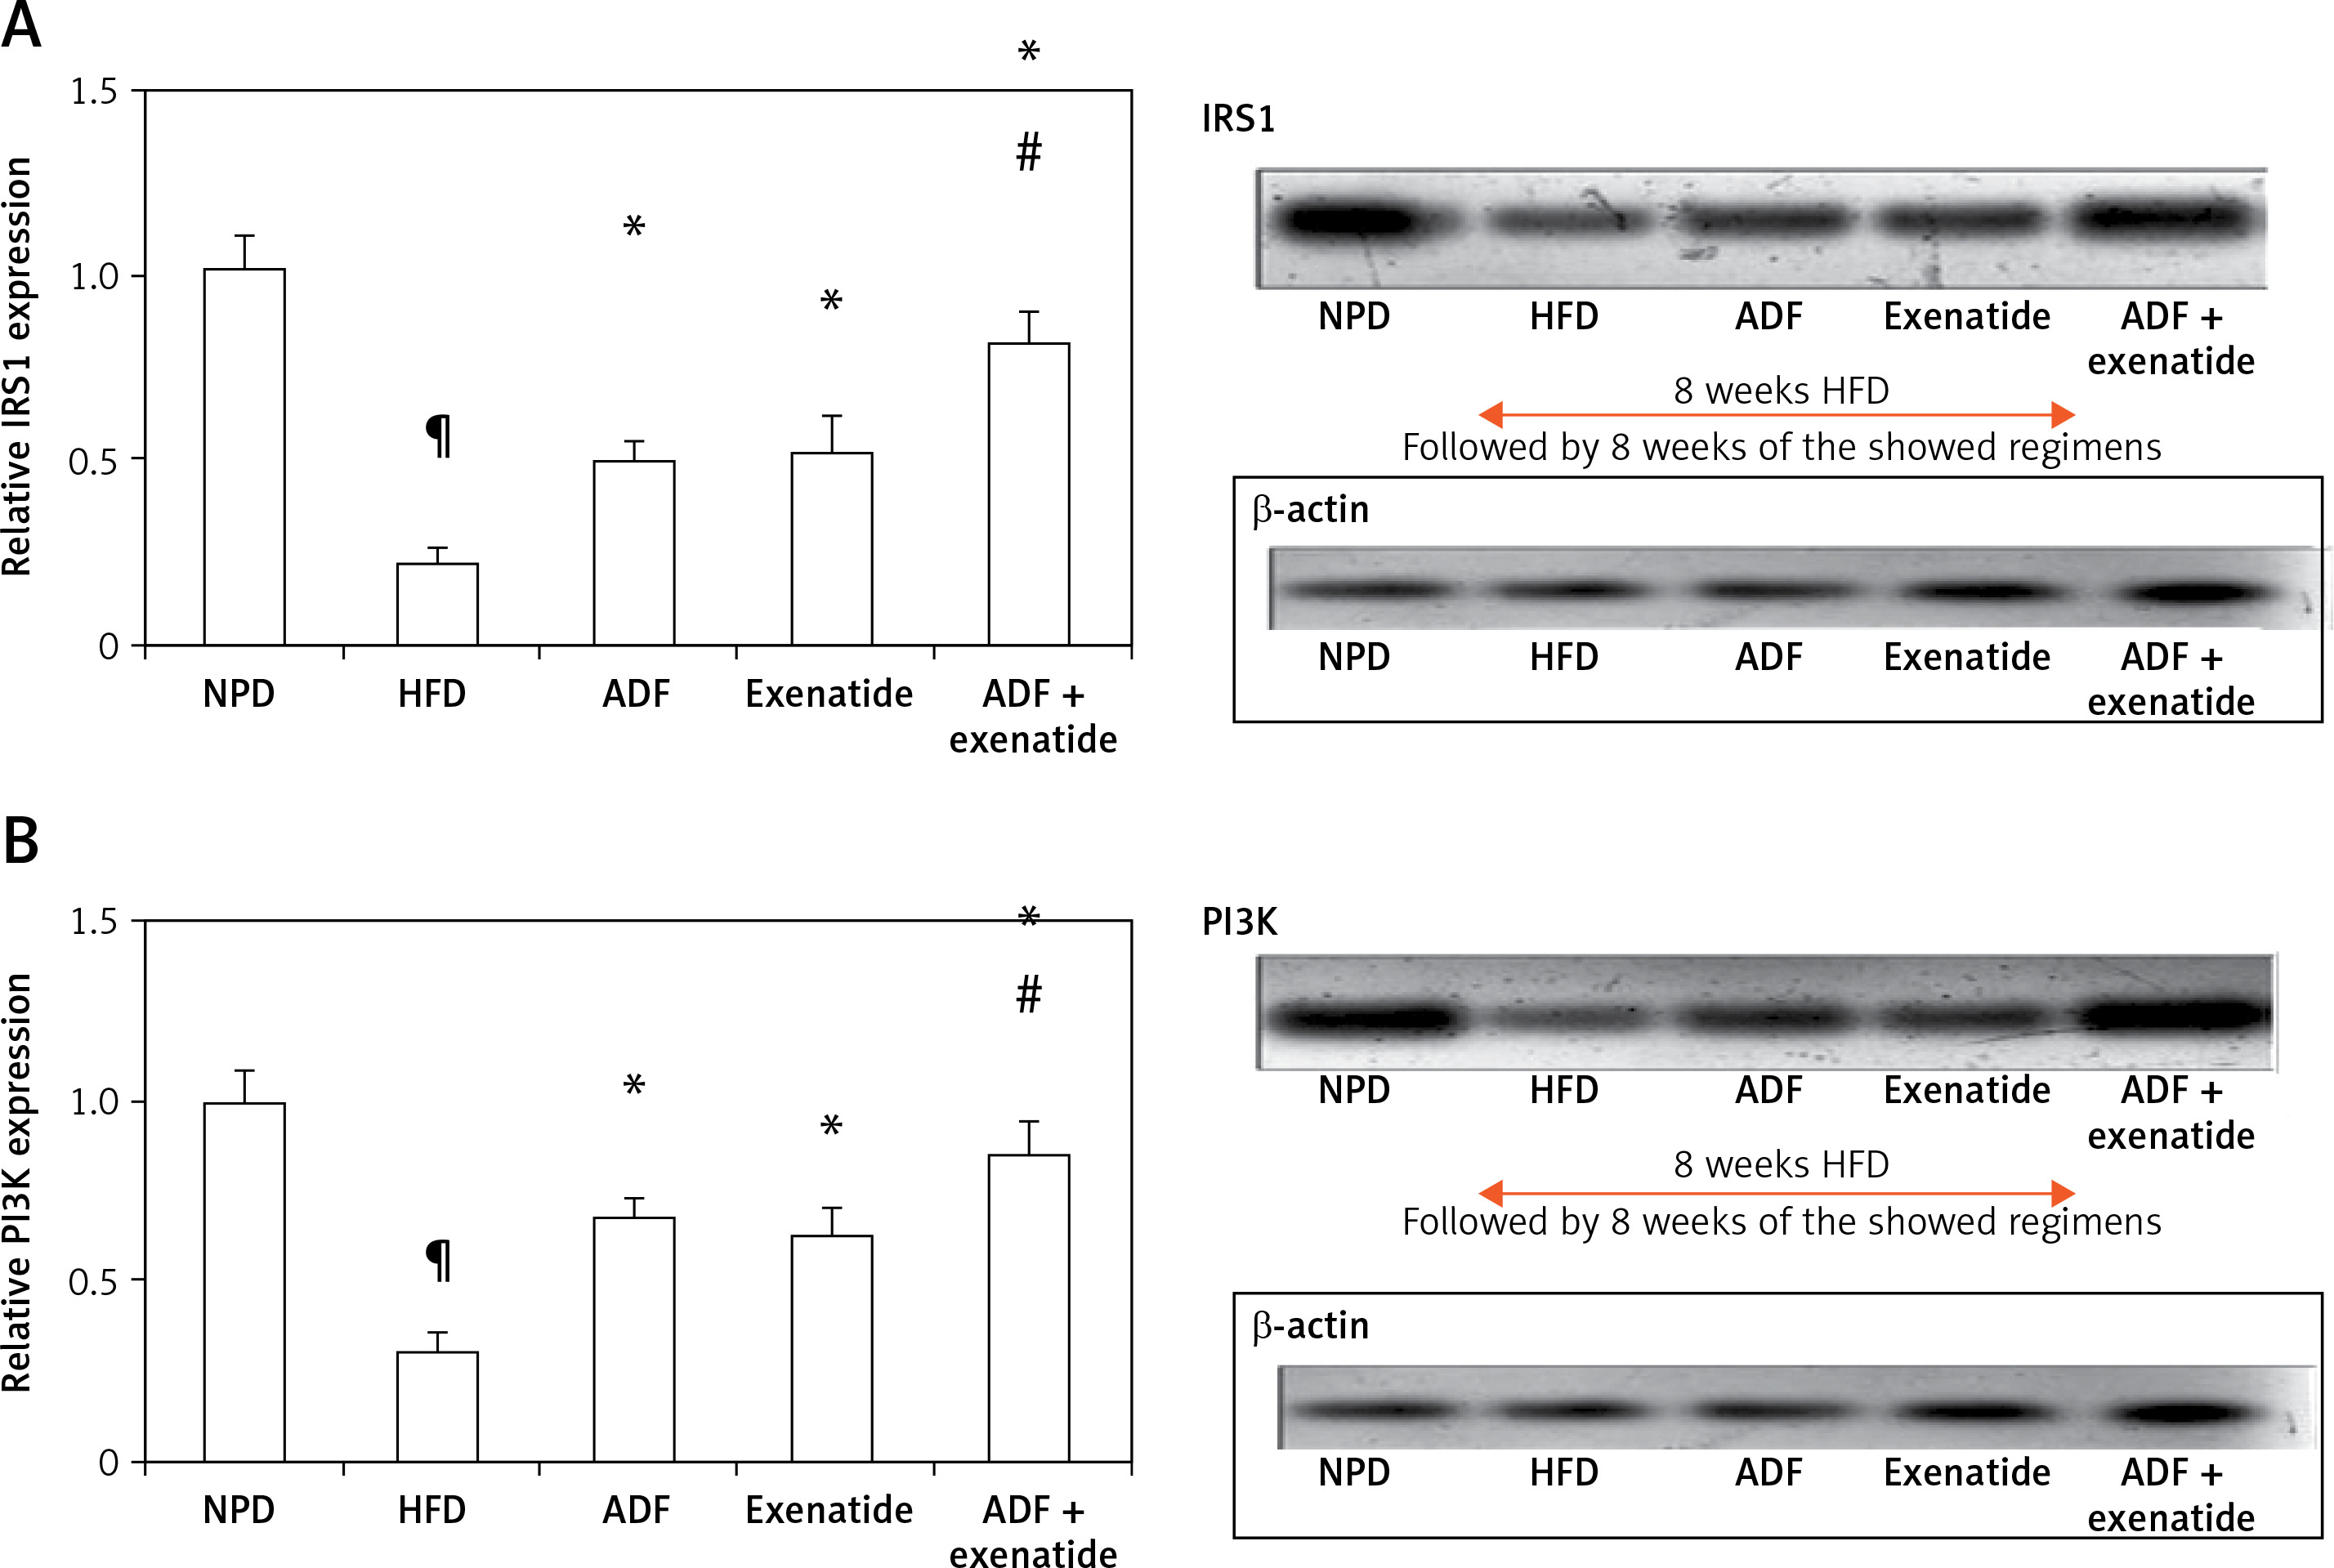
Figure 7
Effect of ADF and/or exenatide on liver GLUT4 and PDK3/NAFLD2 gene expression in HFD-induced obesity in mice. ADF and exenatide were able to reverse the HFD-induced diseases associated genes. A – GLUT4; B – PDK3; C – NAFLD2 in mouse liver. Values are mean ± SD (n = 10), analyzed by one-way ANOVA followed by Tukey’s multiple comparisons test. ¶,*,#p < 0.05; ¶compared with NPD control group, *compared with HFD control group, #compared with exenatide treated group
GLUT4 – glucose transporter 4, PDK3 – pyruvate dehydrogenase kinase, NAFLD2 – non-alcoholic susceptibility 2 gene, NPD – normal palatable diet, HFD – high-fat diet, ADF – alternate-day high-fat diet.
Effect of ADF and/or exenatide on hepatic steatosis markers
Effect of ADF and/or exenatide on hepatic adipogenicity genes
Figures 7 B and C demonstrate the effect of ADF and exenatide on the relative expression of adipogenicity genes PDK3 and NAFLD 2 expression in HFD-induced obesity and insulin resistance respectively, indicating higher mRNA expression in the HFD group in comparison, with NPD control, while the combined ADF and exenatide treated group downregulated the high levels of these genes compared to exenatide treated group (p < 0.05).
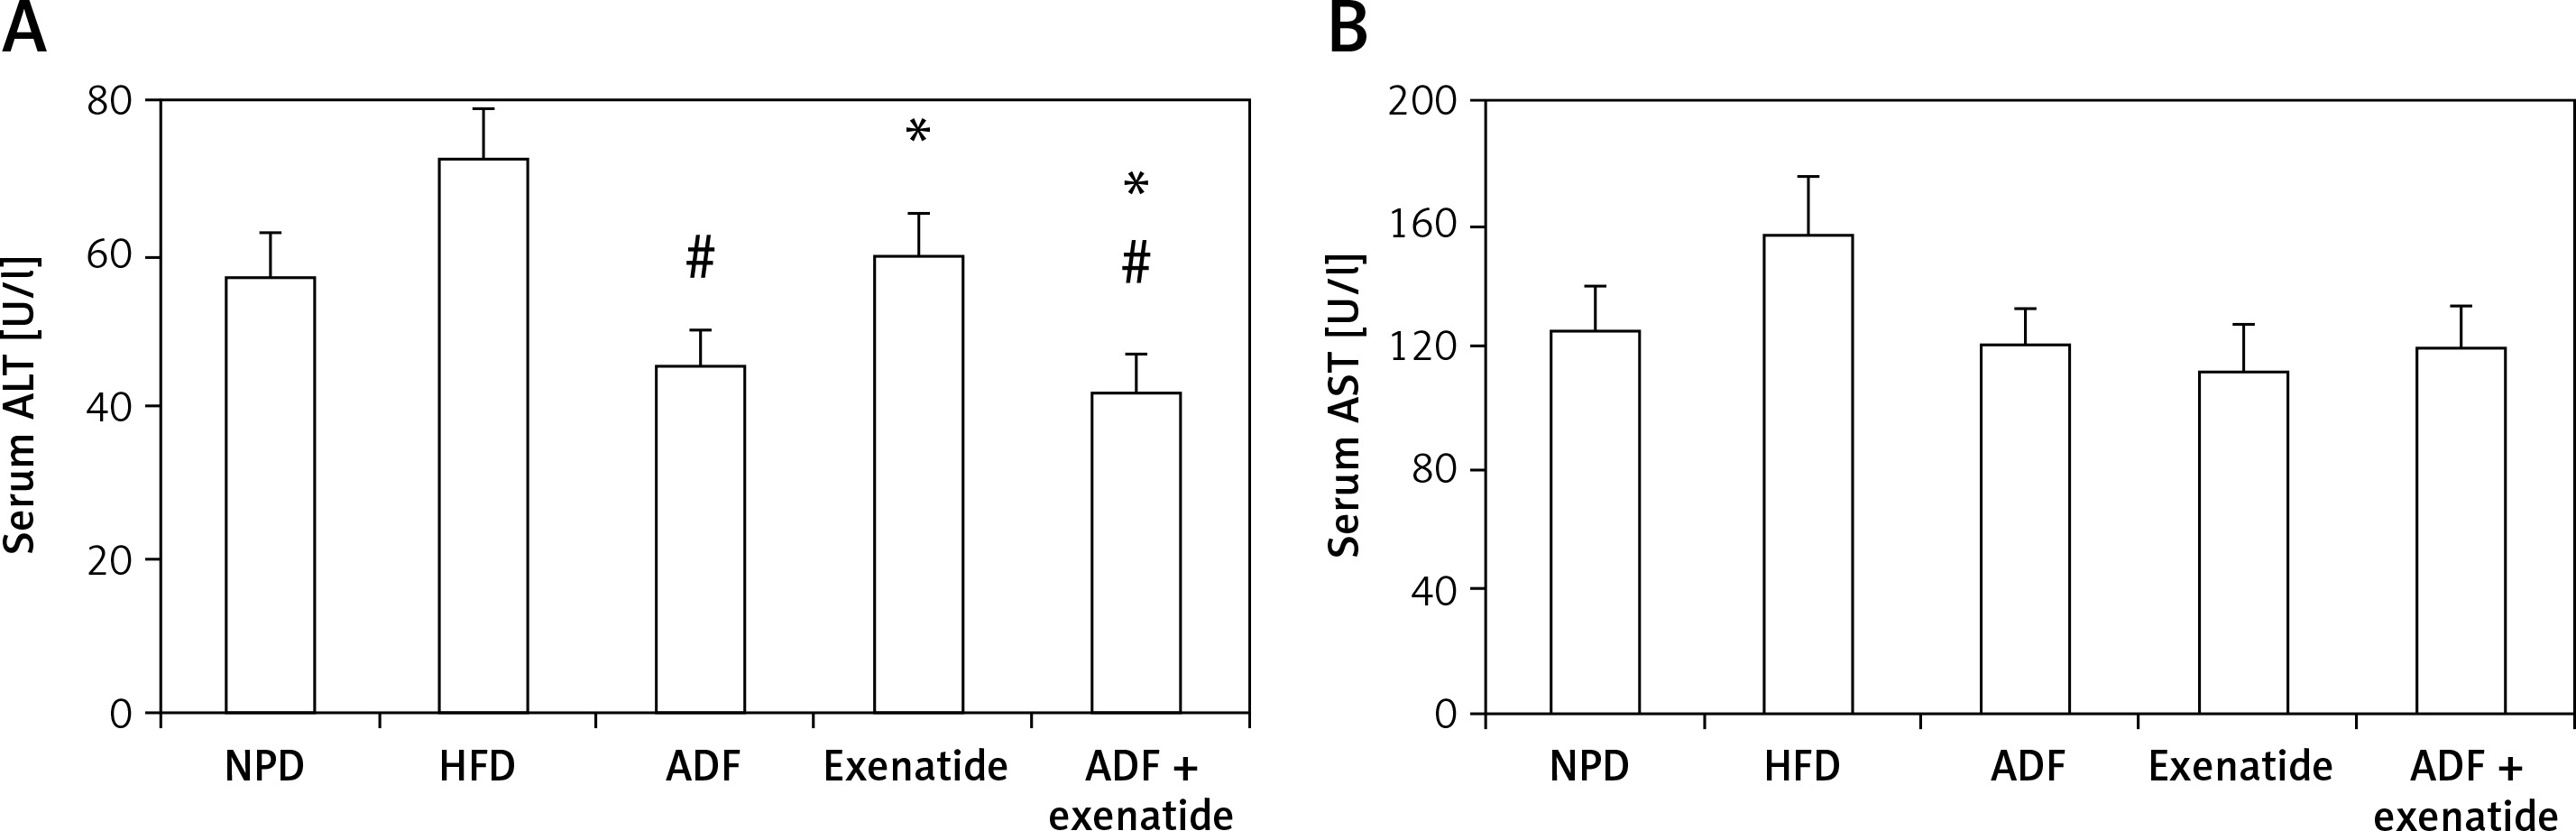
Effect of ADF and/or exenatide on liver enzymes
Figure 8 shows a significant reduction in ALT levels noted in the combined ADF and exenatide group with no improvement noted in the ADF group in comparison to the exenatide treated group (p < 0.05). No statistically significant difference is noted between the studied groups regarding levels of AST.
Figure 8
Effect of ADF and/or exenatide on liver enzymes in HFD- induced obesity in mice. Values are mean ± SD (n = 10), analyzed by one-way ANOVA followed by Tukey’s multiple comparisons test. ¶,*,#p < 0.05; ¶compared with NPD control group, *compared with HFD control group, #compared with exenatide treated group
ALT – alanine transaminase, AST – aspartate transaminase, NPD – normal palatable diet, HFD – high-fat diet, ADF – alternateday high-fat diet.
Effect of ADF and/or exenatide on the hepatic histopathological picture
The histopathological examination (Figure 9) of the hepatic tissues revealed that the control group feeding on NPD as well as the NPD + exenatide groups showed preservation of the normal arrangement of hepatocytes (Figure 9 IA). However, hepatic tissues in HF-fed mice exhibited disturbed architecture (Figure 9 IB), with an increase in the mean histopathological score and percent area (%) in comparison with the NPD group (p < 0.05, Figures 9 II, III).
Figure 9
Effect of ADF and/or exenatide on hepatic histopathology in HFD-induced obesity in mice (I): Photomicrographs of hepatic sections stained with H&E for morphometric analysis. Sections from normal mice (A) showed preserved architecture with lobules formed of hepatocytes (dashed arrow) arranged in plates of one to two cell thickness showing abundant eosinophilic cytoplasm and central nucleus surrounded by blood sinusoids (arrowhead); portal areas (arrow) showed bile ductules and portal vessels. Sections from high diet fed mice (B) showed disturbed architecture with marked cytoplasmic clear vacuolation displacing nucleus (steatosis is more than 66%); there is also ballooning degeneration of some hepatocytes. Additionally, there is scattered lobular inflammatory cell infiltration (arrowhead). Mice’ livers of ADF treated group (C) showed moderate ballooning degeneration and moderate focal steatosis; there is moderate portal inflammation with congested vessels. On the other hand, mice’ livers of exenatide treated group (D) showed few hepatocytes with moderate ballooning degeneration; there is mild lobular focal inflammation with mild portal inflammation with few congested vessels. However, combined ADF and exenatide treated group (E) showed preserved architecture with lobules formed of hepatocytes arranged in thin plates showing abundant eosinophilic cytoplasm with residual focal mild ballooning degeneration and focal residual mild steatosis; there is no lobular inflammation (H & E 400×). II – Effect of ADF and/or exenatide on the histopathological score in HFD-induced obesity in mice. Values are mean ± SD (n = 10), analyzed by one-way ANOVA followed by Tukey’s multiple comparisons test. ¶,*,#p < 0.05; ¶compared with NPD control group, *compared with HFD control group, #compared with exenatide treated group. III – Effect of ADF and/or exenatide on the histopathological percent area (%) in HFD-induced obesity in mice. Values are mean ± SD (n = 10), analyzed by one-way ANOVA followed by Tukey’s multiple comparisons test. ¶,*,#p < 0.05; ¶compared with NPD control group, *compared with HFD control group, #compared with exenatide treated group
NPD – normal palatable diet, HFD – high-fat diet, ADF – alternate-day high-fat diet.
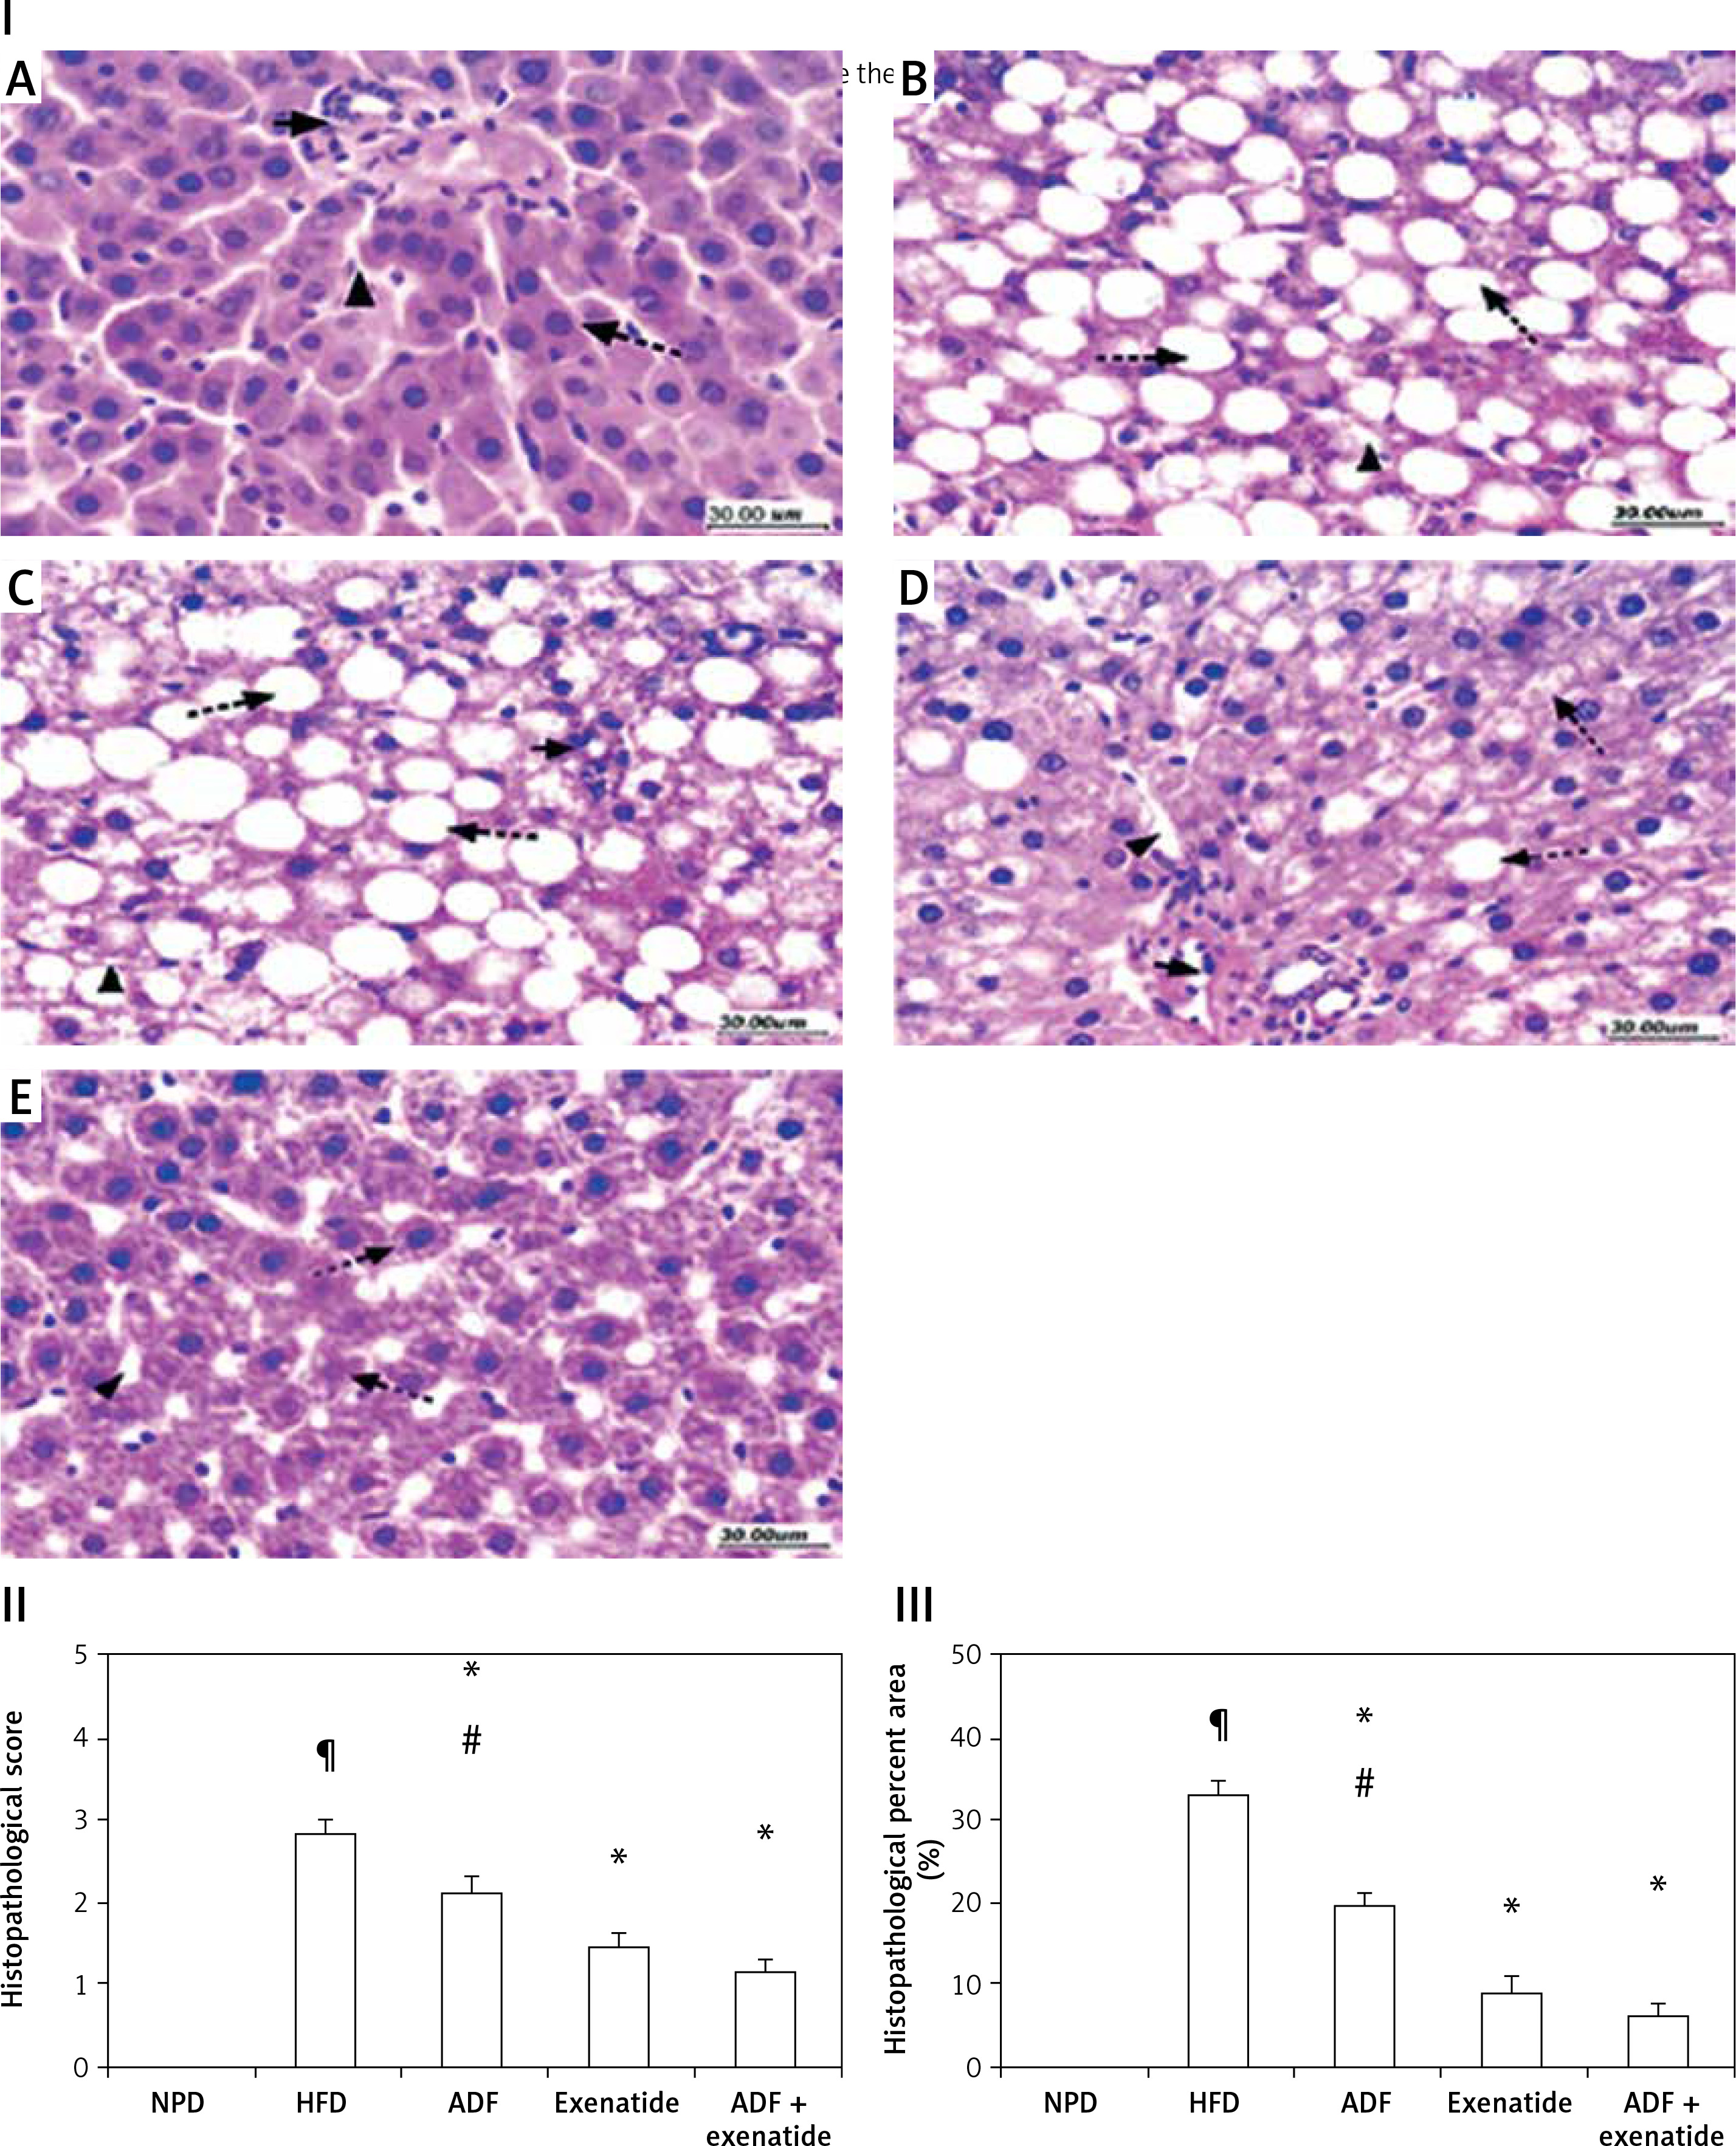
These deleterious effects associated with HFD were ameliorated by the administration of either ADF or exenatide (Figures 9 IC–E) with a reduction in the mean histopathological score in comparison with the HFD control group. However, treatment with combined ADF and exenatide was more beneficial in attenuating the severity of steatosis and improving the histopathological score and percent area compared with the exenatide-treated group (p < 0.05, Figures 9 II, III).
Discussion
ADF and/or exenatide significantly decreased the mice’s body weight, similar to previous studies [27, 28]. Exenatide inhibits gastric motility and induces satiety, thus promoting weight reduction. However, the combined administration of ADF and exenatide revealed significantly lower weight when compared with the solitary administered ADF or exenatide groups. GLP-1 acts by decreasing hepatic free fatty acid uptake and reversing dyslipidemia [29]. Nevertheless, the combined regime did not differ from the solitary intervention of any of them in terms of reducing lipid profile parameters.
In the present study, HFD caused hyperleptinemia and leptin resistance by downregulating the JAK2/STAT3 signaling cascade and induced SOCS3 and PTP1B expression. Similarly, Bian et al. observed that HFD promotes SOCS3 expression and the activation of STAT3 resistance by leptin in proopiomelanocortin neurons in rodents.
The current study demonstrated that the ADF/exenatide augmented the anorexic nervous system leptin-JAK2/STAT3 signaling and inhibited their suppressor SOCS3. In addition, the combined ADF and exenatide treatment was associated with decreased CNS leptin level and receptor expression, improving leptin resistance due to disturbance in the JAK2/STAT3 sensitivity to the self-regulated proteins SOCS3/PTP1B [30]. This could be attributed to the activated JAK2 autophosphorylation and consequently phosphorylation of tyrosine residues on the leptin receptor intracellular domain, allowing STAT proteins to bind with their subsequent nuclear translocation where they act as transcription factors and resulting in regaining of leptin’s anorexigenic effects (suppression of appetite and induction of weight loss). Olofsson et al. reported that shifting from high-fat to low-fat diets decreases SOCS3 expression and ameliorates neuronal leptin resistance.
Regarding insulin sensitivity, it was obvious that treatment with ADF and/or the GLP-1 agonist exenatide ameliorated the elevated FBG and improved insulin levels and HOMA-IR, showing normalization of the insulin resistance picture developed by HFD. The combined ADF and exenatide treatment showed a further improvement in FBG levels. The combined regime did not differ from the solitary intervention of any of them in terms of the effect on the insulin level or HOMA-IR. One plausible explanation is the need for a longer period to normalize these metabolic disturbances.
Moreover, multiple signaling molecules (protein and kinases) are involved in the insulin signaling pathways that promote liver GLUT4 trafficking. One of these pathways is the IRS1/PI3K-mediated insulin signaling pathway, which becomes activated upon binding of insulin to its receptor, triggering translocation of GLUT4 from its storage vesicles to the plasma membrane [11]. The PI3K signaling cascade is strongly associated with insulin resistance incidence [30]. In the current study, hyperleptinemia and hyperinsulinemia abolished Glut4 translocation through downregulation of the IRS1/PI3K/GLUT4 signaling pathway as shown in the HFD mouse group. In addition, elevated levels of the inhibitors SOCS3 and PTP1B could aggravate insulin resistance by suppressing the expression of IRS-1 (the main substrate in the insulin signaling pathway representing the main crosstalk point between insulin and leptin signaling pathways).
ADF combined with exenatide in the current study upregulates IRS1/PI3K/GLUT4 expression; this could improve the insulin receptor sensitivity, which could also be attributed to the suppressive effect exerted by the combined treatment on SOCS3 and PTP1B expression.
In agreement with the present study, Kim et al. (2014) observed a decrease in the hepatic GLUT4 expression in knock-out ob/ob mice, and the GLUT4 expression was increased by exenatide treatment [31]. Previous studies showed that exenatide exerts its antidiabetic effect mainly through the augmentation of insulin-dependent glucose uptake through GLUT4 translocation on the plasma membrane [11, 32]. Exenatide, via its insulin-dependent effect, can correct the worsened HFD diabetogenic impact on GLUT4 expression in liver cells [33].
Regarding its effect on liver steatosis, GLP-1 analogs ameliorate hyperlipidemia and liver steatosis and delay its progression to steatohepatitis [31], as observed in the current study, which can be linked to the effect exerted by the GLP-1 agonist exenatide on the overexpression of the leptin receptor signaling cascade and the improved leptin sensitivity. Hackl et al. (2019) demonstrated that brain leptin protects against hepatic steatosis by minimizing de novo lipogenesis beside the induction of triglyceride export through signaling in the dorsal vagal complex, where the efferent vagal motor neurons are located [34].
Consistently, the current study revealed the largest reduction in the HFD-induced expression of PDK3 associated with the combined ADF-exenatide treatment. PDK3 is one of the adipogenicity markers acting as a part of the pyruvate dehydrogenase complex (PDC), representing the central linker between glucose and lipid metabolism since the accumulation of fat droplets in the hepatocytes is the cornerstone in the pathogenesis of liver steatosis; it was concluded that deficiency of PDK3 improved liver steatosis [35]. Furthermore, this PDK3 downregulation was associated with amelioration of expression of NAFLD2, one of the most recently described fatty liver disease associated genes, reversing the distorted hepatic histopathological picture seen in the HFD group with the degree of steatosis.
In conclusion, the current study demonstrated the beneficial effects of ADF combined with a GLP-1 agonist (exenatide) on the brain and liver. Centrally, ADF/exenatide reversed leptin resistance and its associated genes, including the JAK2/STAT3 signaling pathway, and attenuated the inhibitors SOCS3 and PTP1B, which consequently improved the insulin resistance-related genes, including liver IRS-1/PI3K/GLUT4, and boosted liver lipid export and improved hepatic steatosis via receptors expressed in the CNS. Therefore, high fat-diet induced obesity with leptin and insulin resistance and liver steatosis is manageable by ADF and the GLP-1 agonist exenatide.