Introduction
The World Health Organization officially declared coronavirus disease 2019 (COVID-19) a pandemic in March 2020. COVID-19, caused by severe acute respiratory syndrome-coronavirus-2 (SARS-CoV-2) infection, has an alarmingly high infection rate [1]. There are several tests to detect SARS-CoV-2, classified as molecular and serological tests. The RT-PCR method is the referral test for COVID-19, but it takes a long time to obtain the result [2]. A rapid diagnostic test (RDT) is the fastest alternative that detects either SARS-CoV-2 antigens or IgG/IgM antibodies [3]. Most antibody-based RDTs use blood (peripheral/serum) as a sample, which is faster and easier to obtain than the antigen-based RDTs. They are also preferred because other methods such as ELISA and CLIA require laboratory facilities.
RDTs for COVID-19 are still in development, and their reported diagnostic accuracy varies, possibly because of the differences of the manufacturers [4]. Despite that, however, antibody-based RDTs are popular and used worldwide, while antigen-based RDTs have been rarely used [5–10]. Limited resources, a high infection rate, and a high population compelled their use over other test methods. However, some publications have doubts about their diagnostic accuracy [8, 11–13]. RDTs are not recommended for patient care but as a screening tool for suspects [14, 15]. SARS-CoV-2 antibody detection can provide fast results to complement the time-consuming RT-PCR test [16, 17]. Still, RDTs need further research to ascertain their performance and accuracy.
Therefore, this systematic review aims to determine the diagnostic accuracy of antibody-based RDTs in detecting COVID-19.
Material and methods
Search strategy
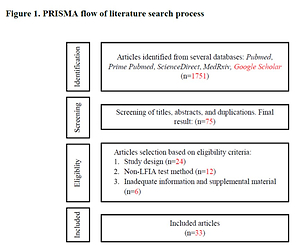
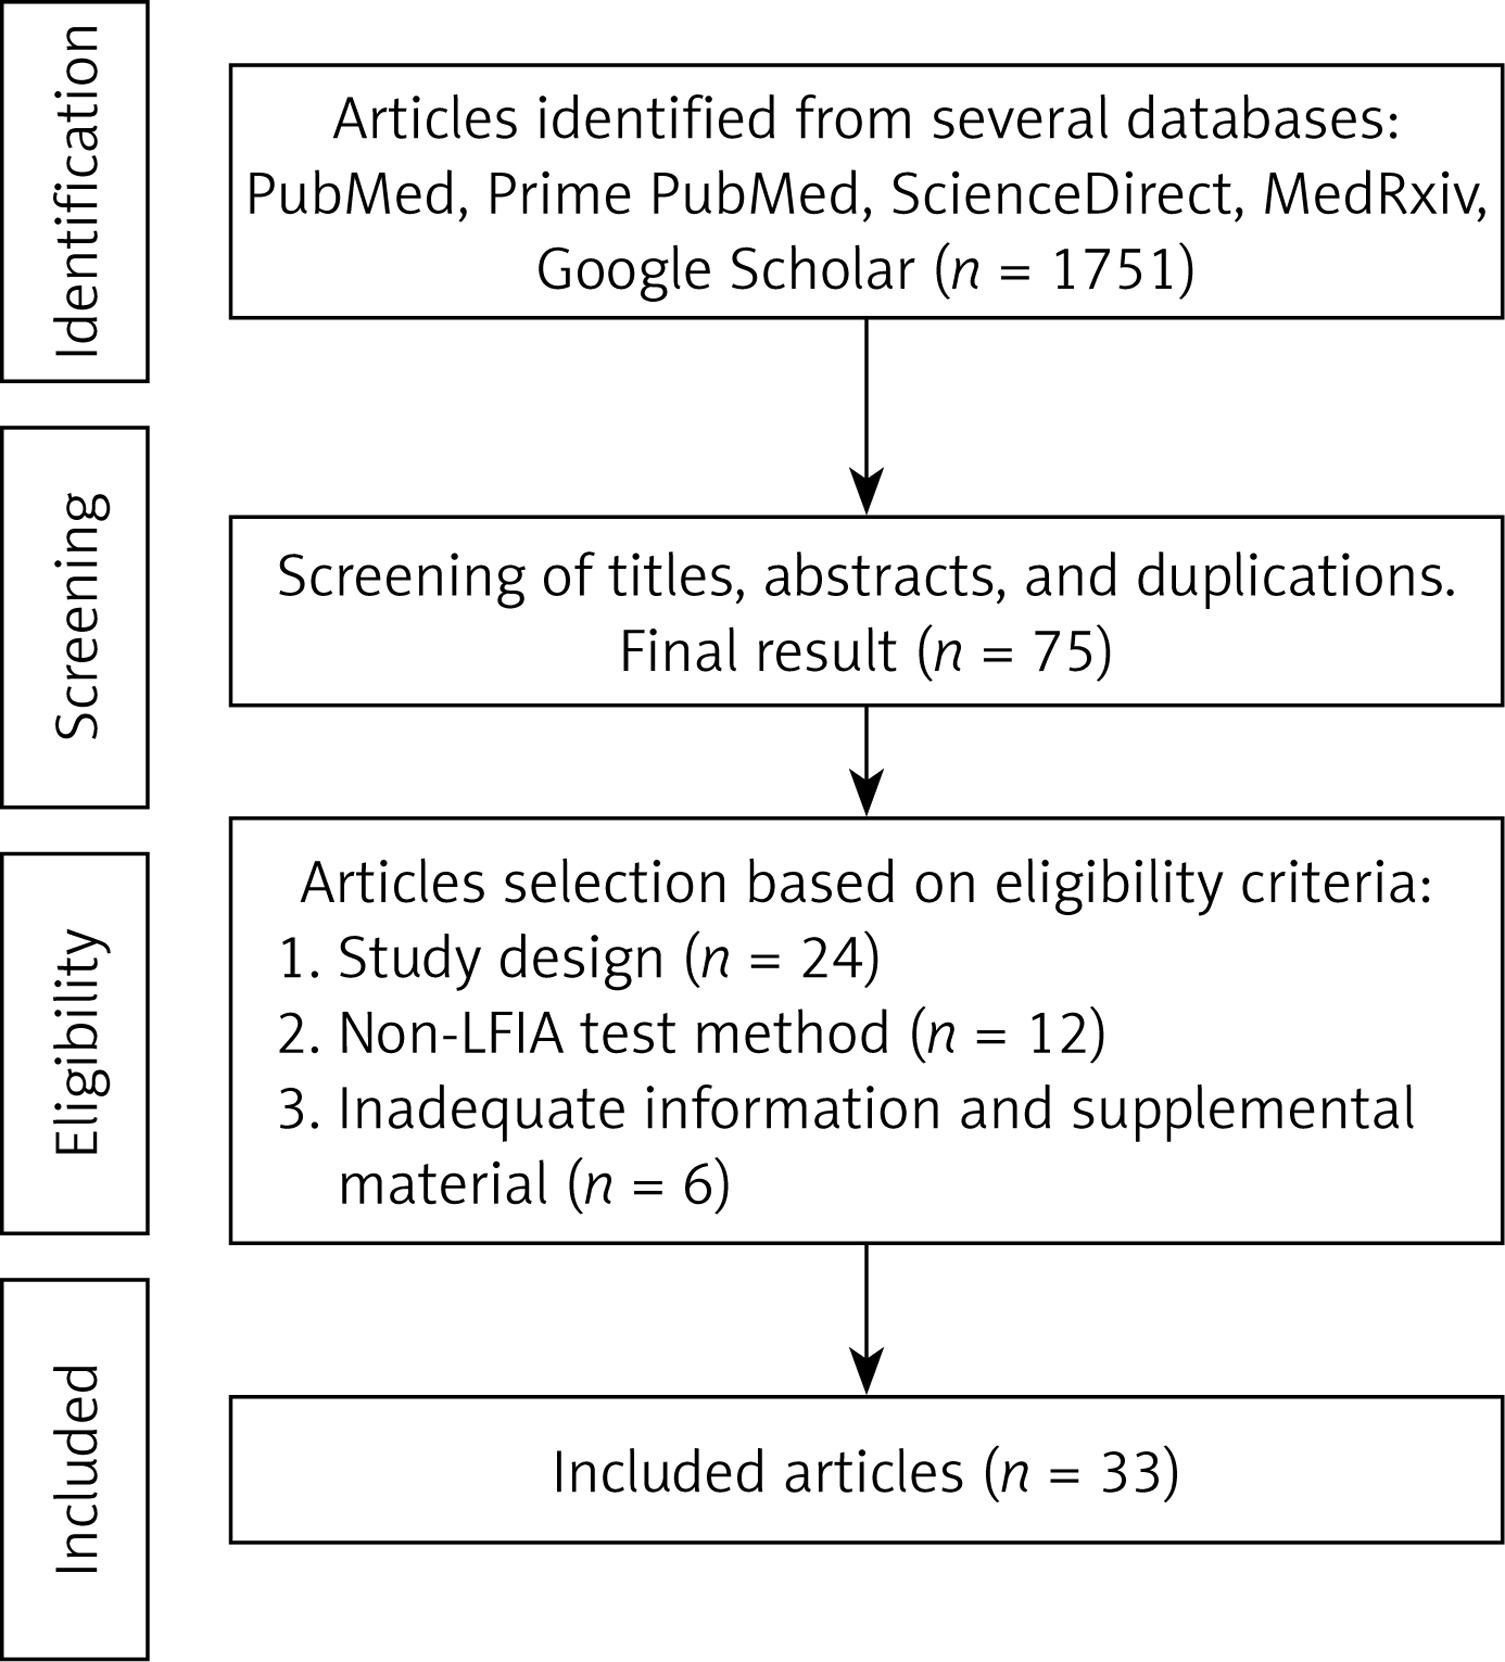
We conducted a literature search in five different databases, including one preprint source – PubMed, Prime PubMed, Science Direct, MedRxiv, and Google Scholar – according to the PRISMA-P 2015 method. We included all studies published up to February 2021. Preprints were updated as soon as they were published. The search strategy included two combinations: “COVID-19 OR SARS-CoV-2” AND “rapid diagnostic test OR rapid test” AND “diagnostic accuracy” and “COVID-19 OR SARS-CoV-2” AND “rapid diagnostic test OR rapid test” AND “sensitivity” AND “specificity”. Several articles were also obtained from the references of included studies.
Eligibility criteria
All articles were screened by titles and abstracts. Relevant articles were read in full and screened for duplications. We included all studies that report the diagnostic accuracy of antibody-based RDTs using the lateral flow immunoassay (LFIA) method, which involves the sensitivity, specificity, PPV, and NPV. We excluded reviews, case reports, editorials, articles not in English, and articles that lacked adequate test population data. We assessed the risk of bias with the Joanna Briggs Institute Critical Appraisal Checklist for Diagnostic Test Accuracy Studies. All potential articles (n = 33) met our eligibility criteria. The search process can be seen in Figure 1.
Data extraction and analysis
The risk of bias was evaluated using the Joanna Briggs Institute (JBI) Critical Appraisal Checklist for Diagnostic Test Accuracy Studies. Two reviewers (TJG, RH) performed an independent assessment of included articles. Conflicts were resolved through consensus, and unresolved ones were decided by the third reviewer (YST). Data regarding peer-review status, study design, test kit information, immunoglobulin class, target antigen, and the number of samples were extracted and tabulated. We estimated the pooled sensitivity, specificity, positive predictive value (PPV), and negative predictive value (NPV) with a 95% confidence interval.
Results
Data extraction
We found 1,751 articles from the literature search and only 33 met the eligibility criteria. Eight of the 33 articles were preprints. Out of thirty-three, 16 were cohort or cross-sectional studies, while the remaining 17 were case controls. Twenty-four used commercially registered RDT kits. Twenty studies used the single IgM detection method, 21 used single IgG detection, 19 used combined IgM or IgG detection, and 15 used a combined IgM and IgG method. Three studies used RDTs that targeted spike protein, two targeted nucleocapsid protein, 7 targeted both proteins, and 21 did not disclose the target antigen (Table I).
Table I
Data extraction
Data synthesis
We evaluated single IgM and IgG detection, combined IgM or IgG detection, and combined IgM and IgG detection. In single detection, samples are positive if the kit detects the corresponding antibody. In combined IgM or IgG detection, samples are positive if at least one of either immunoglobulin is detected, while in combined IgM and IgG detection both immunoglobulins need to be detected.
Among 33 studies, the highest sensitivity for the single IgM detection was 88.75% (79.72–94.72%), the single IgG detection 100% (90.00–100%), the combined IgM or IgG 100% (90.00–100%) and the combined IgM and IgG 98.57% (92.30–99.96%) [18–20]. The combined IgM or IgG detection had the highest pooled sensitivity (73.41% (72.22–74.57%)), while the single IgM detection had the lowest (61.80% (60.79–62.80%)) (Table II) [21–38].
Table II
Pooled sensitivity
| Studiesref. | Sensitivity (95% CI) | |||
|---|---|---|---|---|
| IgM | IgG | IgM or IgG | IgM and IgG | |
| Bisoffi et al.21 | 35.88 (30.78–41.23) | 33.53 (28.53–38.82) | ||
| Andrey et al.22 | 63.41 (65.19–74.55) | 90.24 (85.83–93.65) | ||
| Nicol et al.12 | 81.56 (74.16–87.59) | 78.01 (70.27–84.55) | 81.56 (74.16–87.59) | |
| Pérez-García et al.13 | 28.89 (19.82–39.40) | 60.00 (49.13–70.19) | 64.44 (53.65–74.26) | |
| Elslande et al.8 | 54.06 (51.02–57.08) | 64.99 (62.04–67.85) | 70.49 (67.66–73.21) | 48.55 (45.53–51.60) |
| Serre-Miranda et al.23 | 67.29 (63.32–71.09) | 68.15 (64.20–71.91) | 73.66 (69.51–77.53) | 74.39 (67.00–80.88) |
| Pan et al.6 | 55.81 (44.70–66.52) | 54.65 (43.55–65.42) | 68.60 (57.70–78.19) | |
| Whitman et al.9 | 61.81 (58.89–64.67) | 58.86 (55.91–61.76) | 67.23 (64.54–69.84) | |
| Xiang et al.24 | 57.14 (46.34–67.47) | 81.32 (71.78–88.72) | 82.42 (73.02–89.60) | |
| Haymond et al.10 | 50.00 (36.08–63.92) | 79.63 (66.47–89.37) | ||
| Candel González et al.19 | 74.29 (56.74–87.51) | 100 (90.00–100) | 100 (90.00–100) | 74.29 (56.74–87.51) |
| Li et al.25 | 82.62 (78.53–86.22) | 70.53 (65.78–74.97) | 88.66 (85.13–91.61) | 64.48 (59.56–69.19) |
| Hoffman et al.26 | 68.97 (49.17–84.72) | 93.10 (77.23–99.15) | ||
| Montesinos et al.27 | 61.98 (56.92–66.86) | 61.72 (56.65–66.60) | 70.57 (65.74–75.09) | |
| Wu et al.28 | 44.44 (38.71–50.30) | 67.34 (61.68–72.65) | 73.48 (68.85–77.77) | |
| Lou et al.18 | 88.75 (79.72–94.72) | 86.25 (76.73–92.93) | 97.50 (91.26–99.70) | |
| Almeida et al.20 | 85.24 (79.71–89.74) | 84.29 (78.65–88.93) | 96.19 (92.63–98.34) | 98.57 (92.30–99.96) |
| Dortet et al.29 | 52.34 (46.03–58.60) | 48.83 (42.55–55.13) | 52.34 (46.03–58.60) | |
| Vauloup-Fellous et al.30 | 63.94 (62.19–65.66) | 64.25 (62.52–65.95) | 73.56 (72.10–74.98) | |
| Garrod et al.17 | 73.78 (69.45–77.78) | 86.22 (82.69–89.27) | 95 (92.21–97.01) | |
| Maya et al.15 | 92 (73.97–99.02) | |||
| Adams et al.31 | 61.17 (55.48–66.63) | |||
| Pellanda et al.5 | 77.11 (66.58–85.62) | |||
| Choe et al.32 | 92.86 (84.11–97.64) | 65.71 (53.40–76.65) | ||
| Shen et al.7 | 71.13 (61.05–79.89) | |||
| Vidal-Anzardo et al.33 | 43.75 (19.75–70.12) | |||
| Sisay et al.34 | 72.94 (67.05–78.29) | |||
| Chan et al.11 | 90.91 (83.44–95.76) | |||
| Kızıloglu et al.35 | 57.75 (45.44–69.39) | |||
| Ying et al.3 | 85.56 (76.57–92.08) | |||
| Dellière et al.36 | 93.40 (86.87–97.30) | |||
| Carozzi et al.37 | 98.30 (95.10–99.65) | |||
| Pallett et al.38 | 90.81 (86.73–93.96) | |||
| Total | 61.80 (60.79–62.80) | 65.69 (64.70–66.66) | 73.41 (72.22–74.57) | 71.51 (70.43–72.58) |
Twenty-one studies reported a specificity value of 100%. The single IgG detection had the highest pooled specificity (96.68% (96.25–97.07%)), while the combined IgM and IgG detection had the lowest (94.14% (93.47–94.76%)) (Table III).
Table III
Pooled specificity
| Studies | Specificity (95% CI) | |||
|---|---|---|---|---|
| IgM | IgG | IgM or IgG | IgM and IgG | |
| Bisoffi et al.21 | 90.13 (88.16–91.88) | 94.54 (92.98–95.84) | ||
| Andrey et al.22 | 98.67 (95.69–98.78) | 98.00 (95.70–99.26) | ||
| Nicol et al.12 | 95.39 (90.74–98.13) | 98.03 (94.34–99.59) | 95.39 (90.74–98.13) | |
| Pérez-García et al.13 | 100 (96.38–100) | 100 (96.38–100) | 100 (96.38–100) | |
| Elslande et al.8 | 95.01 (93.15–96.48) | 96.53 (94.92–97.74) | 92.51 (90.34–94.32) | 99.03 (97.90–99.64) |
| Serre-Miranda et al.23 | 96.46 (92.85–98.57) | 96.97 (93.52–98.88) | 94.51 (89.84–97.46) | 96.67 (88.47–99.59) |
| Pan et al.6 | 63.64 (40.66–82.80) | 40.91 (20.71–63.65) | 36.36 (17.20–59.34) | |
| Whitman et al.9 | 94.14 (92.46–95.55) | 97.59 (96.41–98.47) | 94.16 (92.58–95.50) | |
| Xiang et al.24 | 100 (90.00–100) | 100 (90.00–100) | 100 (90.00–100) | |
| Haymond et al.10 | 92.86 (66.13–99.82) | 64.29 (35.14–87.24) | ||
| Candel González et al.19 | 100 (47.82–100) | 100 (47.82–100) | 100 (47.82–100) | 100 (47.82–100) |
| Li et al.25 | 91.41 (47.82–100) | 98.44 (94.47–99.81) | 90.63 (84.20–95.06) | 99.22 (95.72–99.98) |
| Hoffman et al.26 | 100 (97.07–100) | 99.19 (95.59–99.98) | ||
| Montesinos et al.27 | 98.61 (95.99–99.71) | 98.61 (95.99–99.71) | 98.61 (95.99–99.71) | |
| Wu et al.28 | 100 (97.90–100) | 100 (97.90–100) | 100 (98.42–100) | |
| Lou et al.18 | 98.09 (95.17–99.48) | 99.52 (97.36–99.99) | 95.22 (91.38–97.68) | |
| Almeida et al.20 | 88.44 (82.13–93.12) | 95.92 (91.33–98.49) | 85.03 (75.72–85.41) | 100 (92.75–100) |
| Dortet et al.29 | 100 (92.89–100) | 100 (92.89–100) | 100 (92.89–100) | |
| Vauloup-Fellous et al.30 | 95.01 (94.06–95.85) | 96.19 (95.34–96.92) | 94.04 (93.09–94.89) | |
| Garrod et al.17 | 96.80 (94.86–98.16) | 98.40 (96.87–99.31) | 96 (93.59–97.70) | |
| Maya et al.15 | 100 (86.28–100) | |||
| Adams et al.31 | 97.86 (96.43–98.82) | |||
| Pellanda et al.5 | 98.00 (92.96–99.76) | |||
| Choe et al.32 | 96.20 (89.30–99.21) | 100 (95.44–100) | ||
| Shen et al.7 | 96.23 (87.02–99.54) | |||
| Vidal-Anzardo et al.33 | 89.91 (85.12–93.57) | |||
| Sisay et al.34 | 95.36 (92.58–97.33) | |||
| Chan et al.11 | 98.21 (90.45–99.95) | |||
| Kızıloglu et al.35 | 85.45 (77.46–91.45) | |||
| Ying et al.3 | 91.01 (83.05–96.04) | |||
| Dellière et al.36 | 100 (91.59–100) | |||
| Carozzi et al.37 | 85.25 (82.13–88.02) | |||
| Pallett et al.38 | 96.50 (92.92–98.58) | |||
| Total | 94.82 (94.30–95.31) | 96.68 (96.25–97.07) | 94.63 (93.95–95.26) | 94.14 (93.47–94.76) |
Twenty-one studies reported a PPV value of 100%. Among the four detection methods, single IgG detection had the highest pooled PPV (95.97% (95.47–96.42%)), while the single IgM detection had the lowest (93.45% (92.83–94.03%)) (Table IV).
Table IV
Pooled PPV
| Studies | Positive predictive value (PPV) (95% CI) | |||
|---|---|---|---|---|
| IgM | IgG | IgM or IgG | IgM and IgG | |
| Bisoffi et al.21 | 54.22 (48.43–59.90) | 66.67 (59.86–72.84) | ||
| Andrey et al.22 | 97.50 (93.19–97.79) | 97.37 (94.36–98.79) | ||
| Nicol et al.12 | 94.26 (88.81–97.14) | 97.35 (92.26–99.12) | 94.26 (88.81–97.14) | |
| Pérez-García et al.13 | 100 (87.10–100) | 100 (93.40–100) | 100 (93.80–100) | |
| Elslande et al.8 | 94.15 (92.09–95.69) | 96.53 (94.97–97.62) | 93.33 (91.52–94.77) | 98.67 (97.26–99.36) |
| Serre-Miranda et al.23 | 98.25 (96.44–99.15) | 98.51 (96.79–99.32) | 97.55 (95.46–98.69) | 98.39 (93.96–99.58) |
| Pan et al.6 | 85.71 (76.99–91.50) | 78.33 (70.84–84.33) | 80.82 (74.87–85.63) | |
| Whitman et al.9 | 92.50 (90.50–94.11) | 96.62 (95.01–97.73) | 93.09 (91.34–94.51) | |
| Xiang et al.24 | 100 (93.10–100) | 100 (95.10–100) | 100 (95.10–100) | |
| Haymond et al.10 | 96.43 (80.03–99.45) | 89.58 (80.79–94.62) | ||
| Candel González et al.19 | 100 (87.10–100) | 100 (90.10–100) | 100 (90.10–100) | 100 (87.10–100) |
| Li et al.25 | 96.76 (94.42–98.13) | 99.29 (97.25–99.82) | 96.70 (94.47–98.05) | 99.61 (97.32–99.94) |
| Hoffman et al.26 | 100 (83.90–100) | 96.43 (79.27–99.48) | ||
| Montesinos et al.27 | 98.76 (96.26–99.59) | 98.75 (96.24–99.59) | 98.91 (96.70–99.64) | |
| Wu et al.28 | 100 (97.20–100) | 100 (98.10–100) | 100 (98.70–100) | |
| Lou et al.18 | 94.67 (87.02–97.92) | 98.57 (90.69–99.80) | 88.64 (80.97–93.46) | |
| Almeida et al.20 | 91.33 (87.03–94.29) | 96.72 (93.08–98.48) | 90.18 (86.19–93.11) | 100 (94.70–100) |
| Dortet et al.29 | 100 (97.20–100) | 100 (97–100) | 100 (97.20–100) | |
| Vauloup-Fellous et al.30 | 94.16 (93.11–95.06) | 95.58 (94.64–96.36) | 94.24 (93.37–95) | |
| Garrod et al.17 | 95.40 (92.74–97.12) | 97.98 (96.06–98.97) | 95.53 (92.97–97.19) | |
| Maya et al.15 | 100 (85.70–100) | |||
| Adams et al.31 | 93.10 (88.86–95.81) | |||
| Pellanda et al.5 | 96.97 (88.98–99.22) | |||
| Choe et al.32 | 95.59 (87.70–98.50) | 100 (92.30–100) | ||
| Shen et al.7 | 97.18 (89.80–99.27) | |||
| Vidal-Anzardo et al.33 | 24.14 (13.85–38.63) | |||
| Sisay et al.34 | 92.08 (87.75–94.97) | |||
| Chan et al.11 | 98.90 (92.80–99.84) | |||
| Kızıloglu et al.35 | 71.93 (60.97–80.78) | |||
| Ying et al.3 | 90.59 (83.17–94.94) | |||
| Dellière et al.36 | 100 (96.30–100) | |||
| Carozzi et al.37 | 66.54 (62.07–70.73) | |||
| Pallett et al.38 | 97.24 (94.45–98.65) | |||
| Total | 93.45 (92.83–94.03) | 95.97 (95.47–96.42) | 94.09 (93.39–94.73) | 94.15 (93.52–94.73) |
Combined IgM or IgG detection had the highest pooled NPV (75.34% (74.51–76.16%)), while single IgM detection had the lowest (67.48% (66.90–68.07%)) (Table V).
Table V
Pooled NPV
| Studies | Negative predictive value (NPV) (95% CI) | |||
|---|---|---|---|---|
| IgM | IgG | IgM or IgG | IgM dan IgG | |
| Bisoffi et al.21 | 81.19 (79.91–82.41) | 81.37 (80.17–82.51) | ||
| Andrey et al.22 | 76.68 (76.54–81.58) | 92.45 (89.33–94.71) | ||
| Nicol et al.12 | 84.80 (79.73–88.77) | 82.78 (77.87–86.78) | 84.80 (79.73–88.77) | |
| Pérez-García et al.13 | 60.98 (57.80–64.06) | 73.53 (68.32–78.15) | 75.76 (70.29–80.50) | |
| Elslande et al.8 | 58.20 (56.56–59.82) | 64.99 (63.08–66.84) | 67.85 (65.75–69.89) | 56.44 (54.50–57.88) |
| Serre-Miranda et al.23 | 50.00 (47.02–52.98) | 50.79 (47.77–53.82) | 54.77 (50.95–58.53) | 58.00 (51.44–64.29) |
| Pan et al.6 | 26.92 (19.88–35.36) | 18.75 (11.72–28.64) | 22.86 (13.57–35.86) | |
| Whitman et al.9 | 67.82 (66.14–69.46) | 66.98 (65.39–68.52) | 71.07 (69.38–72.71) | |
| Xiang et al.24 | 47.30 (41.45–53.22) | 67.31 (57.28–75.97) | 68.63 (58.37–77.34) | |
| Haymond et al.10 | 32.50 (26.22–39.48) | 45.00 (29.80–61.19) | ||
| Candel González et al.19 | 35.71 (24.03–49.38) | 100 (56.60–100) | 100 (56.60–100) | 35.71 (24.03–49.38) |
| Li et al.25 | 62.90 (57.62–67.90) | 51.85 (48.01–55.67) | 72.05 (66.07–77.34) | 47.39 (44.08–50.72) |
| Hoffman et al.26 | 93.23 (88.90–95.95) | 98.40 (94.17–99.57) | ||
| Montesinos et al.27 | 59.33 (56.19–62.40) | 59.17 (56.04–62.22) | 65.34 (61.73–68.77) | |
| Wu et al.28 | 51.33 (48.78–53.86) | 64.21 (60.37–67.87) | 68.84 (65.22–72.25) | |
| Lou et al.18 | 95.79 (92.48–97.68) | 94.98 (91.61–97.04) | 99.00 (96.20–99.74) | |
| Almeida et al.20 | 80.75 (75.09–85.37) | 81.03 (75.75–85.41) | 93.98 (88.75–96.87) | 98 (87.50–99.71) |
| Dortet et al.29 | 29.07 (26.50–31.79) | 27.62 (25.30–30.08) | 29.07 (26.50–31.79) | |
| Vauloup-Fellous et al.30 | 67.67 (66.60–68.72) | 67.70 (66.64–68.74) | 72.85 (71.76–73.92) | |
| Garrod et al.17 | 80.40 (77.83–82.74) | 88.81 (86.29–90.91) | 95.52 (93.15–97.10) | |
| Maya et al.15 | 92.59 (76.79–97.93) | |||
| Adams et al.31 | 84.19 (82.23–85.97) | |||
| Pellanda et al.5 | 83.76 (77.64–88.46) | |||
| Choe et al.32 | 93.83 (86.71–97.25) | 76.70 (70.41–81.99) | ||
| Shen et al.7 | 64.56 (57.02–71.43) | |||
| Vidal-Anzardo et al.33 | 95.61 (93.38–97.11) | |||
| Sisay et al.34 | 82.66 (79.56–85.38) | |||
| Chan et al.11 | 85.94 (76.61–91.94) | |||
| Kızıloglu et al.35 | 75.81 (70.25–80.61) | |||
| Ying et al.3 | 86.17 (78.96–91.19) | |||
| Dellière et al.36 | 85.71 (74.57–92.47) | |||
| Carozzi et al.37 | 99.41 (98.20–99.81) | |||
| Pallett et al.38 | 88.53 (84.15–91.82) | |||
| Total | 67.48 (66.90–68.07) | 70.08 (69.47–70.67) | 75.34 (74.51–76.16) | 71.46 (70.68–72.23) |
Discussion
Diagnostic tests are tools to determine the presence or absence of diseases in subjects, and their accuracy needs to be validated [39]. The sensitivity indicates the proportion of individuals who have the target disease and tested positive among the sick population. Specificity indicates the proportion of individuals who do not have the target disease and tested negative among those without the disease. PPV is the proportion of ill patients with a positive test result, while NPV is the proportion of healthy patients with a negative test result [40].
The single IgM detection method had the lowest pooled sensitivity (61.80% (60.79–62.80%)). Low SARS-CoV-2 antibody concentration below the detection threshold may cause false-negative results that influence the sensitivity, but there is no established threshold yet [25]. Different immune responses between individuals might play a role since the kinetics of antibody production during SARS-CoV-2 infection is still unexplained [23, 32].
The sensitivity of RDT was only 11.1% for IgM and 3.6% for IgG in the first 7 days, peaked at day 14, and decreased to 30% on day 22 [6, 13]. IgG could be detected in the blood of COVID-19 patients starting from the eighth day after infection. IgM is detected 3–6 days after infection. Consequently, a patient tested too soon or when the IgM level has declined will produce a false-negative result [25, 41]. A decrease in viral load to undetectable levels due to antiviral therapy may diminish the antibody response. The quality of kits varies due to differences in manufacturers that probably produce a false-negative result may increase the probability of spreading the infection [3, 6].
The single IgG detection method had the highest pooled specificity (96.68% (96.25–97.07%)). The prolonged circulation of IgG enables its detection over a more extensive period [42]. False-positive results could indicate a history of other coronavirus infections or completely different viruses such as flu, syphilis, herpes, metapneumovirus, and dengue [31, 43]. High specificity is crucial since healthy individuals who tested false-positive can be infected if quarantined together with a COVID-19 patient. Overdiagnosis leads to unnecessary quarantine and hospitalization [31].
The reliability of RDT depends on the disease prevalence, which can change over time and in different population groups [44]. RDTs are less reliable if we do not pay attention to the predictive values. The predictive values must be taken into account because they affect the overall test results (the groups with and without the disease) [39]. High PPV indicates that a positively tested individual has SARS-CoV-2 antibodies, while high NPV means that negatively tested individuals do not have the antibodies [45]. This systematic review had a PPV of 93.45–95.97%, so positively-tested individuals should have a high probability of having SARS-CoV-2 antibodies. In contrast, the NPV ranges from 67.48 to 75.34%, so individuals with a negative result do not necessarily have SARS-CoV-2 antibodies. Considering the various limitations, RDTs can still be used, albeit with a careful interpretation.
In consideration of its ease of use and rapid testing, an antibody-based RDT has utility as a point of care test (POCT), a screening tool for specific situations or populations (e.g., travelers), and triage of outpatients with a fever of unclear etiology [7, 14]. A serological test does not determine a person’s health status but it assists in determining the proportion of the population with a SARS-CoV-2 infection history (serological surveillance) [37]. The advantages of antibody-based RDTs are their simple uses and affordable prices compared to antigen-based RDTs and RT-PCR.
The diagnostic accuracy of an antibody-based RDT is not satisfactory as a primary diagnostic test, especially in the early stages of infection. The sensitivity of RDT is < 90%, in consideration of the time to test and the individual immune response. The test has higher sensitivity using the combined IgM or IgG detection method. In contrast, the RDT has a higher specificity using the single IgG detection method, provided that the test is carried out at least 7 days after the onset of symptoms. Also, the test may be interpreted more accurately in combination with other tests such as radiology and doctor assessment.
This systematic review evaluates PPV and NPV, which are not always available in various diagnostic accuracy studies, compares diagnostic test parameters from different study populations, and includes preprint articles updated as soon as they were published. There are several limitations, such as the fact that we excluded studies that lacked data and complete supplemental material. Research on the diagnostic accuracy of LFIA RDTs was rare and modest compared to other methods. Also, these studies do not use strict settings due to the pandemic situations.
In conclusion, this systematic review indicates the antibody-based RDTs had moderate accuracy. Combined IgM or IgG detection had the highest pooled sensitivity (73.41% (95% CI: 72.22–74.57%)) and NPV (75.34% (95% CI: 74.51–76.16%)). Single IgG detection had the highest pooled specificity (96.68% (95% CI: 96.25–97.07%)) and PPV (95.97% (95% CI: 95.47–96.42%)). The benefits of antibody-based RDTs are their utility as POCT, a screening tool in outpatient triage for a rapid result, and to assist with serological surveillance. The results of the RDTs are quite reliable, provided that the test is carried out at least 7 days after the onset of symptoms. Antibody-based RDTs are easier to use and more affordable than antigen-based RDTs and RT-PCR. If the accuracy can be improved, RDTs might become an accurate and accessible diagnostic tool during the COVID-19 pandemic.
Recommendation
Based on their diagnostic accuracy, antibody-based RDTs should be limited to specific situations that require massive or rapid testing instead of being a primary diagnostic tool. Antibody-based RDTs may be interpreted more accurately in combination with other tests such as radiology and doctor assessment. The time to conduct the test should take into consideration the antibody production time, as doing the test too soon or while the antibody level had declined will only yield a false-negative result.