Introduction
Gestational diabetes mellitus (GDM), which is defined as diabetes diagnosed in the second or third trimester of pregnancy that was not clearly overt diabetes prior to gestation according to the American Diabetes Association (ADA) [1], can cause a series of diseases including metabolic disorders, fetal malformation, polyhydramnios, spontaneous abortion, fetal distress, stillbirth, ketoacidosis, neonatal hypoglycemia, hypocalcemia, hyperbilirubinemia, and postpartum development of type 2 diabetes [2–5]. It is reported that the prevalence of GDM is more than 10% in all pregnant women [6, 7]. However, mechanisms for how GDM occurs are still unclear.
Peptidase M20 domain containing 1 (PM20D1) is a newly identified secreted enzyme enriched in UCP1+ vs. UCP1– adipocytes [8]. It is reported that PM20D1 participates in many diseases and bioprocesses. Sanchez-Mut et al. found that PM20D1 was a quantitative trait locus associated with Alzheimer’s disease [9]. Long et al. considered that ablation of PM20D1 might regulate the metabolism and nociception of N-acyl amino acid [10]. It was also found that PM20D1 might have a non-additive biochemical engagement for N-acyl amino acid metabolism and underscore enzymatic division [11]. Another study also found that methylation of PM20D1 was elevated in pregnant women with asthma [12]. However, up to now, no study has focused on PM20D1 in GDM.
The present study aimed to investigate the role of PM20D1 in GDM. This research might provide better understanding and some new research targets for PM20D1 in GDM development.
Material and methods
Patients
This prospective observational study included 189 cases of GDM patients who came to our department between March 2018 and December 2019. All gestational patients who met the inclusion criteria were consecutively enrolled and were diagnosed with diabetes. The diagnosis of GDM was according to the World Health Organization (WHO) and the International Association of Diabetes in Pregnancy Study Groups (IADPSG) diagnostic criteria [13]. One of the following could be diagnosed as GDM: fasting blood glucose (FBG) ≥ 5.1 mmol/l, 75 g oral glucose tolerance test (OGTT) 1-hour plasma glucose (OGTT-1hPG) ≥ 10.0 mmol/l, or OGTT-2hPG ≥ 8.5 mmol/l in gestational patients with gestational age 24–28 weeks. The following patients were excluded: a) patients with severe infections, chronic infections or asthma; b) patients with liver, renal or cardiovascular diseases such as HBV, renal failure or coronary heart disease; c) patients who had diabetes before pregnancy. Additionally, 100 healthy pregnant individuals who came to physical examination were included as healthy controls during the same period. All healthy pregnant individuals were confirmed to have no related diseases such GDM, cardiovascular diseases, other metabolic diseases, liver or renal dysfunctions. Written informed consent was obtained from all patients. The present study was approved by the ethics committee of the Maternal and Child Health Hospital of Hubei Provincial.
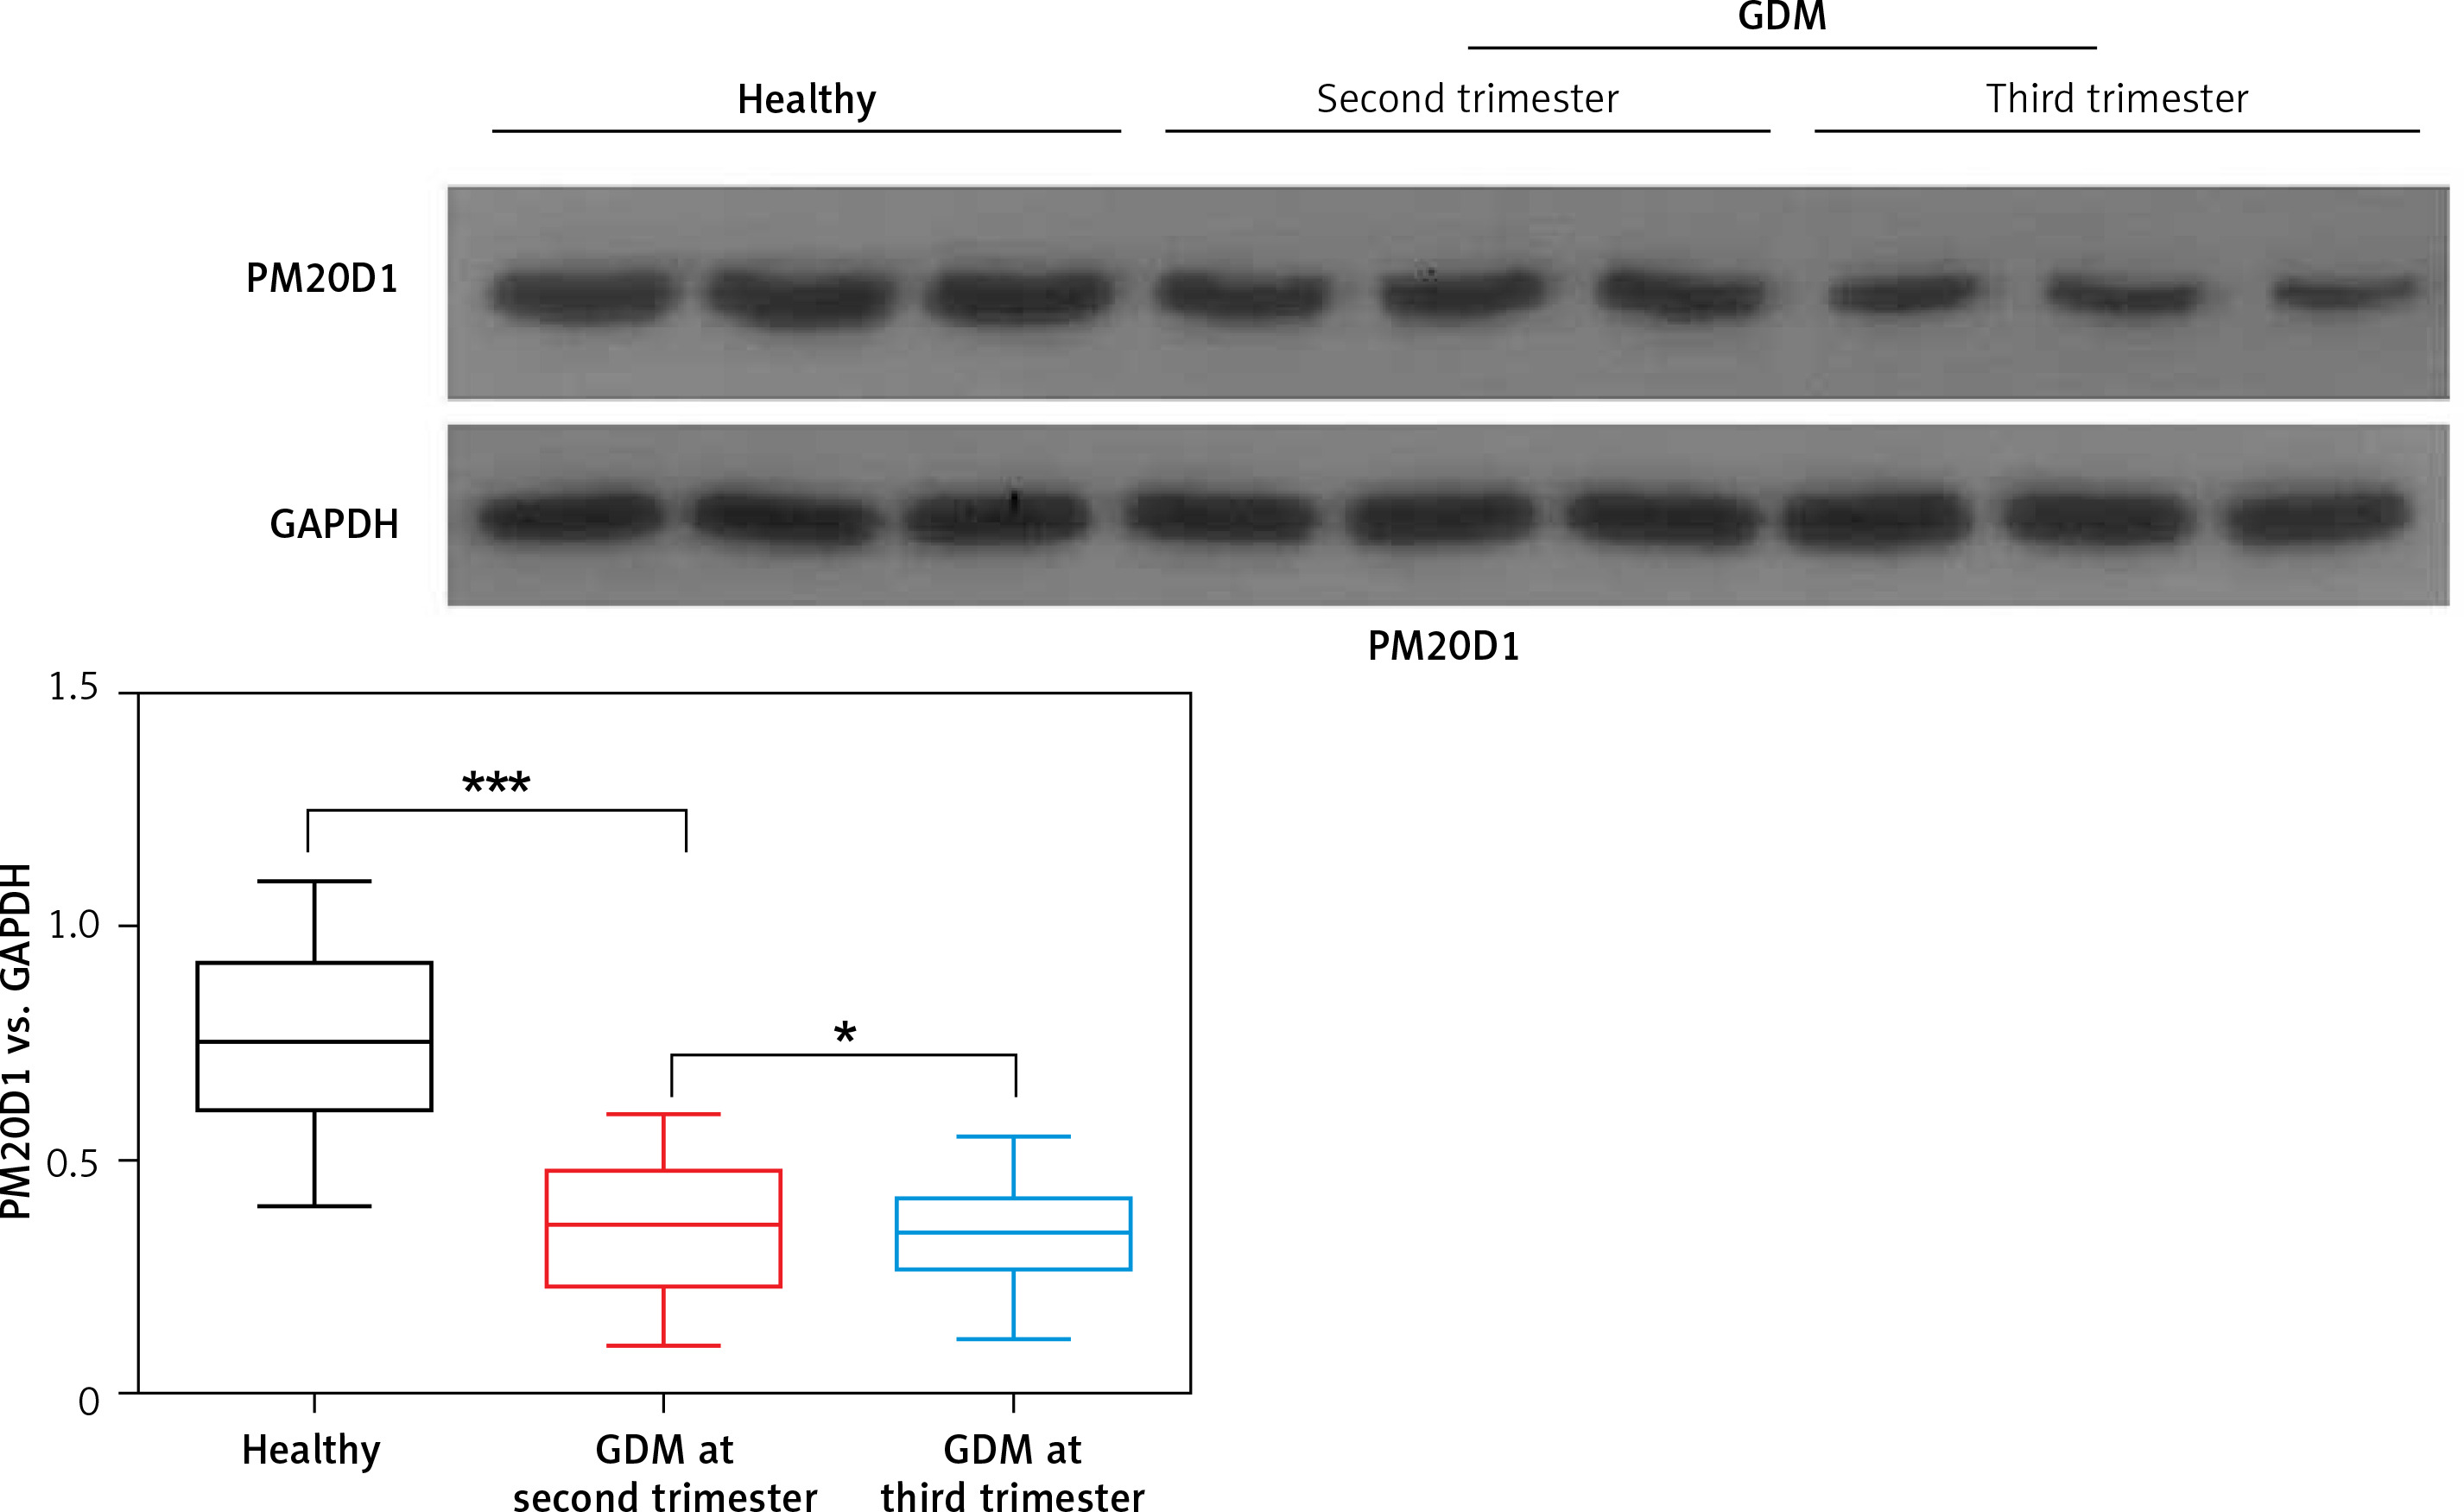
Western blotting for PM20D1
The patients’ blood samples were collected at gestational age 24-28 weeks, as well as gestational age 37–40 weeks. The serum levels of PM20D1 were determined by western blotting. Proteins were extracted from the samples by radio-immunoprecipitation assay (RIPA) buffer (Vazyme Biotec Co., LTD, Nanjing, China). Protein contents were determined using protein assay reagent from Bio-Rad (Hercules, CA, USA). The serum albumin was depleted by using Bio-Rad DEAE Affi-Gel Blue (Bio-Rad). The extracted proteins (30 μg) were loaded on 10% SDS-PAGE and transferred to PVDF membranes, following by incubation with a primary anti-PM20D1 antibody (LS-C205961, LifeSpan Biosciences) followed with a conjugated secondary antibody (LS-C69961, LifeSpan Biosciences). The films were scanned by the EasySee Western Blot Kit (Beijing TransGen Biotech, Beijing, China). Relative protein expression was quantified using Image-Pro Plus software (version 6.0; Media Cybernetics, Inc., Rockville, MD, USA). GAPDH was used as the reference protein.
Measurement of serum inflammatory factors
Inflammatory markers of C-reactive protein (CRP), interleukin (IL)-1β, IL-6, and tumor necrosis factor (TNF)-α, as well as leptin and adiponectin, were all measured by commercial ELISA kits according to the manufacturers’ instructions (CRP ab260058 Abcam sensitivity 5.36 pg/ml range 18.75 pg/ml – 1200 pg/ml, IL-1β ab214025 Abcam sensitivity 5.64 pg/ml range 14.06 pg/ml – 900 pg/ml, IL-6 LS-F25919 LifeSpan Biosciences sensitivity 5.36 pg/ml range 18.75 pg/ml – 1200 pg/ml, TNF-α ab181421 Abcam sensitivity 4.32 pg/ml range 15.63 pg/ml – 1000 pg/ml, leptin ab179884 Abcam, sensitivity 4.65 pg/ml range 15.63 pg/ml – 1000 pg/ml and adiponectin ab99968 Abcam sensitivity < 25 pg/ml range not mentioned).
Clinical outcomes and follow-up
Patients’ characteristics and demographic data were collected. The total cholesterol (TC), triglyceride (TG), high-density lipoprotein cholesterol (HDL-C) and low-density lipoprotein cholesterol (LDL-C), as well as the levels of FBG, OGTT-1hPG, OGTT-2hPG and fasting insulin, were measured by an automatic biochemical analyzer (Beckman Coulter AU5800). The insulin resistance index (HOMA-IR) was calculated and recorded by: (fasting insulin (mU/l) × FBG (mmol/l))/22.5. All patients were followed up until delivery.
Statistical analysis
All experiments were conducted in triplicate. The distribution of the data was analyzed by the Kolmogorov-Smirnov method. The data distributed normally were expressed as mean ± SD, χ2 test was used to compare the rates and comparison between two groups was performed using the Student t-test. Comparison among three or more groups was performed by one-way analysis of variance (ANOVA) followed by the Tukey post hoc test. Logistic regression analysis was used for risk factors of poor pregnancy outcome. P < 0.05 was considered as statistically significant. All calculations were made using SPSS 18.0.
Results
Serum protein levels of PM20D1 were down-regulated in GDM patients
The comparison of basic characteristics of the GDM patients and healthy controls is shown in Table I. No significant difference was found for age and BMI. However, the levels of HOMA-IR, fasting insulin, FBG, OGTT-1hPG, OGTT-2hPG, as well as TG and LDL-C were significantly higher in GDM patients and levels of HDL-C levels were remarkably lower in GDM patients compared with healthy controls (all p < 0.05).
Table I
Basic characteristics of all GDM patients and healthy controls at 24–28 weeks after pregnancy when enrolled in the study
Then, western blotting was used for measurement of PM20D1 and its relative expression vs. GAPDH was calculated. As shown in Figure 1, the expression of PM20D1 was markedly lower in GDM patients compared with the healthy controls (p < 0.01). Also, patients in the third trimester of pregnancy (gestational age 37–40 weeks) showed significantly lower expression of PM20D1 than patients in the second trimester of pregnancy (gestational age 24–28 weeks) (p < 0.05). These results indicated that PM20D1 expression was associated with GDM and the pregnancy time.
Serum levels of PM20D1 were correlated with inflammatory factors
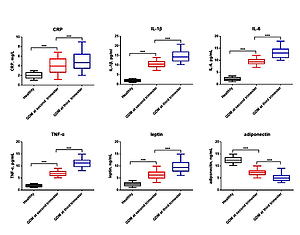
To further investigate the role of PM20D1 in GDM, serum levels of inflammatory factors of CRP, IL-1β, IL-6, TNF-α, leptin and adiponectin were measured by ELISA at both 24–28 weeks and 37–40 weeks after pregnancy. It was found that factors of CRP, IL-1β, IL-6, TNF-α and leptin were remarkably higher and levels of adiponectin were markedly lower in GDM patients at both the second and third trimester of pregnancy compared with the healthy controls (p < 0.05, Figure 2). Also, levels of CRP, IL-1β, IL-6, TNF-α and leptin were remarkably higher and levels of adiponectin were markedly lower in GDM patients at the third trimester of pregnancy than in GDM patients at the second trimester of pregnancy (p < 0.05). Furthermore, Pearson’s analysis showed that PM20D1 was negatively correlated with IL-1β, IL-6 and leptin and positively correlated with adiponectin at the second trimester of pregnancy and at the third trimester of pregnancy PM20D1 was also correlated with CRP, IL-6 and adiponectin (Table II).
Table II
Pearson’s analysis for relative levels of PM20D1 and serum levels of inflammatory factors at second and third trimester of pregnancy
Figure 2
Serum protein levels of inflammatory factors of CRP (A), IL-1β (B), IL-6 (C), TNF-α (D), leptin (E) and adiponectin (F) in all GDM patients, GDM patients of second trimester of pregnancy, GDM patients of third trimester of pregnancy, and healthy controls
GDM – gestational diabetes mellitus, CRP – C-reactive protein, IL-1β – interleukin-1β, IL-6 – interleukin-6, TNF-α – tumor necrosis factor α. ***p < 0.001.
Serum levels of PM20D1 were correlated with diabetic-related indices
Then, since the expression of PM20D1 was the lowest at the second trimester of pregnancy, all patients were divided into PM20D1 low or high expression groups according to mean relative value of PM20D1 (0.35) at 24–28 weeks of pregnancy. As shown in Table III, at the second trimester of pregnancy, patients with lower expression of PM20D1 showed remarkably higher levels of HOMA-IR, fasting insulin, FBG, OGTT-1hPG, OGTT-2hPG, as well as TG and LDL-C, as well as markedly lower levels of HDL-C compared with patients with higher expression of PM20D1, suggesting that lower expression of PM20D1 might predict severer outcomes of GDM.
Table III
Diabetic-related indices in patients with different levels of PM20D1
Down-regulated PM20D1 was associated with poor pregnancy outcomes
Finally, we analyzed the PM20D1 expression at 24–28 weeks after pregnancy and its relationship with the pregnancy outcomes. As shown in Table IV, it was found that the rates of premature, gestational hypertension and total poor pregnancy rate were all remarkably higher in GDM patients with lower PM20D1 compared with other groups of patients (all p < 0.05). As shown in Table V, the logistic regression analysis showed that factors of PM20D1 and OGTT-1hPG at 24–28 weeks of pregnancy were independent risk factors for poor pregnancy outcomes.
Table IV
Relationship between PM20D1 and poor pregnancy outcomes
Table V
Risk factors for poor prognosis of pregnancy
[i] BMI – body mass index, FBG – fasting blood glucose, TC – total cholesterol, TG – triglyceride, HDL-C – high-density lipoprotein cholesterol, LDL-C – low-density lipoprotein cholesterol, OGTT – oral glucose tolerance test, CRP – C-reactive protein, IL-1β – interleukin-1β, IL-6 – interleukin-6, TNF-α – tumor necrosis factor α.
Discussion
Gestational diabetes mellitus is one of the common complications during pregnancy. However, the mechanisms for GMD are still unclear and serum biomarkers for GDM are also inadequate. In this research, we demonstrated that serum PM20D1 was down-regulated in GMD patients and was associated with patients’ clinical outcomes and pregnancy outcomes.
Many factors are reported to be involved in the GDM process [14, 15]. In a recent report, Rancourt et al. found that levels of TNF-α and SOCS3 were significantly increased in visceral adipose tissues of GDM patients [16]. Zou et al. showed that activation of the AMPK signaling pathway in a mouse GDM model could decrease the inflammatory factors of IL-1β, IL-6, and TNF-α and improve the GDM [17]. Another study also demonstrated that single nucleotide polymorphisms of IL-6 and TNF-α were associated with incidence of GDM and serum inflammatory factor levels were generally higher in GDM patients than the healthy control [18]. In a more recent study, Alamolhoda et al. found that patients with higher CRP levels had significantly higher risk of developing GDM [19]. Also, studies also found that leptin was up-regulated and adiponectin was down-regulated in GDM patients and they had potential as diagnostic biomarkers [20–22]. In our research, we also found that the inflammatory factors were increased in GDM patients. However, to our best knowledge, no study has reported the role of PM20D1 in GDM.
PM20D1 is considered to be associated with lipid metabolism and obesity. Long et al. found that PM20D1 was a bidirectional enzyme in vitro and increased circulating PM20D1 augmented respiration and increased N-acyl amino acids in blood [23]. Benson et al. found that genetic variation in PM20D1 expression was associated with obesity and might influence obesity treatment [24]. It was also found that a decreased level of PM20D1 might lead to white and brown adipose loss and reduced body weight [25]. Although studies on PM20D1 in pregnant women are rare, many studies have noted that lipid metabolism and obesity are closely associated with GDM. It was reported that maternal obesity and GDM were associated with decreased levels of genes involved in lipid metabolism, while adipokines such as TNF-α, IL-1β and/or leptin were increased in adipose tissue of obese and GDM women, while the suggested dysfunction of lipid metabolism and activation of information might be associated with GDM and obesity in pregnant women [26]. Another study found that in GDM patients, 76.3% were overweight or obese, indicating that obesity was associated with GDM and was a risk factor for GDM [27]. All these studies implied that GDM was associated with lipid metabolism and obesity. Moreover, lipid metabolism was also associated with insulin resistance in GDM. It was also found that improvement of lipid metabolism could improve insulin resistance in GDM [28–30]. Thus, PM20D1 might influence GDM by regulating lipid metabolism, which needs more studies for confirmation [31]. In this research, we found that PM20D1 was down-regulated in GMD patients. We also found that in PM20D1 low expression patients, levels of TC and LDL-C were markedly higher, while levels of HDL-C were significantly lower, further indicating that PM20D1 was associated with lipid metabolism in GDM patients. Also, we observed that serum PM20D1 levels were the lowest at the second trimester of pregnancy, indicating that PM20D1 might be associated with pregnancy stage. However, deeper insights are still needed to illuminate role of PM20D1 in GMD or diabetes.
The present research also has some limitations. First, the study only contained 189 GDM patients. Secondly, we did not know the molecular mechanisms for PM20D1 in GDM. All these need more research.
In conclusion, this observational study demonstrated that PM20D1 was down-regulated in GDM patients and was associated with patients’ clinical outcomes and pregnancy outcomes. This result might provide novel potential biomarkers for GDM, as well as novel research and treatment targets.