Introduction
Blindness, a serious eye condition, is a worldwide health concern. The number of cases of blindness reached 32.4 million in 2010 globally [1]. Blindness is mainly characterized by the loss of light reaction from the surrounding environment. Blindness can be caused by a variety of eye diseases such as cataract [2], glaucoma [3] and optic neuritis [4]. Blindness can be roughly divided into reversible and irreversible blindness. Currently, surgery and drug therapy are effective for reversible blindness. Effective intraocular lens implantation can improve the visual quality of cataract-induced blindness [5]. Meanwhile, corticosteroids can be used to treat optic neuritis [6]. However, treatments for irreversible blindness such as optic atrophy are limited. The visual system includes the eyeball, visual pathways and visual cortex. Blindness may be accompanied by dysfunction of the visual cortex and vision-related cortex.
Magnetic resonance imaging (MRI) has been successfully used to measure brain activities in many diseases [7, 8]. It has been shown that blindness leads to abnormality of the visual cortex. Blind patients showed marked decreased gray matter volume (GMV) in the visual areas and sensorimotor areas compared with sighted subjects [9]. Meanwhile, other research revealed that early blindness showed decreased white matter volume (WMV) in the optic tract and optic radiation and marked reduced gray matter volume (GMV) in the visual cortex [10]. Blind subjects exhibited low fractional anisotropy in the ventral stream [11]. The abovementioned studies mainly focused on abnormalities of the brain anatomy and function in binocular blindness. However, alteration of the brain function network in monocular blindness is less well studied. Whether the monocular vision will lead to abnormal visual cortex remains unknown. Recently, voxel-wise degree centrality (DC) has been applied to evaluate the brain function network changes [12, 13]. The DC method measures the network architecture of functional connectivity within the human brain connectome at the voxel level [14, 15]. It does not require the definition of regions of interest (ROIs). High DC values represent a node with numerous direct connections to other nodes. Thus, the DC can detect the whole brain functional network [16]. The DC method has been successfully used to evaluate pathological mechanisms of many diseases such as autism [17] and Parkinson’s disease [18]. Thus, DC is a reliable resting-state functional magnetic resonance technology.
Our study aimed to compare the whole brain function networks between the monocular blindness patients and sighted subjects using the voxel-wise DC method, which might provide useful information for better understanding of the altered brain function networks in late monocular blindness.
Material and methods
Subjects
A total of 32 patients with MB (25 males and 7 females, all with right eye blindness) were recruited from the Ophthalmology Department of the First Affiliated Hospital of Nanchang University Hospital. Blindness was defined as best-corrected visual acuity (BCVA) of less than 0.05 (Snellen, 20/400) or a visual field no greater than 10° around central fixation [19]. The diagnostic criteria of MBs were: 1) late stage of monocular blindness (eighteen patients with ocular trauma, fourteen patients with keratitis); 2) normal contralateral eye without any ocular diseases (cataracts, glaucoma, optic neuritis, and retinal degeneration). The exclusion criteria were: 1) congenital blindness; 2) impaired contralateral eye vision; 3) a history of surgery in both eyes; 4) long-term medical treatment of blindness; 5) psychiatric disorders (depression, bipolar disorder, sleep disorder), and cerebral infarction diseases.
Thirty-two healthy controls (25 males, 7 females) with age-, sex-, and education status-matched subjects were also recruited for this study. All healthy subjects met the following criteria: 1) no abnormalities in the brain parenchyma on cranial MRI; 2) no ocular diseases with uncorrected or corrected visual acuity (VA) > 1.0; 3) no psychiatric disorders (depression, bipolar disorder, sleep disorder); and 4) be able to be scanned with MRI (e.g. no cardiac pacemaker or implanted metal devices). All research methods followed the Declaration of Helsinki and were approved by the principles of medical ethics of the First Affiliated Hospital of Nanchang University Hospital. All volunteers participated voluntarily and were informed of the purposes, methods, and potential risks before signing an informed consent form.
MRI data acquisition
All MRI data were collected on a Siemens Trio 3.0 T scanner. MRI scanning was performed on each subject. The MRI scanning parameters were as follows: repetition time (TR) = 2,000 ms, echo time (TE) = 40 ms, flip angle = 90°, slice thickness/gap = 4.0/1 mm, field of view (FOV) = 240 mm × 240 mm, in-plane resolution = 64 × 64, 30 axial slices and 240 volumes.
fMRI data preprocessing
All the functional data were pre-filtered with MRIcro (www.MRIcro.com) and preprocessed using SPM8 (http://www.fil.ion.ucl.ac.uk/spm), DPARSFA (http://rfmri.org/DPARSF) and the Resting-state Data Analysis Toolkit (REST, http://www.restfmri.net). After removing the first 10 time points, the remaining 230 volumes were collected. Volumes with the x, y, or z directions > 2° were excluded from this study. More details were described in a previous study [20].
Degree centrality
Based on the individual voxel-wise functional network, DC was calculated by counting the number of significant suprathreshold correlations (or the degree of the binarized adjacency matrix) for each subject. The voxel-wise DC map for each individual was converted into a z-score map using the following equation [20]: Zi = DCi − meanall/stdall, where Zi is z score of the ith voxel, DCi is the DC value of the ith voxel, meanall is the mean DC value of all voxels in brain mask, and stdall is the standard deviation of DC values of all voxels in the brain mask.
Statistical analysis
For demographic and clinical measurements, the differences of clinical features between the MBs and HCs were calculated with independent-sample t-test using the SPSS 19.0 software (IBM, Armonk, NY).
For voxel-wise DC, the one-sample t-test was performed in each group to identify the spatial centrality distribution (hubs) of the whole brain functional network. Furthermore, we performed two-sample t-test using gender, age and education status as nuisance covariates within the default gray matter mask to assess between-group differences in the voxel-wise DC using REST V1.8. (p < 0.05 for multiple comparisons using Gaussian random field (GRF) theory 3, cluster-wise p < 0.05 corrected was considered statistically significant.)
The relationship between the mean DC values and the behavioral performance was calculated by correlation analysis.
Results
Demographics and visual measurements
The mean duration of the onset MBs was 22.63 ±7.60 years. There were no obvious differences in weight (p = 0.482), age (p = 0.787), and best-corrected VA-Left (p = 0.438) between the patients with MB and the HCs. However, there were marked differences in the best-corrected VA-Right (p < 0.001) between two groups. Details are presented in Table I.
Table I
Demographics and clinical measurements by group
| Parameter | MB | HC | t | P-value* |
|---|---|---|---|---|
| Male/female | 25/7 | 25/7 | N/A | > 0.99 |
| Age [years] | 45.71 ±12.75 | 44.85 ±12.64 | 0.271 | 0.787 |
| Weight [kg] | 58.90 ±6.36 | 57.76 ±6.57 | 0.708 | 0.482 |
| Handedness | 32R | 32R | N/A | > 0.99 |
| Duration of MB [years] | 22.63 ±7.60 | N/A | N/A | N/A |
| Best-corrected VA-Right | 0.00 ±0.00 | 1.21 ±0.29 | –23.596 | < 0.001 |
| Best-corrected VA-Left | 1.18 ±0.16 | 1.22 ±0.18 | –0.781 | 0.438 |
DC differences
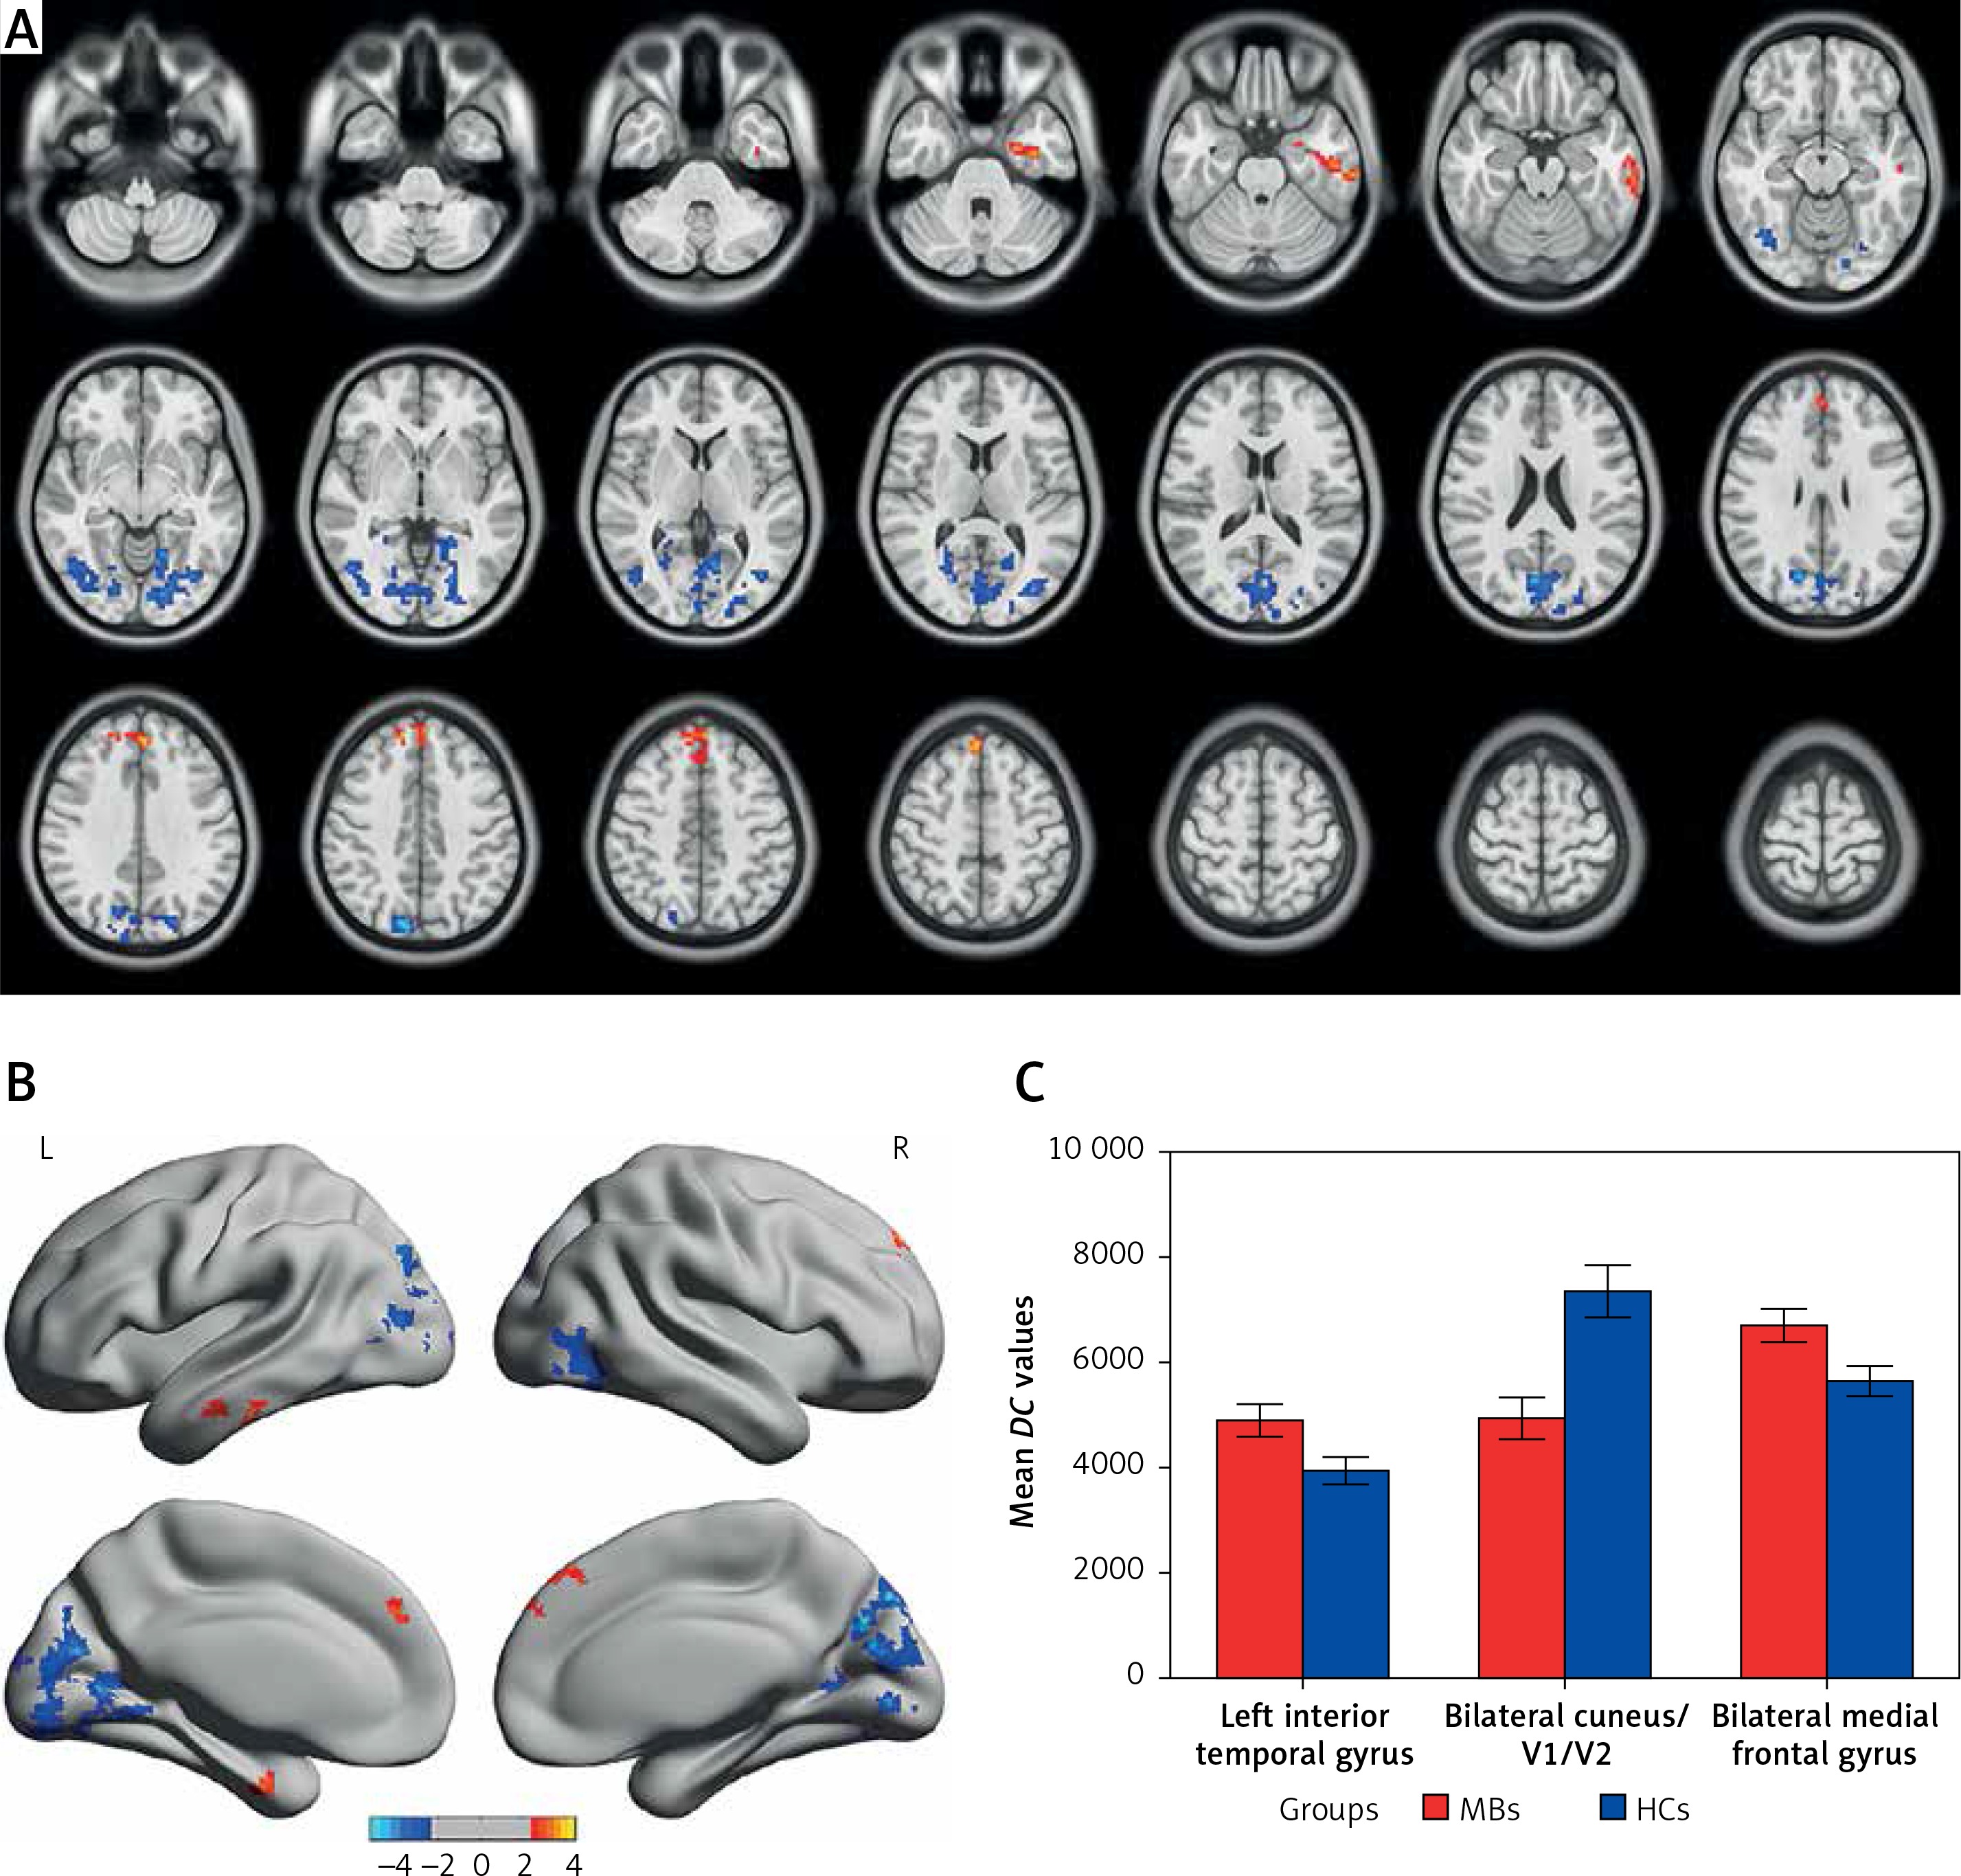
Compared with HCs, MB patients had significantly decreased DC values in the bilateral cuneus/V1/V2, and significantly increased DC values in the left inferior temporal gyrus and bilateral medial frontal gyrus (Figures 1 A, B and Table II). Meanwhile, we showed the mean values of altered DC between the MBs and HCs (Figure 1 C). In the MB group, there was no significant correlation between the observed mean DC values of different brain areas and the behavioral performance (p > 0.05).
Table II
Brain areas with significantly different DC values between groups. The statistical threshold was set at voxel level with p < 0.05 for multiple comparisons using Gaussian random field (GRF) theory (cluster-wise p < 0.05 corrected)
| Condition Brain areas | BA | T-values | Peak voxels | MNI | ||
|---|---|---|---|---|---|---|
| x | y | z | ||||
| Left inferior temporal gyrus | 20 | 3.788 | 125 | –36 | –9 | –30 |
| Bilateral cuneus/V1/V2 | 18, 19, 7, 30, 31 | –5.303 | 1107 | 15 | –72 | 30 |
| Bilateral medial frontal gyrus | 8, 9 | 4.448 | 153 | –3 | 45 | 30 |
Figure 1
Voxel-wise comparison of DC in the MB and HC groups. A, B – Significant differences in DC were observed in the left inferior temporal gyrus, bilateral cuneus/V1/V2 and bilateral medial frontal gyrus; the red areas denote higher DC values, and the blue denotes lower DC values (p < 0.05 for multiple comparisons using Gaussian random field (GRF) theory, z > 2.3, cluster-wise p < 0.05 corrected). C – The mean of altered DC values between the MBs and HCs
DC – degree centrality, MB – monocular blindness, HC – healthy control, V1 – primary visual cortex, V2 – secondary visual cortex.
Receiver operating characteristic curve
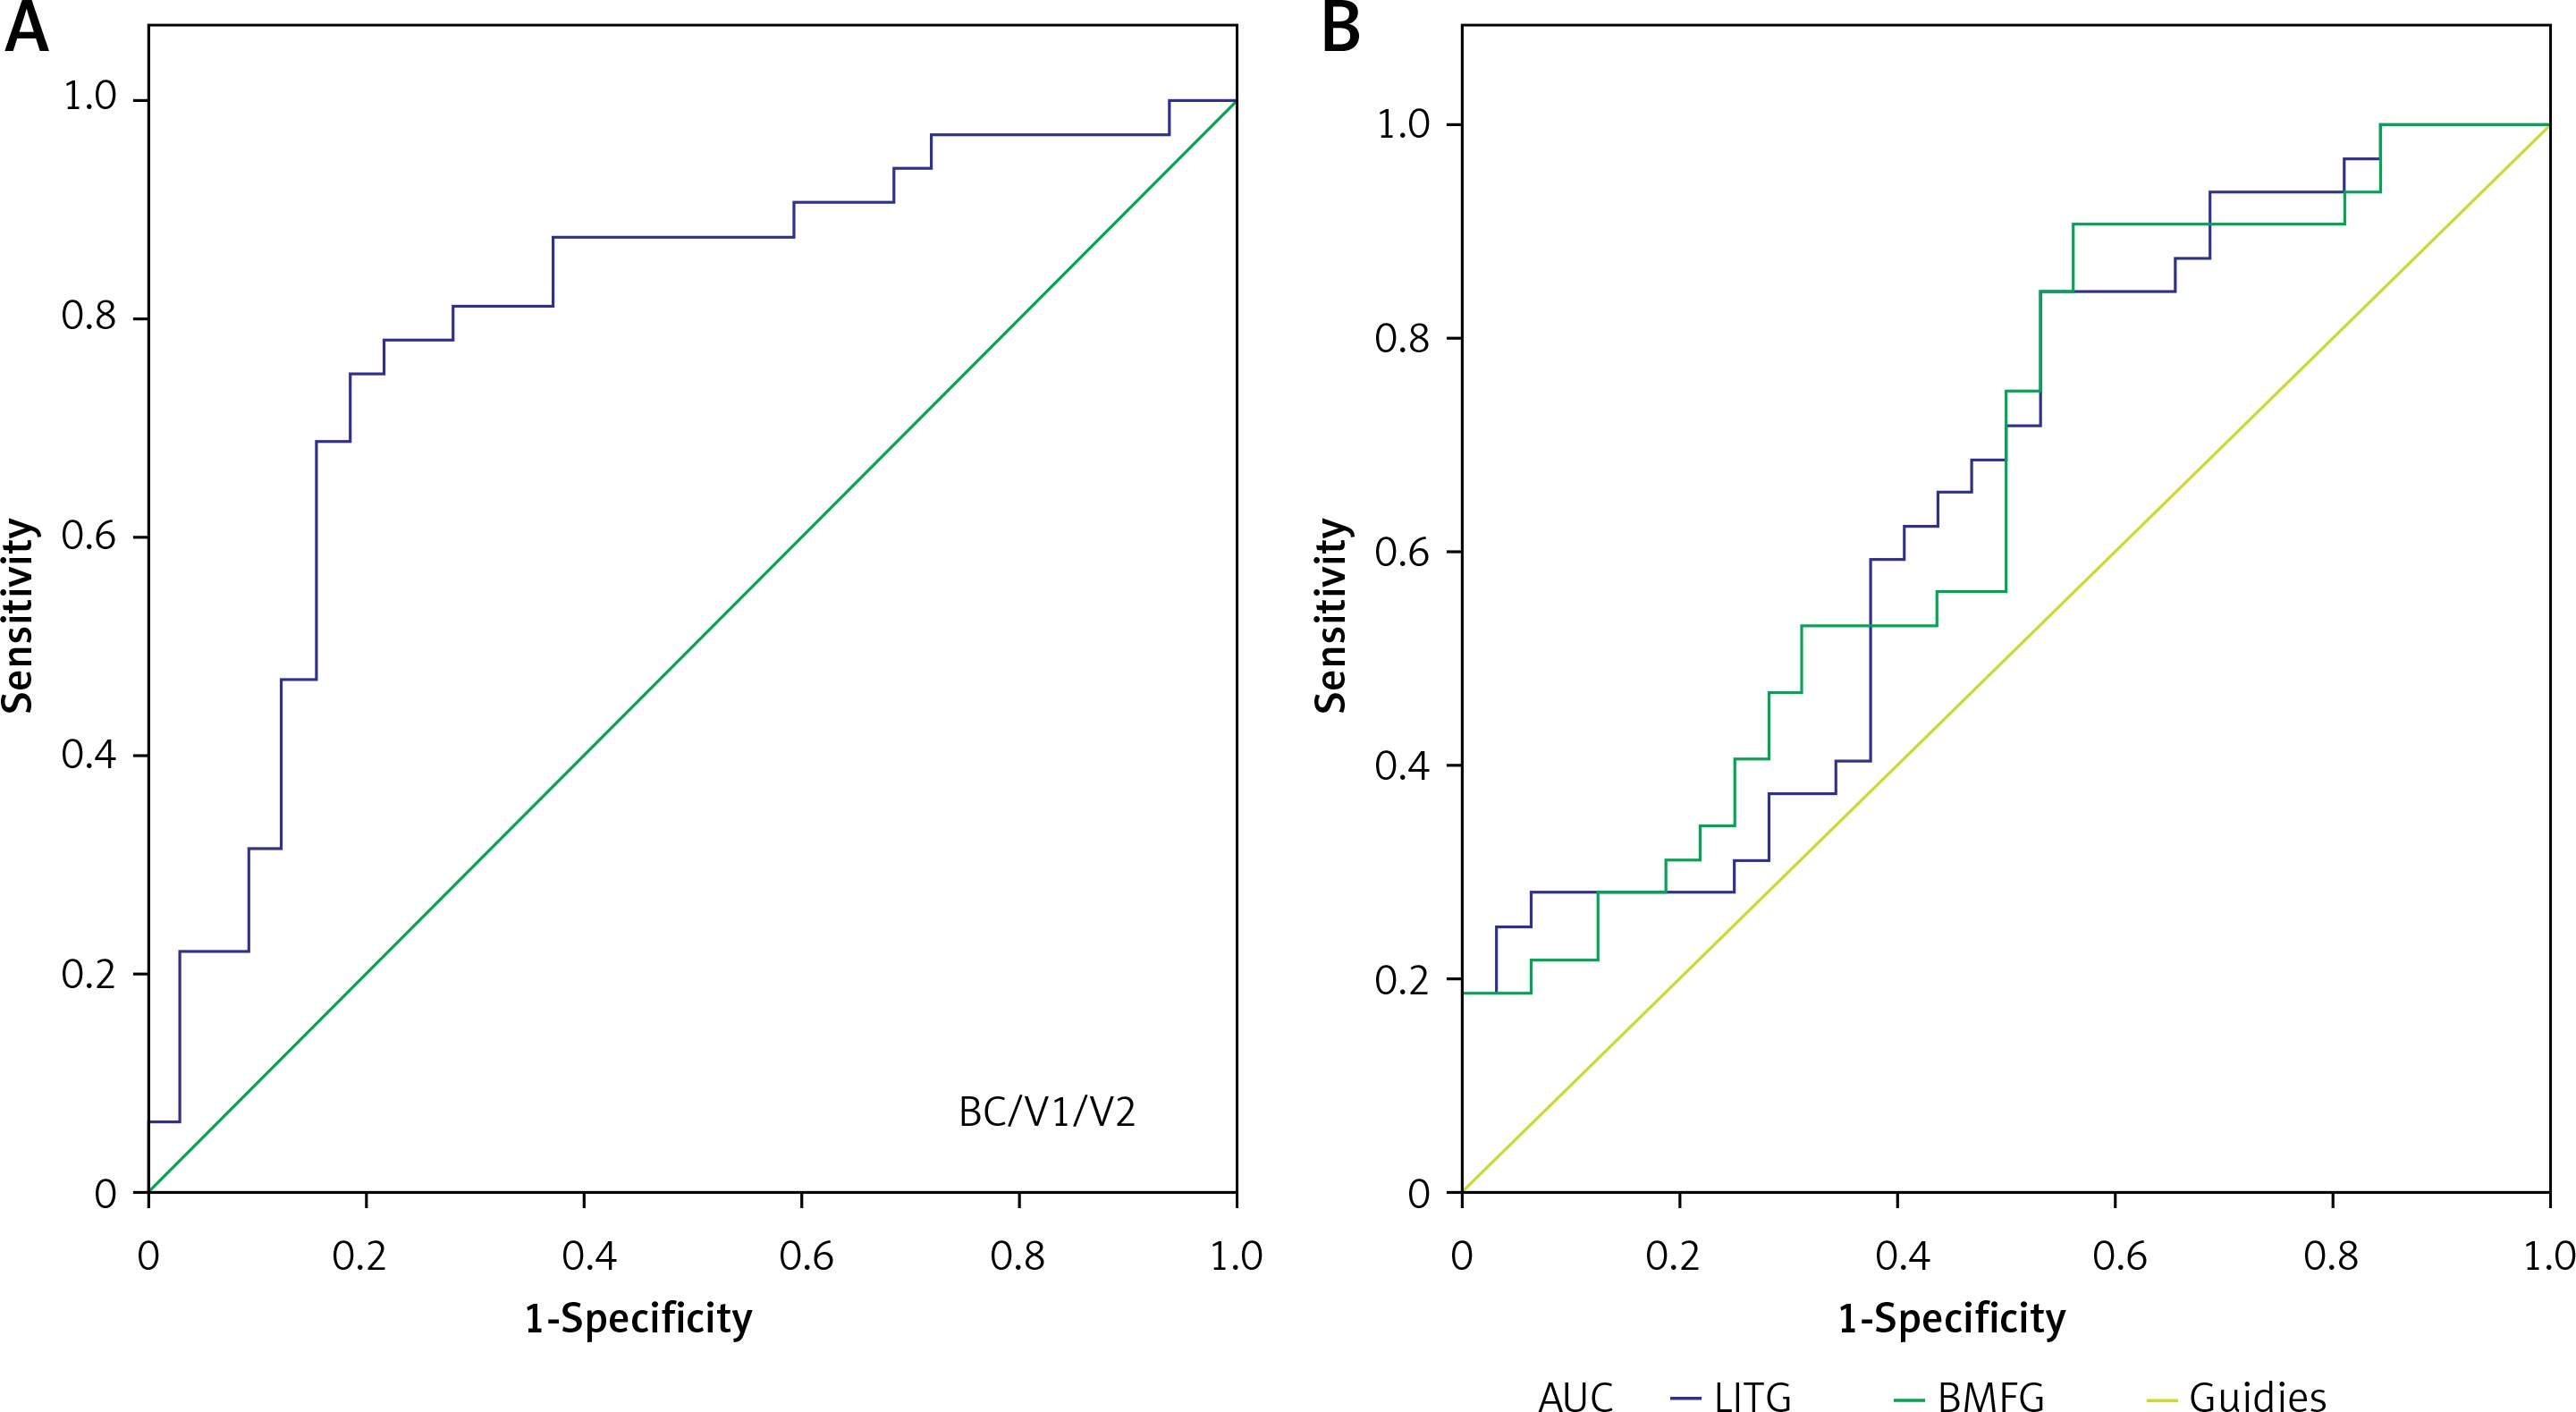
We identified brain regions with different DC values between the MB and HC groups, which might be used as markers to separate MB from HCs. In our study, the area under the curve (AUC) was as follows: the bilateral cuneus/V1/V2 (0.790) (MBs < HCs) (Figure 2 A); the left inferior temporal gyrus (0.651) and the bilateral medial frontal gyrus (0.654) (MBs > HCs) (B) (Figure 2 B).
Figure 2
ROC curve analysis of the mean DC values for altered brain regions. The area under the ROC curve was 0.790 (p < 0.001; 95% CI: 0.674–0.906) for the bilateral cuneus/V1/V2 (MBs < HCs) (A), and 0.651 (p = 0.037; 95% CI: 0.516–0.786) for the left inferior temporal gyrus, 0.654 (p = 0.034; 95% CI: 0.520–0.789) for the bilateral medial frontal gyrus (MBs > HCs) (B)
ROC – receiver operating characteristic, DC – degree centrality, CI – confidence interval, V1 – primary visual cortex, V2 – secondary visual cortex.
Discussion
The voxel-wise degree centrality (DC) method can be used to measure the whole-brain functional network at the voxel level. In our study, we found that the MB patients had significantly decreased DC values in the bilateral cuneus/V1/V2, and significantly increased DC values in the left inferior temporal gyrus and bilateral medial frontal gyrus.
Analysis of the decreased DC values in MB
The visual cortex, located in the occipital lobe of the brain, is involved in the processing of visual information input from the lateral geniculate body. The primary visual cortex, also known as V1, is involved in the natural scene coding [21] and perception of color signals [22]. Additionally, V1 is responsible for modulation of spatial attention [23]. After visual deprivation, retinal axons and optic nerve fibers slowly degenerate, and this leads to optic atrophy in the blind patients. Many previous studies demonstrated that blind patients showed impairment in the visual pathway [24, 25]. Meanwhile, atrophy could lead to dysfunction of the visual cortex. A previous study demonstrated that early blindness showed lower levels of γ-amino acid butyric acid (GABA) in the occipital cortex [26]. Others reported that blind subjects exhibited decreased functional connectivity density in the primary visual cortex (V1) [27]. The abovementioned studies have shown that binocular blindness can lead to occipital visual cortex dysfunction. Furthermore, Zhong et al. demonstrated that macaque monkeys with monocular blindness showed reduced fractional anisotropy (FA) and increased mean diffusivity MD in the impaired optic tracts [28]. In our study, we also found significantly decreased DC values in the bilateral V1 in late right monocular blindness, which might reflect dysfunction of V1. We concluded that right monocular blindness might lead to impairment of bilateral V1.
The secondary visual cortex (V2) receives visual signals from V1 and transduces the signals to a higher level of the visual cortex (V3, V4, V5). The V2 is also involved in the processing of color and motion [29]. In addition, it has also been suggested to regulate the illusory contour [30] and relative disparity [31]. Our study showed that the late right MB had decreased DC values in the bilateral V2, indicating dysfunction of V2. Dysfunction of the bilateral V1 might lead to impairment of the bilateral V2. Thus, we speculated that right MB might lead to defects of the bilateral V2.
The responses of neurons in the visual cortex (V1 and V2) were associated with stereo vision [32]. Meanwhile, the disparity detectors were in cortical visual areas V1, V2, V3, V3A, VP, and MT (V5), which play an important role in stereopsis vision [33]. The normal binocular field is very important for binocular vision function. The MB patients had defects in binocular vision, which might lead to decreased DC values in the bilateral V1/V2. Thus, we speculated that single vision might lead impairment of the bilateral V1/V2. The cuneus located in the occipital lobe of the brain is involved in visual processing. The occipital lobe including the visual cortex is the visual processing center. A previous study reported that the cuneus modifies visual information to extrastriate cortices via the primary visual cortex V1 [34]. In our study, we found that the MB showed significantly decreased DC in the bilateral cuneus. These results suggest that late right MB might lead to impairment of the bilateral visual cortex.
Analysis of the increased DC values in MB
The inferior temporal gyrus (IT) located in the anterior of the temporal lobe controls the natural scenes coding along with the ventral visual pathway [35]. Moreover, the IT is responsible for visual shape categorization [36] and visual imagery [37]. A previous study reported that blind subjects showed lower functional connectivity between the left superior and middle temporal gyrus compared with sighted subjects [38]. In our study, we found that the MBs showed significantly increased DC values in the left inferior temporal gyrus, which might reflect the enhanced activities of the IT. We speculated that the increased functional network in the IT might reflect the compensation of the monocular vision loss in the right MBs.
The medial frontal gyrus (MFG) located in the middle of the frontal gyrus is involved in empathy [39]. Meanwhile, the MFG is responsible for negative emotions [40]. Dysfunction of the MFG is associated with many diseases such as schizophrenia [41] and adjustment disorder [42]. In our study, we found that MB patients had significantly increased DC values in the bilateral medial frontal gyrus, which might reflect the dysfunction of emotion in MBs. These results suggest that MB might be associated with emotion disorders.
In our study, we selected patients with right eye blindness, while left eye blindness patients were not included. The results might be more accurate if both eye patients were involved in the study. In a future study, we would compare the DC differences between left and right eye blindness.
In conclusion, our results showed an abnormal brain function network in many brain regions, which might reflect the abnormalities of the visual cortex and other vision-related brain regions in MB.