Introduction
Strokes are the second leading cause of death worldwide, affecting one person every 6 s. The incidence of stroke in China is the second highest in the world, with ischemic stroke accounting for approximately 80% of all stroke cases [1]. Neural damage from an ischemic stroke results in substantial mental and economic burdens for the affected persons, their families, and society. Thus, an exploration of ischemic stroke pathogenesis and treatment is important from both clinical and social perspectives.
Granulocyte colony-stimulating factor (G-CSF), a glycoprotein that plays a major role in neutrophil hematopoietic cellular proliferation, differentiation, and activation, is used therapeutically to prevent and treat many forms of granulocytopenia [2]. Previous animal studies have shown that G-CSF may also play a neuroprotective role in ischemic brain injury. In rat and mouse ischemia models, G-CSF can mobilize bone marrow stem cells into the peripheral blood circulation and brain to promote nerve regeneration and repair nerve functions. After binding to its receptor, G-CSF shows anti-inflammatory and antiapoptotic activity by reducing the infarction volume and improving the functional prognosis in animals [3].
The Notch signaling pathway is involved in the regulation of cell growth, development, and apoptosis, as well as the pathologic processes in nervous, cerebrovascular, cardiovascular, and hereditary diseases. The granulocyte colony-stimulating factor can also inhibit neural stem cell (NSC) differentiation into neurons and glial cells, thereby indirectly maintaining stem cell pluripotency and a self-renewal ability [4]. Previous studies have shown that, following cerebral injury, the Notch signaling pathway is activated to induce nerve regeneration [5, 6]. These findings suggest that the Notch signaling pathway is significantly involved in ischemic brain damage. In a study on cerebral autosomal dominant arteriopathy with subcortical infarcts and leukoencephalopathy, Uyguner et al. confirmed that G-CSF uses the Notch signaling pathway to inhibit cerebrovascular amyloidosis and vascular smooth muscle cell apoptosis to protect NSCs and increase ventricular region neurogenesis [7].
These previous studies suggest that G-CSF action and Notch signaling are closely linked. We conducted this study to determine the effects of G-CSF overexpression in neuronally differentiated PC-12 cells on the Notch signaling pathway in the oxygen-glucose deprivation (OGD) model. Therefore, this study hypothesized that “the overexpression of G-CSF can resist the effects of oxygen-glucose deprivation by activating the Notch pathway”.
Material and methods
Vector construction
The ethics committee of our hospital approved this study. The coding sequence for G-CSF was searched by using the National Center for Biotechnology Information website (https://www.ncbi.nlm.nih.gov/pmc/) and then synthesized at General Biosystems, Inc. (Morrisville, USA). The G-CSF gene was introduced into the recognition site of EcoRI/BamHI (Thermo Scientific, MA, USA) and then cloned into a plvxpuro vector (Miaolingbio, Wuhan, China). The correct vector plasmid was identified using the XbaI/BamHI enzyme.
Introduction of granulocyte colony-stimulating factor to oxygen-glucose deprivation in neuronally differentiated PC-12 cells
The PC-12 cells were cultured in the Dulbecco’s Modified Eagle Medium (Hangzhou Sijiqing Biological Engineering Co. Ltd, Hangzhou, China) containing 10% fetal bovine serum (BioInd, CT, USA). When the cell density reached 90%, nerve growth factor (NGF) (Sino Biological, Beijing, China) was added to the medium to reach a final concentration of 150 ng/ml and the PC-12 cells were left to differentiate for 6 days. After the neuronally differentiated PC-12 cells were transfected with G-CSF plasmid DNA or empty vector plasmid DNA (negative control – NC), the cells were cultured in a serum-free media at 37°C with 1% O2, 5% CO2, and 94% N2 for 4 h (G-CSF + OGD or NC + OGD). Alternatively, the cells transfected with the G-CSF plasmid DNA or empty vector plasmid DNA were treated with 20 µmol of MW167 (Merck, Darmstadt, Germany) for 48 h and were then cultured in an OGD model for 4 h (G-CSF + MW167 + OGD or NC + MW167 + OGD, respectively). Meanwhile, the control cells, which were the cells cultured with OGD for 4 h (OGD), and the MW167-treated cells cultured with OGD for 4 h (MW167 + OGD), were used as the corresponding controls. In this study, we used a sugar-free medium and hypoxia incubator.
Immunofluorescence
The cultured cells were washed three times with a phosphate buffer saline for 3 min each time and then fixed with 4% paraformaldehyde for 15 min. After fixing, the cells were washed three times again with PBS for 3 min each time. Next, the cells were penetrated with 0.5% Triton X-100 for 20 min at room temperature and then soaked in PBS for another 3 min. Normal goat serum (ZSGB-BIO, Beijing, China) was incubated with the cells at room temperature for 30 min before incubating the cells overnight at 4°C with anti-NSE antibody (1 : 100; Abcam, Cambridge, UK). Nuclear staining was performed using 4’,6-diamidino-2-phenylindole (DAPI) (KeyGENBioTECH, Nanjing, China) for 5 min. The cells were observed and photographed using fluorescent microscopy.
CCK8
10 µl of CCK8 (KeyGENBioTECH) was added to each cell culture plate prior to the incubation for 4 h. The microplate reader measured the optical density (OD) value at 450 nm. Each experiment was conducted three times. The growth inhibition rate was calculated according to the formula ([OD value of the control group – OD value of the treatment group]/OD value of the control group) × 100%.
Apoptosis detection
The cells on the culture plate were washed with 1 ml of PBS and digested using 200 µl of trypsin containing EDTA at 37°C for 3 min. The resulting cell suspension was centrifuged at 2500 rpm for 3 min and then washed with PBS. After the centrifugation, 300 µl of PBS and 5 µl of Annexin V-FITC (Multisciences) were added to each tube and incubated at room temperature for 10 min. Apoptosis was detected by flow cytometry.
Real-time PCR
The RNA was extracted according to the kit instructions. After determination of the RNA concentration and purity, the cDNA was synthesized via reverse transcription using the HiFiScript cDNA first-strand synthesis kit (Cwbio-tech, Beijing, China). Real-time PCR was performed according to the kit instructions. The primer sequences used were as follows: Notch1-f: AATGTGGATGCCGCAGTTG; Notch1-R: ATCCGTGATGTCCCGGTTG; Notch2-F: AGCTGCTACTCACAGGTGAACGAA; Notch2-R: CCAGCCTGCATCACAGAGACA; Jagged1-f: CCAGGTCTTTGAGAACTCCAGATG; Jagged1-R: TGACCAGAGCAGGCA GATGAA; Jagged2-f: CCAGGAAGTGGTCATATTCACGA; Jagged2-R: GCA GACAAG GCTTCCAACCAC; HIF-1α-F: CGTTCCTTCGATCAGTTGTC; HIF-1α-R: TCA GTGGTGGCAGTGGTAGT; G-CSF-f: CCAACTTTGCCACCACCATC; G-CSF-R: GAAG CCCTGCAGGTACGAAA; NF-κB-F: ATCTGTTTCCCCTCATCTTTCC; NF-κB-R: TGG GTGCGTCTTAGTGGTATCT; GAPDH F: CAATGACCCCTTCATTGA CC; GAPDH R: GAGAAGCTTCCCGTTCTCAG.
Western blot
The cells were harvested and lysed in a radioimmunoprecipitation assay lysis buffer for 30 min at 4°C. The total protein was obtained after centrifugation at 12 000 rpm/min for 10 min at 4°C. After the protein concentration was determined using a BCA kit (Cwbiotech), the protein was separated by sodium dodecyl sulfate-polyacrylamide gel electrophoresis and blotted onto a nitrocellulose membrane (Bio-Rad, California, USA). The membranes were incubated with primary antibodies anti-actin (ZSGB-BIO), anti-Notch1 (Abcam), anti-Notch2 (Cell Signaling, MA, USA), anti-Jagged 1 (ImmunoWay, TX, USA), anti-Jagged 2 (Cell Signaling), anti-G-CSF (Abcam), anti-NF-κB (Abcam), or anti-HIF-α (Bioss, Beijing, China), at 4°C overnight. After a few washes, the appropriate horseradish peroxidase-labeled secondary antibodies (ZSGB-BIO) were added and the mixtures were incubated at room temperature for 1–2 h. The blots were visualized using an enhanced chemiluminescence exposure solution (Thermo Scientific) in a gel imaging system. The gray value for each protein strip was analyzed using the Image-Pro Plus software (Media Cybernetics, Inc., MD, USA).
Statistical analysis
SPSS 20.0 software (IBM, USA) was used for statistical analysis. Continuous variables were expressed as mean ± SD. Discontinuous variables were expressed as a percentage (%). For the multiple comparisons, each value was compared by a one-way ANOVA following the Dunnett test when the data conformed to a normal distribution, while the non-normally distributed continuous data were compared using non-parametric tests. The counting data were tested by a χ2 test. A value of p < 0.05 was considered statistically significant.
Results
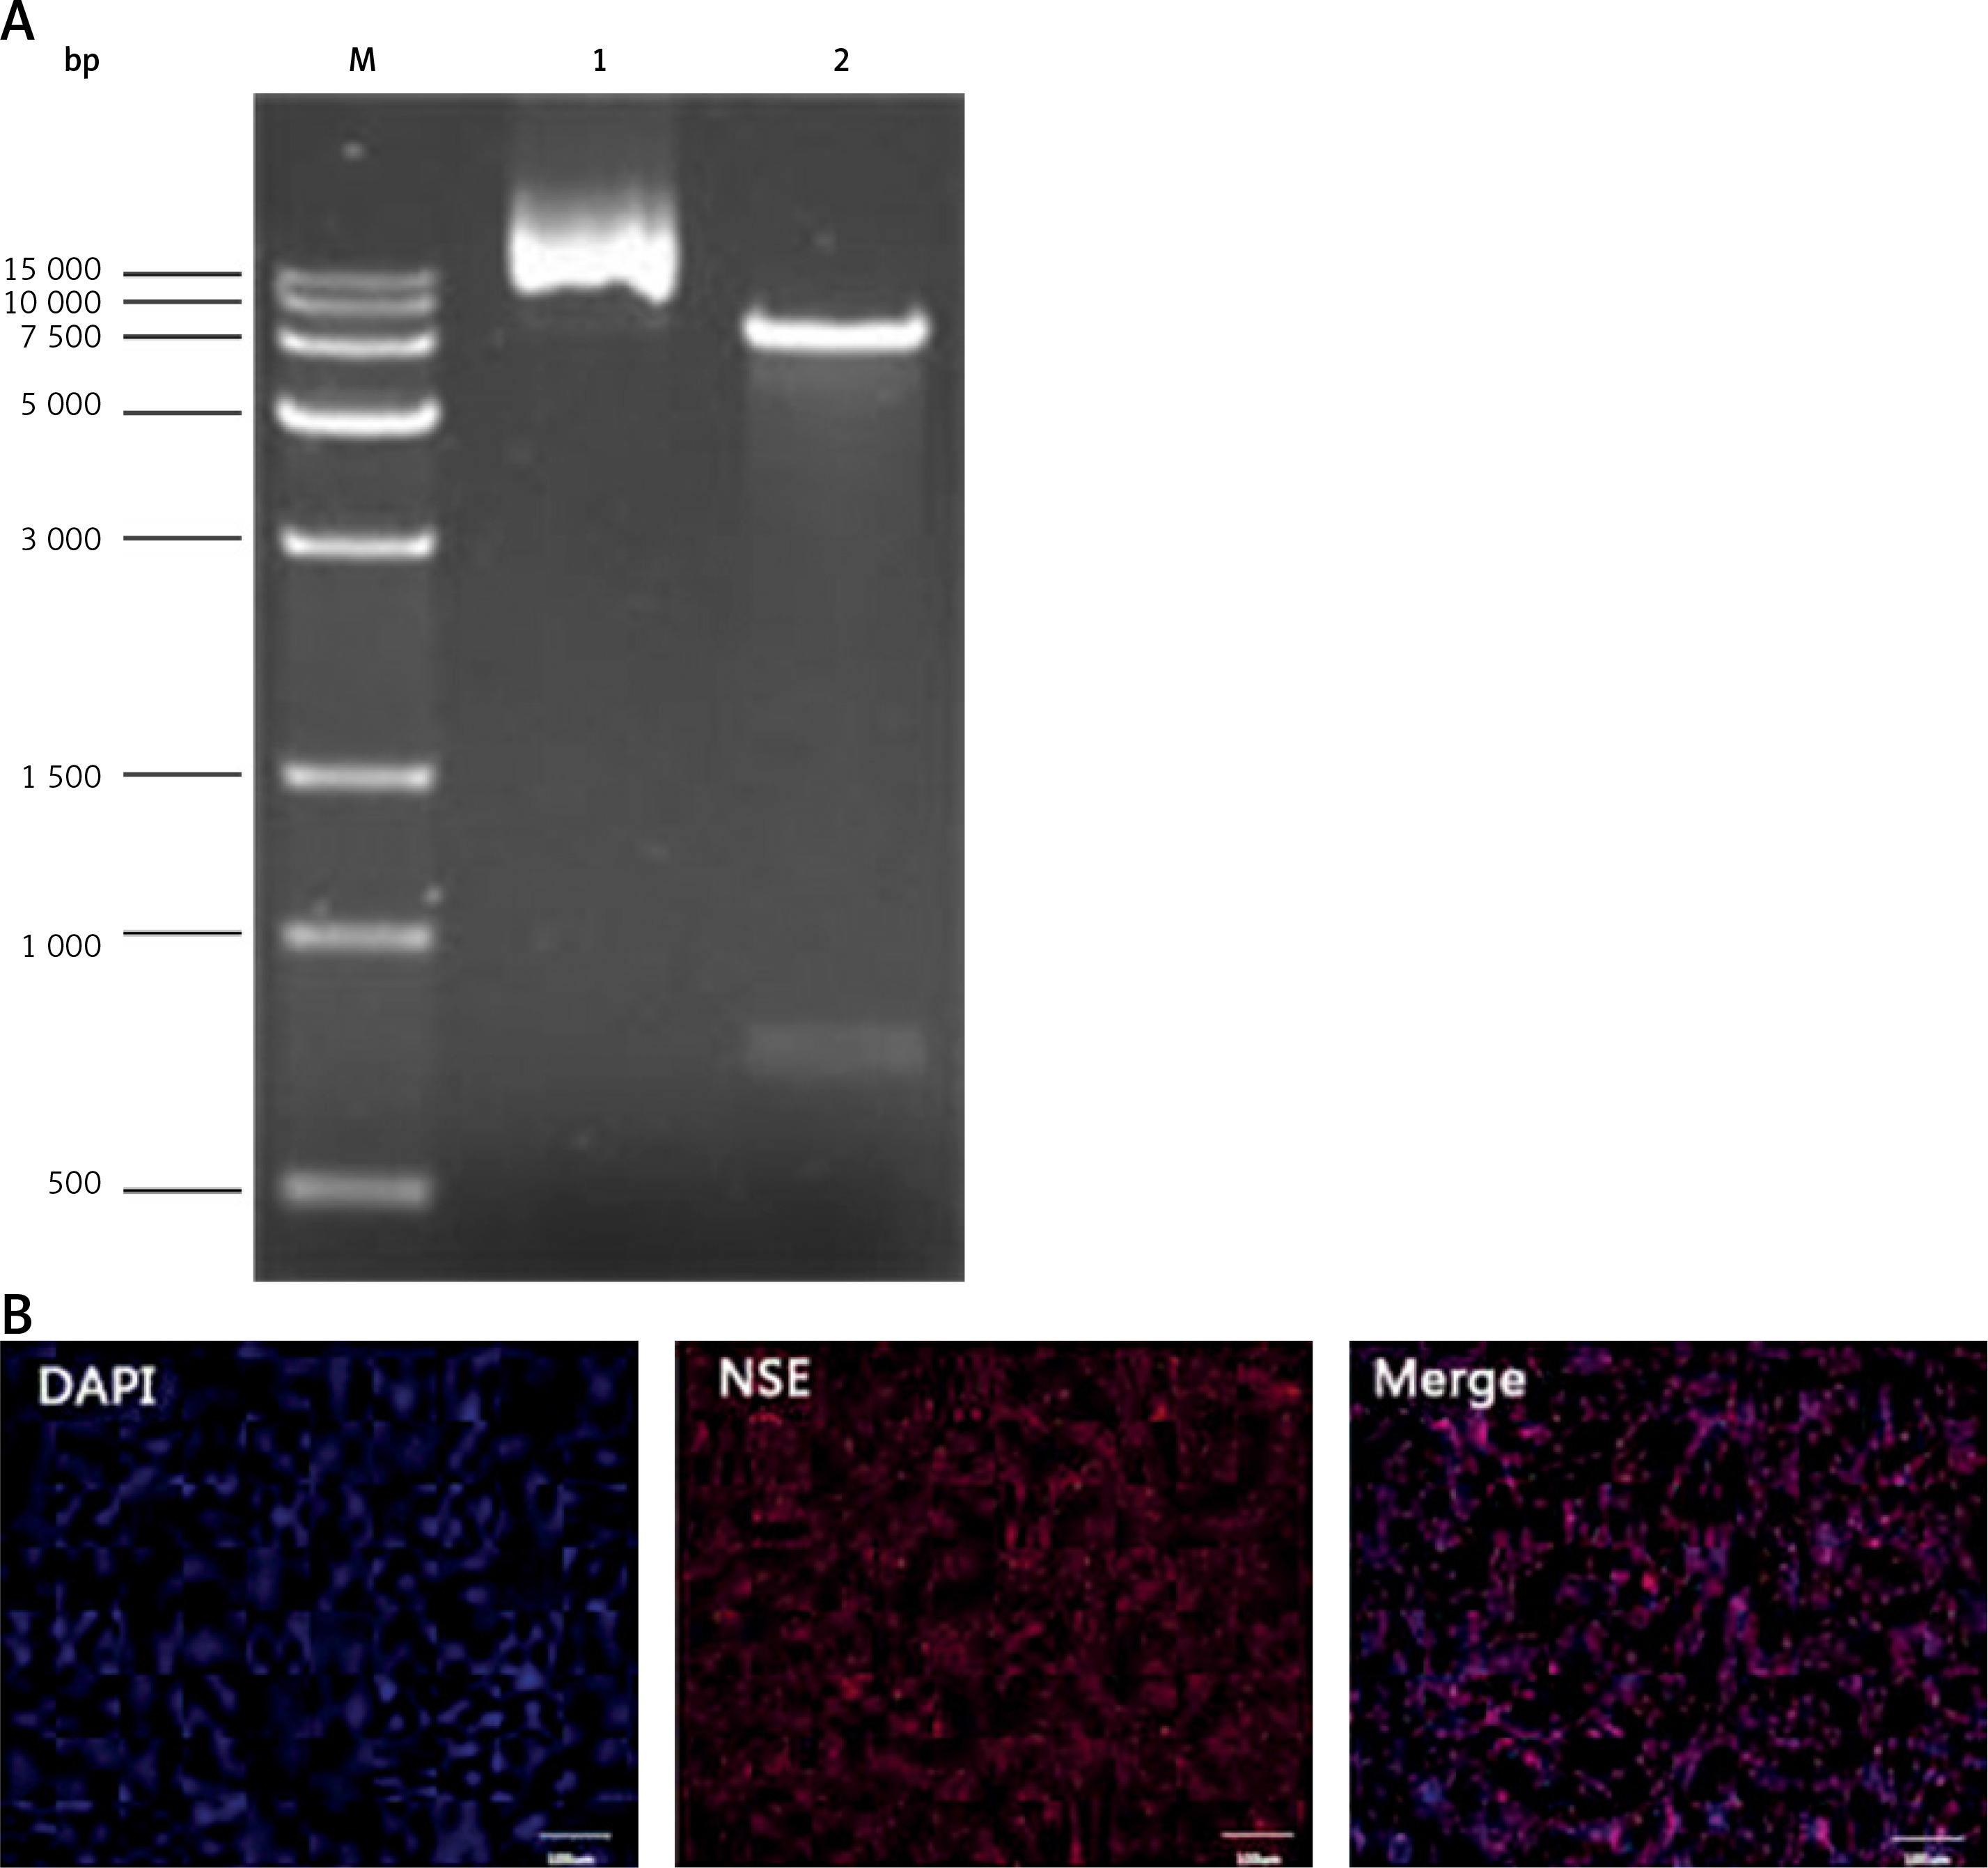
Identification of the vector plasmid and neuronally differentiated PC-12 cells
The plasmid DNA was digested using enzymes, XbaI and BamHI, and then separated using 1% agarose gel electrophoresis. The results showed that the molecular weight of the digested product was consistent with the theoretical value (Figure 1 A).
After the nerve growth factor (NGF) induction, the PC-12 cells were labeled with the anti-NSE antibody using immunofluorescence. Most of the cells were NSE-positive, and a long spindle-shaped morphology was visible for the NSE-positive cells (Figure 1 B).
Figure 1
Identification of vector plasmid and neuronally differentiated PC-12 cells. A – Electrophoresis diagram of plasmid plvxpuro-G-CSF (lane 2) digested with XbaI/BamHI. Lane 1: empty plasmid plvxpuro; Lane M: DL15000 marker. B – Immunocytochemical assays performed using antibodies against neuron-specific marker NSE after PC-12 cell treatment with nerve growth factor (NGF) for 6 days. Nuclei were labeled with DAPI. Bars equal 100 μm. Each experiment was repeated 3 times
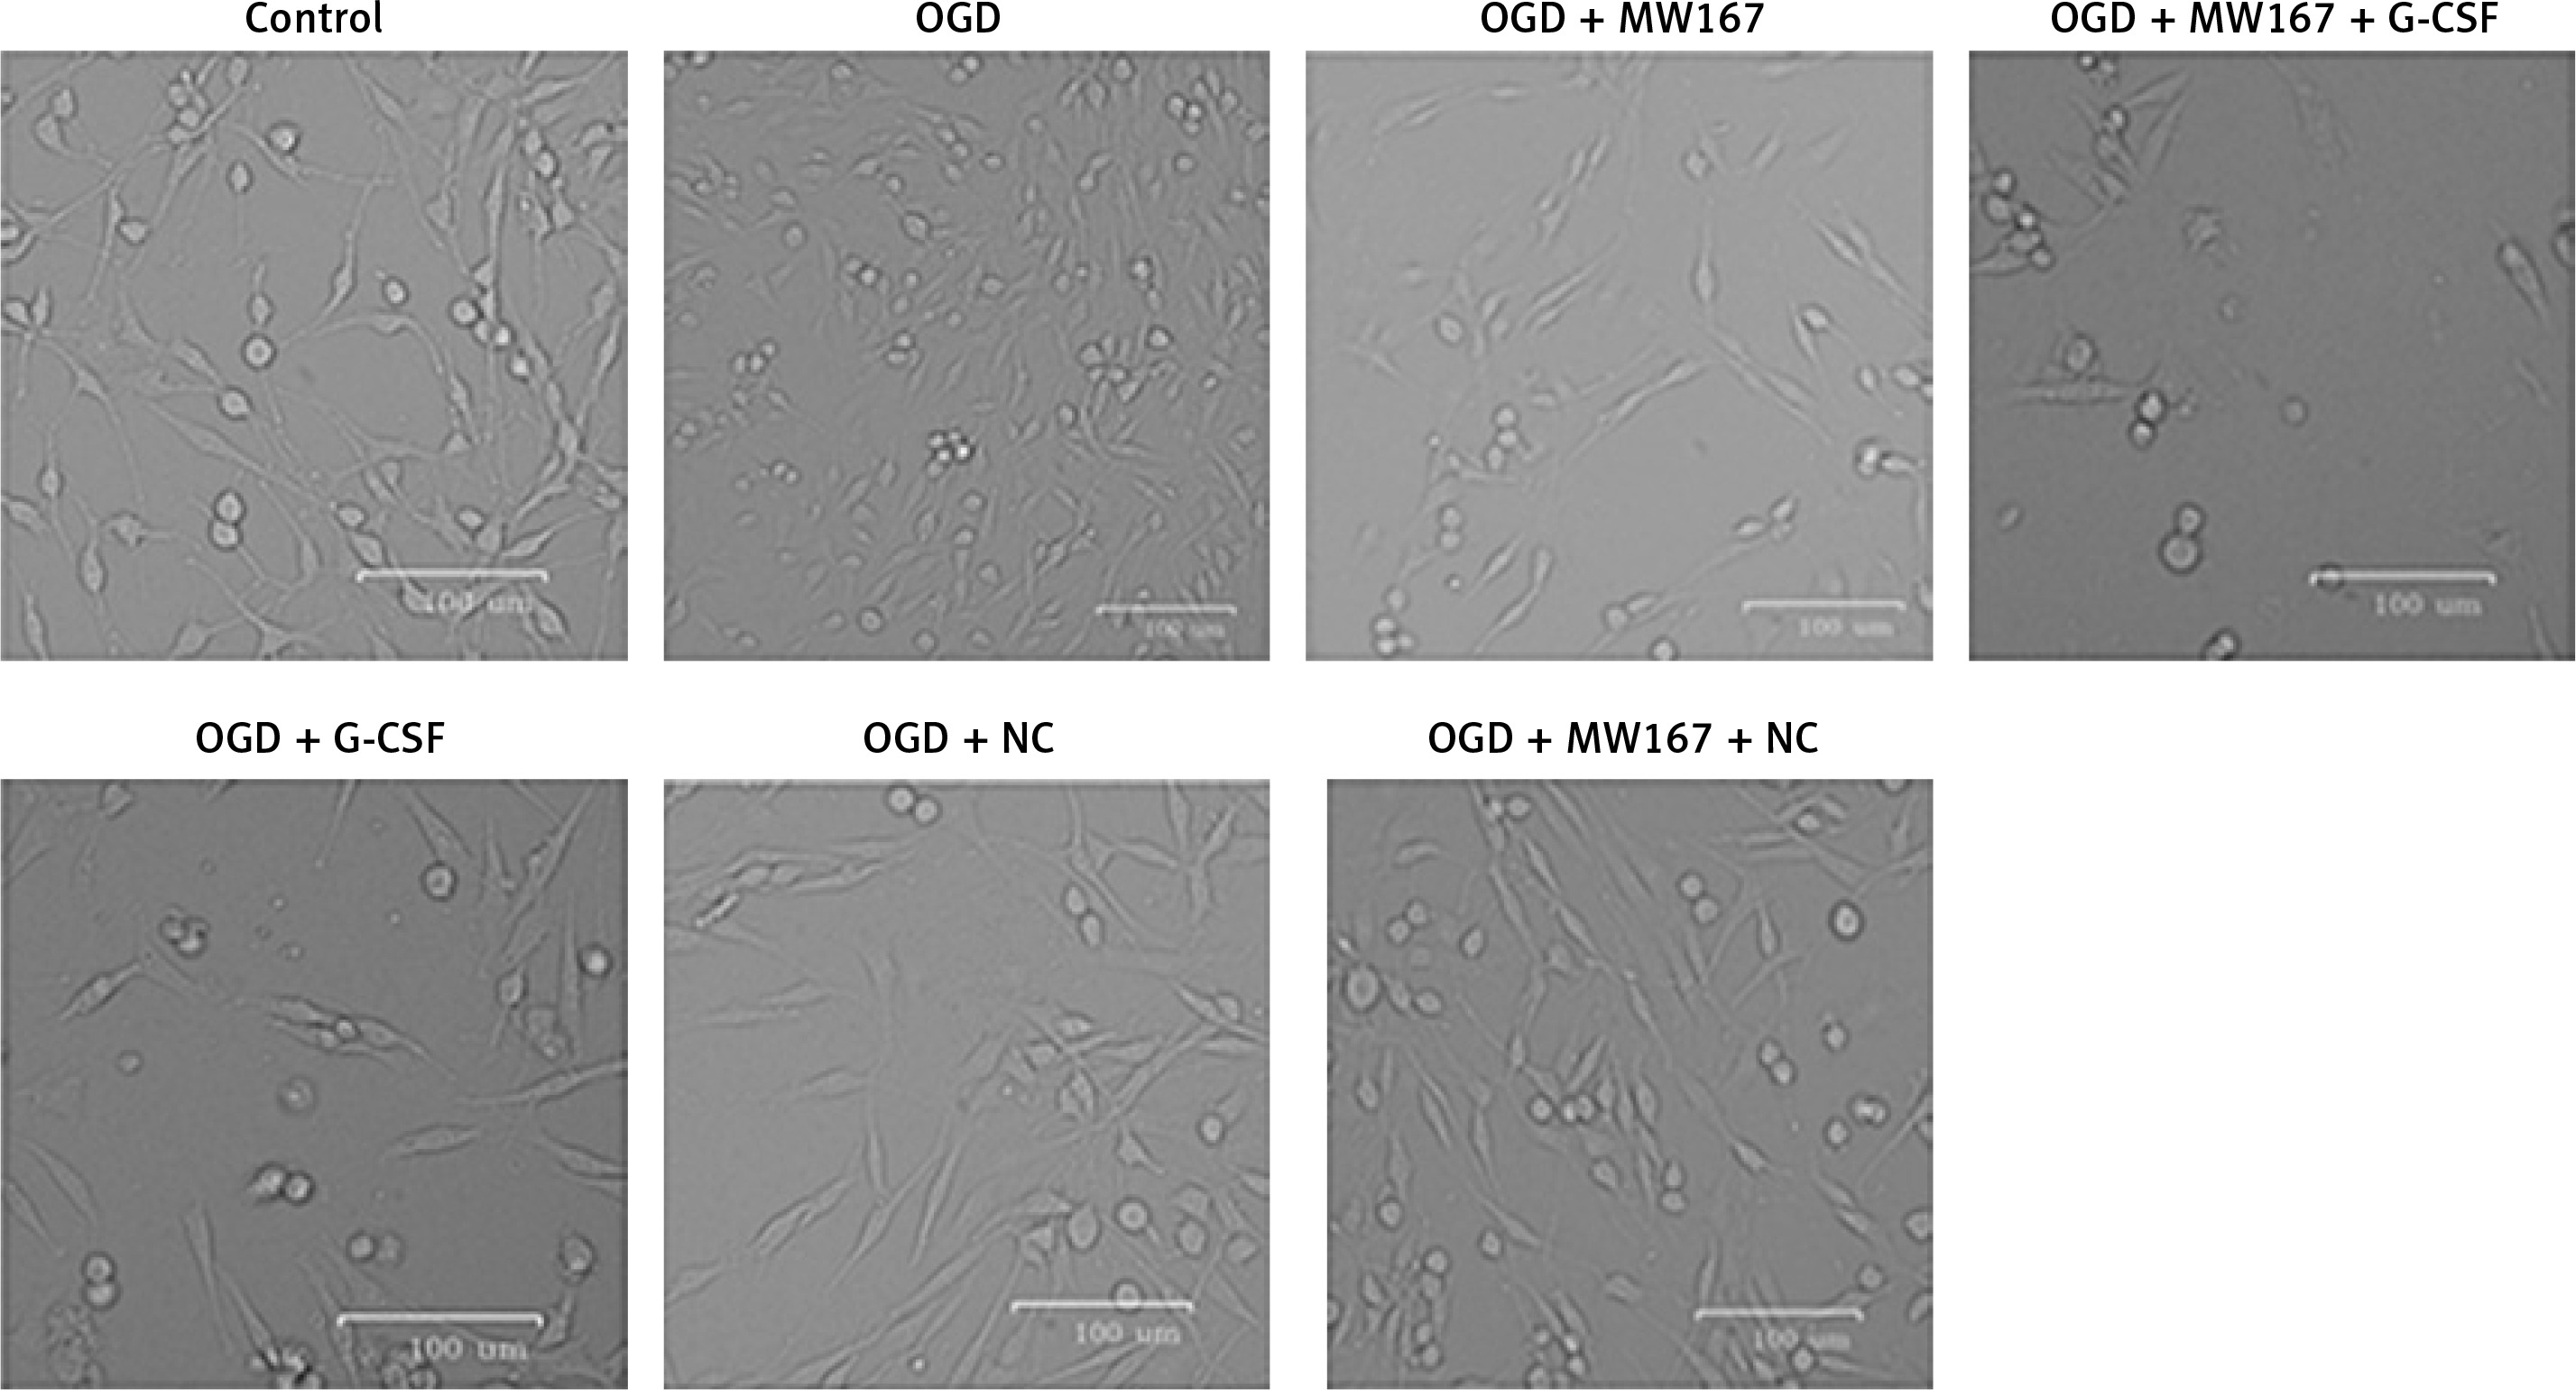
Effects of G-CSF on morphology of neuronally differentiated PC-12 cells in OGD model
Before treatment (control), the cells were plump and had a long spindle shape. Following the oxygen and glucose deprivation, the synapses disappeared, they had developed a rounded morphology, and gradually underwent apoptosis. Compared with the corresponding control groups, the G-CSF overexpression attenuated the effects of the hypoxic, glucose-free environment (G-CSF + OGD) on the PC-12 cell morphology. However, the addition of MW167 (G-CSF + MW167 + OGD) neutralized the protective effect of the granulocyte colony-stimulating factor in the oxygen-glucose deprivation model (Figure 2).
Figure 2
Effects of granulocyte colony-stimulating factor (G-CSF) on morphology of neuronally differentiated PC-12 cells. Representative pictures of neuronally differentiated PC-12 cells after treatment without (control) or with OGD, OGD + G-CSF, OGD + NC, OGD + MW167, OGD + MW167 + G-CSF, or OGD + MW167 + NC. Bars equal 100 μm. Each experiment was repeated 3 times
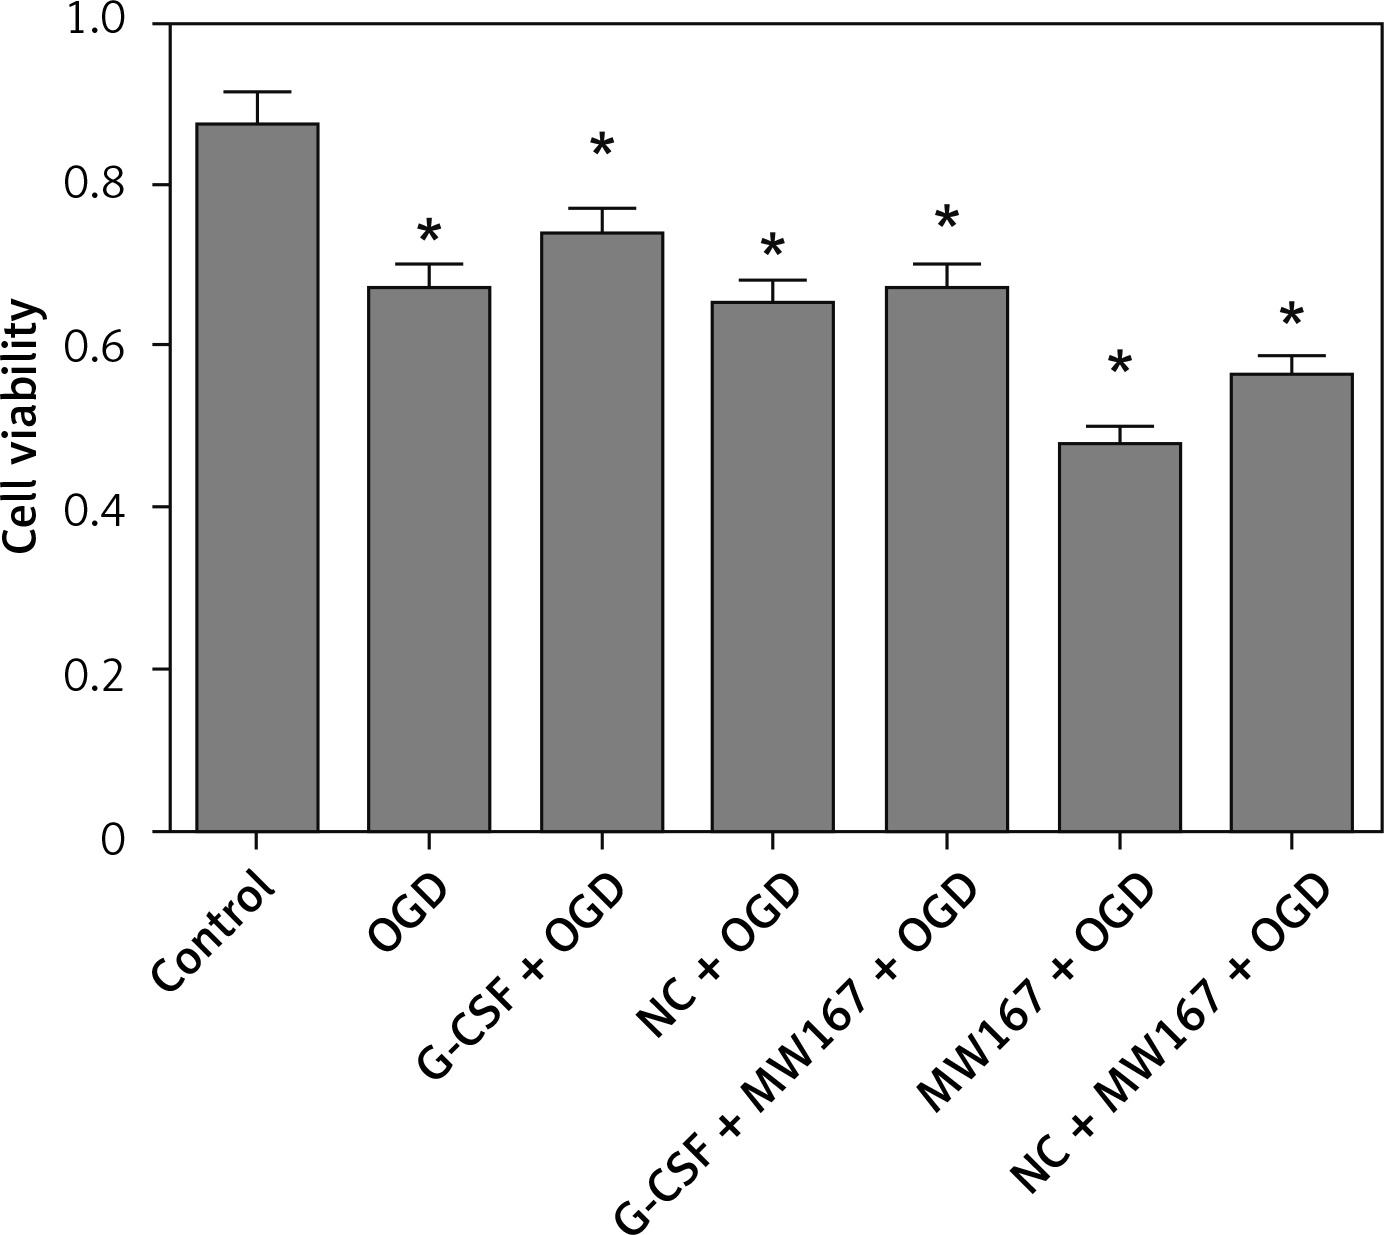
Effects of G-CSF on viability of neuronally differentiated PC-12 cells in OGD model
Compared to the control group, OD for CCK8 in all the other groups was decreased. Among these, the MW167 + OGD and the (NC) NC + MW167 + OGD groups had the lowest OD values for CCK8. However, the G-CSF + OGD group had the highest OD value for CCK8; this value was markedly increased compared to those of the MW167 + OGD and NC + MW167 + OGD groups (Figure 3).
Figure 3
Effects of granulocyte colony-stimulating factor (G-CSF) on cell viability of neuronally differentiated PC-12 cells. The cell viability rate of neuronally differentiated PC-12 cells after treatment without (control) or with OGD, G-CSF + OGD, NC + OGD, MW167 + OGD, G-CSF + MW167 + OGD, or NC + MW167 + OGD; *p < 0.05. Each experiment was repeated 3 times
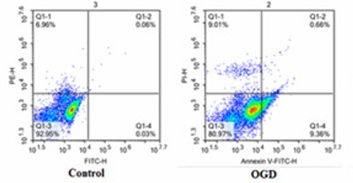
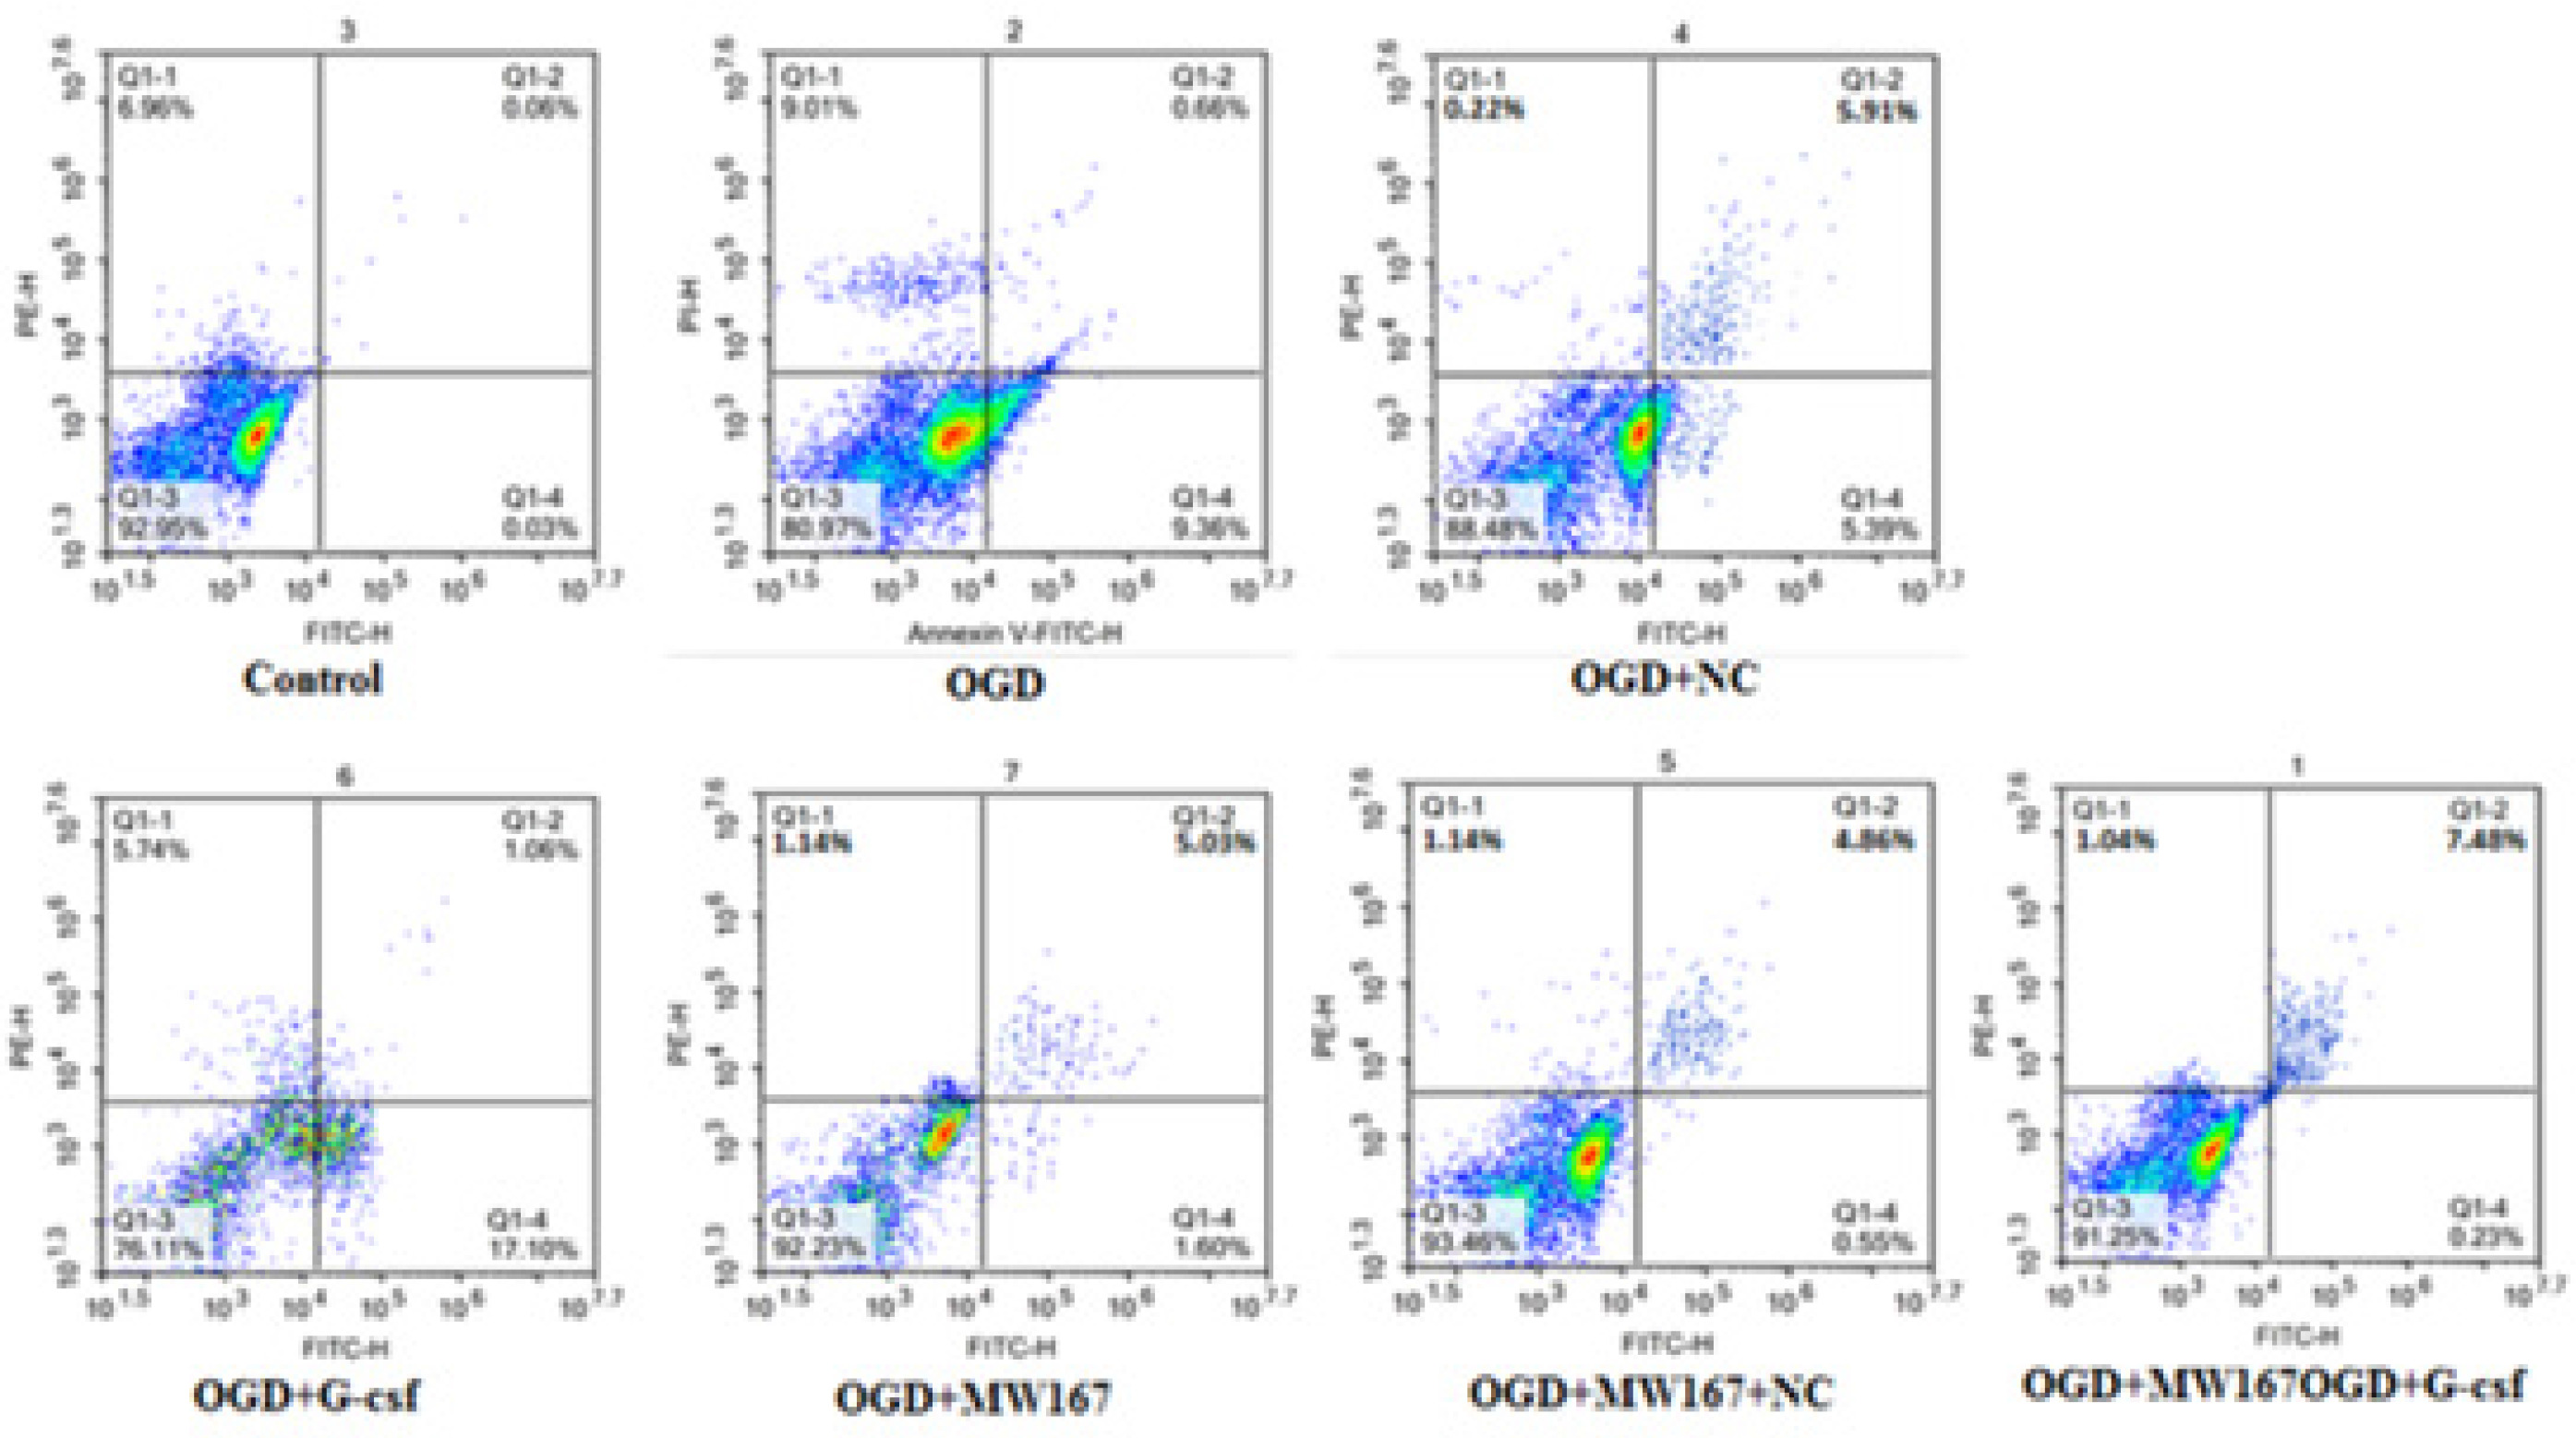
Effects of G-CSF on apoptosis of neuronally differentiated PC-12 cells in OGD model
As shown in Figure 4 and Table I, apoptosis was increased in all the experimental groups when compared to the control group. However, compared to the OGD group, apoptosis was decreased in the G-CSF + OGD group and increased in the MW167 + OGD and NC + MW167 + OGD groups.
Table I
Percentage of apoptotic cells in each experimental group
| Group | Rate of apoptotic cells (%) |
|---|---|
| Control | 0.09 |
| OGD | 10.02 |
| OGD + G-CSF | 6.63 |
| OGD + NC | 11.30 |
| OGD + MW167 | 18.16 |
| OGD + MW167 + G-CSF | 7.71 |
| OGD + MW167 + NC | 17.41 |
Figure 4
Effects of granulocyte colony-stimulating factor (G-CSF) on apoptosis of neuronally differentiated PC-12 cells. Scatter plots of apoptotic cells detected by flow cytometry in neuronally differentiated PC-12 cells after treatment without (control) or with OGD, G-CSF + OGD, NC + OGD, MW167 + OGD, G-CSF + MW167 + OGD, or NC + MW167 + OGD. Each experiment was repeated 3 times
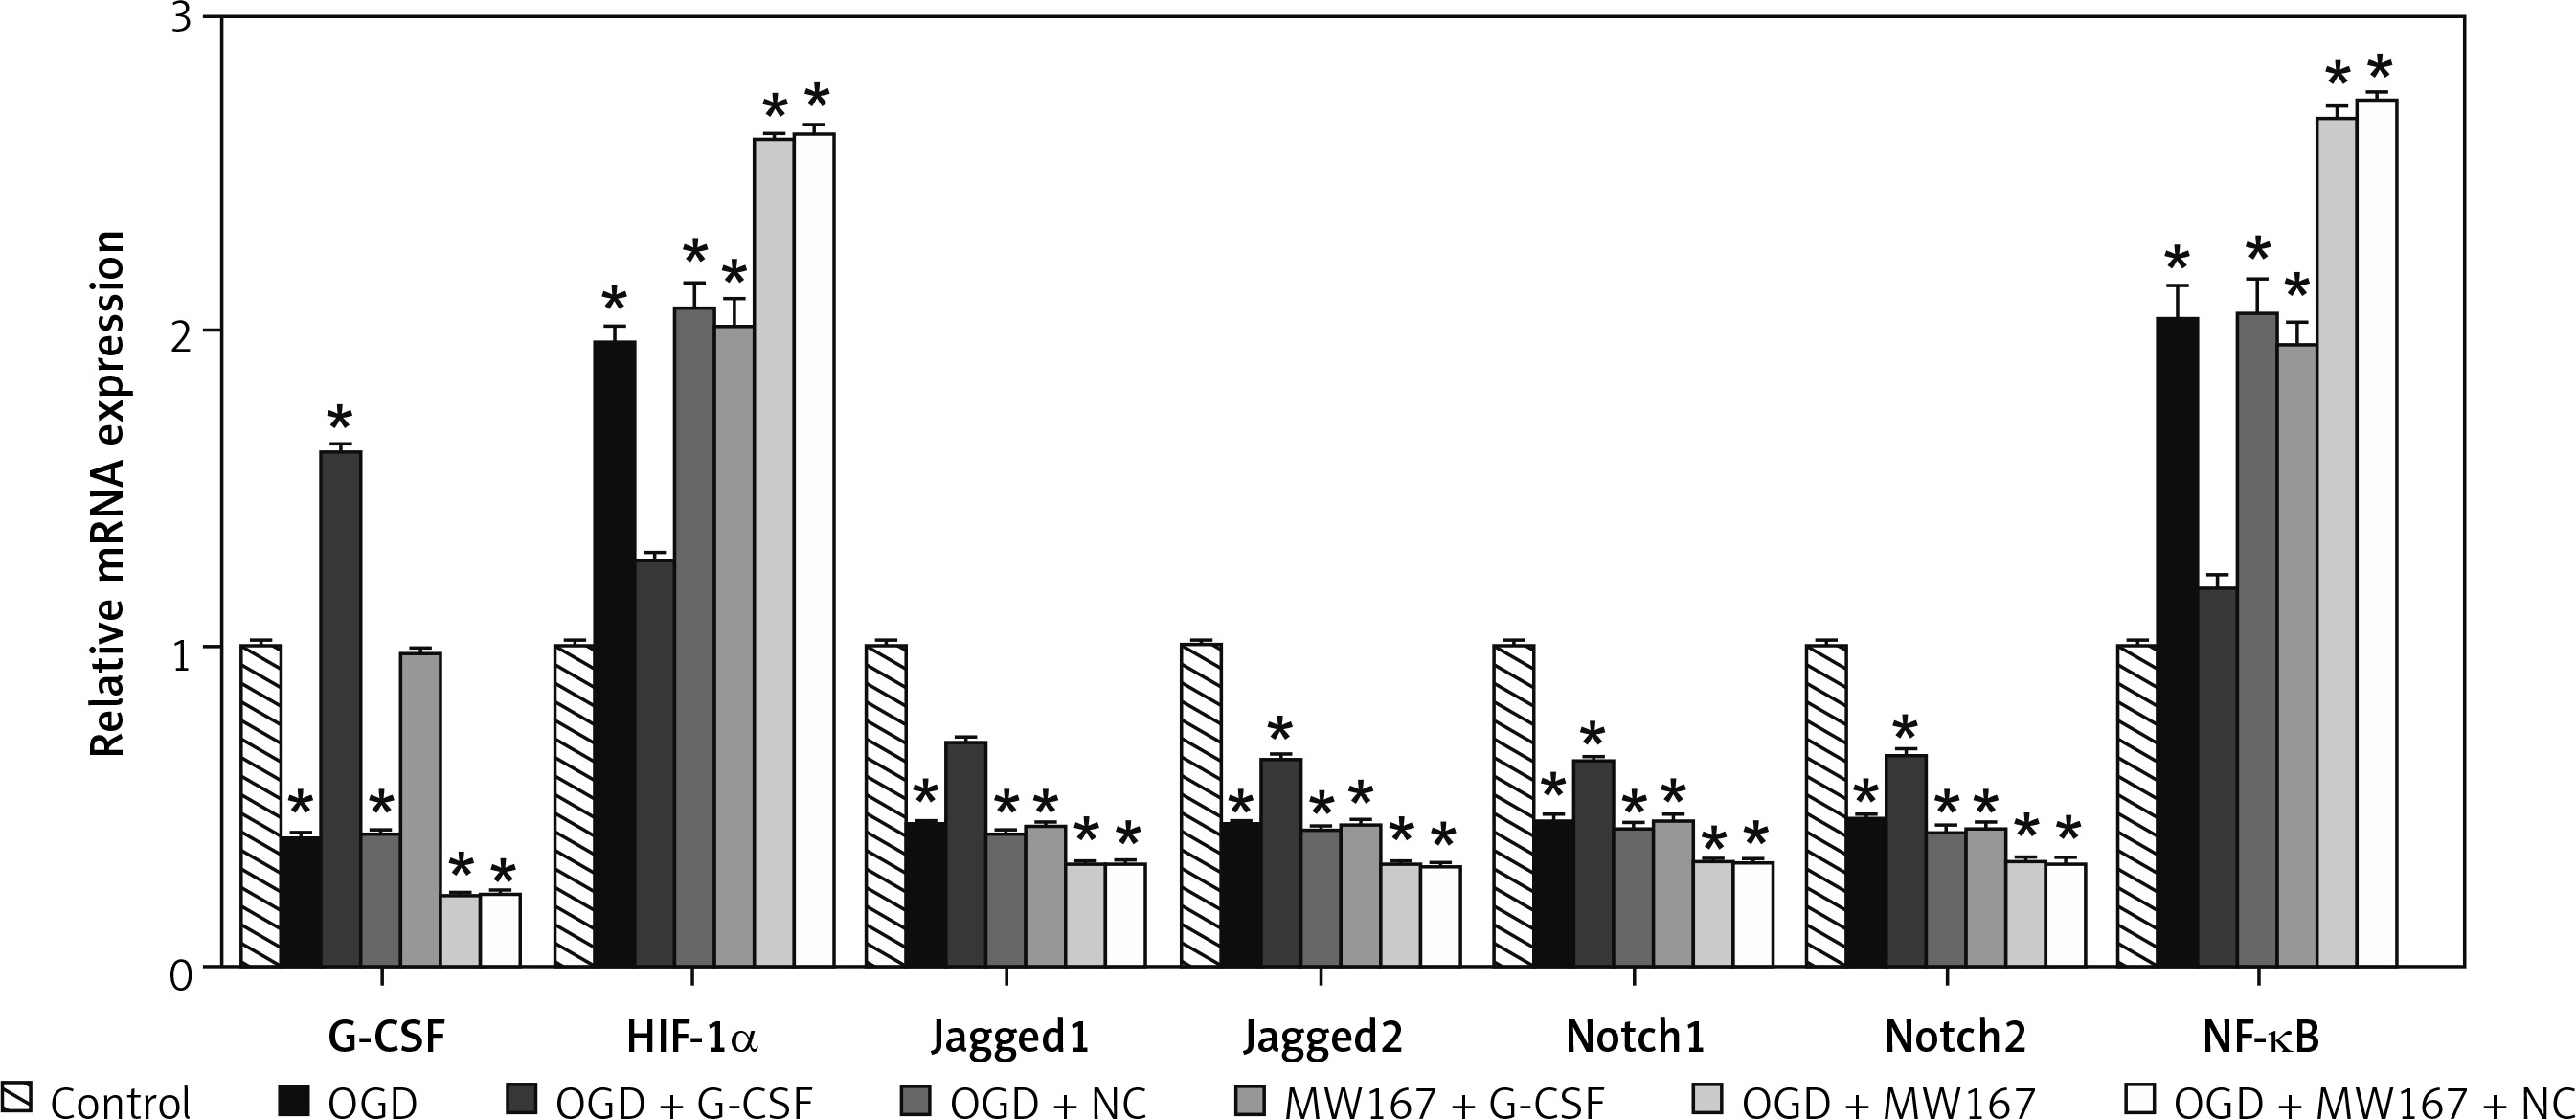
Gene expression changes related to the Notch pathway
Compared to the control group, the expression of Jagged1, Jagged2, Notch1, and Notch2 was reduced, whereas the expression of hypoxia-inducing factor-1α (HIF-1α) and NF-κB increased markedly in the OGD group. In the G-CSF + OGD group, the expression of Jagged1, Jagged2, Notch1, and Notch2 was relatively higher, whereas the expression of HIF-1α and NF-κB was relatively lower. There was no significant difference between the NC + OGD and OGD groups. In both G-CSF + MW167 + OGD group and the G-CSF group, the Notch1 and Notch2 expression was increased. The Jagged1, Jagged2, Notch1, and Notch2 expression was decreased but the NF-κB and HIF-1α expression was increased in the NC + OGD +MW167 group. However, when compared with the OGD group, the expression of HIF-1α and NF-κB in the G-CSF + OGD group was decreased and the expression of Jagged1, Jagged2, Notch1, and Notch2 was increased. The expression of HIF-1α and NF-κB in the MW167 + OGD group increased and the expression of Jagged1, Jagged2, Notch1, and Notch2 decreased. The Notch1 and Jagged1 expression increased in the G-CSF + MW167 + OGD and the G-CSF groups (Figure 5).
Figure 5
Gene expression changes related to the Notch pathway. Real-time PCR results for Notch-related gene expression in neuronally differentiated PC-12 cells after treatment without (control) or with OGD, G-CSF + OGD, NC + OGD, MW167 + OGD, G-CSF + MW167 + OGD, or NC + MW167 + OGD. Each experiment was repeated 3 times
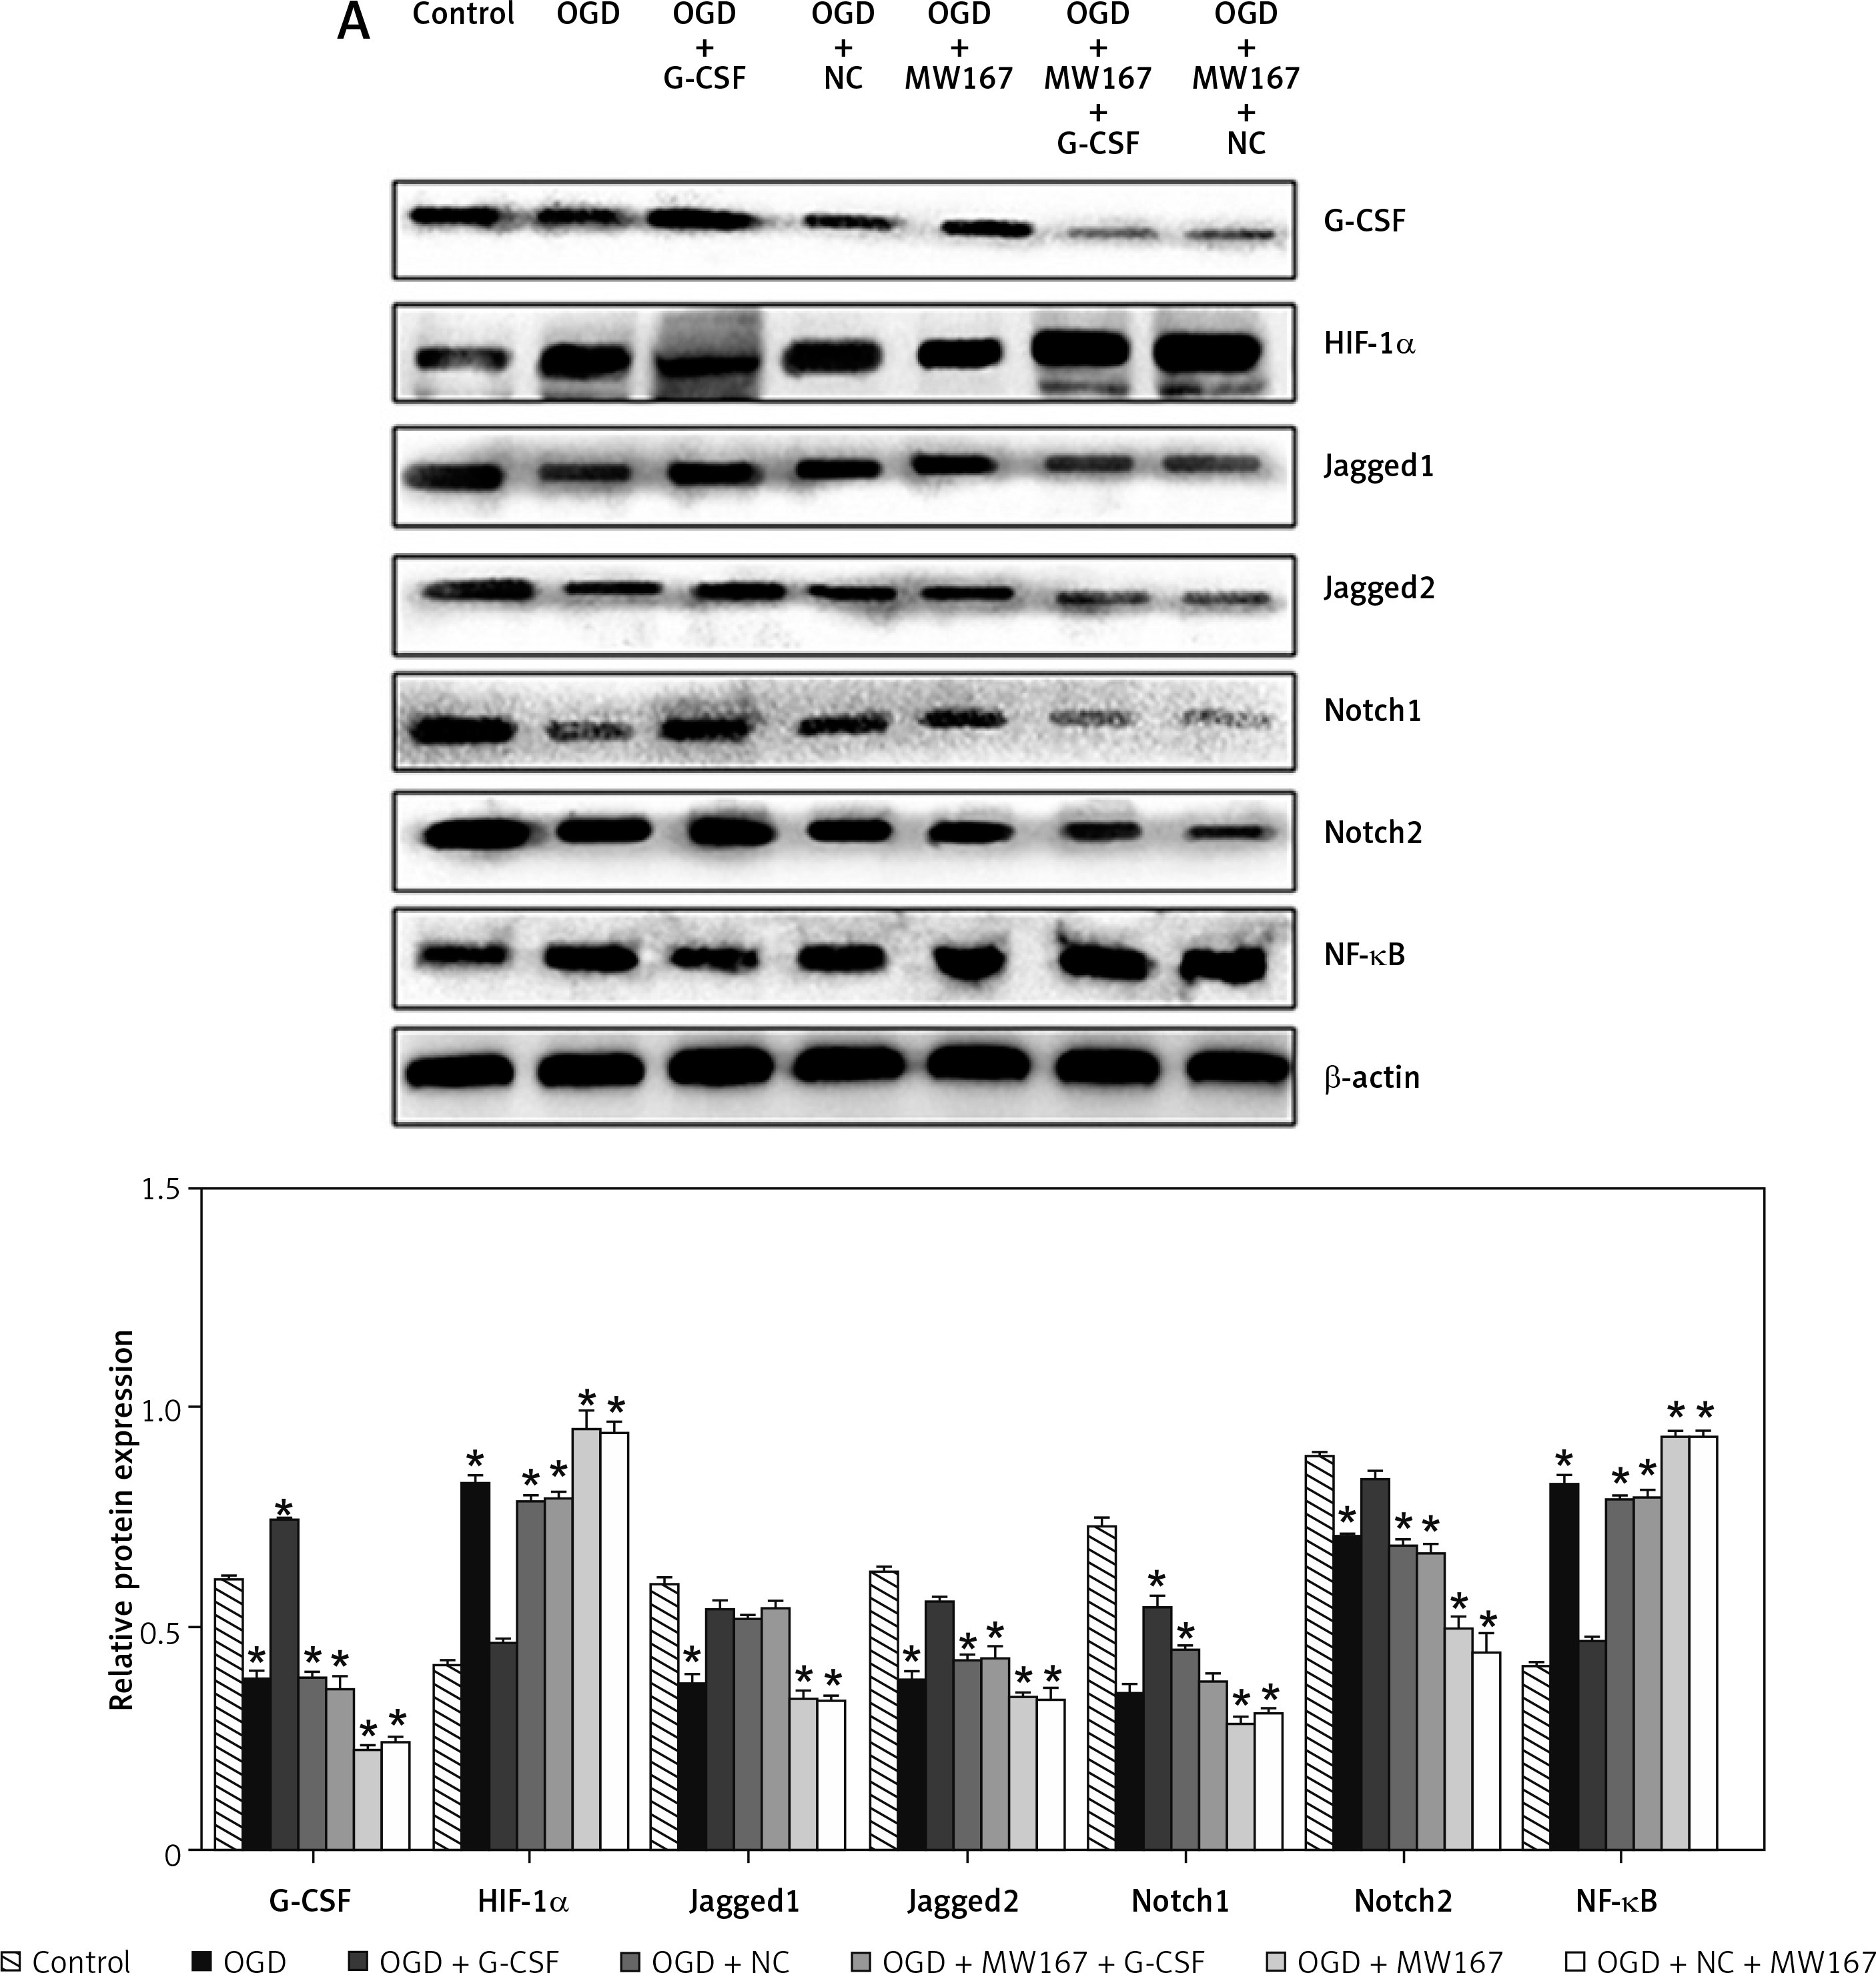
Protein expression changes related to the Notch pathway
Compared to the control group, the protein expression for Jagged1, Jagged2, Notch1, and Notch2 was relatively decreased, whereas the protein expression for HIF-1α and NF-κB was relatively increased in OGD group. The protein expression for Jagged1, Jagged2, Notch1, and Notch2 was relatively increased in G-CSF + OGD group, whereas the protein expression for HIF-1α and NF-κB was relatively decreased. There was no difference between the NC + OGD and the OGD group in protein expression. The expression of protein Notch1 and Notch2 in the G-CSF + MW167 + OGD group and the G-CSF group was increased. In the NC + MW167 + OGD group, the expression of protein Jagged1, Jagged2, Notch1, and Notch2 was relatively decreased, whereas the expression of NF-κB and HIF-1α was relatively increased. Compared with the OGD group, the expression of HIF-1α and NF-κB decreased and the expression of Jagged1, Jagged2, Notch1, and Notch2 increased in the G-CSF + OGD group. The expression of HIF-1α and NF-κB in the MW167 + OGD group increased and the expression of Jagged1, Jagged2, Notch1, and Notch2 decreased. The expression of Notch1 and Jagged1 was increased in the G-CSF + MW167 + OGD and the G-CSF groups (Figure 6).
Figure 6
Protein expression changes related to the Notch pathway. Western blot results for Notch-related protein expression in the neuronally differentiated PC-12 cells after treatment without (control) or with OGD, G-CSF + OGD, NC + OGD, MW167 + OGD, G-CSF + MW167 + OGD, or NC + MW167 + OGD (upper panel). The protein shown in the upper panel was quantified after a densitometric scan and normalized to β-actin from three independent experiments (lower panel); *p < 0.05. Each experiment was repeated 3 times
Discussion
We conducted this trial to investigate the relationship between G-CSF and the Notch signaling pathway in ischemic brain injury. The outcomes of this study showed that most of the PC-12 cells were neuron-specific enolase (NSE)-positive after NGF treatment. The CCK8 experiment showed that compared with the control group, the MW167 + OGD and NC + MW167 + OGD groups had OD values, followed by the OGD, NC + OGD, and G-CSF + MW167+ OGD groups; the G-CSF + OGD group had the highest OD value. Concerning apoptosis detection, the control group had the lowest apoptosis rate. The highest apoptosis rates were found in the MW167 + OGD, the OGD, and then the G-CSF + OGD groups. Both the PCR and Western blotting assays showed that the expression of Notch1 and Jagged1 was higher, whereas HIF-1α and NF-κB expression was lower in the G-CSF + OGD group compared to the control group. However, the expression levels of Notch1, Notch2, and Jagged1 were decreased in the G-CSF + MW167 + OGD group. These results suggest that G-CSF overexpression may inhibit apoptosis and expression of HIF-1α and NF-κB but may promote expression of Jagged1, Jagged2, Notch1, and Notch2 in neuronally differentiated PC-12 cells that are subjected to oxygen-glucose deprivation. Therefore, overexpression of G-CSF can resist the effects of oxygen-glucose deprivation by activating the Notch pathway.
Although the neuroprotective effect of G-CSF in an ischemic brain injury model has been reported previously, its mechanism is not yet clear. Schneider et al. used a rat stroke model to show that G-CSF could promote the proliferation of neonatal vascular endothelial cells after cerebral ischemia [8]. Gibson et al. also found that G-CSF could decrease peri-infarct edema and decrease the infarct volume to improve motor functions [9]. Jung et al. confirmed that, after G-CSF binds its receptor on NSCs, the number of cells expressing the mature neuron marker, NSE, increases [10]. These findings suggest that G-CSF may promote nerve regeneration. Several in vivo and in vitro studies indicate that G-CSF may play a neuroprotective role through a variety of anti-apoptotic signaling pathways [11]. The known signal transduction pathways associated with ischemic brain damage include JAK/STAT, PI3K/AKT, Wnt/β-catenin, Notch, and NF-κB. Among these signaling pathways, the Notch pathway is highly conserved, existing in several invertebrate and vertebrate species. This pathway is also involved in the biologic development where it produces paracrine effects on the adjacent cells. Thus, the Notch pathway is involved in regulating cellular proliferation, differentiation, and apoptosis in nearly all tissues and organs [12]. The mechanism by which the Notch pathway is involved in nervous system diseases (especially ischemic brain injury) is gaining increased attention [13].
Previous research has also shown that Notch proteins and pathway-related proteins are expressed in the central nervous system (CNS) [14] and that the Notch signaling pathway may play an important role in nervous system physiology and CNS pathology [15]. In this study that used an OGD model, the Notch pathway was blocked by its inhibitor, MW167, in the neuronally differentiated PC-12 cells that overexpressed G-CSF. The flow cytometry also showed that the apoptosis rate in the G-CSF + OGD group was similar to that of the control group with the lowest rate and suggested that G-CSF overexpression could inhibit cell apoptosis in an OGD model. After the addition of the Notch signal blocker MW167, the apoptosis rate in the MW167 + OGD group was the highest, with no difference between the G-CSF + MW167 + OGD and G-CSF + OGD groups. NF-κB and HIF-1α, which can be specifically activated in the ischemic CNS, are closely related to cerebral ischemia and reperfusion injury [16]. NF-κB is a multi-directional transcription factor that is commonly found in various human tissues, with its homologous or heterologous dimer protein belonging to the nf-tcB/Rel family [17]. By regulating gene expression, NF-κB participates in various biologic processes such as immunity, inflammation, and apoptosis [18]. In recent years, research has shown that NF-κB is also present in the brain vascular endothelial cells, neurons, and glial cells. During ischemic CNS injury, NF-κB can be activated to induce inflammatory gene expression, thereby promoting injury due to brain ischemia [19]. The hypoxia-inducing factor-1α is a transcriptional regulation factor that helps cells adapt to low oxygen environments and recover homeostasis. It also stabilizes the cell cycle that is related to survival and energy metabolism. During ischemic-hypoxic brain injury, a series of genes are activated to improve energy metabolism, restore cerebral blood flow dynamics, promote or inhibit apoptosis, and induce autophagy. The hypoxia-inducing factor-1α plays an important role in regulating survival, apoptosis, inflammation, and angiogenesis in the neurons following cerebral ischemia [20]. Furthermore, previous studies have also shown that HIF-1α can activate erythropoietin, vascular endothelial growth factor, and tumor suppressor genes p53 and BNIP3, which play important roles in the occurrence and development of ischemic-hypoxic brain injury [21]. In this study, both mRNA and the protein levels for Notch pathway molecules were analyzed using real-time PCR and Western blot assays. The molecules included the extracellular receptors Notch1 and Notch2 the ligands Jagged1 and Jagged2 [22], and the ischemia-reperfusion-related molecules HIF-1α and NF-κB. The results showed that the overexpressed G-CSF could increase the Notch1, Notch2, Jagged1, and Jagged2 expression and decrease the HIF-1α and NF-κB expression. The blocking of the Notch pathway with MW167 also attenuated the effects of G-CSF.
Limitations: 1) a more detailed understanding of the mechanism of the Notch signaling pathway in ischemic brain injury requires further exploration; 2) the mechanism of cell proliferation and differentiation after cerebral ischemia must be further clarified to address the clinical treatment of acute cerebral ischemic disease.
In conclusion, the blocking of the Notch pathway can attenuate granulocyte colony-stimulating factor effects, whereas G-CSF overexpression can activate the Notch pathway to resist the effects of oxygen-glucose deprivation.