Introduction
Heart failure (HF) is the fastest growing cardiovascular syndrome and is becoming a major public health problem worldwide because of high morbidity and mortality [1]. While pharmacological therapy has significantly improved clinical outcome in patients with HF and reduced ejection fraction (HFrEF), a subgroup still remains symptomatic and with poor quality of life [2]. This limited clinical improvement urged researchers and clinicians to identify other therapeutic potentials that could alleviate symptoms in such patients [3], particularly those requiring cardiac resynchronisation therapy (CRT) [4].
Despite being considered the best treatment for symptomatic HF patients on full medical therapy, one third of subjects receiving CRT do not respond [5, 6]. Responders to CRT treatment have shown strong evidence for improved cardiac performance and also a benefit of reducing atrial arrhythmia, which has been interpreted on the basis of reverse remodelling of the left atrium (LA) [7]. Debate remains, however, regarding the exact explanation of CRT failure in a substantial percentage of patients [8–10]. The aim of this meta-analysis was to assess the potential relationship between CRT response and LA volume changes, particularly in patients who respond favourably.
Material and methods
We followed the 2009 guidelines preferred reporting items for systematic reviews and meta-analysis (PRISMA) statement [11], amendment to the Quality of Reporting of Meta-analyses (QUOROM) statement [12]. Due to the study design (meta-analysis), neither Institutional Review Board (IRB) approval nor patient informed consent was needed.
Search strategy
We systematically searched PubMed-Medline, EMBASE, Scopus, Google Scholar, the Cochrane Central Registry of Controlled Trials, and Clinical-Trial.gov up to August 2018, using the following key words: “Cardiac resynchronization therapy” OR “CRT” AND “Left atrial volume” OR “Left atrial volume indexed” OR “LAVI” OR “LAV max indexed” AND “Outcome” OR “CRT responders” OR “CRT non responders” AND “Follow-up”. Additional searches for potential trials included the references of review articles on that issue, and the abstracts from selected congresses: scientific sessions of the European Society of Cardiology (ESC), the American Heart Association (AHA), American College of Cardiology (ACC), and European Association of Cardiovascular Imaging (EACVI). The wild-card term “*” was used to enhance the sensitivity of the search strategy. The literature search was limited to articles published in English and to studies on humans.
Two reviewers (I.B. and G.B.) independently evaluated each article. No filters were applied. The remaining articles were obtained in full-text and assessed, again by the same two researchers, who evaluated each article separately and carried out data extraction and quality assessment. Disagreements between the reviewers were resolved by discussion with a third party (M.Y.H).
Study selection
The criteria for inclusion in the meta-analysis were studies that: (i) investigated patients undergoing cardiac resynchronisation therapy, (ii) reported left atrial predictors of CRT response and non-response, (iii) had over 3 months of completed follow-up, and (iv) enrolled a population of adults aged ≥ 18 years.
Exclusion criteria were studies that: (i) measured LA volume index by an imaging technique other than echocardiography, (ii) had insufficient statistical data to compare two groups, (iii) had a follow-up period shorter than 3 months, (iv) had non-human subjects, and (v) articles not published in English.
Outcome variables: Key clinical endpoints were predictive values of LA indexed volume of CRT response. The response to CRT was defined as reduction of left ventricular end-systolic volume (LVESV) ≥ 15 ml and/or increase of LV ejection fraction (EF) ≥ 10% [13, 14].
Data extraction
Eligible studies were reviewed, and the following data were recorded: 1) first author’s name; 2) year of publication; 3) study design; 4) two arms; CRT responders and non-responders; 5) LAVI measured by echocardiography; 6) baseline characteristics of the patients; 7) baseline indexed LA volume; 8) mean follow-up period; 9) age and gender of study participants; and 10) follow-up indexed LA volume.
Quality assessment
Assessment of risk of bias and applicability concerns in the included studies was evaluated by the same investigators using the Quality Assessment of Diagnostic Accuracy Studies questionnaire (QUADAS-2) optimised to our study questions (Supplementary Table SI) [15]. The QUADAS-2 tool has four domains for risk of bias: patient selection, index test, reference test, and flow and timing, and three domains for applicability: patient selection, index, and reference test domains.
Statistical analysis
The meta-analysis was conducted using statistical analysis performed using the RevMan software (Review Manager (RevMan) Version 5.1, The Cochrane Collaboration, Copenhagen, Denmark), with two-tailed p < 0.05 considered as significant. Weighted mean differences (WMD) and 95% confidence intervals (CI) were calculated for each study. The baseline characteristics are reported in median and range. Mean and standard deviation (SD) values were estimated using the method described by Hozo et al. [16]. To test the predictive value of LAVI for CRT response, we performed meta-regression analysis, and the percentage mean change of LAVI from baseline was used as a moderator variable to evaluate their relationship with the percentage mean change of LVESV and LVEF [17].
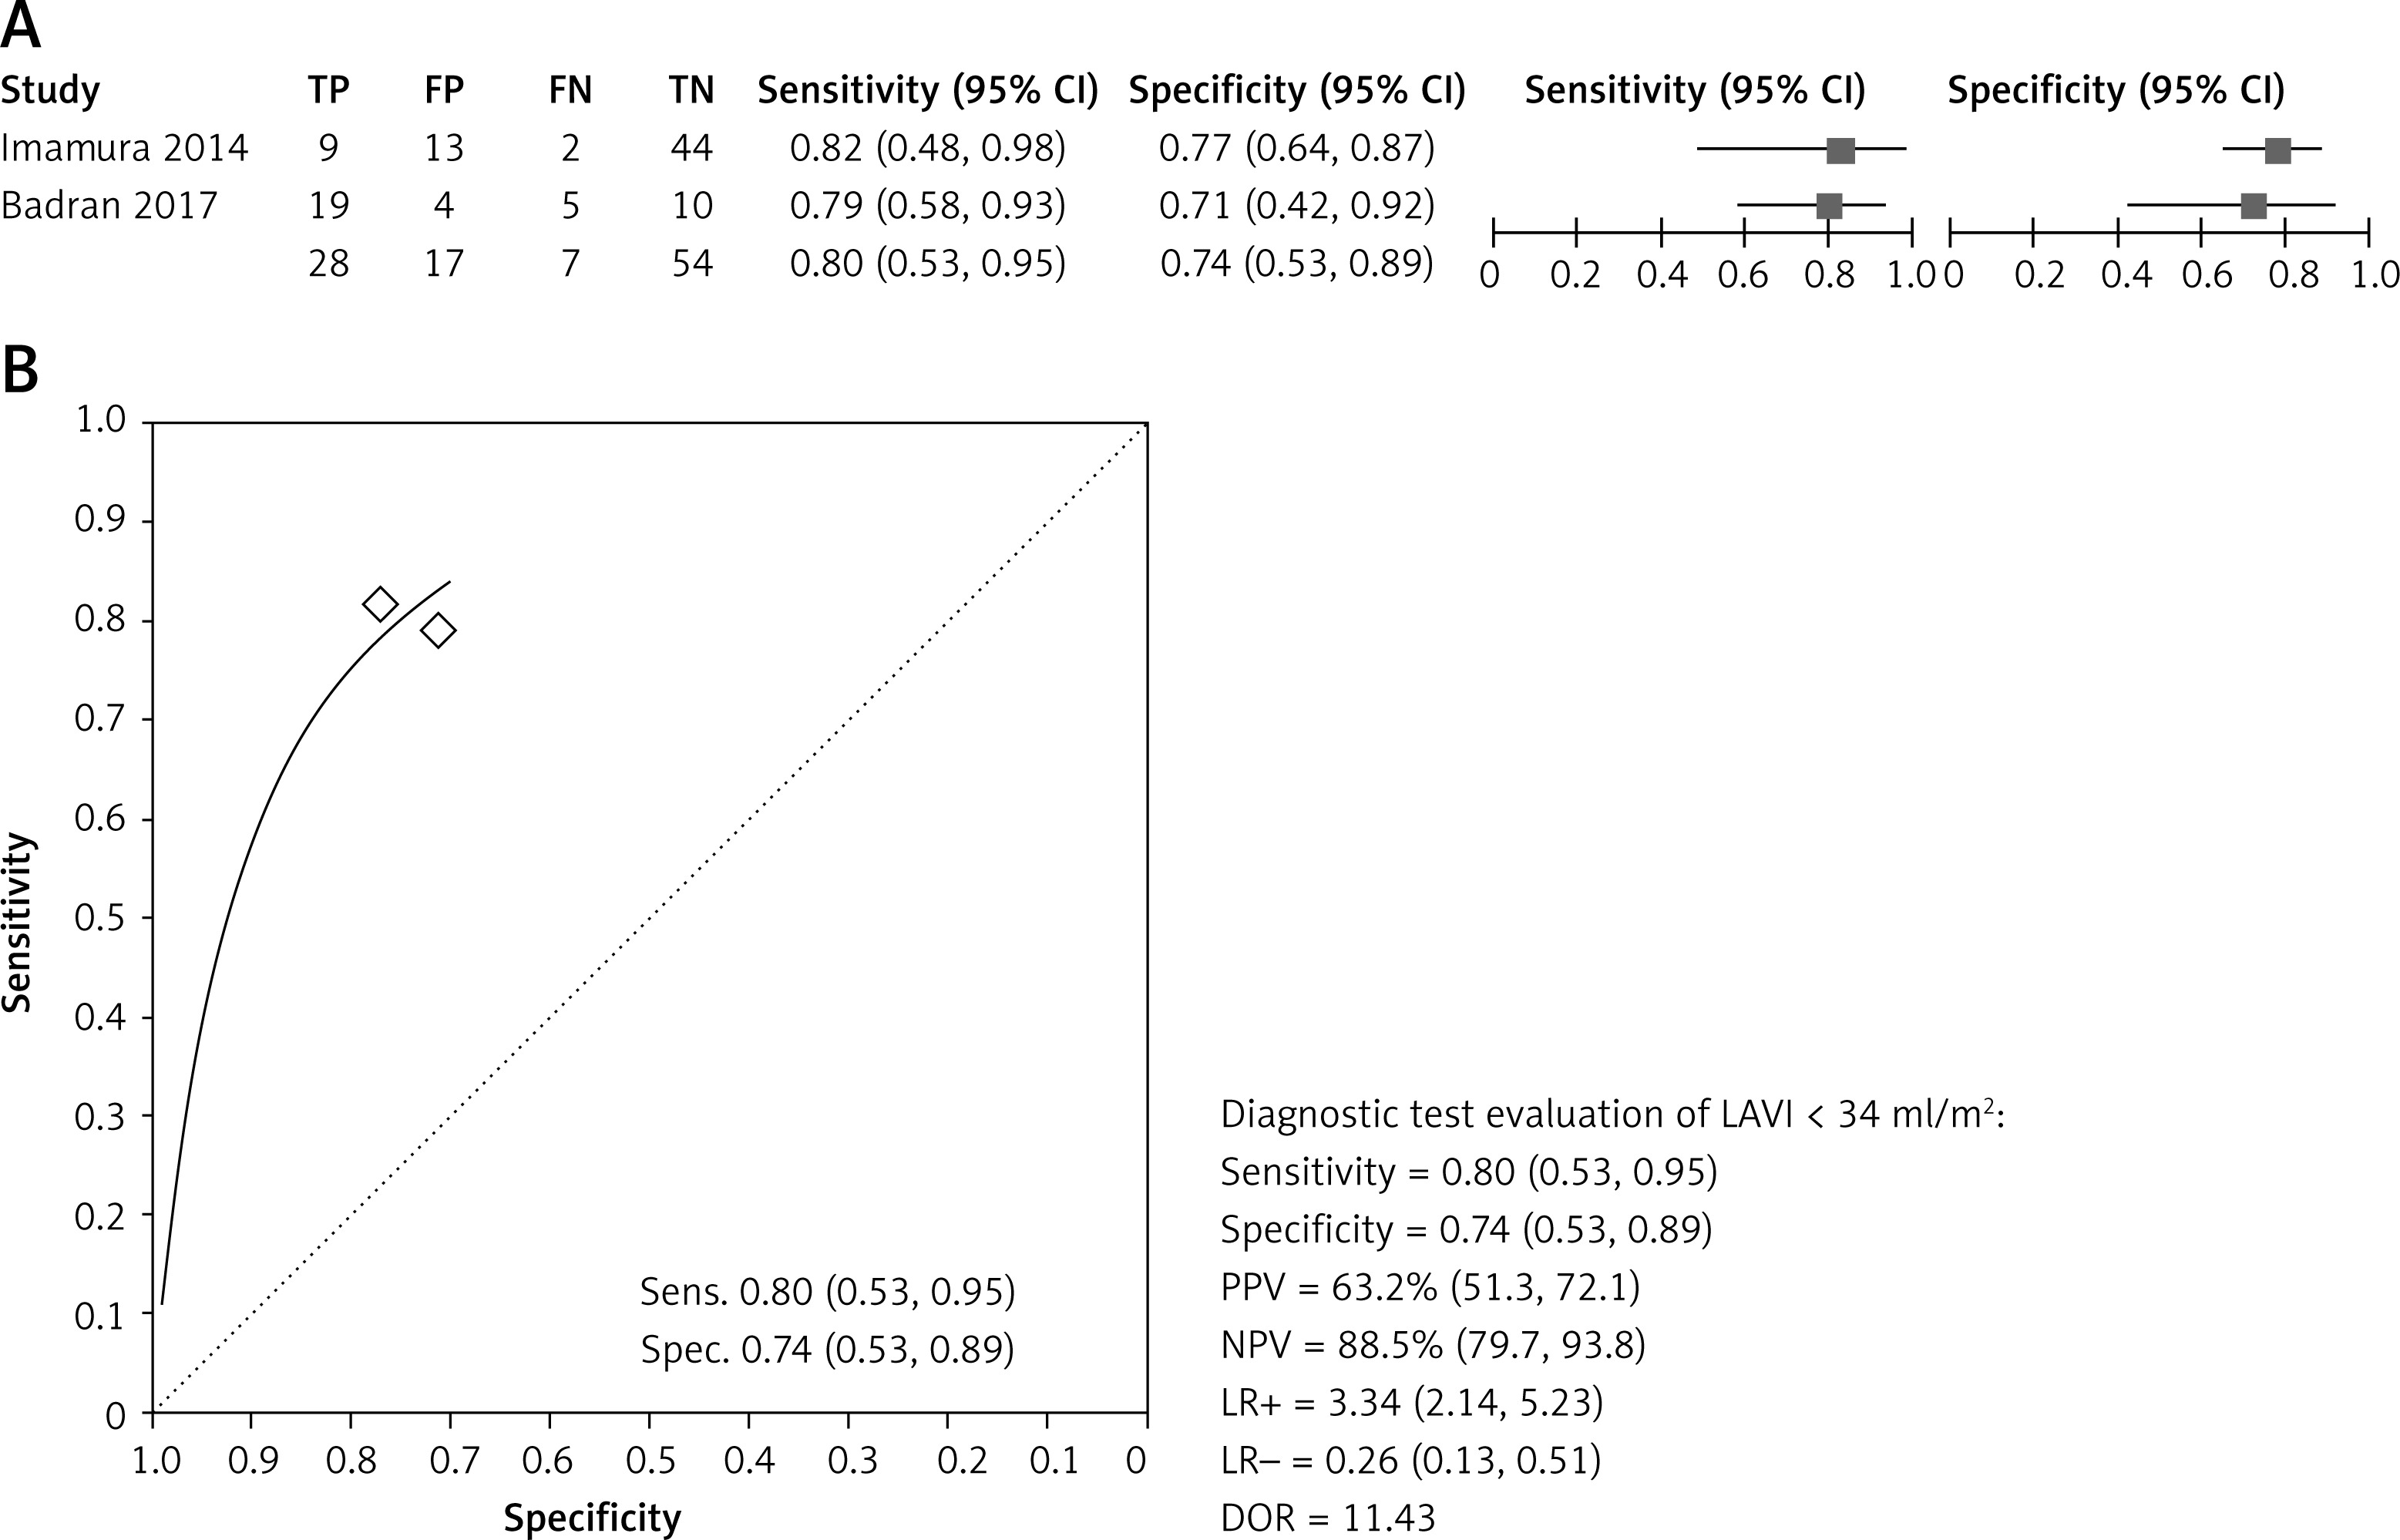
To evaluate baseline cut-off LAVI that could predict CRT response, we performed hierarchical summary receiver operating characteristic (ROC) analysis using the Rutter and Gatsonis model [18]. Summary sensitivity and specificity with 95% CI for individual studies based on true positive (TP), true negative (TN), false positive (FP), and false negative (FN) were computed using the diagnostic random-effects model [19]. The summary point from the hierarchical ROC analysis was then used to calculate the positive likelihood ratio (LR+), negative likelihood ratio (LR), positive predictive value (PPV), negative predictive value (NPV), and diagnostic odds ratio (DOR). In studies that did not provide optimal cut-offs, we created the ROC curve and identified the optimal cut-off as the point on the ROC curve closest to 0.1 in x-y coordinates. Open Meta Analyst software version 12 for Windows (64-bit version; Microsoft) was used for statistical analysis including graphic presentations of forest plots of sensitivity and specificity and hierarchical summary ROC curves.
The meta-analysis is presented in forest plots and was performed with a fixed-effects model, whereas a random effect was used if the heterogeneity was encountered. Heterogeneity between studies was assessed using the Cochrane Q test and I2 index. As a guide, I2 < 25% indicated low, 25–50% moderate, and > 50% high heterogeneity [20]. To assess the additive (between-study) component of variance, the reduced maximum likelihood method (tau2) incorporated the occurrence of residual heterogeneity into the analysis [21]. Publication bias was assessed using visual inspections of funnel plots and Egger’s test.
Results
Search results and trial flow
Of 401 articles identified in the initial search, 191 studies were screened as potentially relevant. After excluding 148 studies, 44 full articles were assessed (one from the reference list search) according to the inclusion and exclusion criteria. After careful assessment of these 44 articles, 34 were excluded and only 10 articles were included in the final analysis [22–31] (Supplementary Figure S1).
Characteristics of included studies
A total of 2191 patients from 10 studies (two clinical trials and eight observational studies) were included (Table I). CRT responders comprised 1040 and CRT non-responders comprised 1151 patients, with mean follow-up period of 10.5 months. The mean age of patients was 63.0 ±10.2 years, 74.6% male, mean QRS duration 155.4 ±33, and ischaemic aetiology 32.2%. The two groups of patients: CRT responders and non-responders had no difference in age (62.1 ±9.3 vs. 62.6 ±10 years, p = 0.87, respectively), male gender (73.75% vs. 75.48%, p = 0.32), ischaemic aetiology (37% vs. 37.8%, p = 0.89), or QRS duration (154.9 ±32.9 vs. 155.3 ±34.1 ms, p = 0.22, Table II).
Table I
Main characteristics of studies included in the analysis
[i] HF – heart failure, HFrEF – heart failure with reduced ejection fraction, CRT – cardiac resynchronisation therapy, LV – left ventricle, EF – ejection fraction, AF – atrial fibrillation, MI – myocardial infraction, CRF – chronic renal failure, MR – mitral regurgitation, 3DE – three-dimensional echocardiography, 2DE – two-dimensional echocardiography, MACE – major cardiac events, LVESV – left ventricle end systolic volume, NR – non-reported, mo – months.
Table II
Main characteristics of patients enrolled among trials included in the analysis
| Study, year | Arms | No. | Age [year] | Male (%) | QRS duration [ms] | NYHA functional class | Ischemic aetiology (%) | Mean change of LAVI % | Mean change of LVESV % | Mean change of LVEF % |
|---|---|---|---|---|---|---|---|---|---|---|
| Marsan et al., 2008 | R | 34 | 65 ±7 | 78 | 142 ±28 | 3.0 ±0.5 | NR | –6 | –42 | –9 |
| Non-R | 17 | 67 ±10 | 70 | 154 ±31 | 3.0 ±0.4 | NR | 0 | NR | NR | |
| Donal et al., 2009 | R | 23 | 67 ±10.4* | 76* | NR | 3.2 ±0.6* | NR | –6.45 | NR | NR |
| Non-R | 23 | 1.5 | NR | NR | ||||||
| Shanks et al., 2011 | R | 327 | 66.2 ±10.3 | 74.3 | 156.0 ±32.5 | 2.7 ±0.6 | 53.2 | NR | NR | NR |
| Non-R | 254 | 66.5 ± 9.6 | 81.9 | 150.6 ±29.9 | 2.8 ±0.6 | 69.7 | NR | NR | NR | |
| Hsu et al., 2012 | R | 191 | 63.6 ±11.8 | 83 | 153.9 ±18.1 | NR | 62 | –4.32 | –32.4 | –4.1 |
| Non-R | 562 | 64.2 ±10.9 | 70 | 159.7 ±20.1 | NR | 59 | 2.15 | NR | NR | |
| Imamura et al., 2014 | R | 11 | 53 ±15 | 73 | 148 ±49 | N-IV = 34% | 9 | NR | NR | NR |
| Non-R | 56 | 49 ±12 | 84 | 141 ±33 | N-IV = 45% | 14 | NR | NR | NR | |
| Feneon et al., 2015 | R | 54 | 62.3 ±10 | 63 | 163 ±27 | N-II = 24% | 18.6 | NR | NR | NR |
| Non-R | 25 | 66.5 ±10 | 80 | 158 ±30 | N-II = 22% | 60 | NR | NR | NR | |
| van ‘t et al., 2015 | R | 63 | 64.6 ±11.0 | 62 | 160 ±26 | N-IV = 2% | 83 | –7.2 | –72 | –10 |
| Non-R | 12 | 70.6 ±7.0 | 82 | 166 ±25 | N-IV = 8.5% | 37 | –2.3 | NR | NR | |
| Kloosterman et al., 2016 | R | 201 | 65.4 ±11 | 70 | 162 ±24 | N-IV = 24% | 5 | –2 | –75 | –11.2 |
| Non-R | 164 | 64 ±11 | 75 | 158 ±22 | N-IV = 25% | 3 | 2.5 | NR | NR | |
| Badran et al., 2017 | R | 24 | 56 ±9.8 | 71 | NR | N-IV = 33% | 29 | –5 | –35.2 | –9.6 |
| Non-R | 13 | 53 ±9.5 | 69 | NR | N-IV = 46% | 23 | –4.5 | NR | NR | |
| Hansen et al., 2017 | R | 114 | 69.4 ±9* | 80* | 166.2 ±23.0* | N-IV = 3%* | 50* | –4.4 | –50 | NR |
| Non-R | 24 | –2 | NR | NR |
LAVI in CRT responders versus CRT non-responders
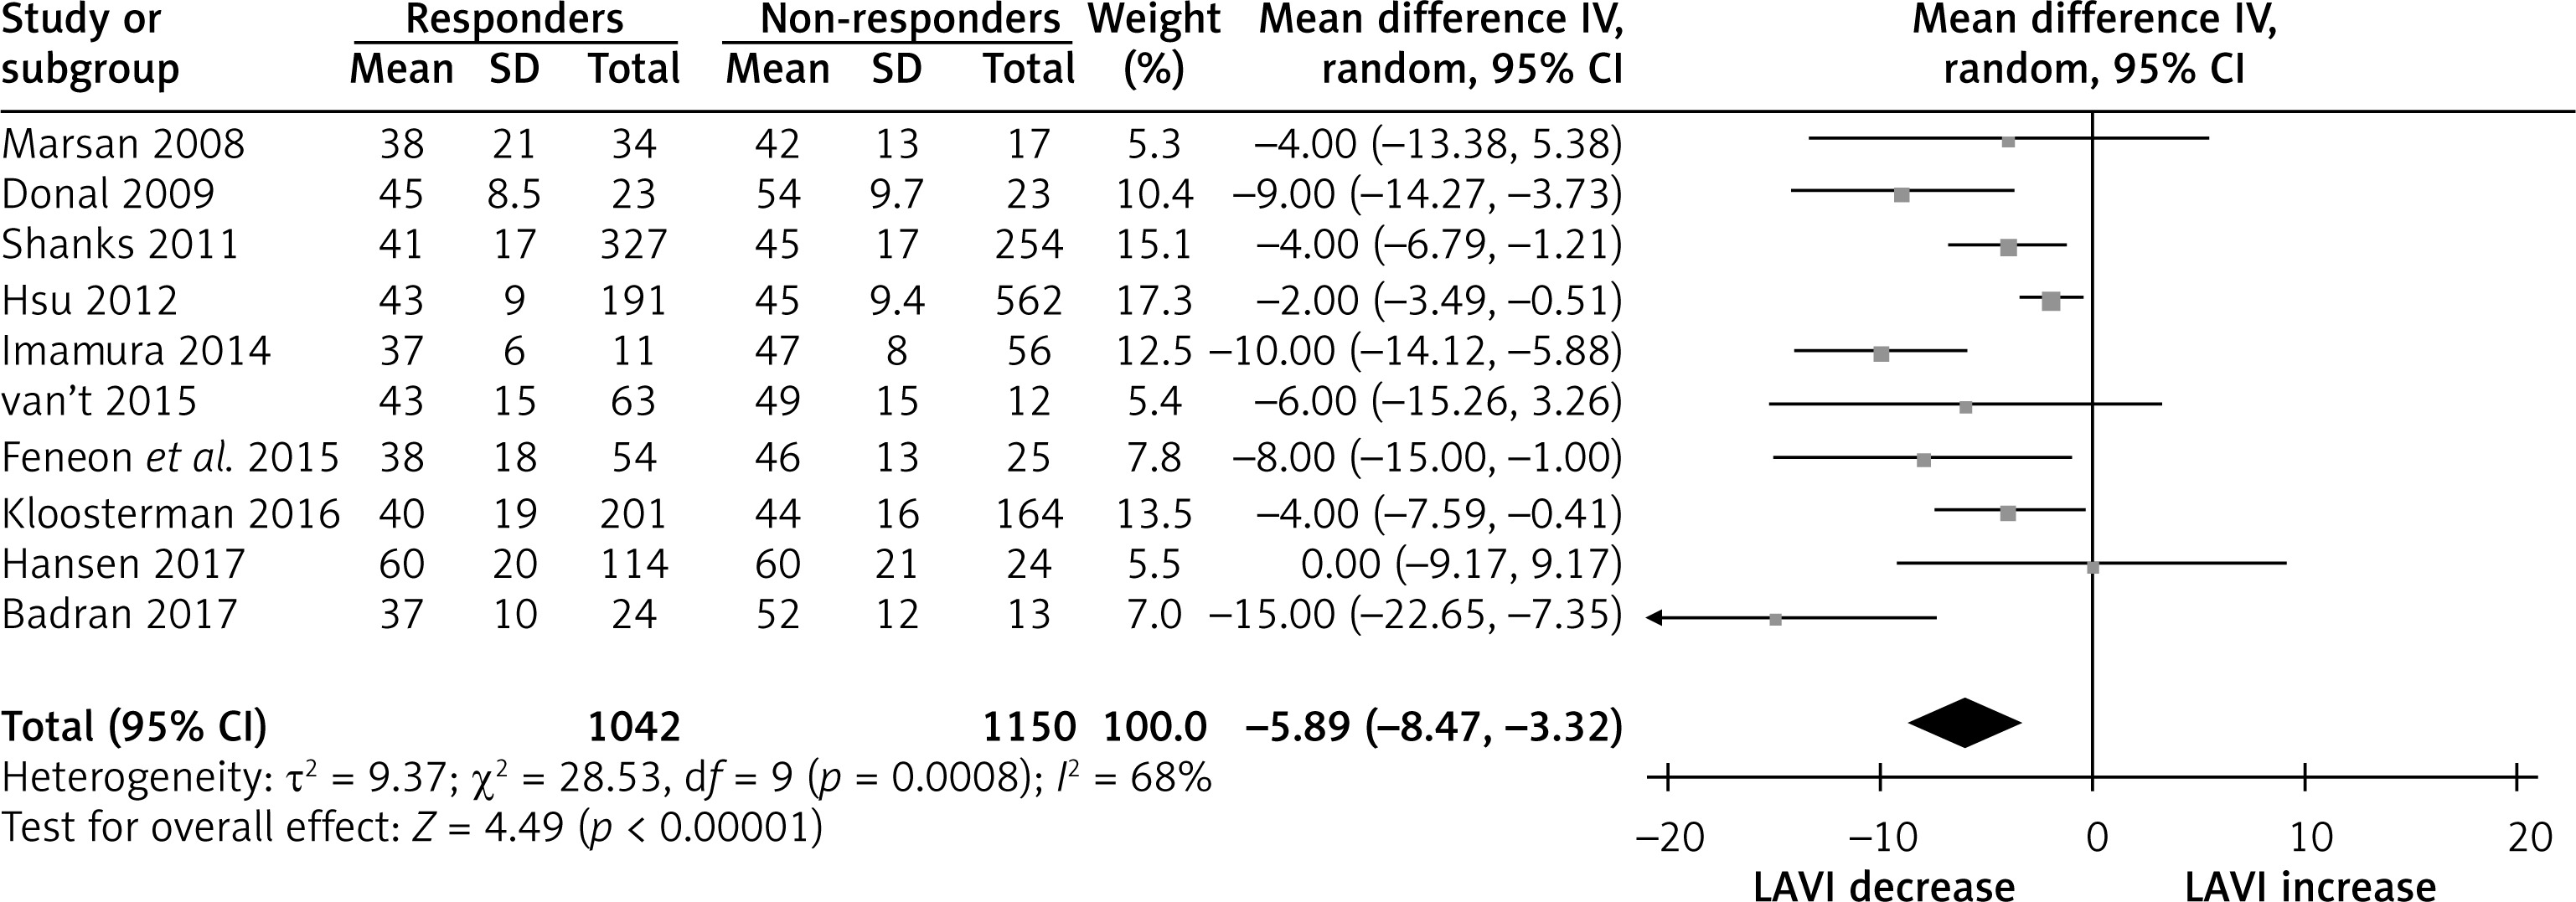
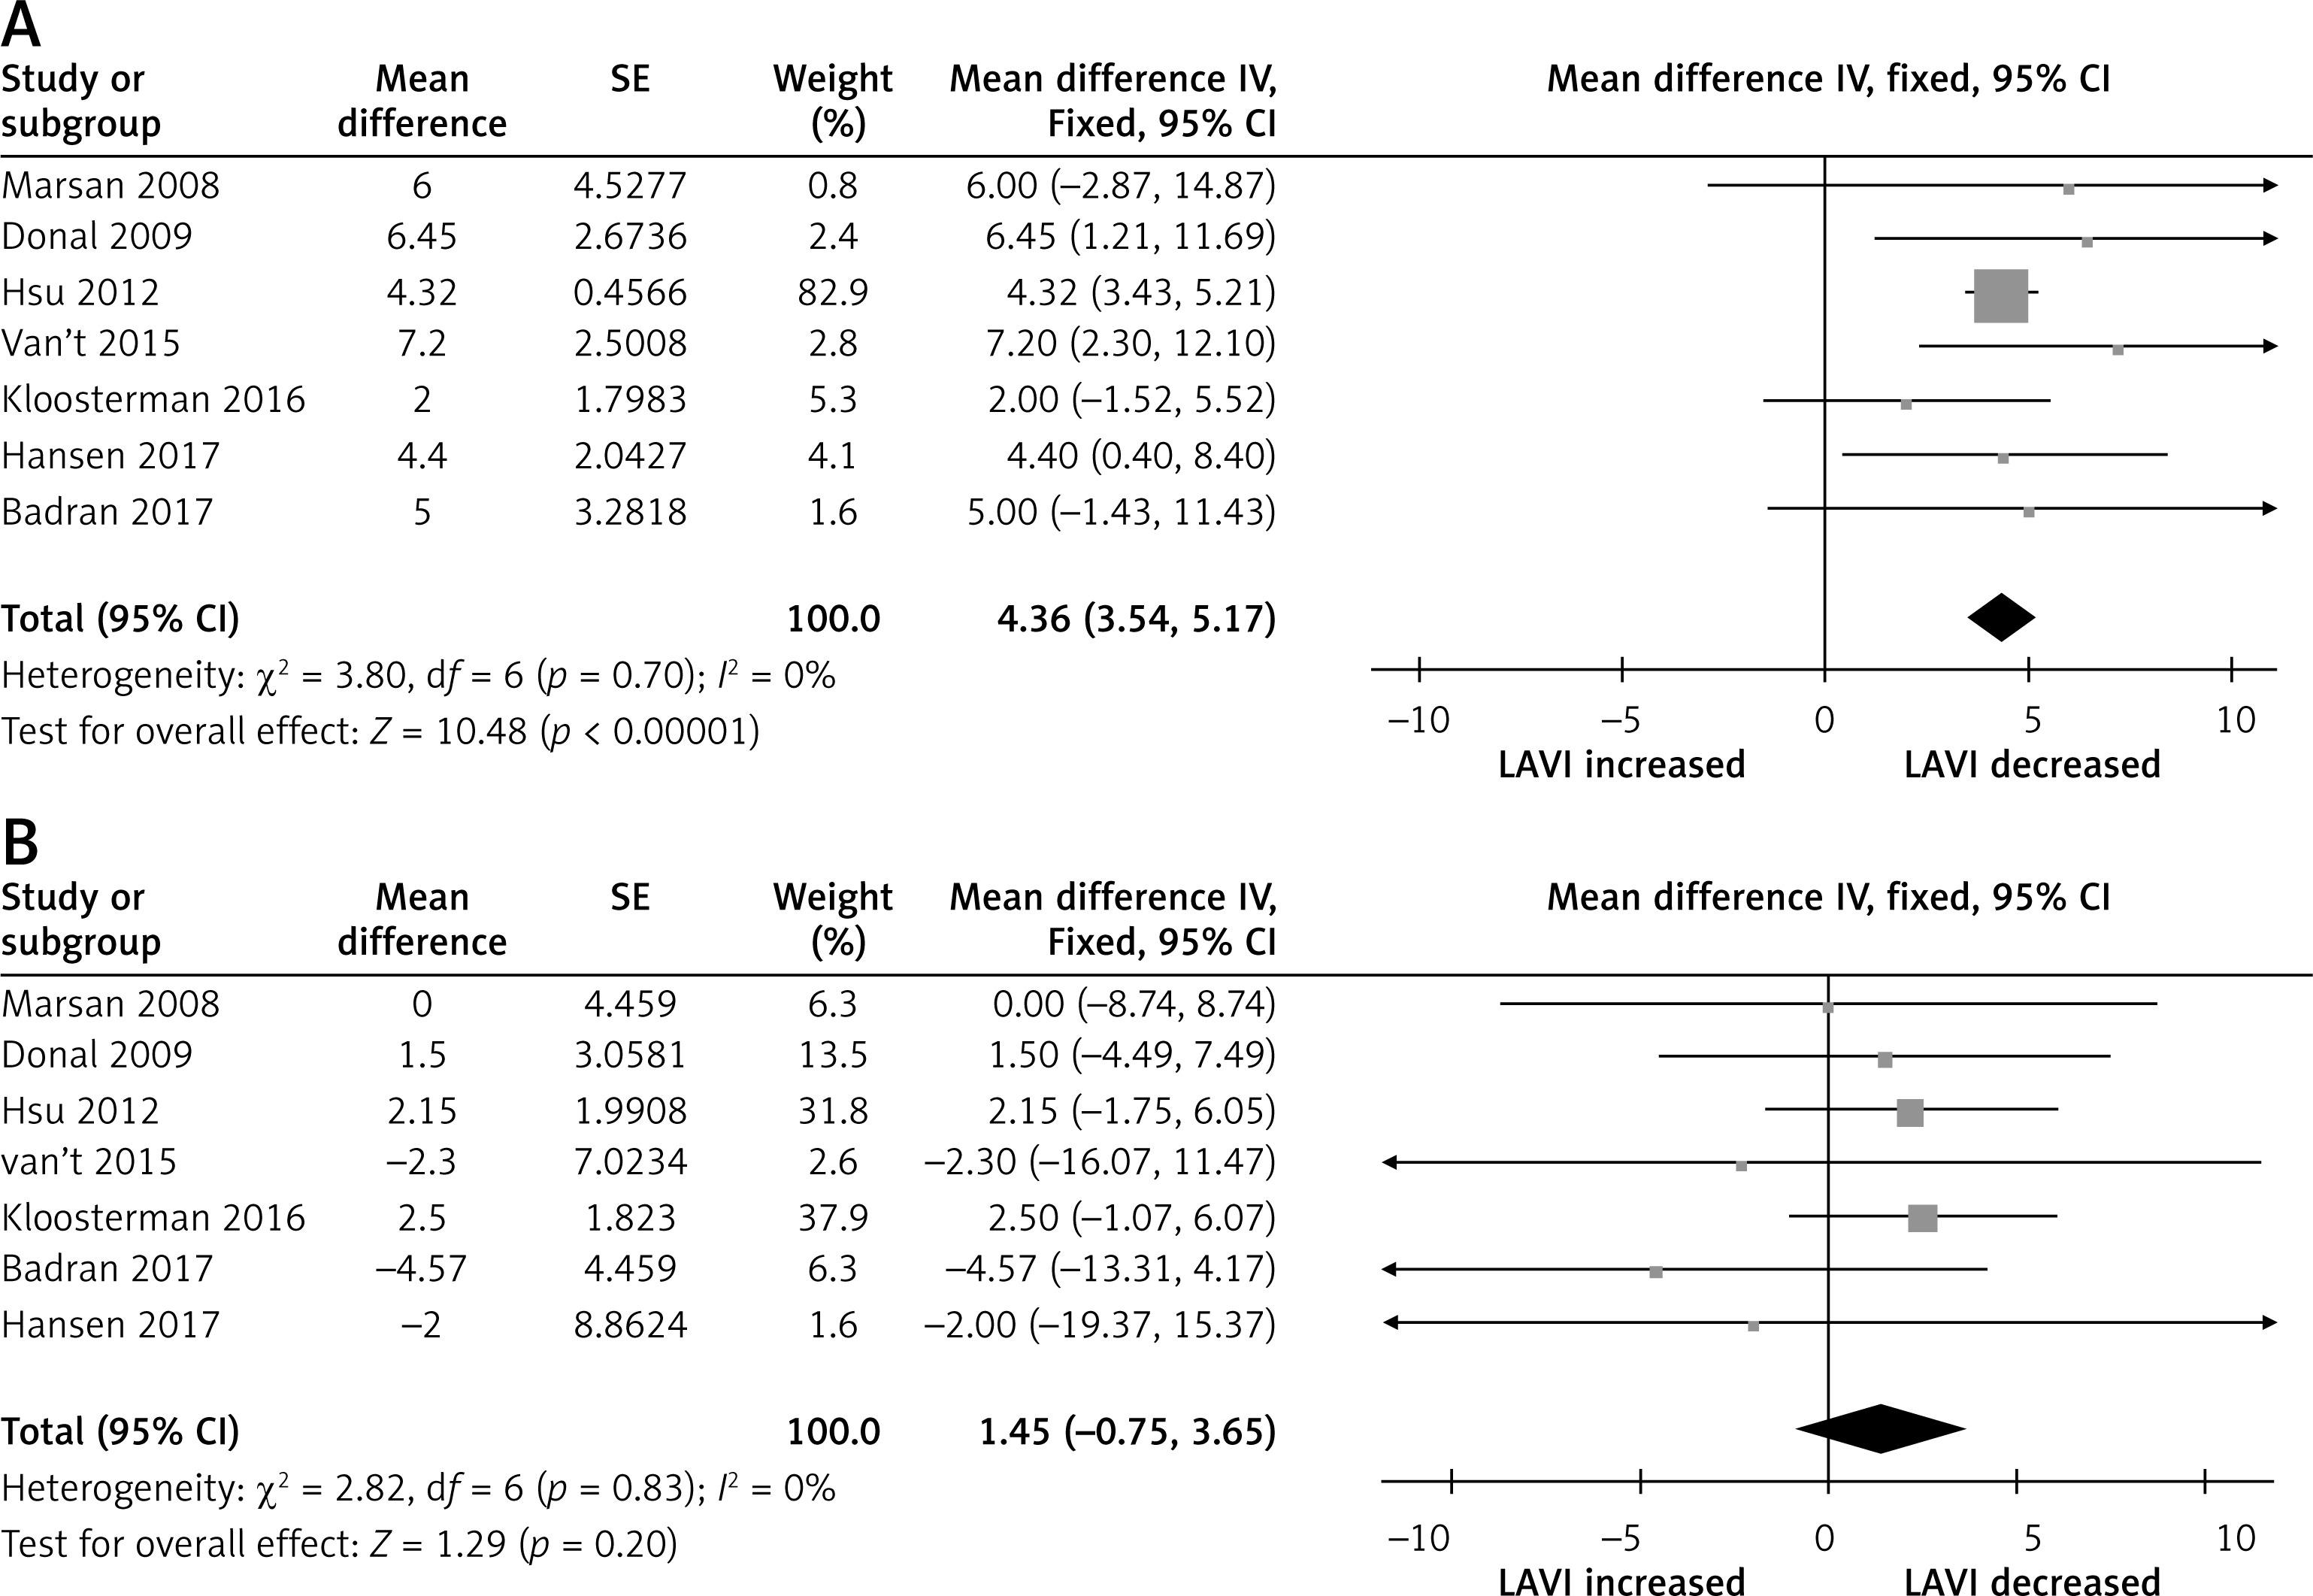
The pooled analysis showed no difference on baseline LV dimension and function in CRT responders compared CRT non-responders; baseline LVEDV with weighted mean difference (WMD) –5.35% (95% CI: –5.25 to 10.96, p < 0.59), baseline LVESV, WMD 0.54% (95% CI: –4.75 to 5.84, p = 0.84), baseline LVEDd, WMD 1.92 % (95% CI: –1.44 to 5.28, p = 0.26), as well as baseline LV EF, WMD 0.60 % (95% CI: –0.26 to 1.56, p = 0.22) (Supplementary Figure S2). Similarly, no difference was found on baseline QRS duration, WMD 0.45 % (95% CI: –5.31 to 6.21, p = 0.88) (Supplementary Figure S3), whereas baseline LAVI was different in these two group; CRT responders had lower baseline LAVI compared to non-responders, with weighted mean difference (WMD) –5.89% (95% CI: –9.47 to –3.22, p < 0.001; Figure 1). At follow-up, LAVI in CRT responders fell significantly, WMD –4.36% (95% CI: –3.54 to –5.17, p < 0.001) compared to non-responders where it remained unchanged, WMD 1.45 % (95% CI: –0.75 to 3.65, p = 0.20; Figures 2 A, B). Heterogeneity across the included studies was not encountered at follow-up in CRT responders or non-responders (c2 = 3.8, I2 = 0, df = 6, p = 0.70 and c2 = 2.8, I2 = 0, df = 6, p = 0.20) except moderate heterogeneity detected at baseline LAVI between the two groups as tested by the random-effect analysis.
The predictive value of LAVI of CRT response
To test the predictive value of LAVI of CRT response, we performed meta-regression analysis, and the percentage mean change of LAVI from baseline was used as a moderator variable to evaluate the relationship with percentage mean change of LVESV and LVEF.
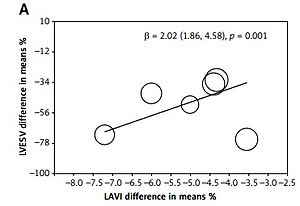
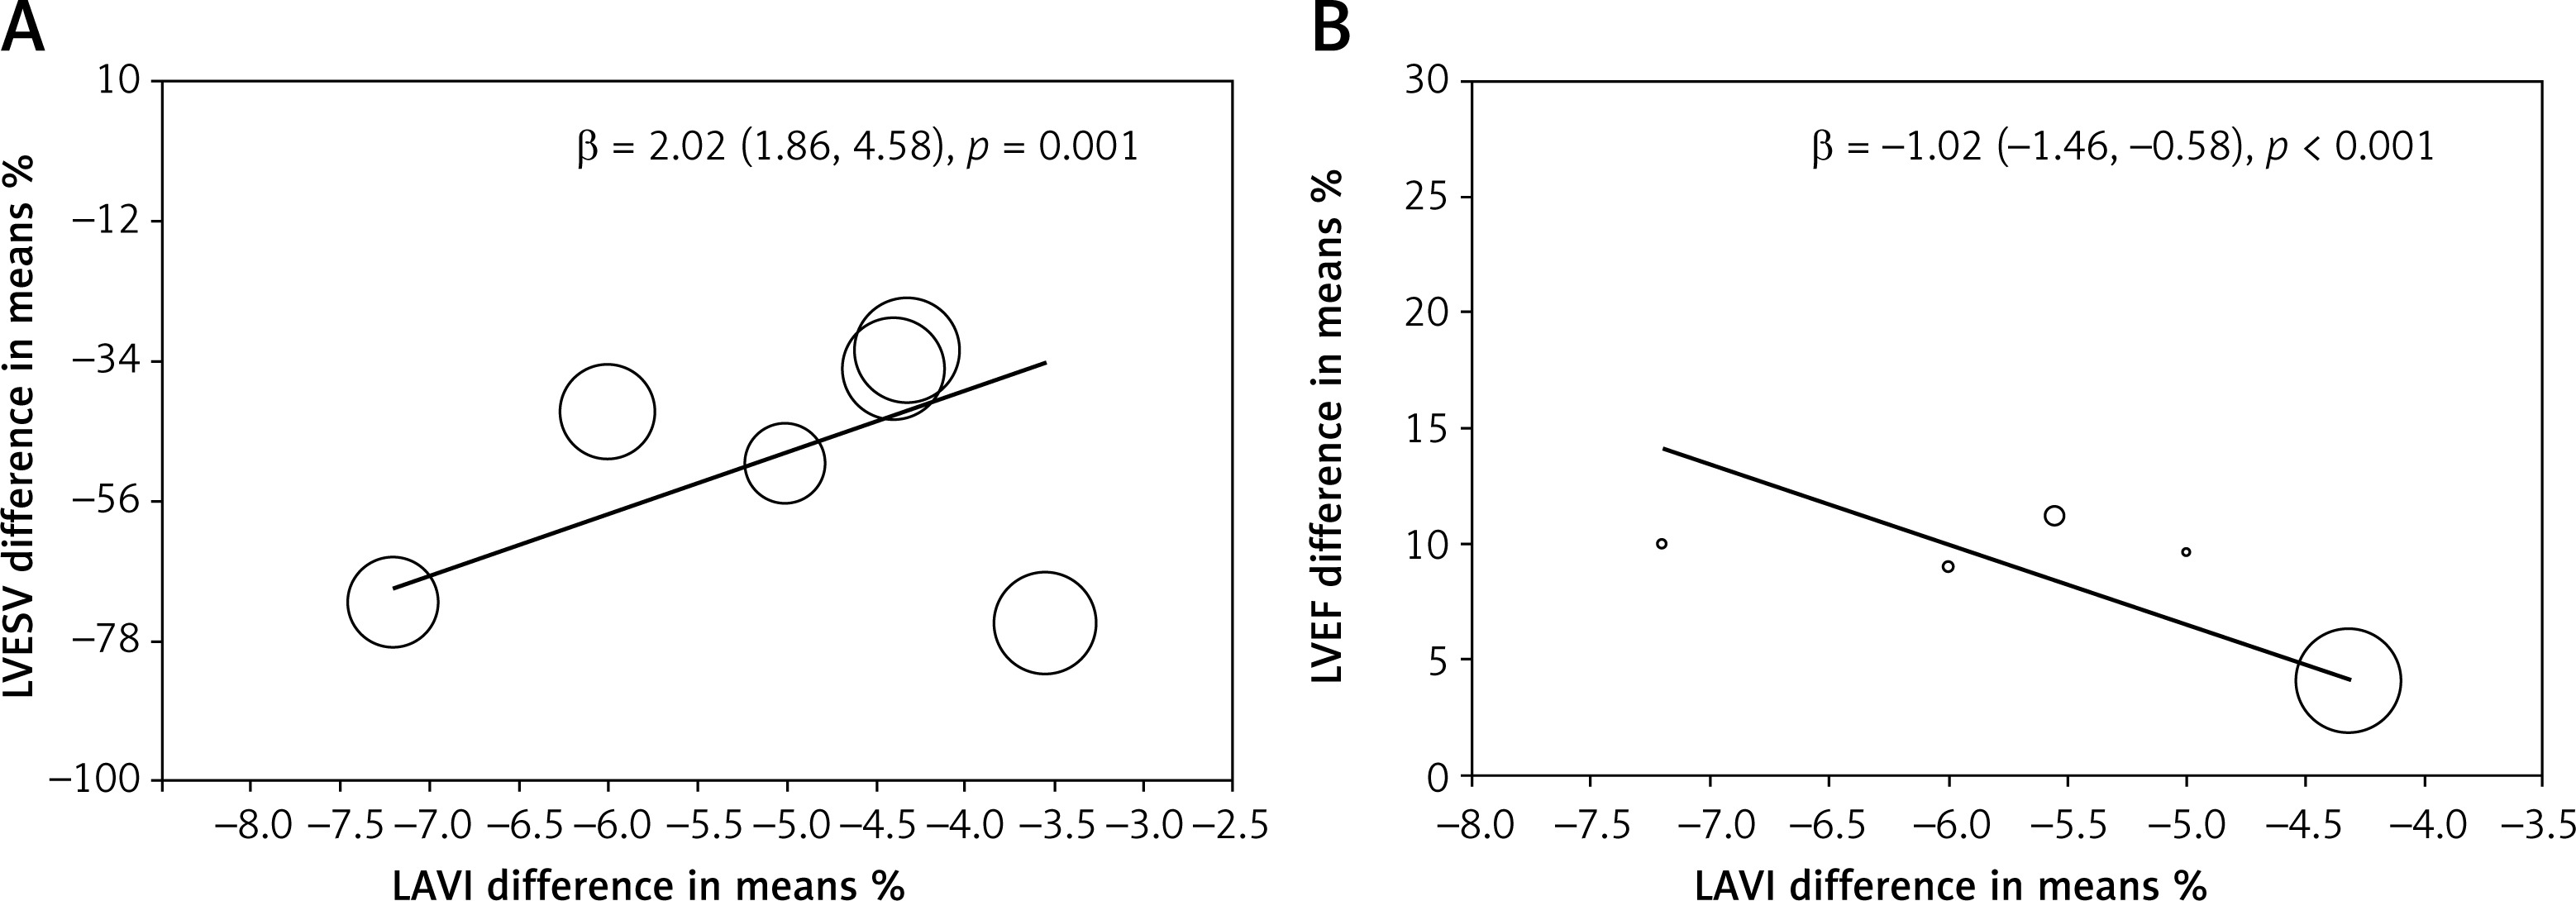
The meta-regression analysis showed that the percentage mean change of LAVI was related to changes of LVESV (β = –1.02 (–1.46 to –0.58), p < 0.001, t = 0, I2 = 0, Q = 1.28, df = 4) and LVEF (β = 2.02 (1.86–4.58), p = 0.001, t = 18, I2 = 68, Q = 54, df = 5). The decreased LVESV and/or increased LVEF were associated with LAVI reduction (Figures 3 A, B). The heterogeneity across the included studies was assessed for the analysis of the association of LAVI with LVEF, using the random effect on meta-regression.
Figure 3
Meta-regression of LAVI: A – The meta-regression analysis showed that the % mean change of LAVI was related to changes of LVESV; B – The meta-regression analysis showed that the % mean change of LAVI was related to changes of LVEF after CRT
Based on available evidence, the baseline cut-off of LAVI < 34 ml/m2 accurately predicted CRT response with summary sensitivity of 0.80% (0.53–0.95), summary specificity 0.74% (0.53–0.89), PPV = 63.2%, NPV = 85.5%, LR+ = 3.34, LR– = 0.26, and Diagnostic OR > 11 (Figure 4).
Risk of bias assessment
Based on the Quality Assessment of Diagnostic Accuracy Studies questionnaire (QUADAS-2), four domains of criteria for risk of bias and three for applicability were analysed, and the risk of bias was assessed as low risk, high risk, or unclear risk (Appendix 1) [15]. Most studies had low or moderate risk of bias and clearly defined the objectives and the main outcomes (Supplementary Table SI, Supplementary Table SII, and Supplementary Figure 4). QUADAS-2 analysis for bias evaluation showed all domains to have low risk of bias (≤ 20%). Also, there was no evidence for publication bias as evaluated by Egger’s test for our findings.
Discussion
Over the last two decades, CRT has become a well-established treatment for heart failure patients with reduced ejection fraction, who are symptomatic despite full medical therapy, as stated in the European and American guidelines [13, 14]. Despite its significant effect in controlling patients’ symptoms, reducing hospitalisation, and improving survival, almost one third of patients remain limited by HF symptoms due to impaired LV function and fluid retention [5, 6]. One of the cardiac function disturbances such patients are limited by is atrial arrhythmia, which is known to be related to LA size enlargement and which could also decrease in CRT responders [7, 32]. The regression of atrial arrhythmia with CRT treatment has been interpreted on the basis of reversed LA cavity remodelling [33]. Despite those suggestions, the exact relationships between LA volume response to CRT and other conventional markers of cardiac response are still not established [9–11]. This meta-analysis evaluates the relationship between LA cavity measurements and those of cardiac response to CRT.
Findings
Our analysis shows that CRT responders have significantly lower baseline LAVI, which reduces further after 3 months of treatment, compared to non-responders in whom it does not change. The meta-regression analysis also showed that LAVI, with a cut-off baseline value of 34 ml/m2, predicted the quantitative response to CRT in the form of a fall in LVESV by 15 ml and/or a rise in LVEF by 10%. Finally, the extent of fall in LAVI correlated with the mean reduction in LVESV and mean increase in LVEF over time.
Data interpretation
LA enlargement reflects chronic deterioration of LV function, particularly diastolic, which results in raised LA pressure and myocardial stretch, and hence cavity function instability and arrhythmia. Studies have shown that LA volume increase is the most accurate predictor of atrial fibrillation [34, 35], and its fall with successful LA pressure offloading therapy reduces the frequency of arrhythmia and symptoms [36]. These findings are irrespective of the severity of the commonly seen secondary mitral regurgitation [37]. Atrial arrhythmia burden itself is known to affect LV function, through compromising its optimum filling and stroke volume [38, 39], leading to a vicious circle of LA-LV function deterioration. CRT is designed mainly to optimise LV synchronous function as a means of increasing stroke volume and cardiac output. As these function changes occur, LA emptying is indirectly optimised, an effect that results in symptomatic improvement through the fall in LA pressure and the increase in cardiac output. Applying what is known with medical treatment of HF should explain our results, the relationship we found between LAVI and LV cavity measurements, and the change of both variables over time only in CRT responders. Thus, the primary effect of CRT on LV function and stroke volume resulting in a fall in LVESV and a rise in LVEF had also its byproduct in the form of a fall in LAVI and pressures. As regression of LV volume is referred to as a sign of reverse remodelling, the same principle should apply to the LA, which inevitably results in better stable rhythm and overall function. This mechanism explains the relationship we found between LA volume changes and those of the left ventricle. They also support the predictive power the LAVI has for LV volume and function response to CRT. Finally, it should be remembered that the two chambers share not only a guarding valve (mitral) but also myocardial insertion site (the mitral annulus), an anatomical design that dictates the inter-relationship between the two cavities [40, 41].
Limitations
LAVI, many LA indices as LA strain, emptying fraction, and markers of LA dyssynchrony were not available in the studies that we included in this analysis. These measurements would have complemented the interpretation of our findings. The analysis of the LAVI cut-off value for the prediction of CRT response was based on a small number of studies and should be taken as having modest accuracy until proven in a larger number of studies. The data included in the meta-analysis were collected from published papers for which we did not have control over the quality but instead trusted the academic merit of the investigators.
Clinical implications
The left atrium is an integral component of the cardiac structure and function, and it should not be seen in isolation. Although normally the LA-LV relationship is mainly along their long axis, based on the anatomical myocardial fibre architecture, in patients with heart failure and reduced ejection fraction, respective volumes seem to be closely related with that of the LA, which predicts LV size and function response to CRT. These findings may assist in explaining the lack of response of patients with atrial fibrillation to CRT, as established in the literature [42].
In conclusion, baseline LAVI predicts CRT response, and its change reflects LA remodelling as a response to electric resynchronisation. These results emphasise the role of LAVI assessment as an integral part of cardiac function response to CRT.