Introduction
Bladder cancer is one of the most common tumours of the urogenital system in China and features a high incidence, rapid progression, high recurrence rate, etc. [1]. According to a study by the National Cancer Research Center, there were 78,000 new cases of bladder cancer in China in 2014, with an incidence of 57.1/100,000, 32,000 deaths, and a fatality rate of 23.5/100,000 [2]. Furthermore, in a recent study by the International Organization for Research on Cancer, the incidence of bladder cancer in the world in 2018 was 549,393, accounting for 3% of all cancers, and the death toll reached 199,992, accounting for 2.1% of all cancers [3]. Approximately 75% of new-onset cases are non-muscular-invasive bladder cancer (NMIBC) [4], and the 5-year survival rate is 56% [5]. With the development of medical science, great progress has been achieved in the treatment of bladder cancer, but the survival rate of those patients has not reached a milestone in progress. Therefore, it is urgent to find new treatment strategies and effective interventions to improve the treatment of bladder cancer.
In recent decades, an increasing number of studies have been carried out on plant extracts, and many gratifying results have been achieved at the same time. Allicin has a long history as a prescription in Chinese traditional medicine. Recent studies have demonstrated that sulphur compounds in allicin are an important component for inhibiting and preventing tumours [6], which can inhibit cell growth and induce cell apoptosis through a variety of approaches and targets. Allicin is a complex of several allyl organic sulphides, one group of which consists of fat-soluble allyl sulphides, such as diallyl sulphide, diallyl disulphide, and diallyl trisulphide; the other consists of water-soluble compounds of γ-glutamine and S-allyl cysteine, such as S-allyl cysteine and S-allyl cysteamine [7]. Prior evidence has indicated that the high concentration of alliin extracted from garlic cannot inhibit cell growth by itself. However, the addition of garlic powder containing alliinase can inhibit the growth of cancer cells in a concentration-dependent manner. It is speculated that allicin may depend on its decomposition products, such as allicin and polysulfide, to exert its anti-tumour effects [8].
However, the effect of allicin on bladder cancer and its related mechanisms are still unclear. The present study was carried out to explore the effect of allicin on the biological activity of bladder cancer cells in vitro and its specific mechanisms.
Material and methods
Materials
Allicin injection (Shanghai Harvest Pharmaceutical Co., Ltd., 2 ml: 30 mg); bladder cancer cell lines 5637 and T24 (Shanghai Institute of Cell Biology, Chinese Academy of Sciences); RPMI-1640 medium and fetal bovine serum (FBS; Abcam Company, Cambridge, UK); 8 µm Transwell chamber (CORNING); Lipofectamine 3000 transfection reagent (Invitrogen); primers and miR-26b-5p construction and synthesis (Jiangsu KeyGEN BioTECH Corp., Ltd.); MTT and DMSO (Sigma); Annexin V/PI apoptosis detection kit (Jiangsu KeyGEN BioTECH Corp., Ltd.); PTEN, PI3K, AKT and GAPDH polyclonal antibodies (Abcam, Cambridge, UK); DMSO (Sigma, USA).
Cell culture and treatment
Human bladder cancer cell lines 5637 and T24 were cultured in vitro after thawing and resuscitation. Cells in the logarithmic growth phase were divided into blank control, DMSO, and Allicin-low, -medium and -high (dissolved in DMSO at concentrations of 12.5, 25 and 50 µg/ml) groups. Twelve replicates were made for each group, followed by testing 48 h later.
Cell transfection
Following culturing, 5637 and T24 bladder cancer cells under good growth conditions were taken when the cell density reached 60–70%, followed by cell transfection with miR-NC and miR-26b-5p, respectively, using Lipofectamine 3000. Transfection was carried out according to the instructions of the liposome kit, and the transfection concentration was 50 nmol/l.
Detection of miR-26b-5p expression in cells of each group by qRT-PCR
Bladder cancer cells were collected from each group, total RNA was extracted using TRIzol reagent (Invitrogen, Carlsbad, CA, USA), and cDNA was synthesized with the miRNA reverse transcription kit (Takara, Tokyo, Japan). All procedures were carried out according to the manufacturers’ instructions. The following reverse transcription conditions were used: incubation at 37°C for 60 min, incubation at 85°C for 5 s, and reaction termination at 4°C. The obtained cDNA was then dissolved with DEPC-treated water for PCR detection. U6 was the internal reference of quantitative PCR, and the calculation method was 2–ΔΔCt. The sequence of the primers is shown in Table I.
MTT assay for cell proliferation
Cells in each group were digested with trypsin, homogenized into a single-cell suspension, and then inoculated into a 96-well plate (n = 10) after the concentration was adjusted to 5 × 10⁴/ml. Following further culture for 24 h, 20 µl of MTT was added to each well and then cultured for another 4 h, followed by the addition of 150 µl of DMSO and incubation with shaking for 10 min in the dark. After that, the absorbance (A) at 490 nm was measured on a microplate reader, and the cell proliferation rate was calculated.
Flow cytometry for detection of cell apoptosis
Cells were digested, suspended, and centrifuged, followed by removal of the supernatant. Phosphate buffer was used to wash the supernatant three times, and 200 µl of Annexin V-FITC binding buffer was added to the supernatant to suspend the cells gently. The cells were incubated at room temperature for 10 min in the absence of light. After centrifugation for 5 min, the supernatant was discarded; another 190 µl of Annexin V-FITC binding buffer was added to suspend the cells gently; 10 µl of PI dye was added to mix the cells gently, and apoptotic cells were detected by flow cytometry.
Transwell assay for detection of cell invasion
Cells were subcultured in a Transwell chamber containing pre-coated matrix glue, with the cell density adjusted to 1 × 10⁵ cells/ml. The cells were cultured in serum-free medium containing 0.2% bovine serum albumin, and 20% FBS medium was added to the lower layer of the chamber. After 48 h of culture, the cells in the chamber were wiped off with sterile cotton swabs and stained with crystal violet. The cells that invaded the lower layer of the chamber were counted with 10 visual fields randomly selected from each well, with 3 replicates in each group. The experiment was repeated three times.
Wound healing assay
Five parallel lines were drawn on the back of a 12-well cell culture plate with a marker pen 1 day before the experiment. After ultraviolet disinfection and sterilization, samples were placed in a sterile environment for preservation. On the second day, cells in the logarithmic growth phase were digested and subcultured in a 12-well cell culture plate prepared in advance, with the cell density adjusted to 1 × 10⁵ cells/ml. After 4 h of transfection, the tip of a 10 ml pipette was used to scratch perpendicular to the back of a 12-well cell culture plate. Following three washes with phosphate buffer, FBS-free medium was added for a further 24 h of culture. Three visual fields were randomly selected for photography under an inverted fluorescence microscope at 0, 24 and 48 h, respectively, followed by recording and statistical analysis.
Western blotting for detection of PTEN, PI3K and AKT protein expression
Cells were digested by trypsinase and centrifuged. After 30 min of freezing by adding an appropriate amount of cold lysis solution, the cells were shattered by ultrasound for 10 s. Protein was isolated by centrifugation (13 000r/min, 4°C, 20 min). After protein separation, quantitative analysis of protein was achieved by the BCA method and then denaturation at high temperature. After electrophoresis, transfer to PVDF membranes and ponceau S staining, and blocking with 5% skimmed milk powder for 2 h, the primary antibodies PTEN (1 : 500), PI3K (1 : 500), AKT (1 : 500) and GAPDH (1 : 1000) were added and incubated at 4°C overnight. Following three washes in PBS, the secondary antibody (1 : 100) was added and incubated at room temperature for 1 h, followed by developing. After that, the expression of PTEN, PI3K and AKT was semi-quantitatively analysed according to the grey value of electrophoretic bands.
Dual luciferase reporter assay for detection of target sites of PTEN regulated by miR-26b-5p
The wild-type PTEN 3’UTR-luciferase reporter vector was named PTEN-Wt, and the mutant-type PTEN 3’UTR-luciferase reporter vector was named PTEN-Mut. In accordance with the manufacturer’s instructions for Lipofectamine 2000, Luciferase reporter vectors, as well as miR-26b-5p mimics and control miR-NC sequences, were co-transfected with 5367 and T24 cells in each group according to the group results for the experiment. After 48 h of treatment, the cells were harvested, and the luciferase activity of the treated cells was detected according to the instructions of Promega’s dual luciferase reporter gene detection kit, associated with the calculation of relative luciferase activity (the activity of firefly luciferase/the activity of Renilla luciferase).
Statistical analysis
SPSS 15.0 statistical software was used for statistical analysis in this experiment, Measurement data were expressed as mean ± SD. The mean comparison among multiple groups was performed by one-way analysis of variance (ANOVA), and the LSD t-test was used for further pairwise comparisons. Differences were considered statistically significant at p < 0.05.
Results
Effect of allicin on proliferation and apoptosis of bladder cancer cells
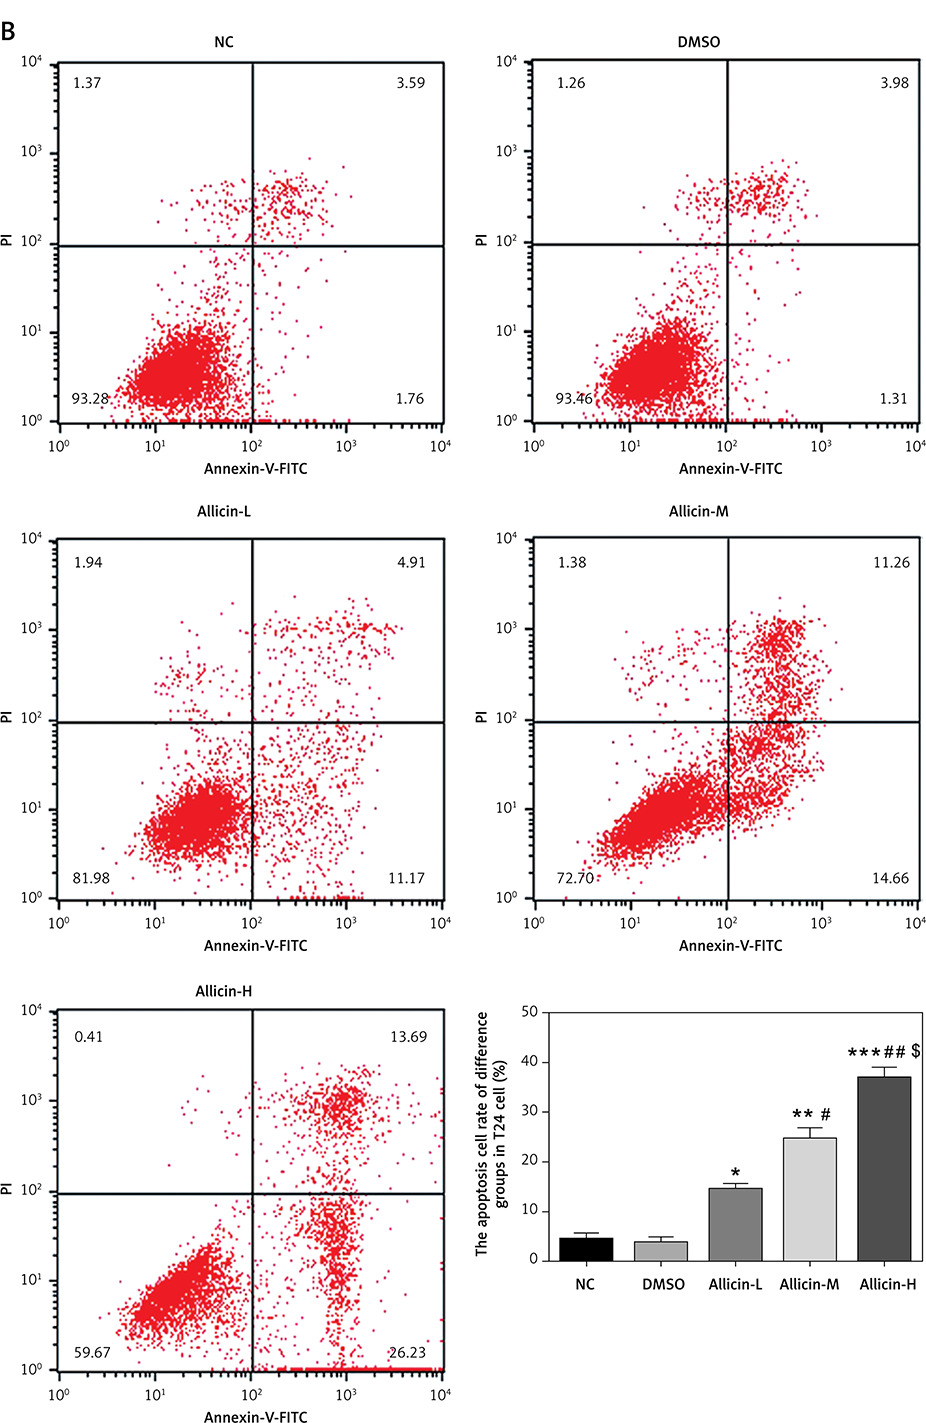
After the intervention on bladder cancer 5637 and T24 cells at different concentrations of allicin, the morphology of both types of cells did not change significantly in each group. The results indicated that the cell morphology of 5637 and T24 cells did not change significantly when allicin was provided at low, medium and high concentrations (12.5, 25 and 50 µg/ml) (Figures 1 A, B). Furthermore, MTT assay showed that there was no obvious difference between the DMSO group and the NC group, indicating that DMSO was non-toxic to bladder cancer cells. The proliferation rates of 5367 and T24 cells in the allicin treatment group were significantly decreased (both p < 0.05, Figures 1 A, B), and there was a remarkable dose-effect relationship among allicin treatment groups (p < 0.05, Figures 1 A, B). In addition, flow cytometry revealed no notable difference between the DMSO group and the NC group, suggesting the non-toxicity of DMSO to bladder cancer cells, while the apoptotic rates of 5367 and T24 cells in the allicin treatment groups increased significantly (p < 0.05, Figures 2 A, B), and a significant dose-effect relationship was also observed among allicin treatment groups (p < 0.05, Figures 2 A, B).
Figure 1
Allicin effect on cell proliferation of different groups in 5637 and T24 cell lines (100×). NC – The cells were treated with normal treatment, DMSO – The cells were treated with DMSO, Allicin-L – The cells were treated with 12.5 μg/ml allicin which was dissolved in DMSO; Allicin-M – The cells were treated with 25 μg/ml allicin which was dissolved in DMSO; Allicin-M – the cells were treated with 50 μg/ml allicin which was dissolved in DMSO. A – Allicin effect on cell proliferation of different groups in 5637 (100×). B – Allicin effect on cell proliferation of different groups in T24 (100×).
*P < 0.05; **p < 0.01, ***p < 0.001, compared with NC group; #p < 0.05; ##p < 0.01, compared with Allicin-L group; $p < 0.05, compared with Allicin-M.
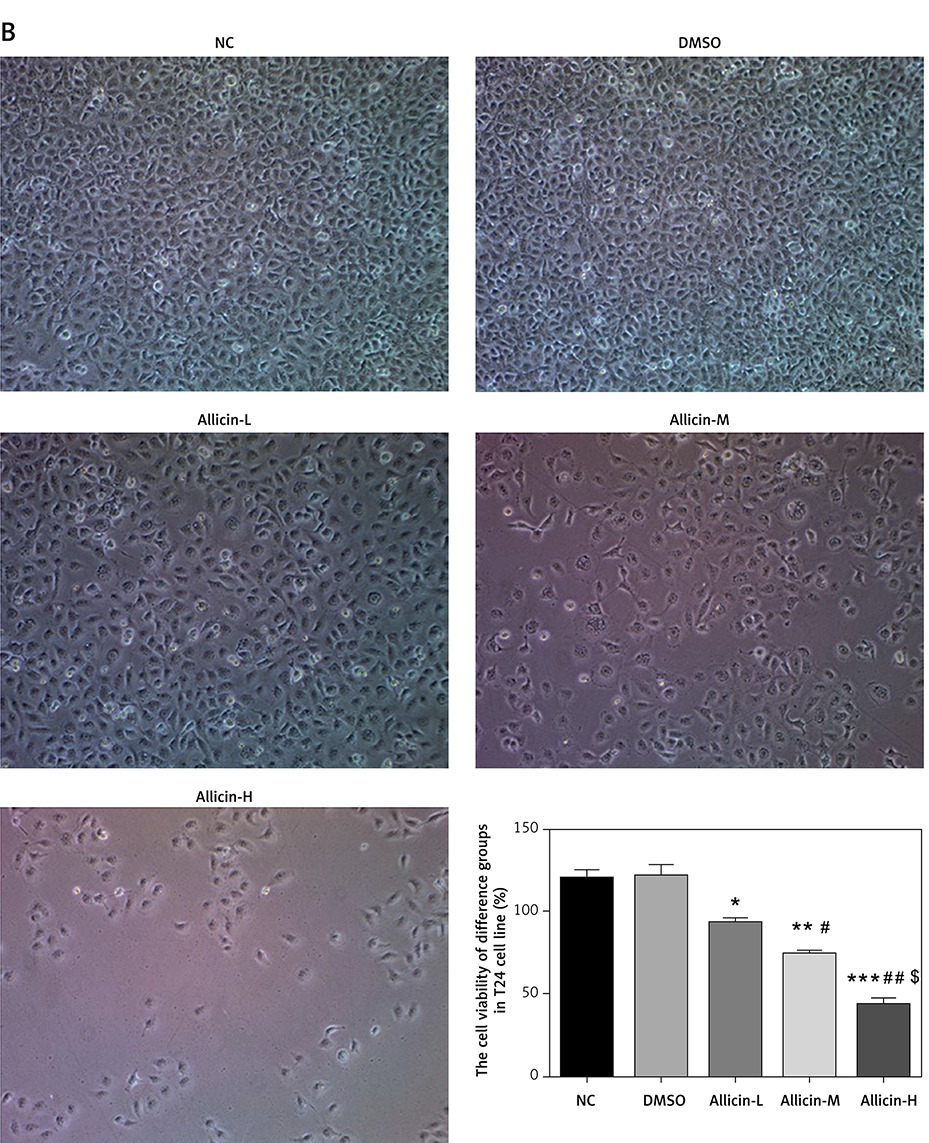
Figure 2
Allicin effect on cell apoptosis of different groups in 5637 and T24 cell lines. NC – The cells were treated with normal treatment; DMSO – the cells were treated with DMSO; Allicin-L – the cells were treated with 12.5 μg/ml allicin which was dissolved in DMSO; Allicin-M – the cells were treated with 25 μg/ml allicin which was dissolved in DMSO; Allicin-M – the cells were treated with 50 μg/ml allicin which was dissolved in DMSO. A – Allicin effect on cell proliferation of different groups in 5637. B – Allicin effect on cell proliferation of different groups in T24
*P < 0.05; **p < 0.01, ***p < 0.001, compared with NC group; #p < 0.05; ##p < 0.01, compared with Allicin-L group; $p < 0.05, compared with Allicin-M.
Effect of allicin on invasion and migration of bladder cancer cells
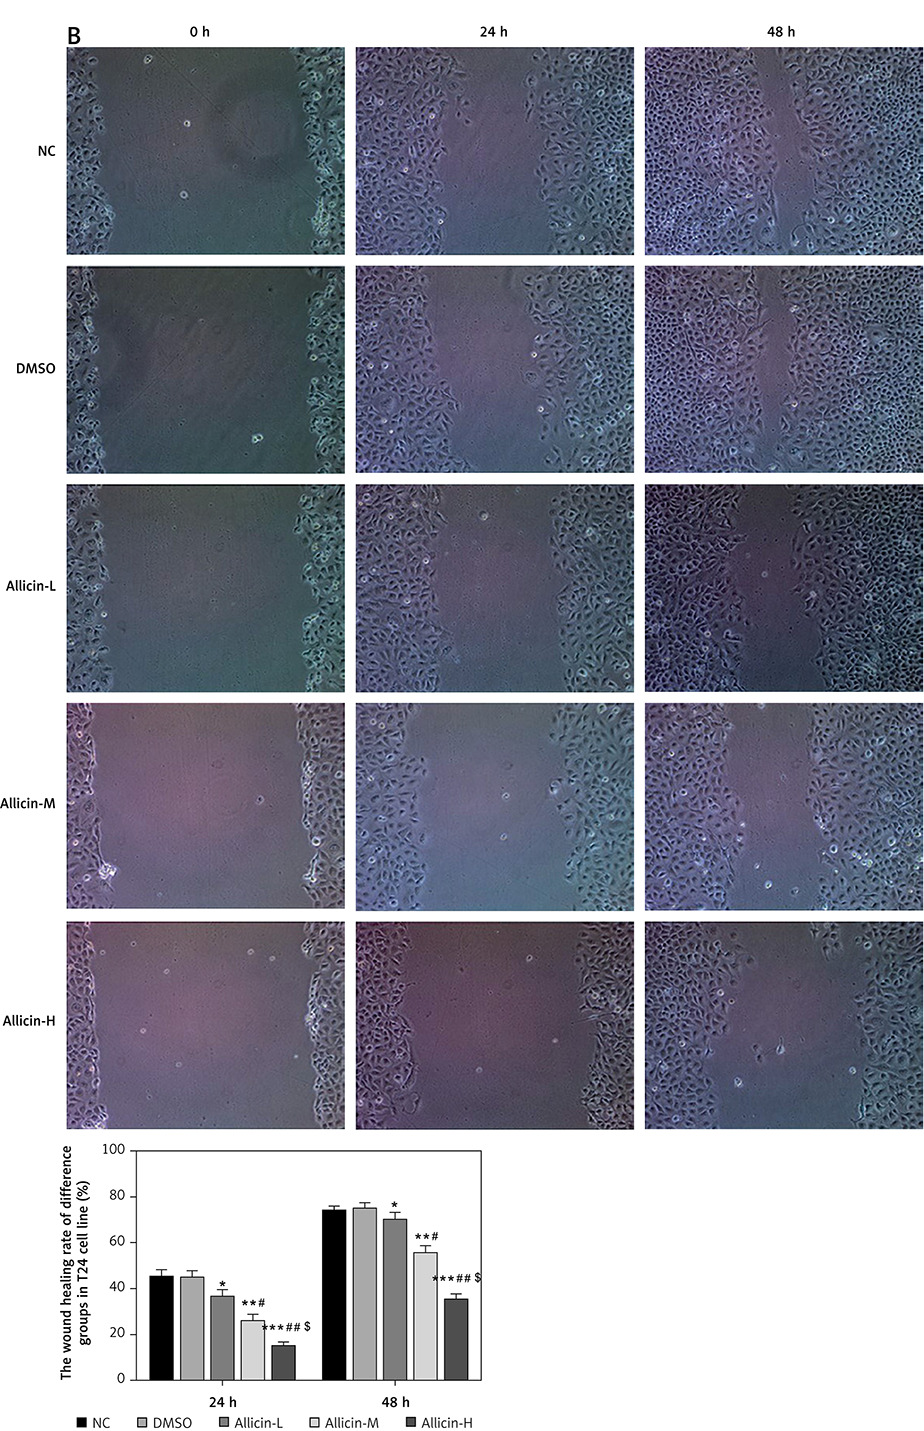
The invasion and migration of bladder cancer 5637 and T24 cells were detected by Transwell and wound-healing assays, respectively. Compared with the NC group, the number of invasive cells and the wound-healing rate in the DMSO group of 5367 and T24 cells did not differ significantly, indicating that DMSO had no effect on invasion and migration in bladder cancer 5637 and T24 cells. Simultaneously, compared with the NC group, the number of migrating 5367 and T24 cells and the wound-healing rate were significantly inhibited in the allicin treatment groups (p < 0.05, Figures 3, 4), and a dose-effect relationship was also evident among allicin treatment groups (p < 0.05, Figures 3, 4).
Figure 3
Allicin effect on invasion cell number of different groups by transwell assay (200×). NC – The cells were treated with normal treatment; DMSO – the cells were treated with DMSO; Allicin-L – the cells were treated with 12.5 μg/ml allicin which was dissolved in DMSO; Allicin-M – the cells were treated with 25 μg/ml allicin which was dissolved in DMSO; Allicin-M – the cells were treated with 50 μg/ml allicin which was dissolved in DMSO. A – Allicin effect on invasion cell number of different groups in 5637 cell lines by transwell assay (200×). B – Allicin effect on invasion cell number of different groups in T24 cell lines by transwell assay (200×)
*P < 0.05; **p < 0.01; ***p < 0.001, compared with NC group; #p < 0.05; ##p < 0.01, compared with Allicin-L group; $p < 0.05, compared with Allicin-M.
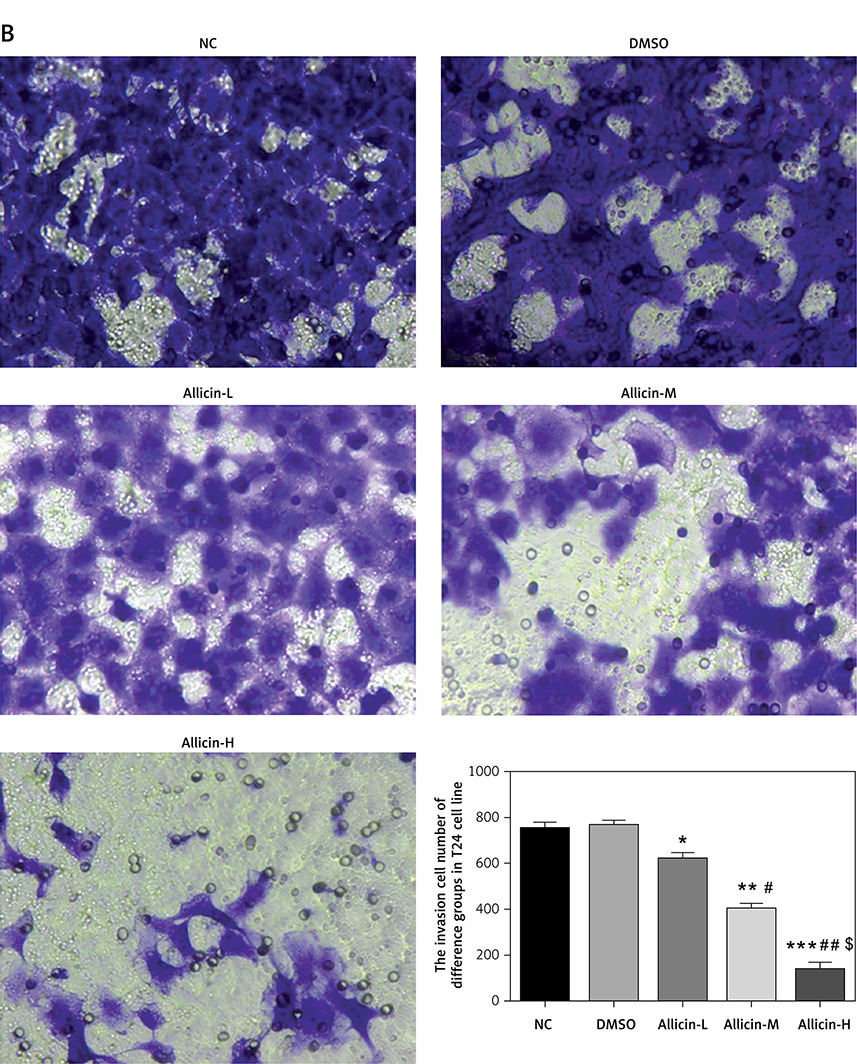
Figure 4
Allicin effect on wound healing rate of different groups by wound healing assay (100×). NC – the cells were treated with normal treatment; DMSO – the cells were treated with DMSO; Allicin-L – the cells were treated with 12.5 μg/ml allicin which was dissolved in DMSO; Allicin-M – the cells were treated with 25 μg/ml allicin which was dissolved in DMSO; Allicin-M – the cells were treated with 50 μg/ml allicin which was dissolved in DMSO. A – Allicin effect on wound healing rate of different groups by wound healing assay in 5637 cell line (100×). B – Allicin effect on wound healing rate of different groups by wound healing assay in T24 cell line (100×)
*P < 0.05; **p < 0.01; ***p < 0.001, compared with NC group; #p < 0.05; ##p < 0.01, compared with Allicin-L group; $p < 0.05, compared with Allicin-M.
Effects of allicin on expression of miR-26b-5p mRNA and related proteins
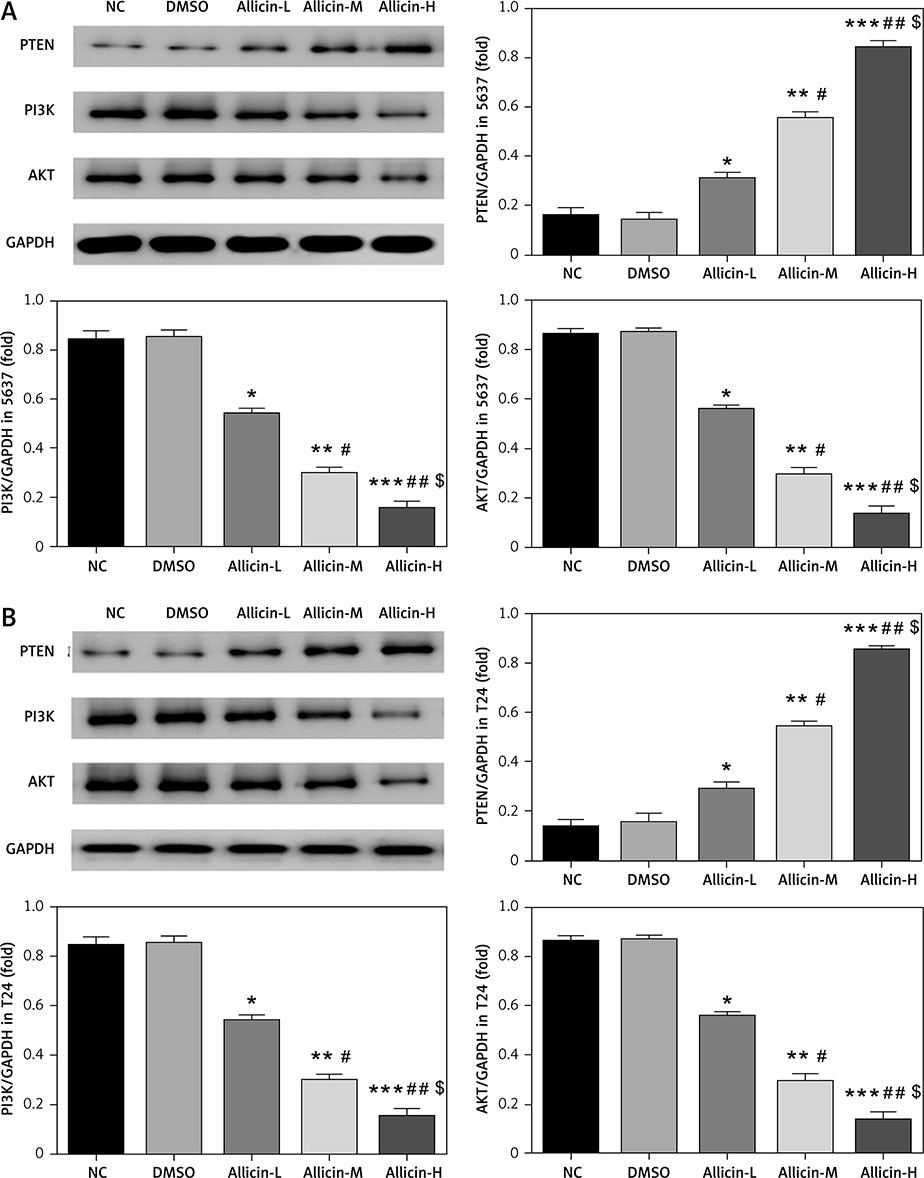
qRT-PCR and WB assays showed no significant difference in miR-26b-5p mRNA levels as well as PTEN, PI3K and AKT protein expression between NC and DMSO groups in 5637 and T24 cells (Figures 5, 6). Compared with the NC group, expression levels of miR-26b-5p mRNA as well as PI3K and AKT proteins in the allicin treatment groups were significantly lower (p < 0.05, respectively, Figures 5, 6), while the expression level of PTEN protein was significantly higher (p < 0.05, Figures 5, 6). Meanwhile, expression levels of miR-26b-5p mRNA, as well as those of PTEN, PI3K and AKT proteins in 5367 and T24 cells treated with allicin showed a significant dose-effect relationship (p < 0.05, Figures 5, 6).
Figure 5
Allicin effect on miR-26b-5p mRNA expression in different groups by qRT-PCR assay. NC – The cells were treated with normal treatment; DMSO – the cells were treated with DMSO; Allicin-L – the cells were treated with 12.5 μg/ml allicin which was dissolved in DMSO; Allicin-M – the cells were treated with 25 μg/ml allicin which was dissolved in DMSO; Allicin-M – the cells were treated with 50 μg/ml allicin which was dissolved in DMSO. A – Allicin effect on miR-26b-5p mRNA expression in different groups by qRT-PCR assay in 5637 cell line. B – Allicin effect on miR-26b-5p mRNA expression in different groups by qRT-PCR assay in T24 cell line
*P < 0.05; **p < 0.01; ***p < 0.001, compared with NC group; #p < 0.05; ##p < 0.01, compared with Allicin-L group; $p < 0.05, compared with Allicin-M.
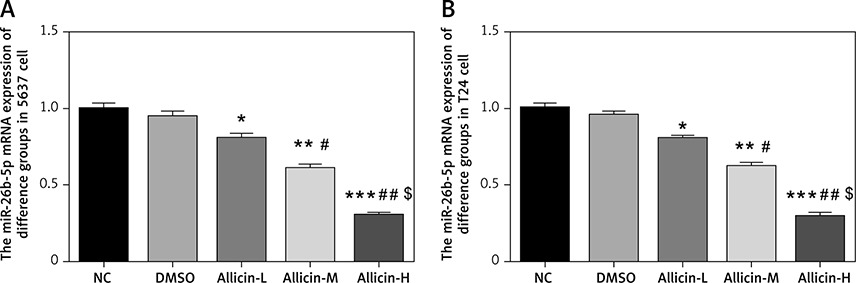
Figure 6
Allicin effect on relative protein expression by WB assay. NC – the cells were treated with normal treatment; DMSO – the cells were treated with DMSO; Allicin-L – the cells were treated with 12.5 μg/ml allicin which was dissolved in DMSO; Allicin-M – the cells were treated with 25 μg/ml allicin which was dissolved in DMSO; Allicin-M – the cells were treated with 50 μg/ml allicin which was dissolved in DMSO. A – Allicin effect on relative protein expression by WB assay in 5637 cell line. B – Allicin effect on relative protein expression by WB assay in T24 cell line
*P < 0.05; **p < 0.01; ***p < 0.001, compared with NC group; #p < 0.05; ##p < 0.01, compared with Allicin-L group; $p < 0.05, compared with Allicin-M.
Differential expression of miR-26b-5p mRNA in different groups
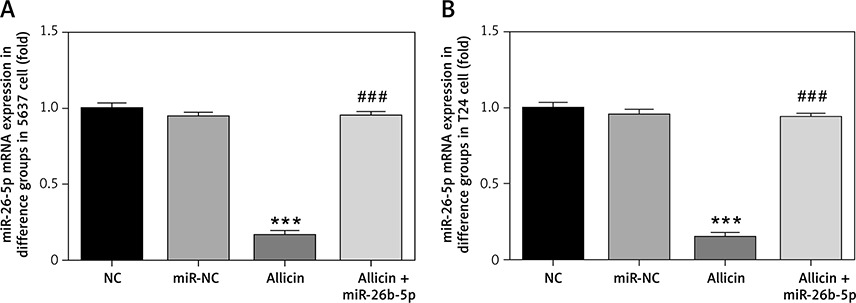
Compared with the NC group, there was no significant difference in the expression of miR-26b-5p mRNA in the miR-NC group with 5637 and T24 cells transfected with blank vectors (p > 0.05), but the expression level of miR-26b-5p mRNA in the allicin group was significantly inhibited (p < 0.001, Figures 7 A, B). After treatment with allicin and transfection with miR-26b-5p at the same time, the expression level of miR-26b-5p mRNA in the allicin + miR-26b-5p group was significantly higher than that in the allicin group (p < 0.001, Figures 7 A, B).
Figure 7
miR-26-5p mRNA expression in different groups. NC – the cells were treated with normal treatment; miR-NC – the cells were transfected with miR-negative control (NC); allicin – the cells were treated with 50 μg/ml allicin; allicin + miR-26b-5p – The cells were transfected with miR-26b-5p and treated with 50 μg/ml allicin. A – miR-26-5p mRNA expression in different groups in 5637 cell line. B – miR-26-5p mRNA expression in different groups in T24 cell line
***P < 0.001, compared with NC group; ###p < 0.001, compared with allicin group.
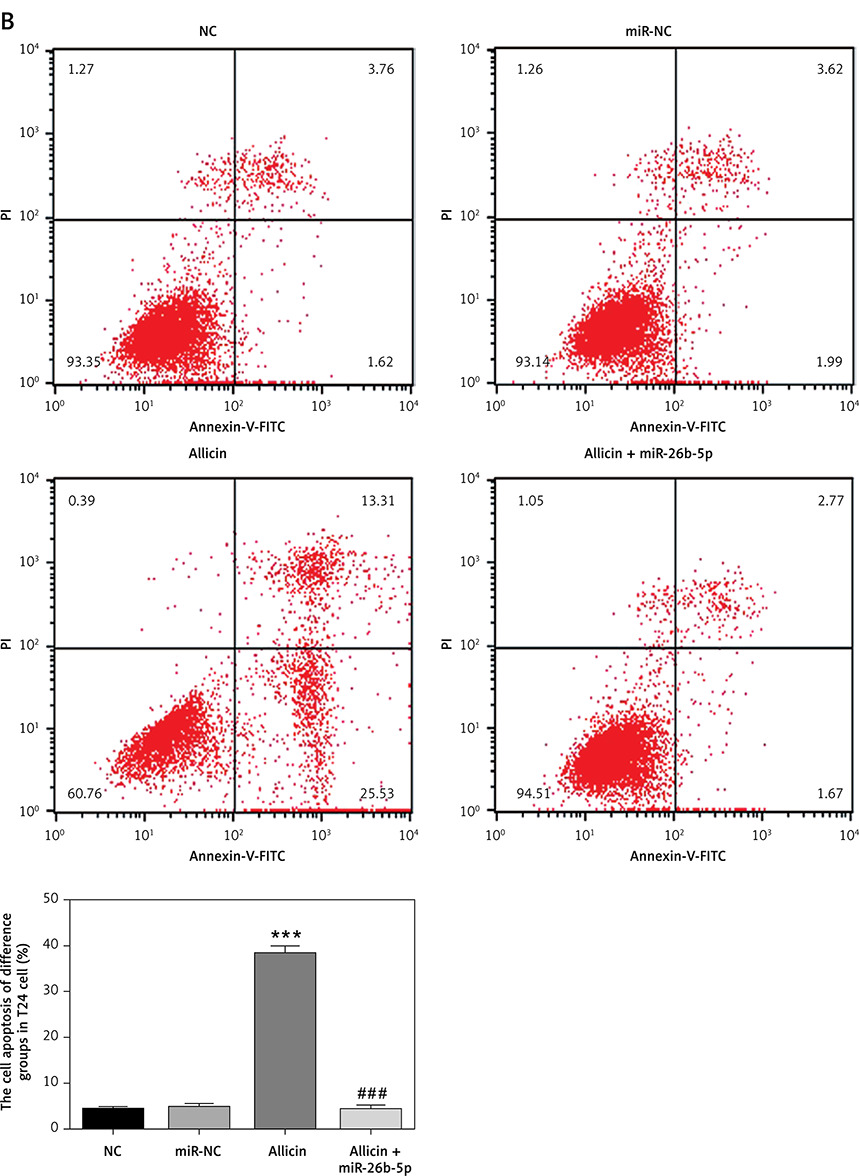
Role of microRNA-26b-5p in allicin-induced cell proliferation and apoptosis
Compared with the NC group, there was no significant difference in cell proliferation and apoptosis in the miR-NC group with 5637 and T24 cells transfected with blank vectors (p > 0.05). After allicin treatment, 5637 and T24 cells showed a significant increase in the apoptotic rate and a significant decrease in the proliferation rate (p < 0.001, Figures 8, 9). After simultaneous treatment with allicin and transfection with miR-26b-5p, allicin + miR-26b-5p showed significantly higher cell proliferation and a significantly lower apoptotic rate when compared with the allicin group (p < 0.001, Figures 8, 9).
Figure 8
The cell proliferation rate of different groups by MTT assay (100×). NC – the cells were treated with normal treatment; miR-NC – the cells were transfected with miR-negative control (NC); Allicin – the cells were treated with 50 μg/ml allicin; allicin + miR-26b-5p – The cells were transfected with miR-26b-5p and treated with 50 μg/ml allicin. A – The cell proliferation rate of different groups by MTT assay in 5637 cell lines (100×); B – The cell proliferation rate of different groups by MTT assay in T24 cell lines (100×)
***P < 0.001, compared with NC group; ###p < 0.001, compared with allicin group.
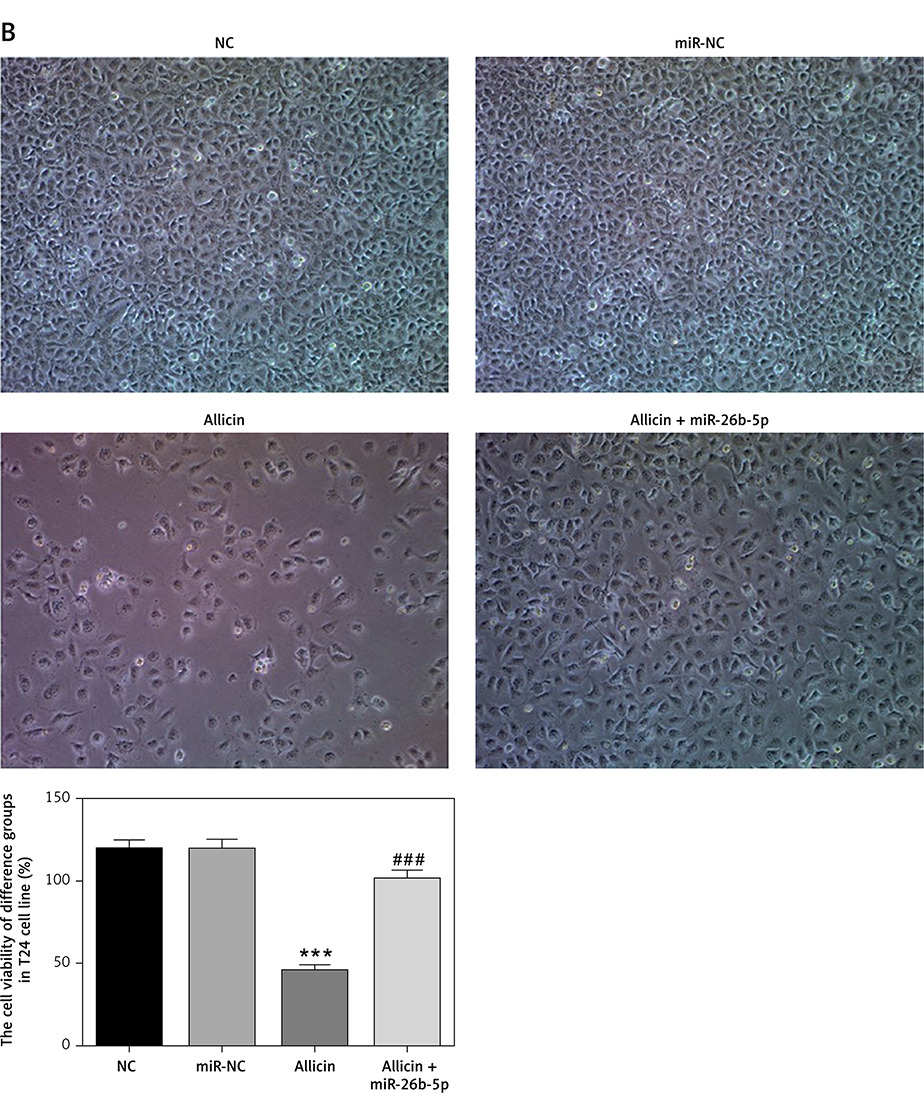
Figure 9
The cell apoptosis rate of different groups by flow cytometry. NC – the cells were treated with normal treatment; miR-NC – the cells were transfected with miR-negative control (NC); Allicin – the cells were treated with 50 μg/ml allicin; allicin + miR-26b-5p – the cells were transfected with miR- 26b-5p and treated with 50 μg/ml allicin. A – The cell apoptosis rate of different groups by flow cytometry in 5637 cell line; B – The cell apoptosis rate of different groups by flow cytometry in T24 cell line
***P < 0.001, compared with NC group; ###p < 0.001, compared with allicin group.
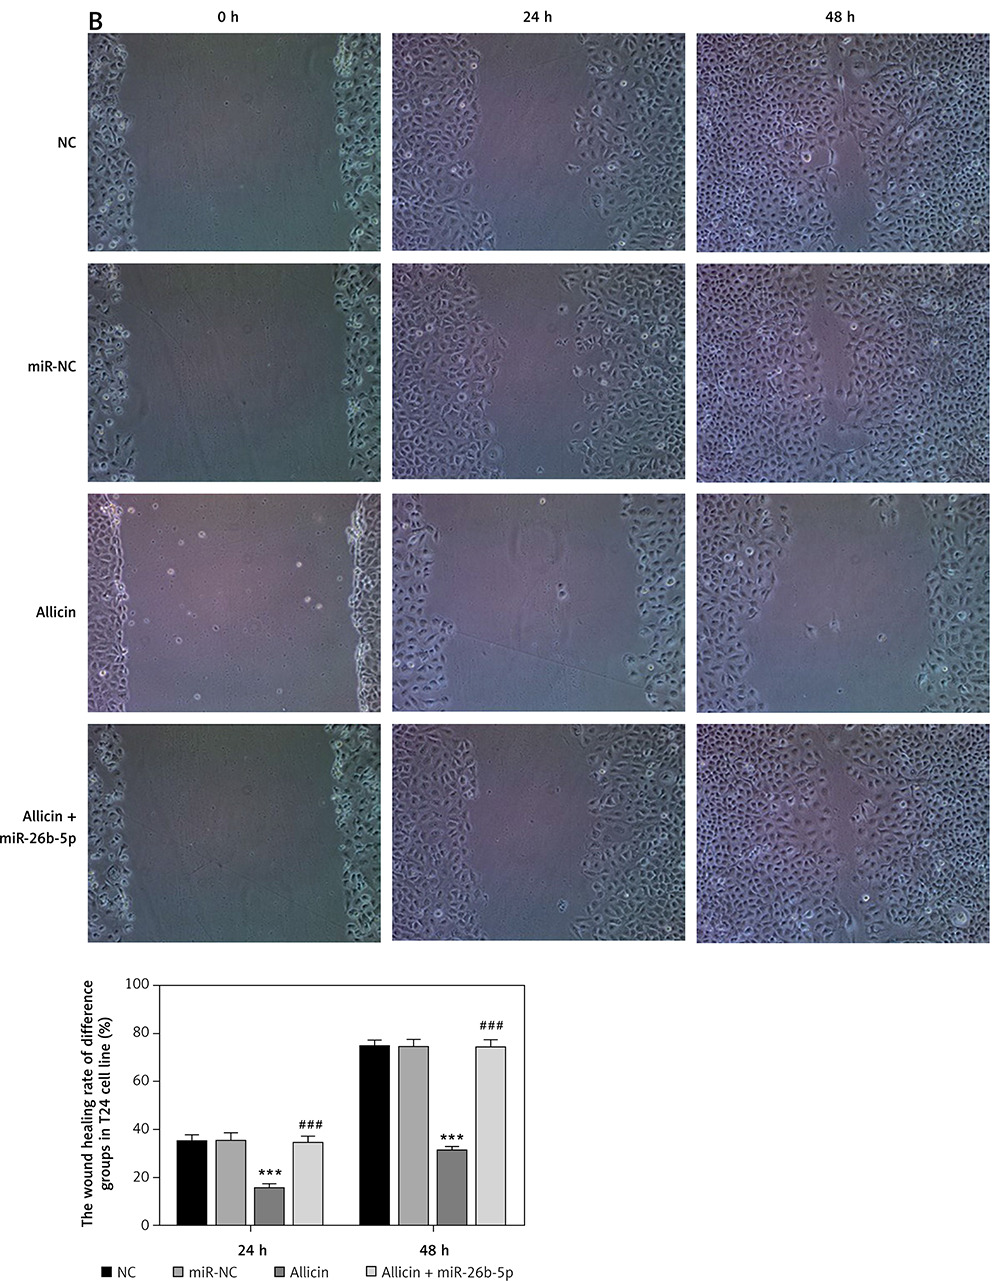
Role of microRNA-26b-5p in Allicin-inhibited cell invasion and migration
Compared with the NC group, there was no significant difference in the number of invasive cells or the wound-healing rate in the miR-NC group with 5637 and T24 cells transfected with blank vectors (p > 0.05). Compared with the NC group, the number of invasive cells and the wound-healing rate were significantly inhibited in the allicin group after allicin treatment (p < 0.001, Figures 10, 11). Furthermore, compared with the allicin group, the number of invasive cells and wound-healing rate in the allicin + miR-26b-5p group was significantly higher after miR-26b-5p was transfected into cells (p < 0.001, Figures 10, 11).
Figure 10
The invasion cell number of different groups by transwell assay (200×). NC – the cells were treated with normal treatment; miR-NC – the cells were transfected with miR-negative control (NC); Allicin – the cells were treated with 50 μg/ml allicin; allicin + miR-26b-5p – the cells were transfected with miR-26b-5p and treated with 50 μg/ml allicin. A – The invasion 5637 cell number of different groups by transwell assay (200×); B – The invasion T24 cell number of different groups by transwell assay (200×)
***P < 0.001, compared with NC group; ###p < 0.001, compared with allicin group.
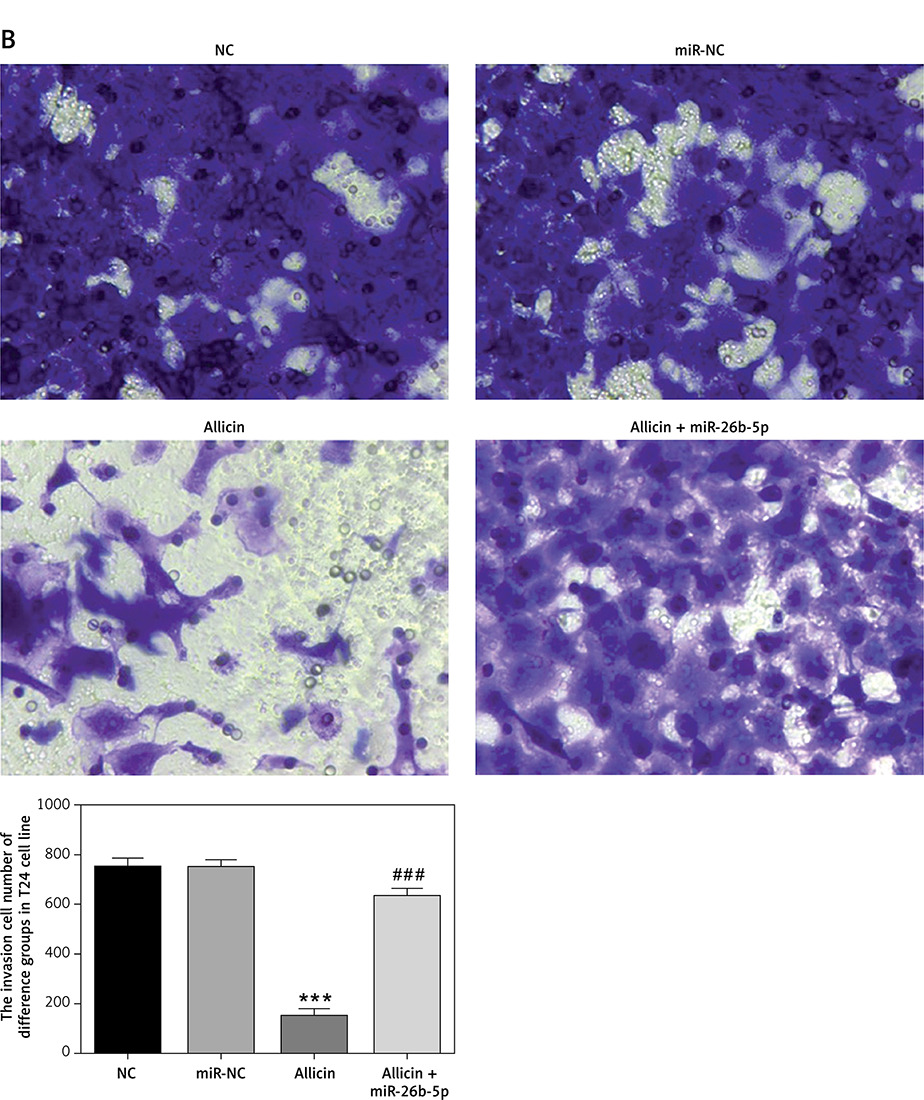
Figure 11
The wound healing rate of different groups by wound healing assay (100×). NC – the cells were treated with normal treatment; miR-NC – the cells were transfected with miR-negative control (NC); allicin – the cells were treated with 50 μg/ml allicin; allicin + miR-26b-5p – The cells were transfected with miR-26b-5p and treated with 50 μg/ml allicin. A – The wound healing rate of different groups by wound healing assay in 5637 cell line (100×); B – The wound healing rate of different groups by wound healing assay in T24 cell line (100×)
***P < 0.001, compared with NC group; ###p < 0.001, compared with allicin group.
Expression of related proteins and correlation between miR-26b-5p and PTEN in 5637 and T24 cells
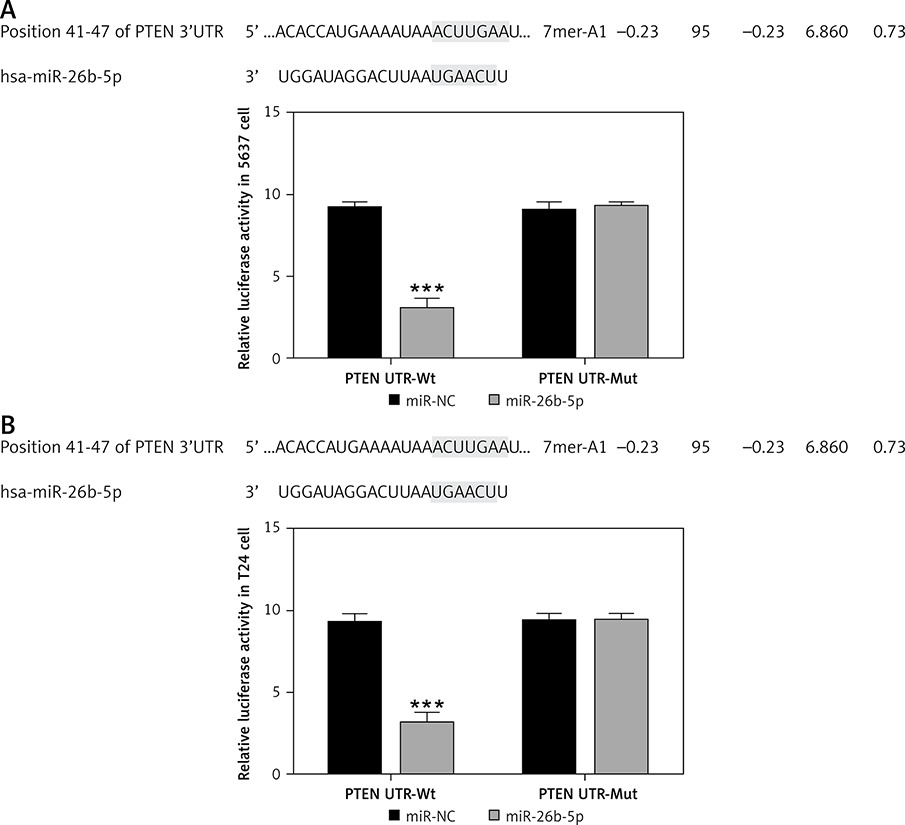
In view of the relative protein expression results obtained by WB, compared with the NC group, there was no significant difference in PTEN, PI3K and AKT protein expression in the miR-NC group with 5637 and T24 cells transfected with blank vectors (p > 0.05). After allicin treatment, PTEN expression was significantly higher in the allicin group than that in the NC group, while PI3K and AKT expression were significantly inhibited (p < 0.001, Figure 12). Moreover, following transfection of miR-26b-5p into cells, compared with the allicin group, the expression of PTEN was significantly higher in the allicin + miR-26b-5p group, while the expression of PI3K and AKT was clearly inhibited (p < 0.001, Figure 12). Dual luciferase assay showed that in 5637 and T24 cells, miR-26b-5p could target PTEN expression (p < 0.001, Figure 13).
Figure 12
The relative protein expression by WB assay. NC – The cells were treated with normal treatment; miR-NC – the cells were transfected with miR-negative control (NC); Allicin – the cells were treated with 50 μg/ml allicin; allicin + miR-26b-5p – the cells were transfected with miR-26b-5p and treated with 50 μg/ml allicin. A – The relative protein expression by WB assay in 5637 cell line. B – The relative protein expression by WB assay in T24 cell line
***P < 0.001, compared with NC group; ###p < 0.001, compared with allicin group.
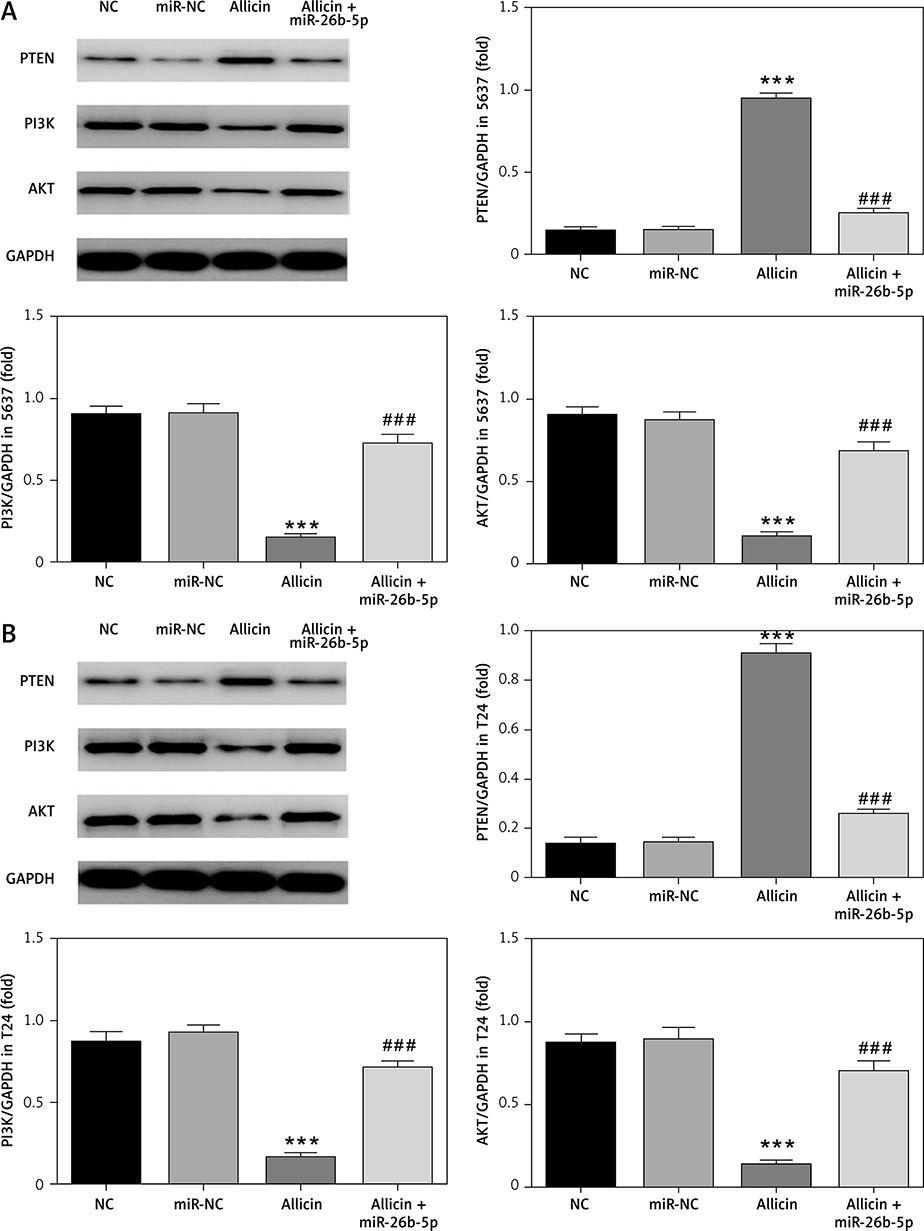
Figure 13
The correlation between miR-26b-5p and PTEN by dual luciferase assay. NC – The cells were treated with normal treatment; miR-NC – The cells were transfected with miR-negative control (NC); Allicin – The cells were treated with 50 μg/ml allicin; allicin + miR-26b-5p – The cells were transfected with miR-26b-5p and treated with 50 μg/ml allicin. A – The correlation between miR-26b-5p and PTEN by dual luciferase assay in 5637 cell line. B – The correlation between miR-26b-5p and PTEN by dual luciferase assay in T24 cell line
***P < 0.001, compared with NC group; ###p < 0.001, compared with allicin group.
Discussion
Allicin is a natural sulphur-containing compound extracted from garlic, which is synthesized by alliin (S-allyl cysteine sulfoxide), a non-protein amino acid, catalysed by alliinase, and is the main source of fresh garlic odour [9]. As a thiosulfate, allicin can react with glutathione and sulfhydryl groups in proteins, and has strong biological activity in microorganisms, plants and animal cells [10]. Allicin has been reported to have several pharmacological effects, such as anti-inflammation, anti-oxidation, anti-microbial properties, etc. It also has the effects of lowering blood pressure, lowering blood lipids and improving microcirculation, which have been widely used in clinical practice [11–13]. Previous studies have demonstrated that allicin has a strong anti-tumour effect, can significantly inhibit the proliferation of hepatocellular carcinoma, gastric cancer, ovarian cancer and other cancer cells, but exerts quite a low cytotoxic effect on normal tissues [14–16]. As evidenced by a prior study, allicin can induce cell apoptosis via the mitochondrial pathway and inhibit the proliferation of human leukaemia HL-60 cells and human histiocytic lymphoma U937 cells [17]. The results of this study showed that allicin could effectively inhibit the biological activity of bladder cancer in a significant dose-dependent manner. Moreover, the inhibitory effect on the activity of bladder cancer cells peaked when the concentration of allicin reached 50 µg/ml. Meanwhile, the results also showed that the expression level of miR-26b-5p decreased significantly with the increase in allicin concentration.
MicroRNAs (miRNAs) consist of short RNA segments 19–25 nucleotides in length, which can regulate gene expression at the post-transcriptional level and participate in various biological behaviours such as cell proliferation, differentiation, apoptosis, aging and metastasis [18, 19]. Increasingly, many studies have shown that miRNAs play an important regulatory role in the occurrence and development of bladder cancer. Research on the mechanism of action of miRNAs has become the focus of research in the field of bladder cancer [20, 21]. For example, the expression of some miRNAs, such as miR-497 [22], miR-139-5p [23] and miR-608 [24], decreases significantly in bladder cancer tissues, which could significantly inhibit the growth or metastasis of bladder cancer cells. Meanwhile, the expression of other miRNAs, such as miR-556-3p [25] and miR-495 [26], clearly increased, which could promote the metastasis and proliferation of bladder cancer cells remarkably. In this study, the experimental results showed that the expression level of miR-26b-5p was clearly decreased after allicin treatment. Therefore, it was speculated in our study that Allicin-mediated inhibition of bladder cancer activity might be intimately related to the decrease in miR-26b-5p.
P13K/AKT signalling is imbalanced in multiple human tumours. Activated by P13K phosphorylation, AKT can promote cell proliferation, invasion and migration and inhibit cell apoptosis, which is the core effect of the proposed signalling pathway [27]. PTEN is an essential tumour suppressor gene, which can regulate the P13K/AKT signalling pathway by negative feedback. The loss of PTEN expression can cause tumour progression, poor prognosis and lymph node metastasis [28]. Furthermore, PTEN can dephosphorylate P13K and lose the activation capability of AKT, thus inhibiting the activity of P13K/AKT. Therefore, it is named the PTEN/PI3K/AKT signalling pathway by most researchers [29]. In the present study, allicin treatment significantly inhibited the expression of PTEN protein and the downstream PI3K/AKT signalling pathway activity while inhibiting the expression of miR-26b-5p. Moreover, the dual luciferase reporter assay was used to verify the correlation between miR-26b-5p and PTEN in bladder cancer 5367 and T24 cells. The results suggested that miR-26b-5p could target the expression of PTEN in bladder cancer 5367 and T24 cells.
In conclusion, allicin can effectively inhibit the biological activity of bladder cancer cells by inhibiting the expression of miR-26b-5p/PTEN effectively.