Introduction
Extravillous trophoblasts are an important component of the placenta having a key role in placenta development [1]. Abnormal growth and function of extravillous trophoblasts may lead to disorders in placenta formation, causing a range of pregnancy-related diseases. Insufficient trophoblast invasion can cause miscarriage, fetal growth restriction and preeclampsia (PE) [2], whereas excessive invasion can cause placental adhesions and implantation [3]. The proliferation and invasion of extravillous trophoblasts are strictly regulated by a series of molecules. Some positive regulators, such as matrix metalloproteinase (MMP)-2 and MMP-9, promote the migration and invasion of extravillous trophoblasts [4], whereas some negative regulators, such as miRNA-155, can inhibit their migration and invasion [5]. Studies have shown that the expression of bradykinin B2 receptor (B2R) is significantly reduced in extravillous trophoblast patients with PE [6]. Continuous subcutaneous injection of a B2R antagonist (bradyzide) can cause a transient increase in systolic blood pressure in guinea pigs in early pregnancy, and can lead to restricted progeny growth and reduced trophoblast invasion in the spiral artery [7]. In the G protein-coupled receptor superfamily, B2R has an important role and participates in various biological processes, mainly by binding to bradykinin and activating downstream signalling pathways. Relevant studies have suggested that miRNAs can inhibit the biological activity of tumour cells by regulating B2R [8–10]. These studies suggested that miRNAs targeting B2R may be closely related to the proliferation and invasion of extravillous trophoblasts in early pregnancy. However, the direct involvement of miRNAs targeting B2R in the supervision of cell function has not been explicitly reported. Our present study discussed the effect and possible systems of B2R-targeting miRNA-29b-3p on the biological behaviour of the human early-pregnancy extravillous trophoblast cell line HTR-8/SVneo.
Material and methods
Clinical samples
Placenta tissues were collected between June 2016 and March 2018 from 30 normal controls and 30 patients with PE, including 20 mild cases and 10 severe cases in Qilu Hospital of Shandong University. The collected samples were stored at –80°C before 2017.12 and new samples were stored at –20°C. This study protocol was approved by the ethics committee of Qilu Hospital of Shandong University, and all subjects included in the study signed the informed consent.
Cells and reagents
The cell line used in this study was the immortalised human early-pregnancy extravillous trophoblast cell line HTR-8/SVneo, which was provided by ATCC. RPMI 1640 medium, foetal bovine serum (FBS), ethylenediaminetetraacetic acid (EDTA), penicillin and streptomycin were purchased from Gibco (USA). Lipofectamine 3000 was purchased from Thermo Fisher (USA). The RNA extraction reagent Trizol was purchased from Beijing Tiangen Biochemical Technology Co., Ltd. 5X All-In-One RT Master Mix reverse transcription reagent was purchased from Shanghai Yudu Biotechnology Co., Ltd. SYBR Green Supermix was purchased from Nanjing Vazyme Company. Primers for B2R, MMP-2, MMP-9, cyclin-1 (CCND-1), vascular endothelial growth factor-A (VEGF-A) and glyceraldehyde-3-phosphate dehydrogenase (GAPDH) were purchased from Shanghai Ruizhen Biotechnology Co., Ltd. Cell Counting Kit-8 (CCK-8) was purchased from the Dojindo Laboratories (Japan). Artificial basement membrane Matrigel was purchased from BD Biosciences (USA). Transwell chambers were purchased from Millipore (USA). Antibodies against B2R, VEGF-A, CCND-1, MMP-2, MMP-9 and GAPDH were purchased from Abcam (UK). Negative control small interfering RNA (siRNA) sequence 5′-UGGUUUACAUGUUUUCUGA-3′, B2R-specific siRNA sequence 5′-GGCAGAGGAAGAUAUUUCU-3′, miR-29b-3p inhibitor sequence 5′-AACACUGAUUUCAAAUGGUGCUA-3′ and si-NC sequence 5′-CACUGAUUUCAAAUGGUGCUAUU-3′ were purchased from Guangzhou Ruibo Biotechnology Co., Ltd. The pcDNA 3.1 and pcDNA 3.1-B2R plasmids were provided by Shanghai Jierui Bioengineering Co., Ltd.
Sample collection
Several pieces of placental tissue, about 1 cm3 in total volume, were collected within 1 min after placenta delivery under sterile conditions from the mother’s side away from calcified plaques. The samples were washed with normal saline twice and were stored at –80°C for a long time or fixed in 4% paraformaldehyde at 4°C for 24 h, dehydrated, cleared, paraffinised, embedded, sectioned into 5 μm slices and stored in a –20°C refrigerator.
HE staining
The slices were baked at 55°C for 1 h, dewaxed, hydrated, stained with haematoxylin, blued with ammonia, stained with eosin, dehydrated, cleared, sealed with neutral resin and observed under a microscope.
Cell cultivation
RPMI 1640 medium containing 10% FBS, with 100 U/ml penicillin and 100 mg/ml streptomycin, was used to cultured cells in a 5% CO2 incubator at 37°C. 1–2 days later, the cells were digested with 0.25% trypsin–EDTA solution and sub-cultured at 1 : 2 to 1 : 3. The cells were inoculated into culture plates for subsequent experiments when they reached 70–90% confluence.
Cell transfection
HTR-8/SVneo cells were seeded in culture plates at 2 × 10⁵ cells/ml. When cell confluence reached 50–70%, transfection was carried out with Lipofectamine 3000 following the instructions.
RT-qPCR assay
After thorough mixing, the cells were lysed by adding 1 ml of Trizol reagent, and the total RNA was extracted according to the instructions. The quality and concentration of RNA were determined using a NanoDrop 2000 spectrophotometer, and 1 μg of RNA was reverse-transcribed into cDNA following the instructions. The PCR primer sequences are shown in Table I. The amplification conditions were pre-denaturation at 95°C for 5 min, and then 40 cycles of denaturation at 95°C for 15 s before annealing/extension at 60°C for 60 s, and finally cooling down to 40°C. Gene expression was calculated through the 2– Δ Δ Ct method. Three duplicate wells were set for each group, and the experiment was repeated three times to obtain an average.
Western blot analysis
After thorough disruption of the tissues and cells, a proper amount of protein lysis buffer was added to the wells, which were incubated for 20 min and centrifuged at 1200 rpm for 6 min (radius = 12 cm). The supernatant was obtained. The protein concentration was determined by the quinolinic acid method and adjusted by referring to the protein standard. The proteins were then separated on 10% sodium dodecyl sulphate-polyacrylamide gel, and the protein bands were transferred to a polyvinylidene fluoride membrane. The membrane was blocked with Tris-buffered saline containing 2% bovine serum albumin for 90 min, incubated with anti-B2R antibody (1 : 200), anti-CCND-1 antibody (1 : 1000) or anti-VEGF-A antibody (1 : 1000) at 4°C overnight. Moreover, the membrane was incubated with horseradish peroxidase-labelled secondary antibody at 37°C for 60 min. GAPDH was used as the internal reference. The protein bands were visualised by the enhanced chemiluminescence method. Grey values of each protein band were determined by Image J software. Three duplicates were set for each group.
CCK-8 assay to determine cell proliferation activity
HTR-8/SVneo cells with a confluence of 70–90% were harvested with trypsin containing EDTA and resuspended with RPMI 1640 medium to 105 cells/ml. The suspension was then seeded on a 96-well plate at 100 μl/well. After complete adherence, the cells were treated as specified for each group, and 10 μl of CCK-8 reagent was added 24 h later. The plate was gently shaken to ensure even distribution of the agent in the culture medium and then cultured for 4 h at 37°C. Absorbance at a wavelength of 450 nm was measured using a microplate reader. Three duplicate wells were set for each group, and the experiment was repeated three times to obtain an average.
Flow cytometry to determine cell apoptosis
The HTR-8/SVneo cells were treated for 72 h as specified for each group before digestion with trypsin without EDTA. The cells were rinsed with PBS (2 ml) three times and centrifuged to collect the cells at 1200 rpm for 10 min (radius = 12 cm). The cell precipitate was resuspended with 250 μl of PBS into single cells before 750 μl of pre-chilled pure ethanol was added to the cells while shaking. The cells were then fixed at 4°C overnight. The cells were stained with a dye mix containing RNase, propidium iodide and Triton for 15 min at 4°C. Cell apoptosis was determined by flow cytometry. Three duplicate wells were set for each group, and the experiment was repeated three times to obtain an average.
Flow cytometry to determine cell cycle distribution
After treatment as specified for each group for 72 h, the cells were digested with trypsin without EDTA, washed with PBS three times and centrifuged at 1500 rpm for 5 min (radius = 12 cm). The cell precipitate was resuspended with 250 μl of PBS into single cells, and 750 μL of pre-chilled pure ethanol was added to the cells while shaking. The cells were fixed at 4°C overnight. The cells were then stained with a dye mix containing RNase, propidium iodide and Triton for 15 min at 4°C. Cell cycle distribution of the cells was determined by flow cytometry. Three duplicate wells were set for each group, and the experiment was repeated three times to obtain an average.
Cell migration assay
Cells were seeded in 6-well plates until reaching a confluence of 70–90%. The cells were treated as specified for each group for 6 h, and a straight line was drawn at the centre of each well with a 1 ml pipette tip vertical to the cell plane to ensure that the width of the lines was even. The wells were rinsed with PBS three times, and RPMI 1640 medium containing 10% FBS was added. The cells were cultured at 37°C in a 5% CO2 incubator for another 48 h, and the sites were photographed again and compared with those at 0 h. Three duplicate wells were set for each group, and the experiment was repeated three times to obtain an average.
Cell invasion assay
The membrane of each transwell chamber (8 μm pore size) was immersed in 50 μl of Matrigel diluted with serum-free RPMI-1640 medium and allowed to undergo full polymerisation in a 37°C incubator containing 5% CO2 for 30–60 min. Subsequently, the residual liquid was removed. After 24 h of treatment, the cells were digested with 0.25% trypsin, centrifuged after terminating digestion, washed twice with PBS and resuspended in RPMI 1640 medium containing 1% FBS to 5 × 10⁵ cells/ml. We added 200 μl of suspension to the upper chamber of each transwell apparatus, and added the RPMI 1640 containing 10% FBS to the lower chamber. The chamber was gently assembled to avoid air bubbles and then incubated for 24 h. The transwell chamber was removed, and the Matrigel and cells on the upper side of the membrane were gently wiped off with a wet cotton swab. The chamber was then fixed in 4% paraformaldehyde for 20 min at room temperature, stained with 0.2% crystal violet for 20 min, washed three times with PBS, dried and placed under a microscope. Three 200× views were randomly selected for each chamber, and the number of cells on the bottom of the membrane was counted.
Immunofluorescence assay to determine B2R protein expression
After treatment as specified for each group for 24 h, the cells were cultured in 24-well plates with a cover slip in each plate. After adherence, the cells were treated with 1%, 5% or 10% FBS for 48 h, washed with PBS two times for 5 min, and fixed with 4% paraformaldehyde for another 15 min. The cells were washed with PBS again two times for 5 min, penetrated with 0.1% Triton for 5 min, blocked with 100 μl of goat serum for 15 min, incubated with 60 μl of anti-B2R antibody (1 : 75) at 4°C overnight and incubated with fluorescent secondary antibody (1 : 100) at room temperature for 30 min. Finally, the cover slip was sealed with anti-quenching resin containing DAPI and observed under a fluorescence microscope. Photographs were obtained, and B2R expression was compared among the groups.
Statistical analysis
The data were analysed using SPSS 20.0 software. Data were represented as the mean ± standard deviation (mean ± SD). All cell experiments were independently repeated three times. Experimental data were compared among the groups using one-way ANOVA. Pairwise comparison between groups was carried out by LSD analysis for those with equal variance or Dunnett’s T3 analysis for those with unequal variance. P < 0.05 was considered statistically significant.
Results
Clinical sample analysis
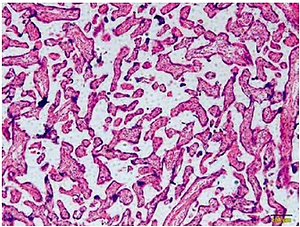
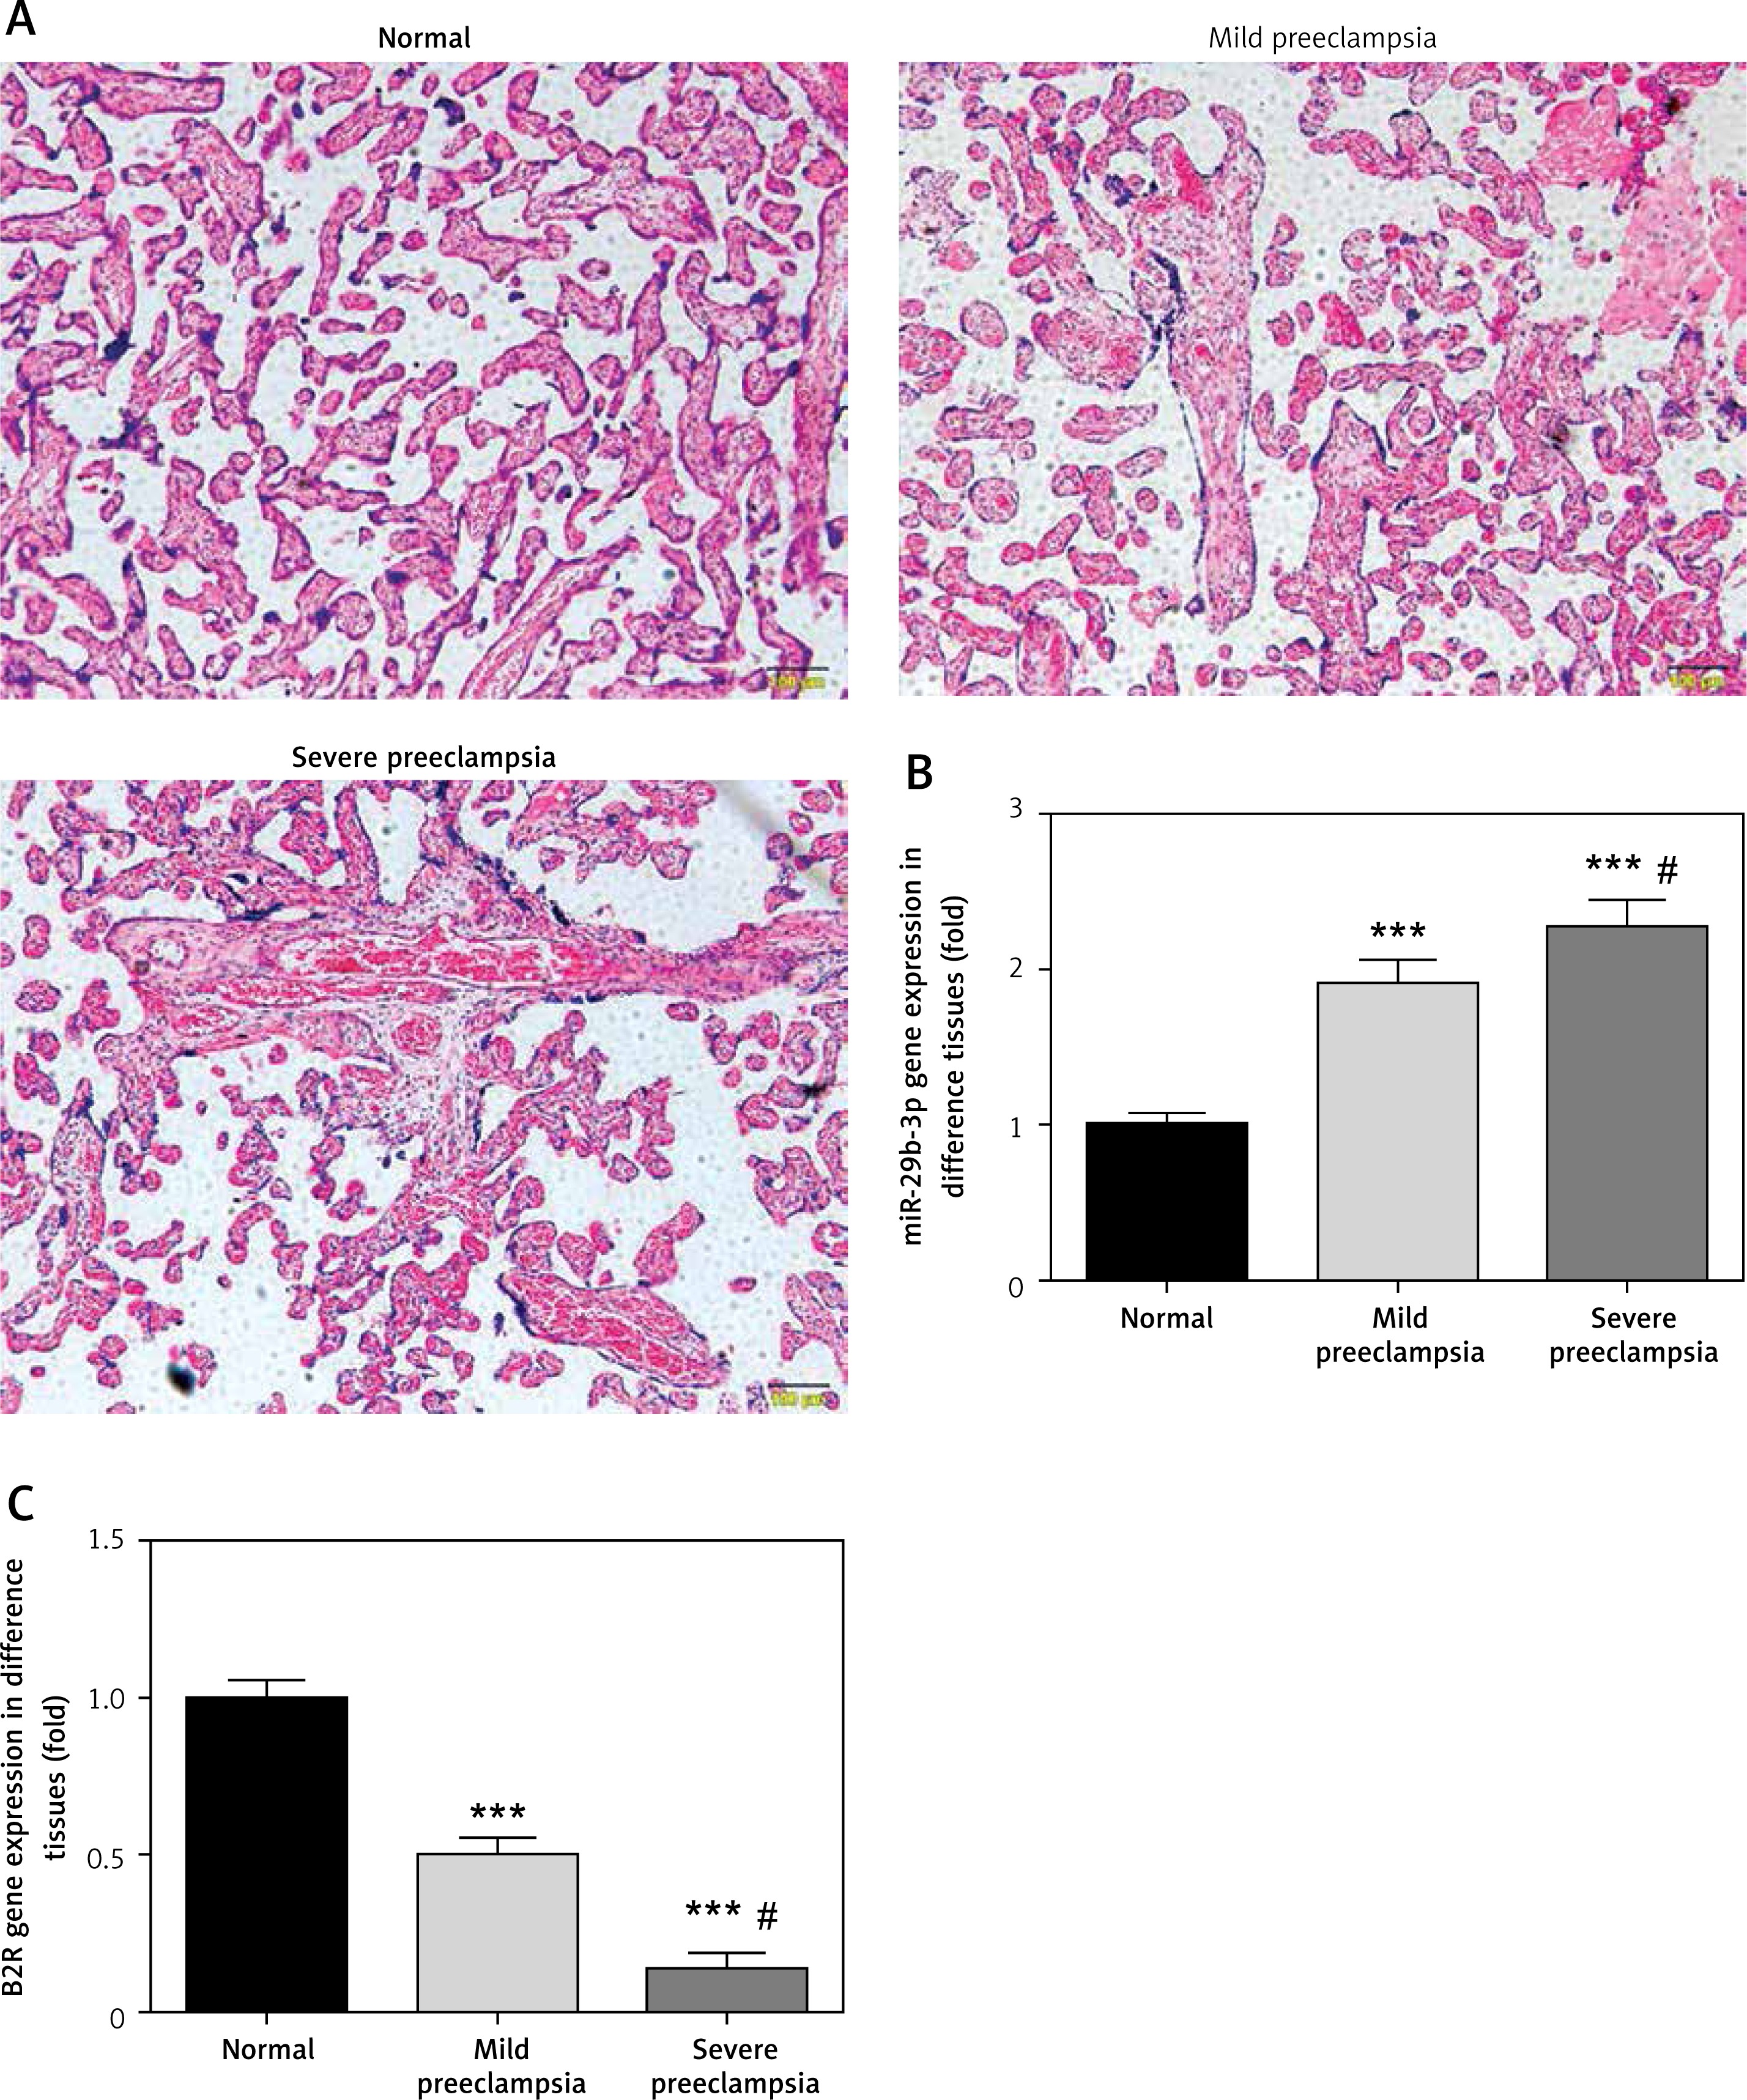
Figure 1 A is the HE staining result of a normal placenta sample, which showed well-developed placental villi and uniform matrix. The cells were in good shape with minimal interstitium. The tissue was well vascularised, and the nuclei of the syncytiotrophoblasts were neatly arranged. A few red blood cells were observed in the lumen of the villus capillary, and cellulose-like necrosis was noted around the villi. The placental tissue of patients with PE was undeveloped. The villi were poorly vascularised with interstitial oedema, and nuclei of the syncytiotrophoblasts were deranged. More cellulose-like necrosis was observed around the villi, with decreased blood vessels and narrowed lumen. These alterations were more remarkable in patients with severe PE than in mild cases. miR-29b-3p and B2R mRNA of each group were determined by RT-PCR, which showed higher miR-29b-3p PE than that in normal controls (p < 0.001; Figure 1 B). By contrast, B2R expression in patients with PE was significantly decreased (Figure 1 C). miR-29b-3p and B2R also mRNA showed a dramatic difference between patients with severe and mild PE (p < 0.05; Figures 1 B and C).
Effect of miR-29b-3p inhibitor on expression of miR-29b-3p and B2R in each group
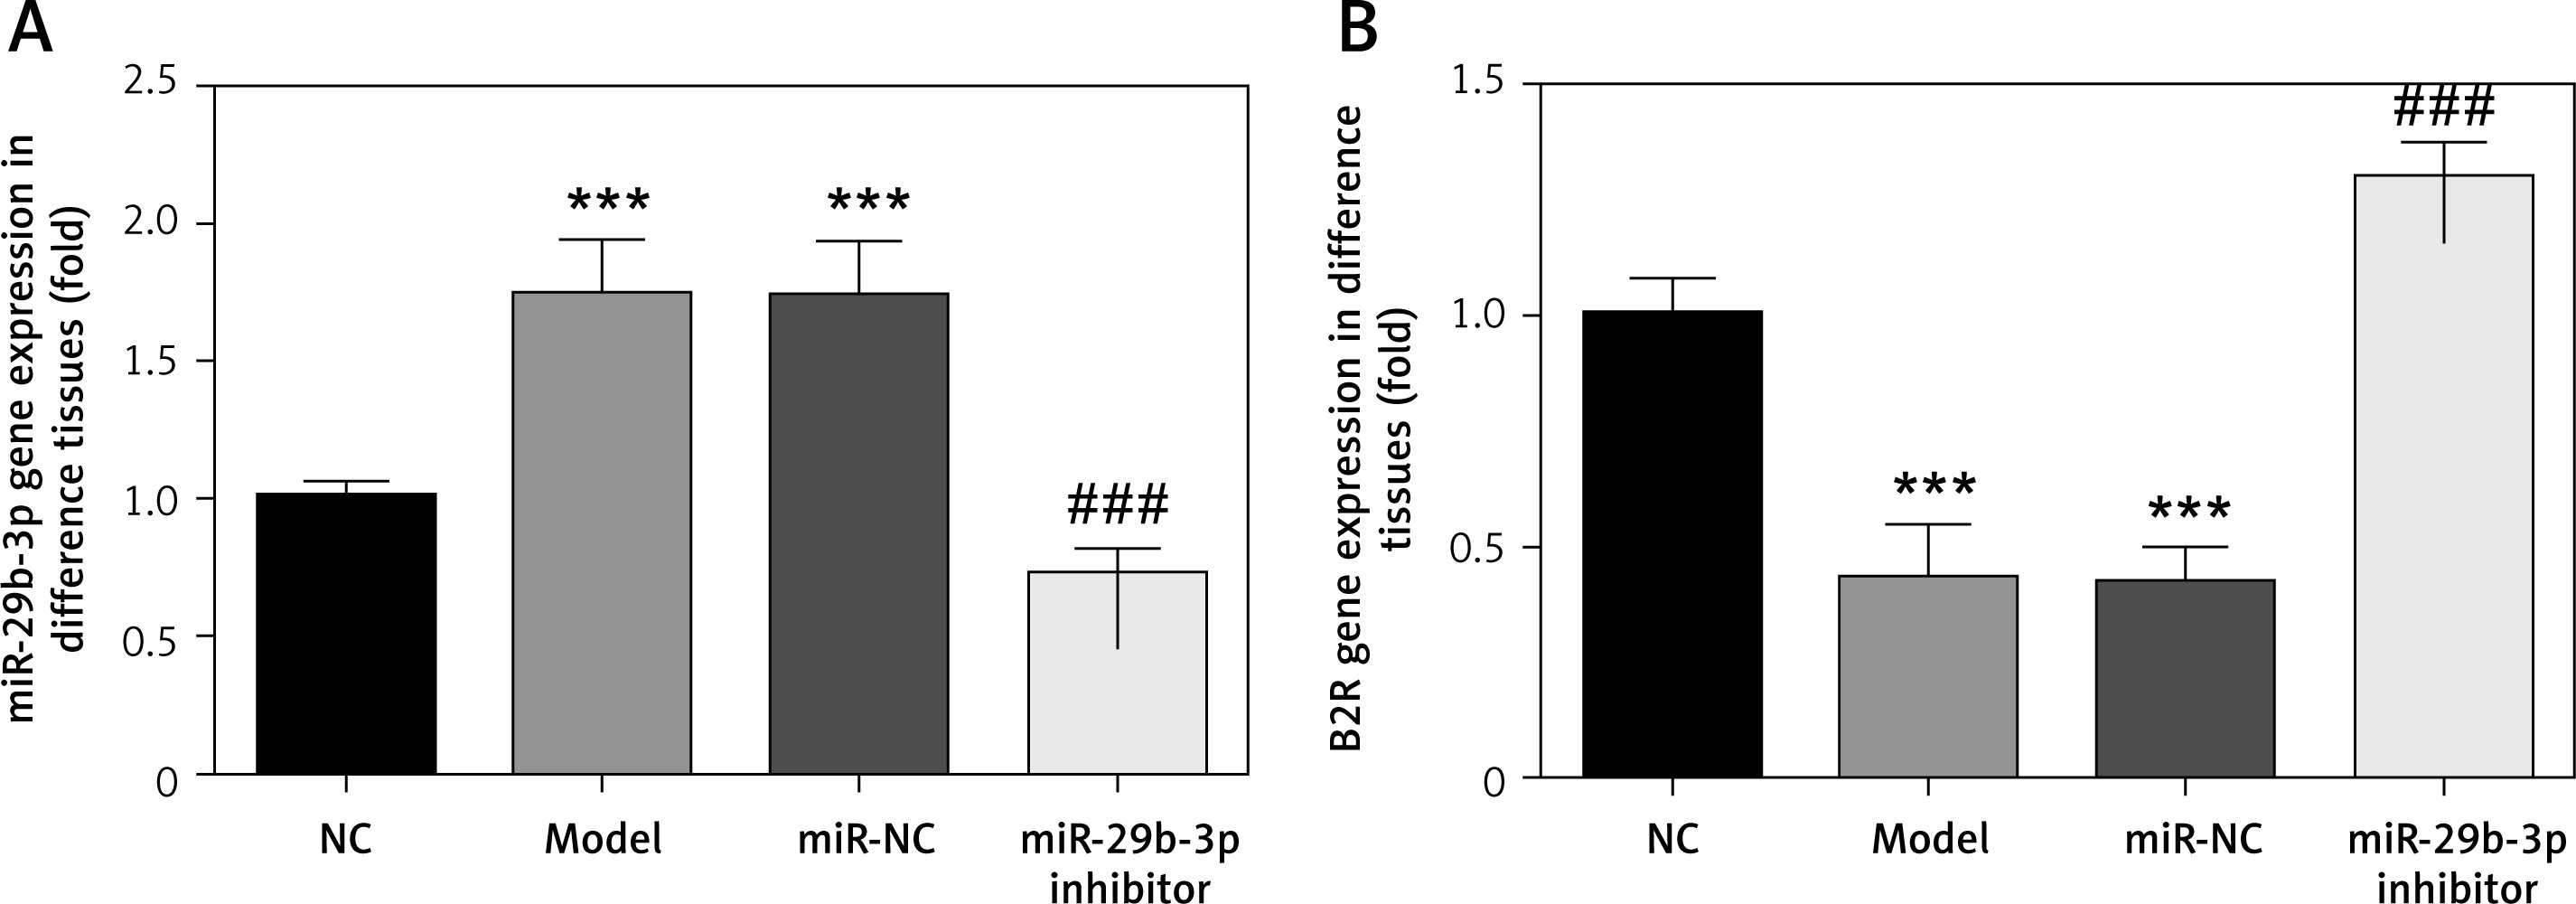
As revealed by RT-PCR, miR-29b-3p in both the model and miR-NC groups significantly increased, compared with the NC group (p < 0.001; Figure 2 A), whereas B2R expression significantly decreased (p < 0.001; Figure 2 B). miR-29b-3p inhibitor significantly decreased miR-29b-3p expression compared with the model group (p < 0.001; Figure 2 A) and increased B2R expression (p < 0.001; Figure 2 B). This result indicated that the miR-29b-3p inhibitor exerted a significant inhibitory effect on miR-29b-3p, which could effectively inhibit B2R expression.
Effect of miR-29b-3p inhibitor on proliferation and apoptosis
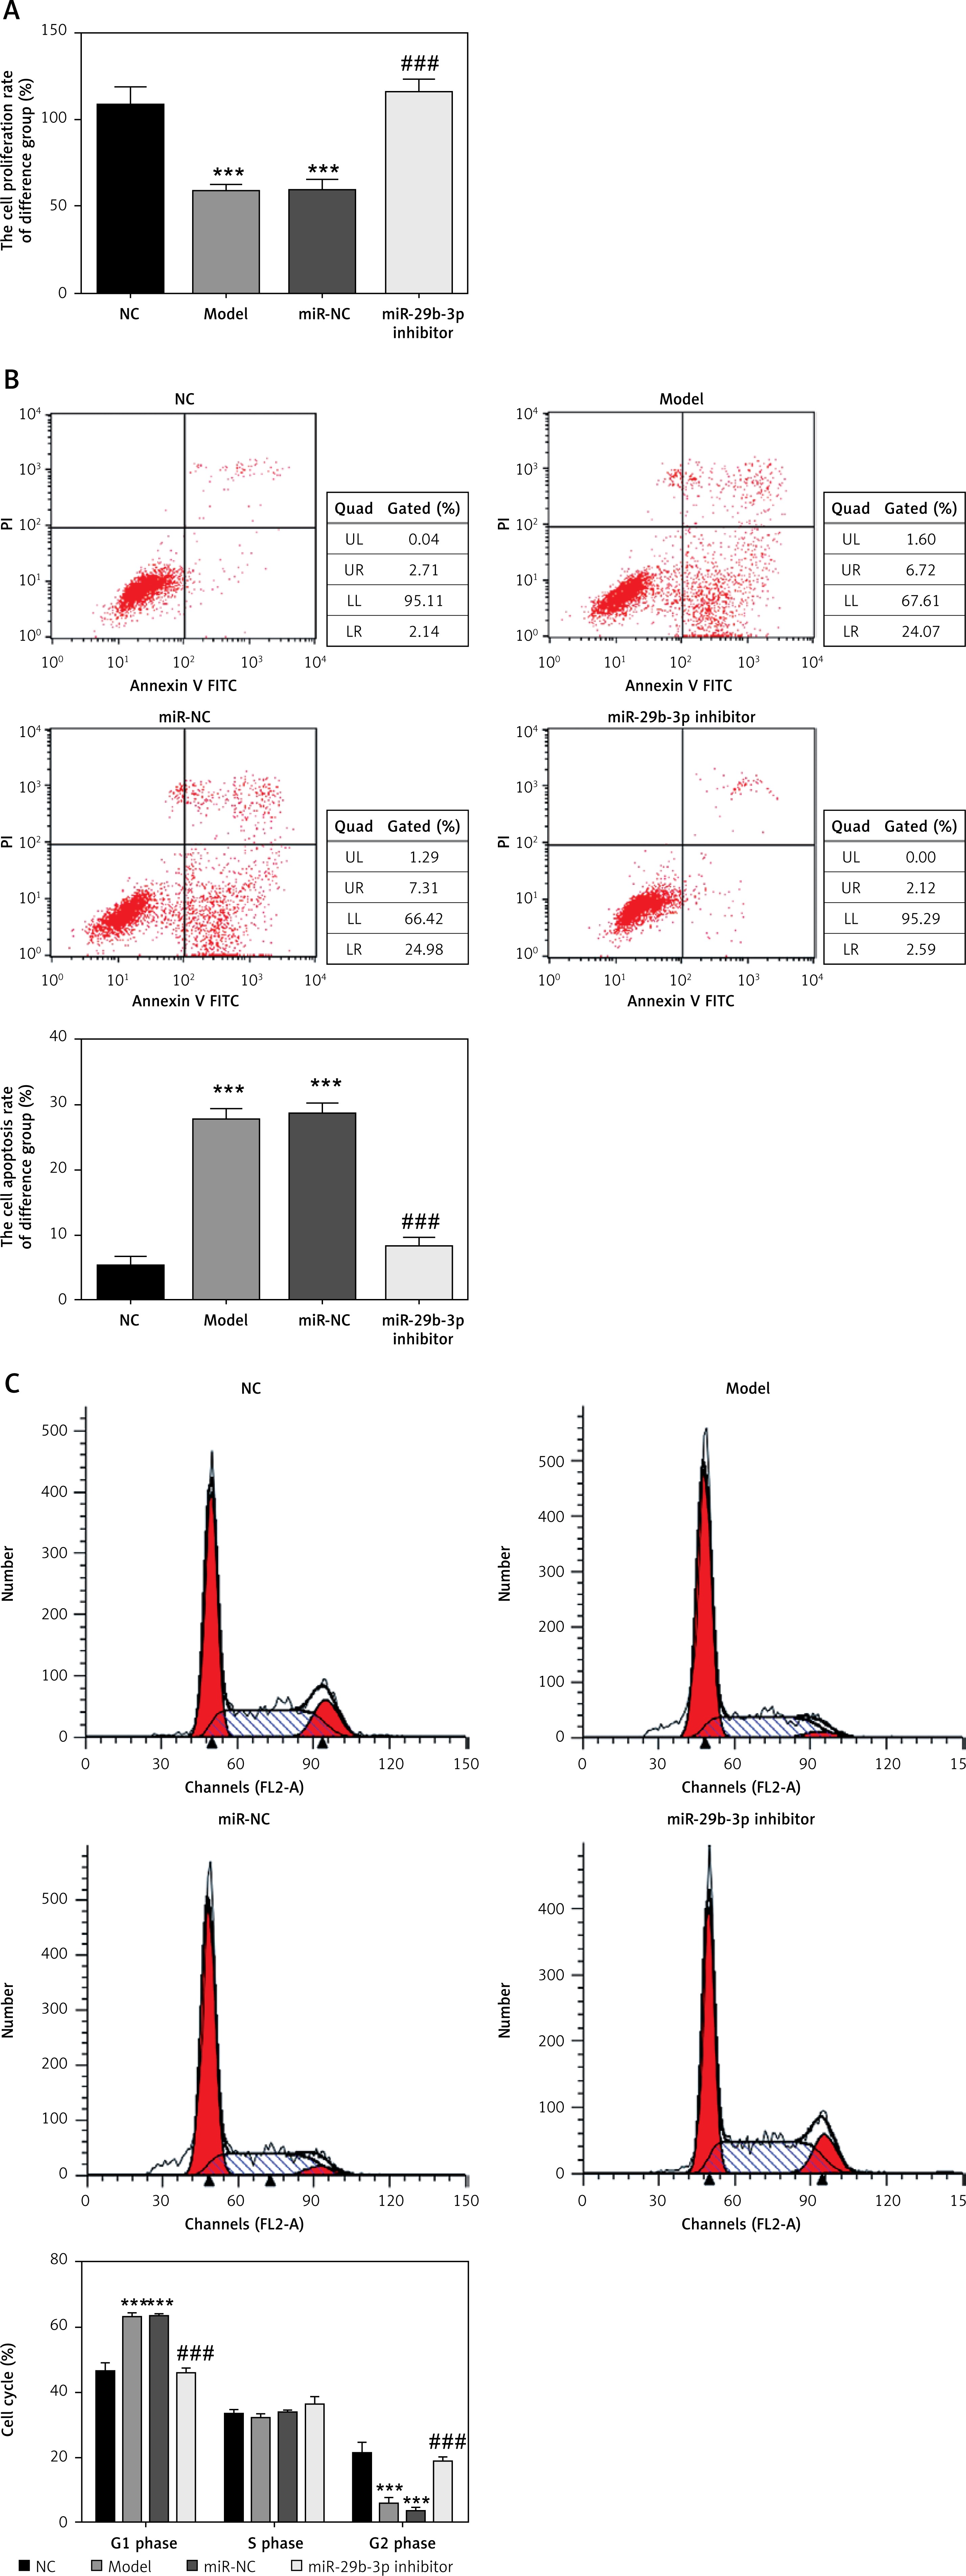
To identify the effect of miR-29b-3p inhibitor on the cell proliferation of the HTR-8/SVneo cells, the proliferation rate of the cells was detected by CCK-8 assay. We measured apoptosis and cell cycle by flow cytometry. The model and miR-NC groups showed significantly decreased cell proliferation compared with the NC group (p < 0.001; Figure 3 A) and significantly increased apoptosis and G1 distribution (p < 0.001; Figures 3 B and C). Meanwhile, compared with the model group, the miR-29b-3p inhibitor group showed significantly increased cell proliferation (p < 0.001; Figure 3 A) but significantly decreased apoptosis and G1 retention (p < 0.001; Figures 3 B and C). Relevant data are shown in Figure 3.
Figure 3
miR-29b-3p inhibitor affects cell proliferation, apoptosis and cell cycle. A – miR-29b-3p inhibitor affects cell proliferation by CCK-8, B – miR-29b-3p inhibitor affects cell proliferation by flow cytometry, C – miR-29b-3p inhibitor affects cell cycle by flow cytometry
***p < 0.001 compared with NC group, ###p < 0.001 compared with Model group.
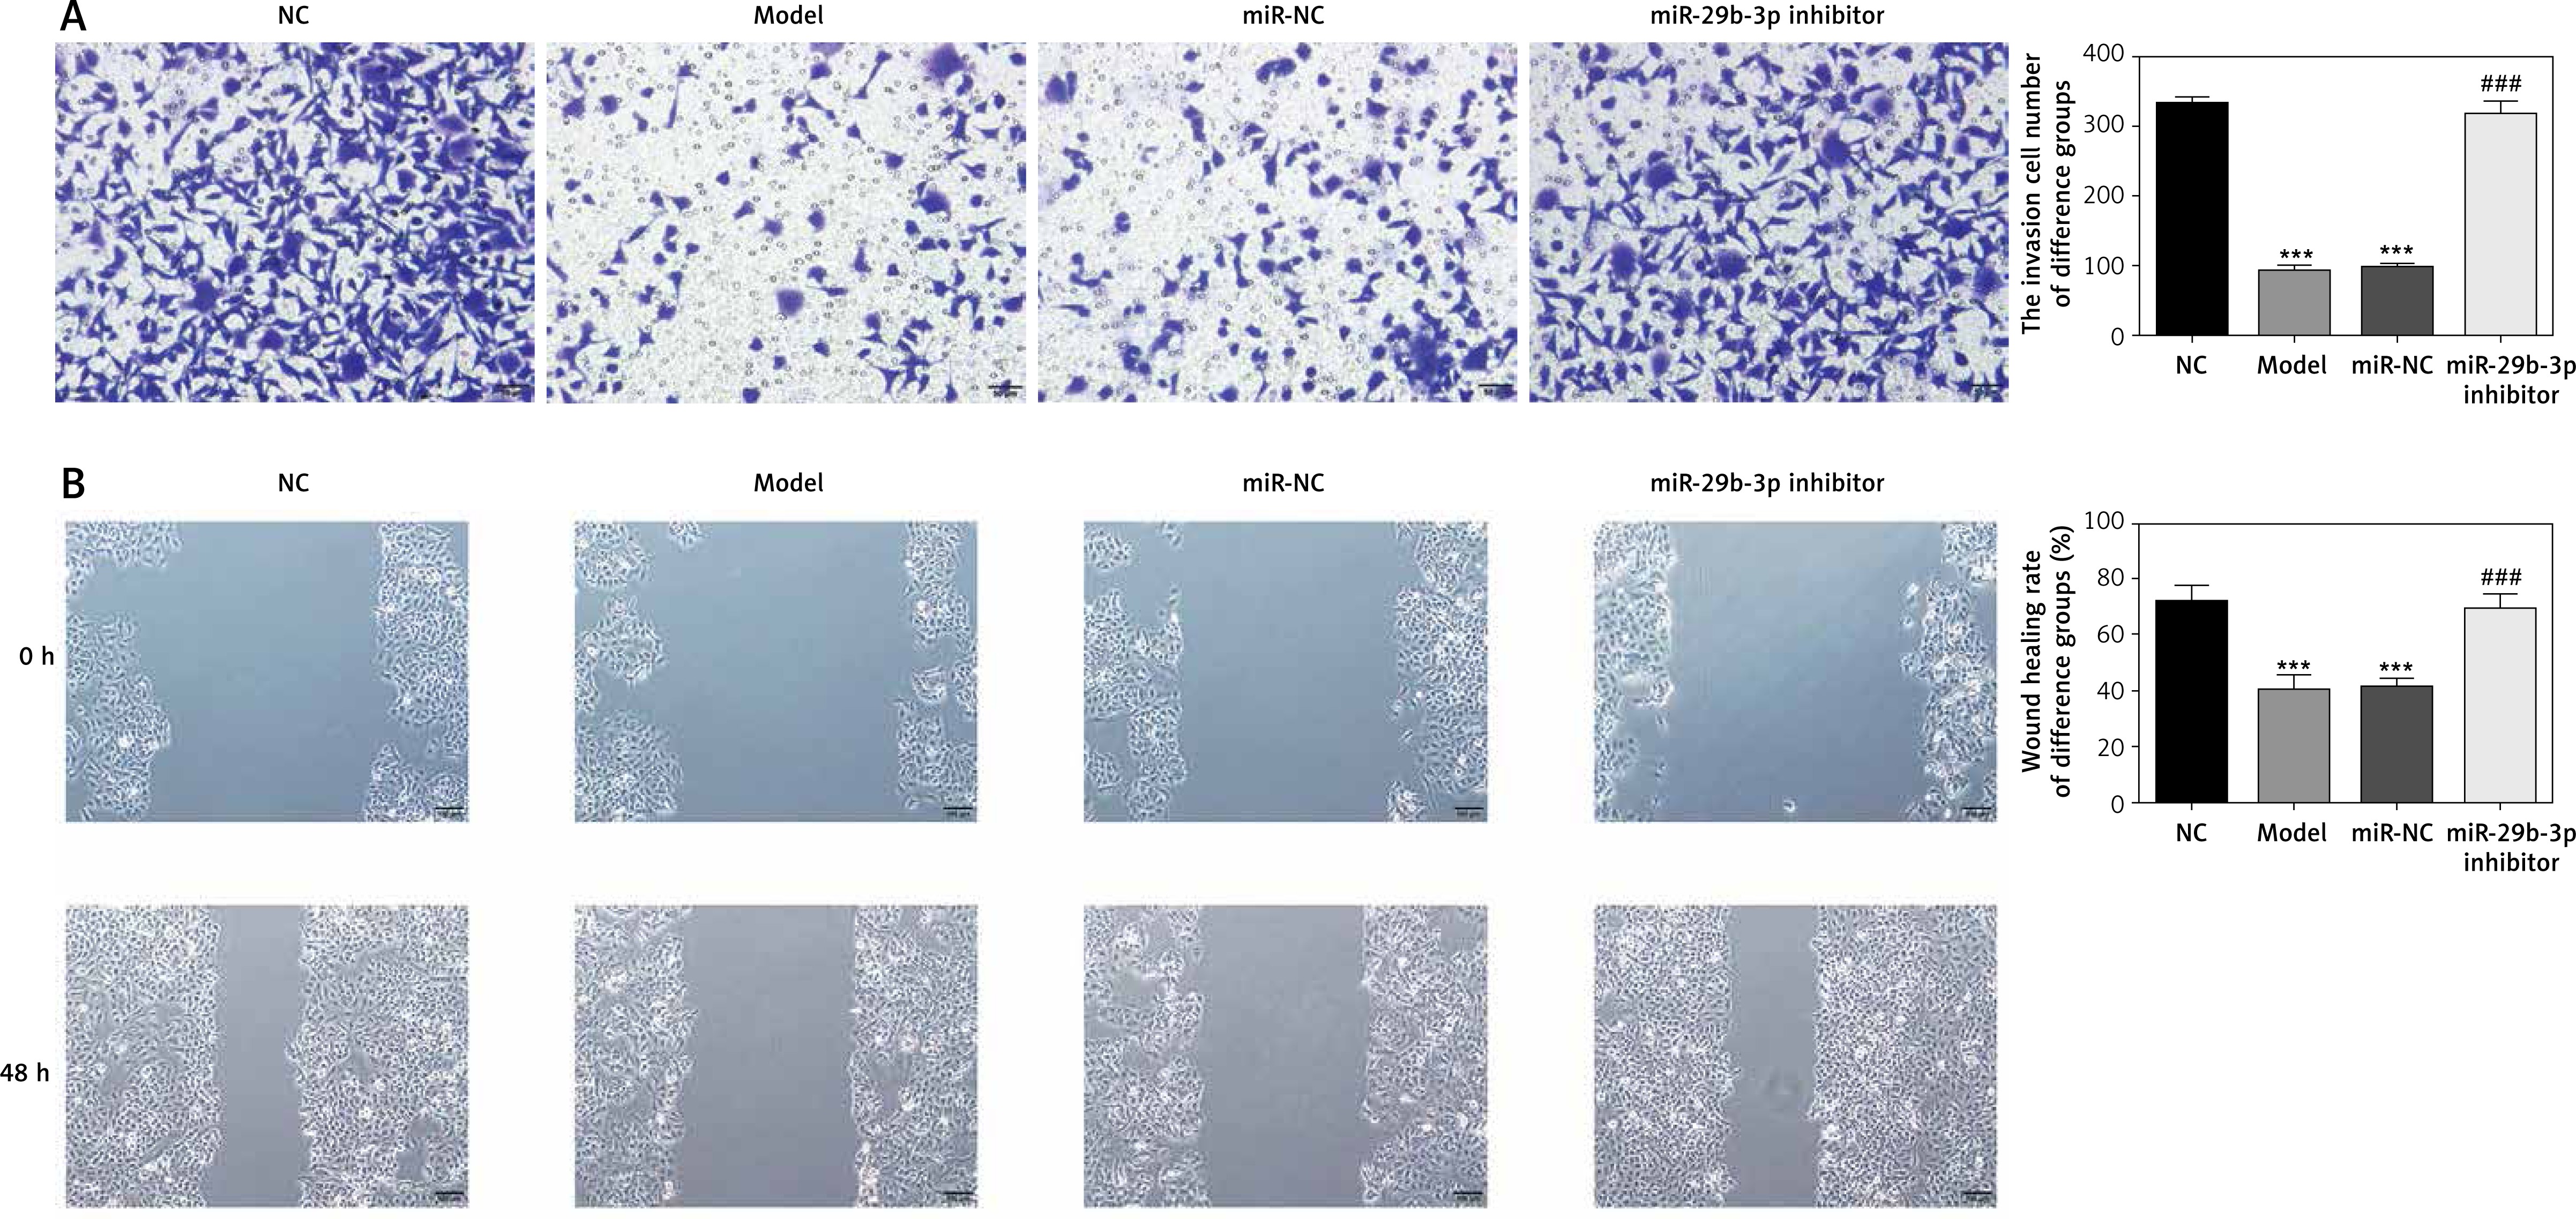
Effect of miR-29b-3p inhibitor on invasion and migration of cells in each group
To show the effect of the miR-29b-3p inhibitor on the invasion and migration of the cells, the number of invading cells was determined via transwell assay. Compared with the NC group, the model and miR-NC groups showed significantly decreased numbers of invading cells (p < 0.001; Figure 4 A), whereas miR-29b-3p treatment significantly increased cell invasion compared with the model group (p < 0.001; Figure 4 A). The effect of miR-29b-3p inhibitor on the migration of the HTR-8/SVneo cells was determined by scratch wound healing assay. The model and miR-NC groups showed significantly decreased numbers of migrated cells, compared with the NC group (p < 0.001; Figure 4 B), whereas miR-29b-3p treatment significantly increased cell migration compared with the model group (p < 0.001; Figure 4 B).
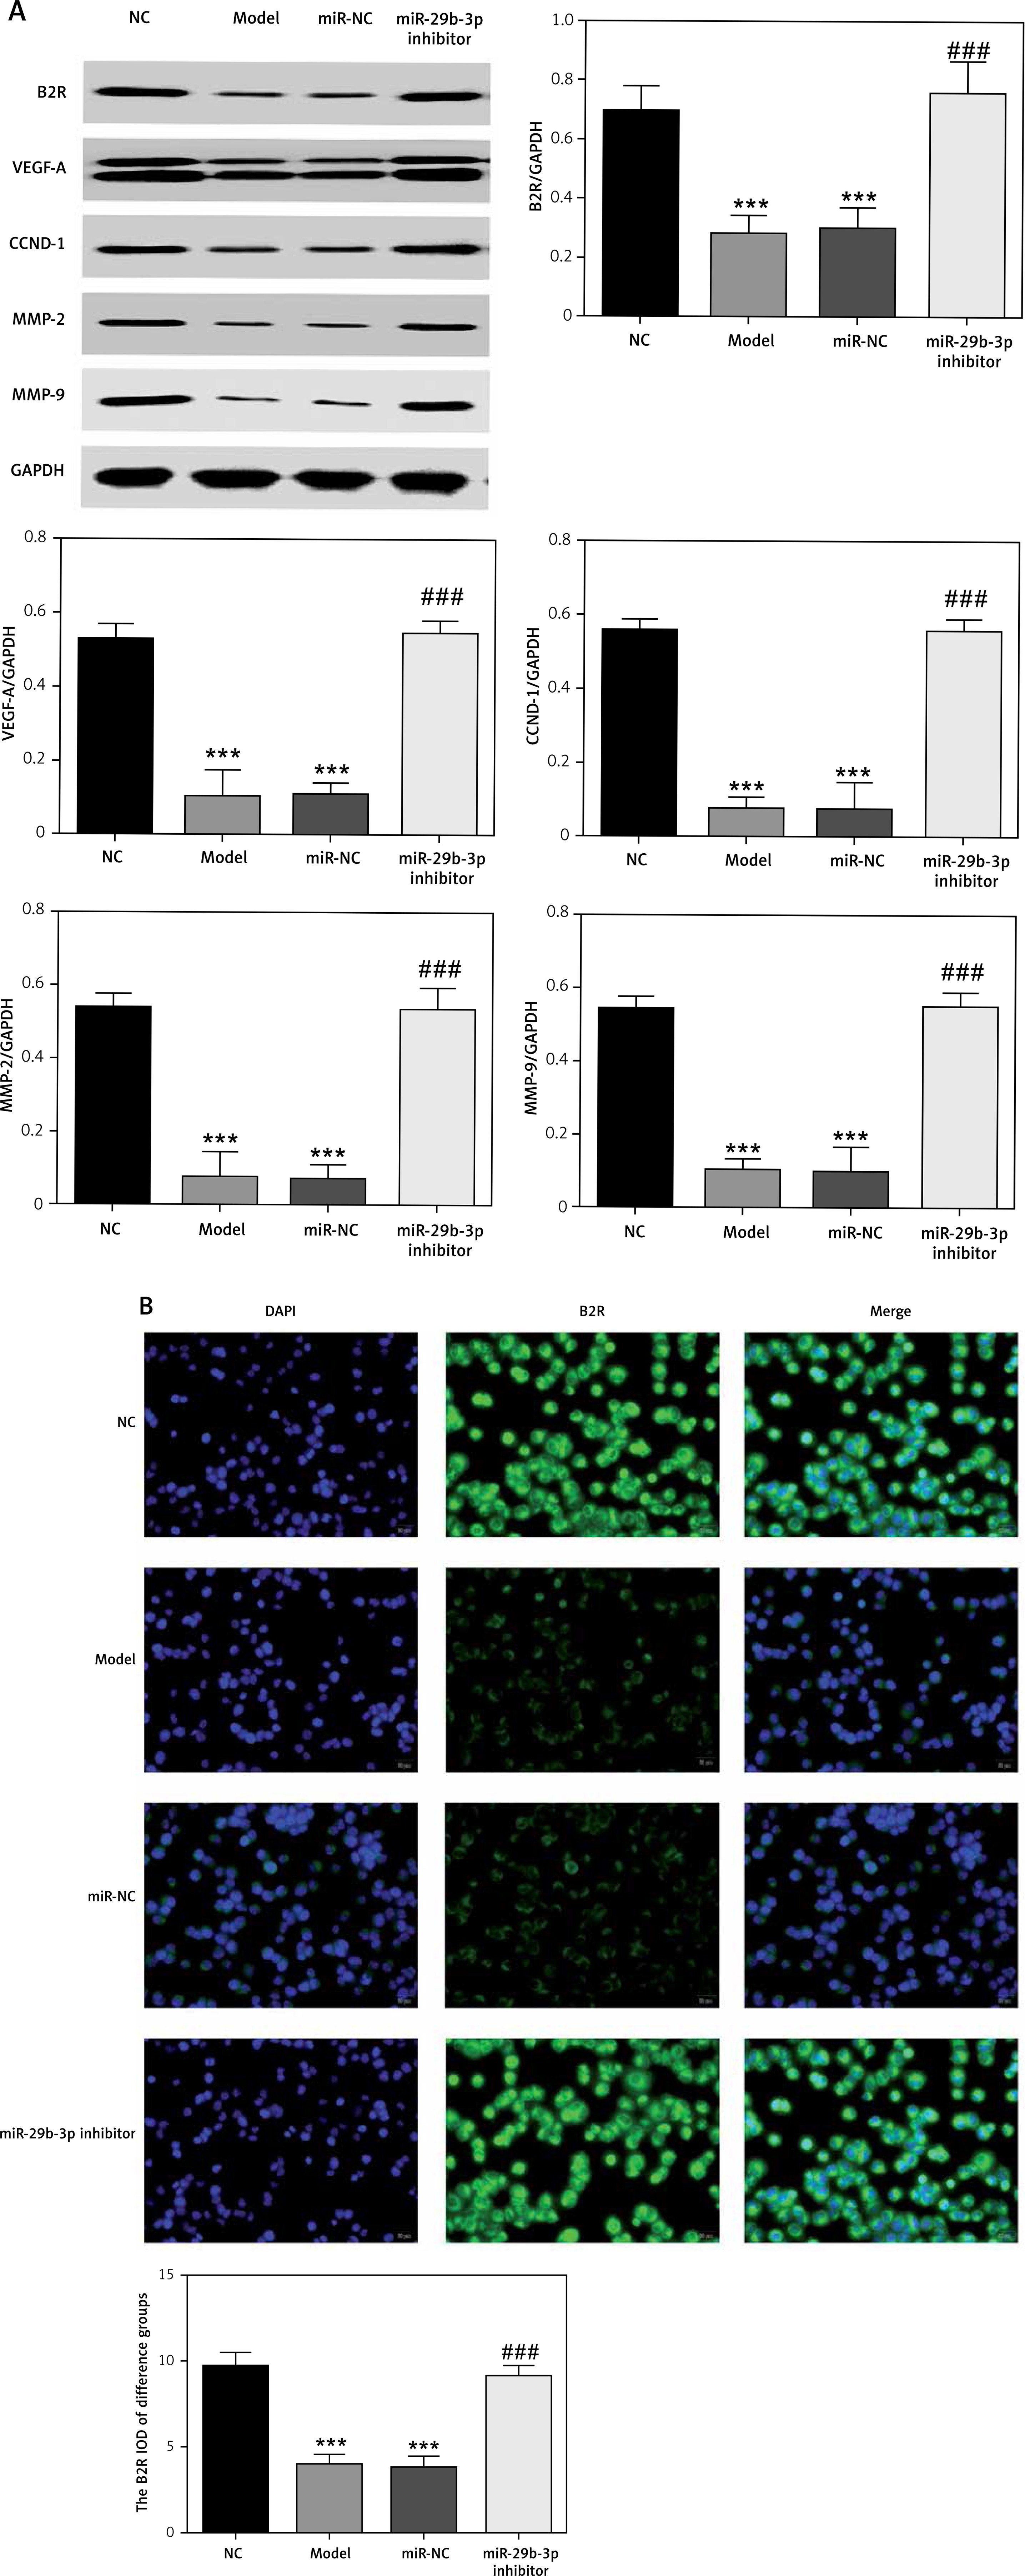
Expression of relevant proteins
The protein expression levels of B2R, VEGF-A, CCND1, MMP-2 and MMP-9 were detected by Western blot assay. Compared with the NC group, the model and miR-NC groups showed significantly decreased B2R, VEGF-A, CCND1, MMP-2 and MMP-9 protein expression (p < 0.001; Figure 5 A). By contrast, treatment with miR-29b-3p inhibitor significantly increased the expression of these proteins compared with the model group (p < 0.001; Figure 5 A). B2R protein expression in the cells was also determined by immunofluorescence staining. Compared with the NC group, the model and miR-NC groups showed significantly decreased B2R protein expression (p < 0.001; Figure 5 B), whereas treatment with miR-29b-3p inhibitor significantly increased B2R protein expression compared with the model group (p < 0.001; Figure 5 B). Relevant data are shown in Figure 5.
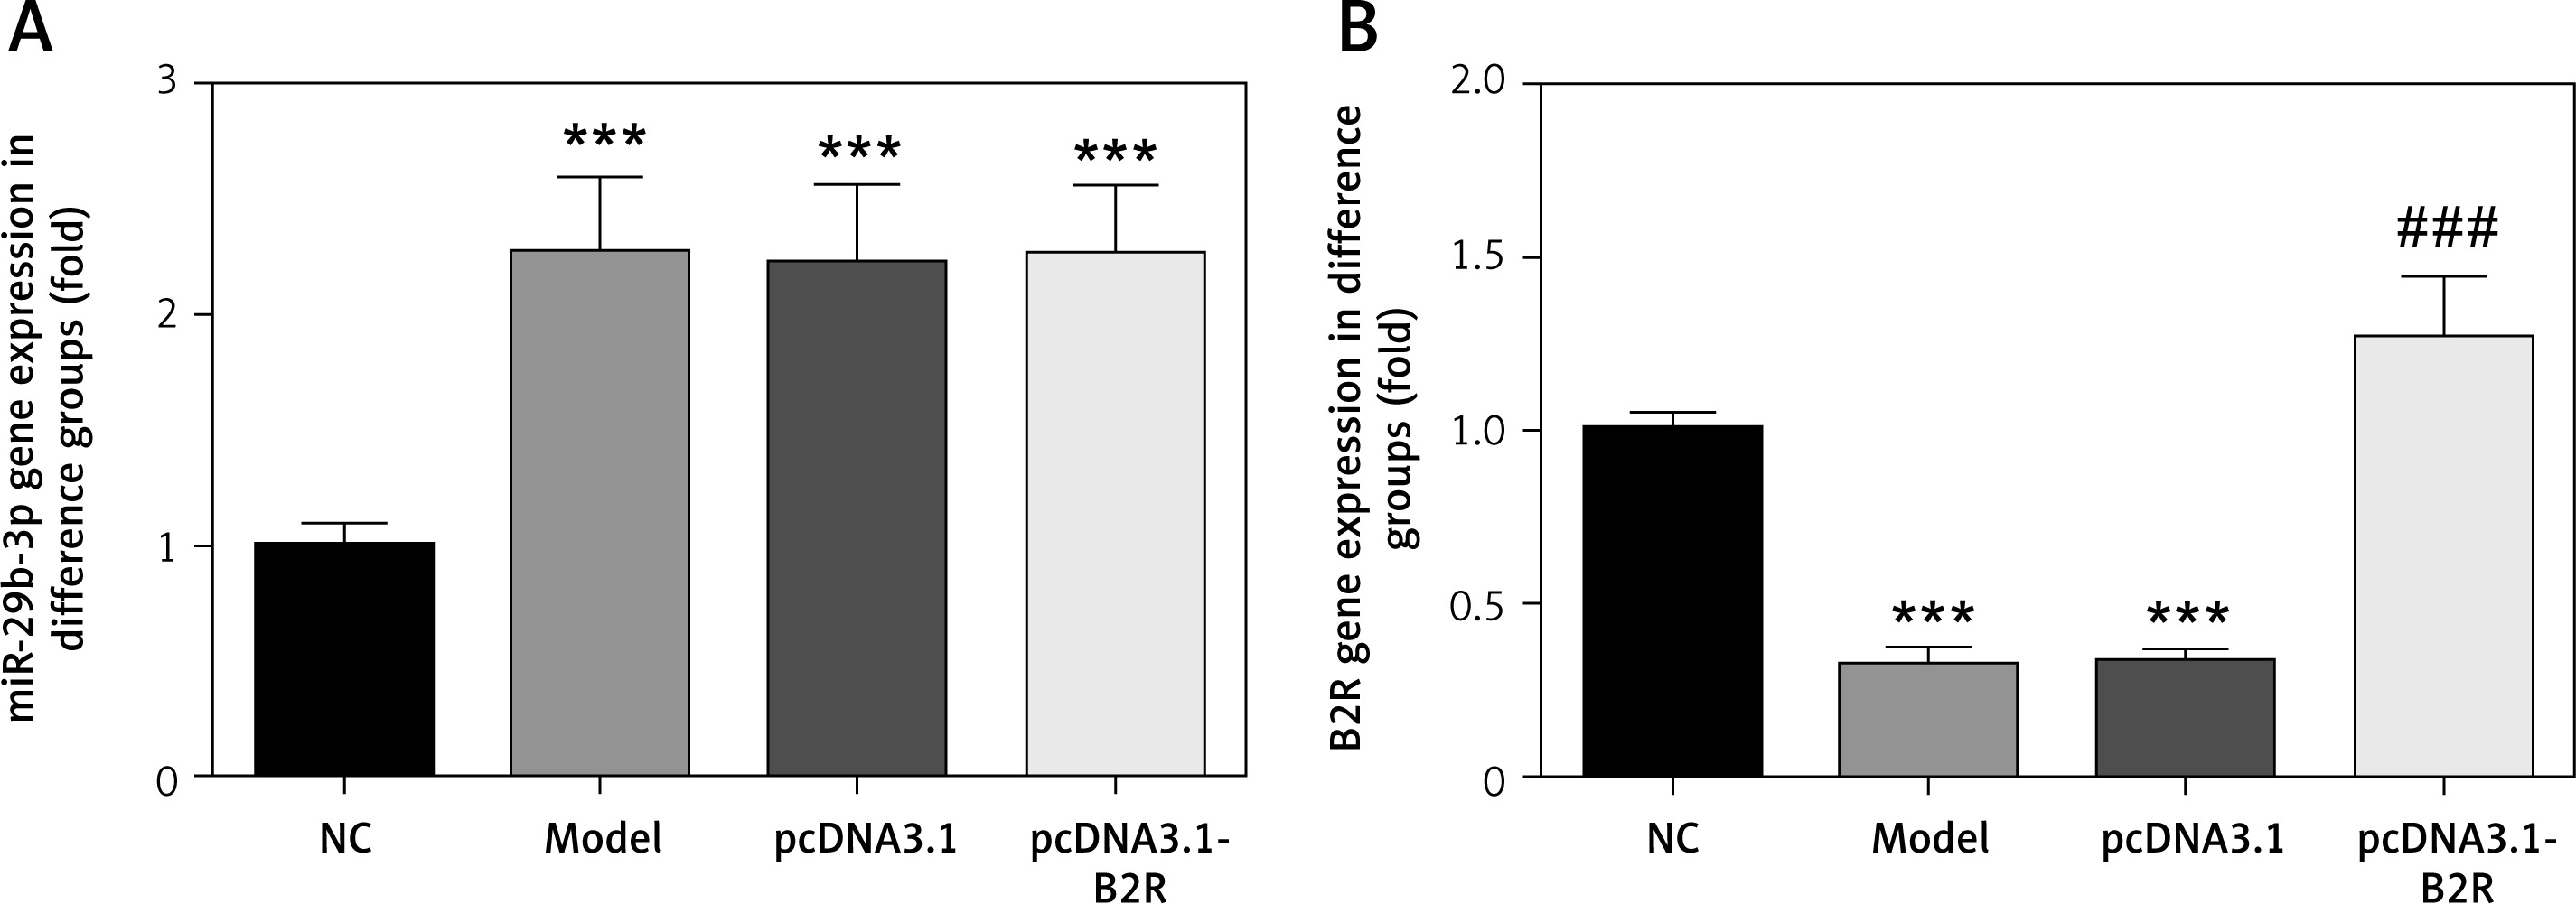
B2R overexpression affects relative mRNA expression
Unlike the NC group, miR-29b-3p mRNA expression significantly increased in the model, pcDNA3.1 and pcDNA3.1-B2R groups (p < 0.001; Figure 6 A), and B2R mRNA expression significantly decreased in the model and pcDNA-3.1 groups (p < 0.001; Figure 6 B). Moreover, pcDNA 3.1-B2R transfection significantly increased B2R mRNA level, which was different from the control group (p < 0.001; Figure 6 B).
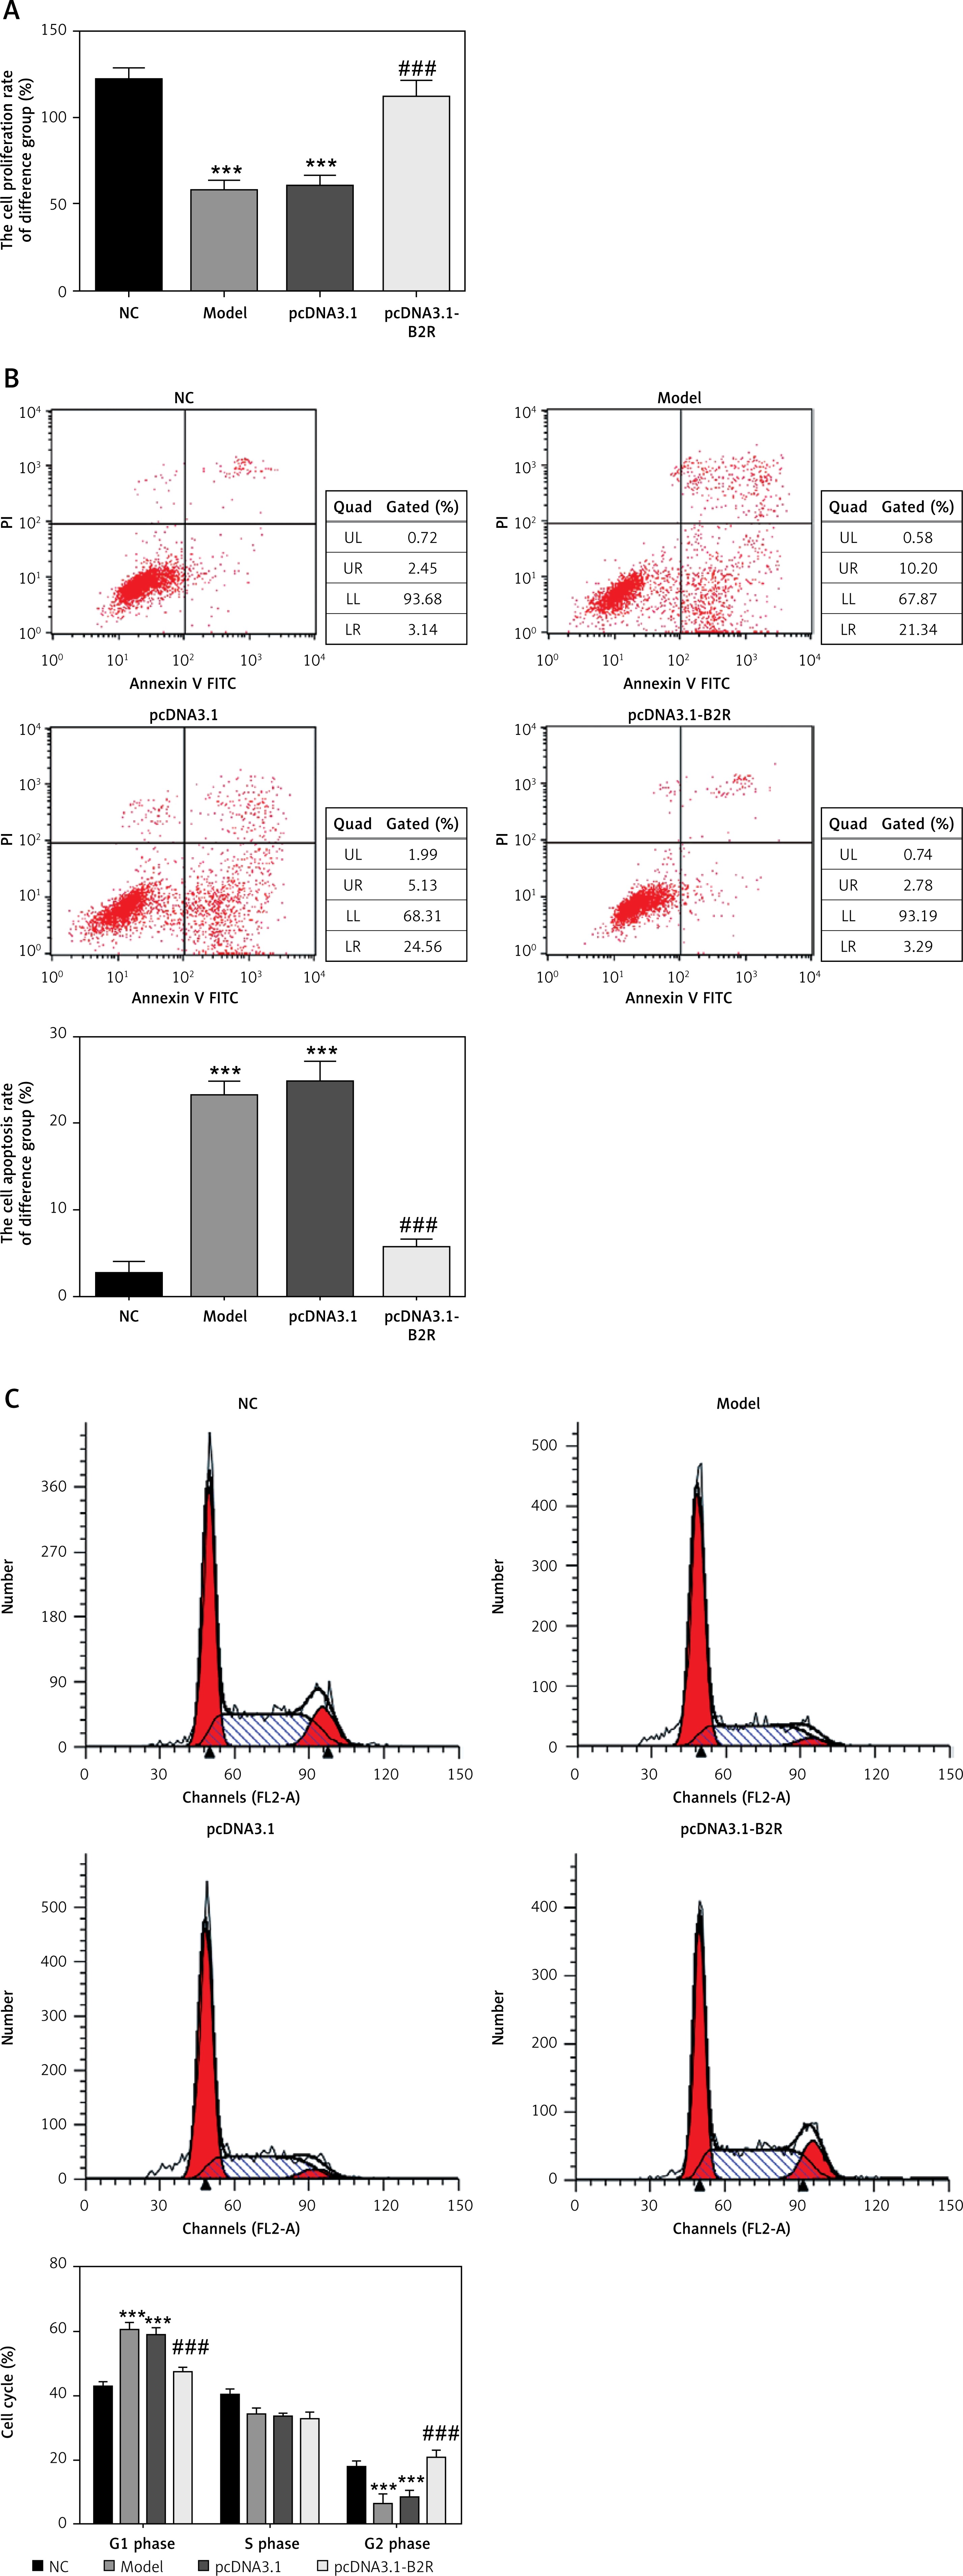
Effect of B2R on cell proliferation, apoptosis and cell cycle distribution
Compared with the NC group, the model and pcDNA 3.1 groups showed significantly inhibited cell proliferation (p < 0.001; Figure 7 A), significantly increased apoptosis (p < 0.001; Figure 7 B) and significant G1 retention (p < 0.001; Figure 7 C). By contrast, pcDNA-3.1-B2R transfection significantly promoted cell proliferation (p < 0.001; Figure 7 A), decreased apoptosis (p < 0.001; Figure 7 B) and released cell cycle retention (p < 0.001; Figure 7 C).
Figure 7
B2R affects cell proliferation, apoptosis and cell cycle in different groups. A – B2R affects cell proliferation by CCK-8 assay, B – B2R affects cell apoptosis by flow cytometry, C – B2R affects cell cycle by flow cytometry
***p < 0.001 compared with NC group, ###p < 0.001 compared with Model group.
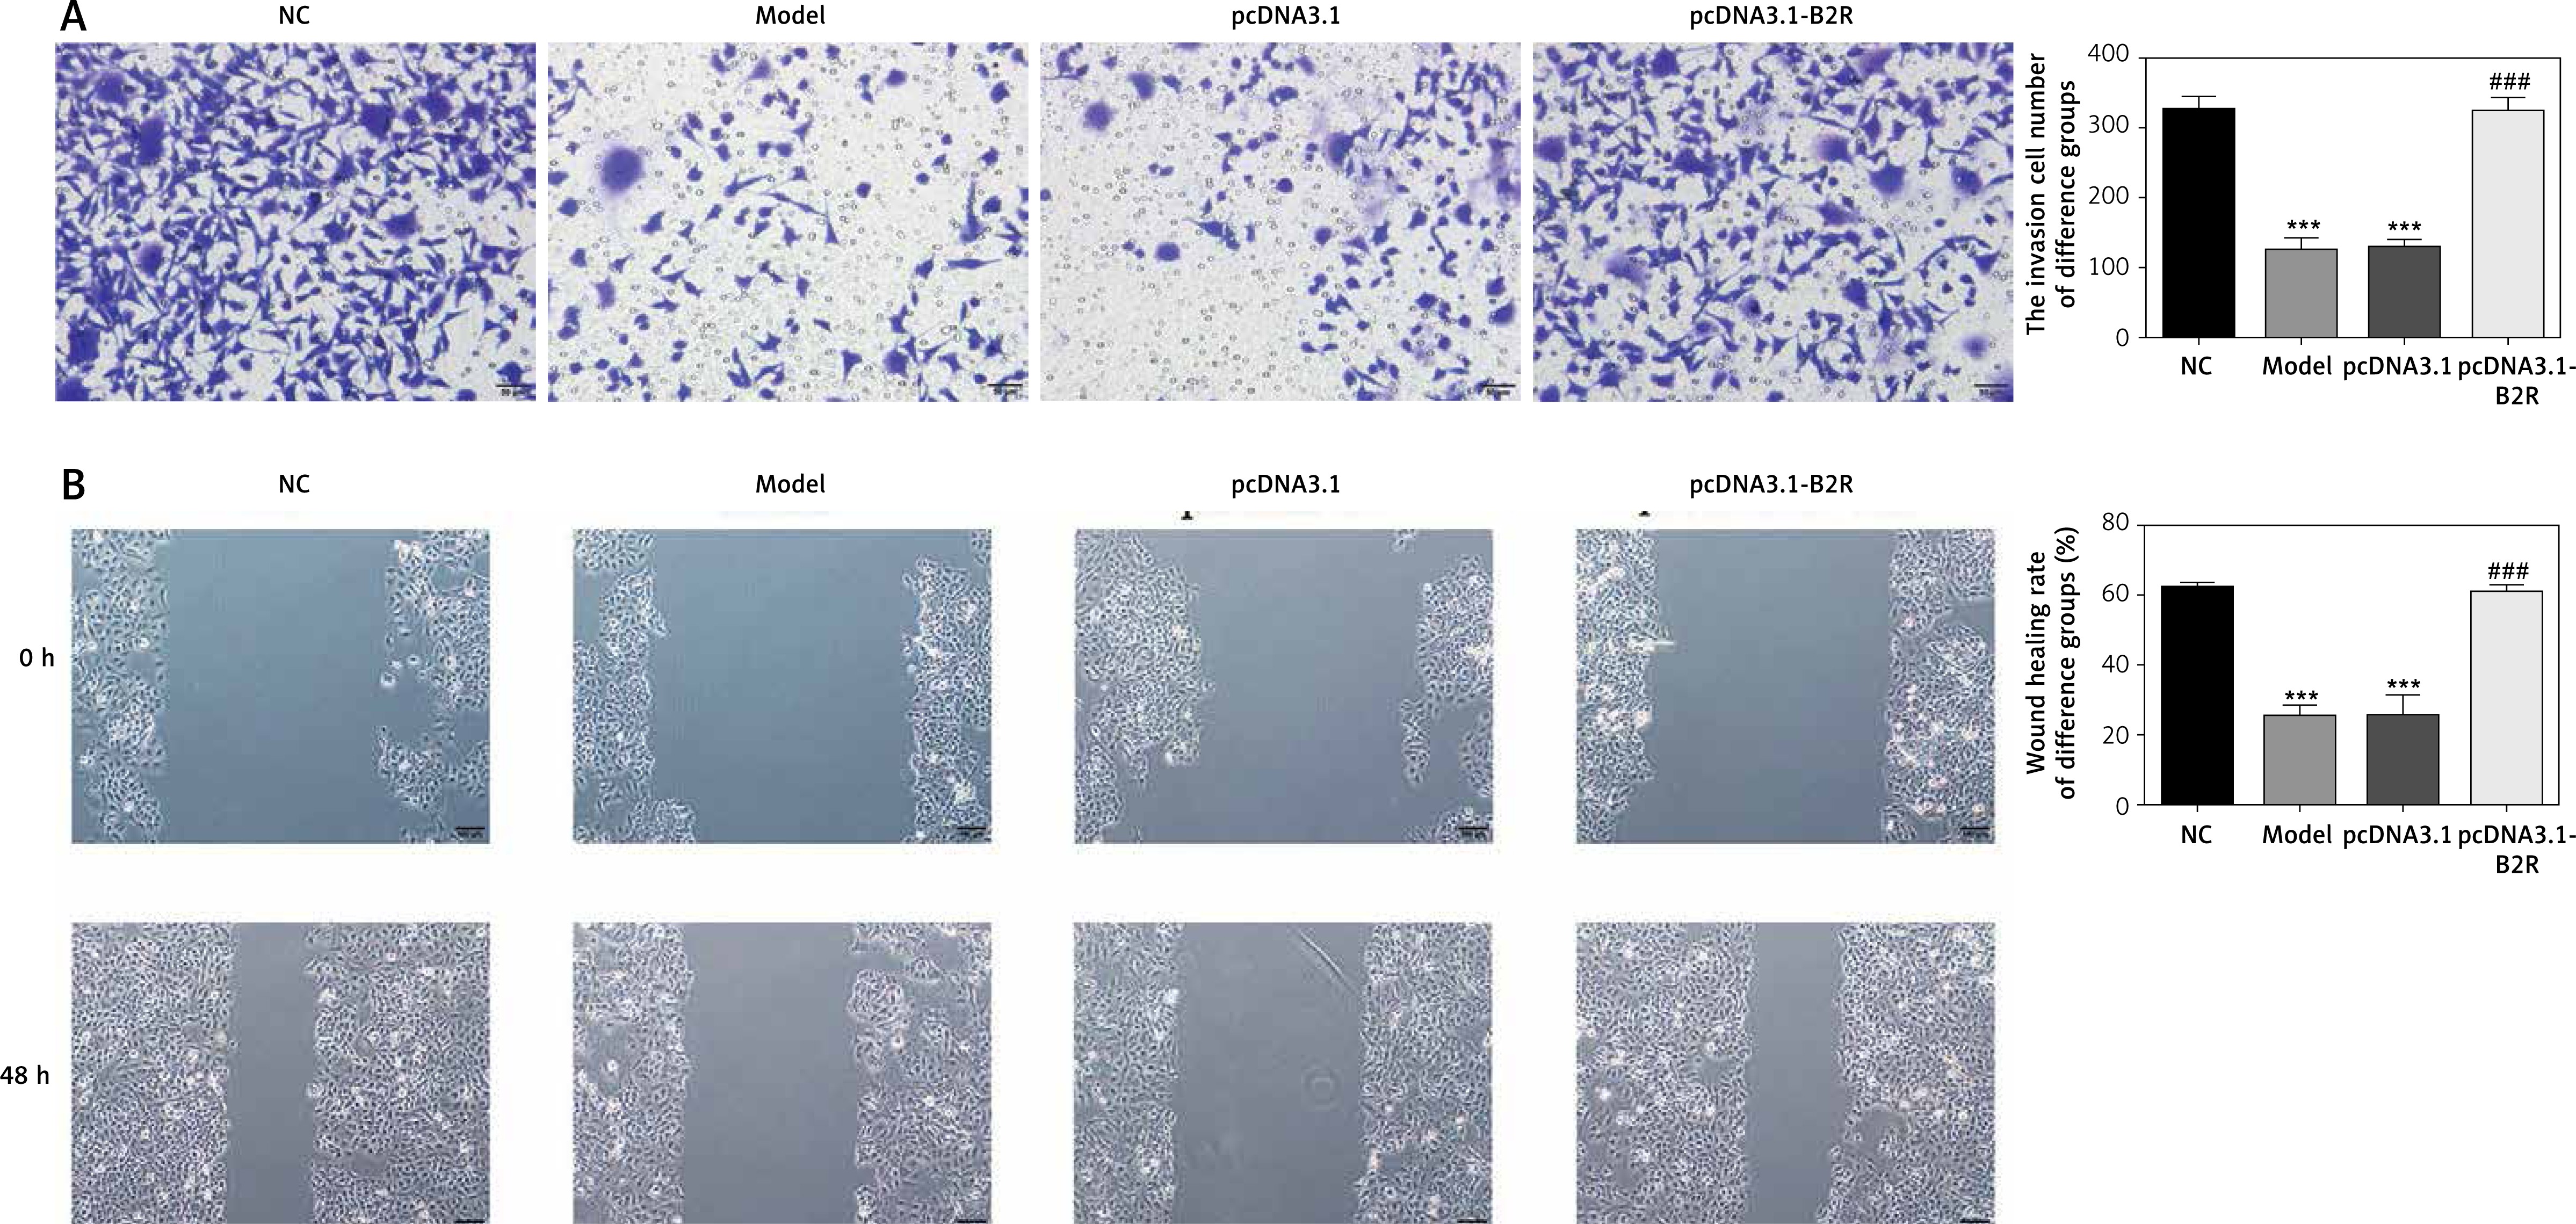
Effect of B2R on cell invasion and migration
Unlikely the NC group, the number of invading cells significantly decreased in the model and pcDNA 3.1 groups (p < 0.001; Figure 8 A) but increased after pcDNA 3.1-B2R transfection (p < 0.001; Figure 8 A). Wound healing assay also demonstrated that the wound healing rate of the model and pcDNA 3.1 groups was dramatically lower than that of the NC group (p < 0.001; Figure 8 B).
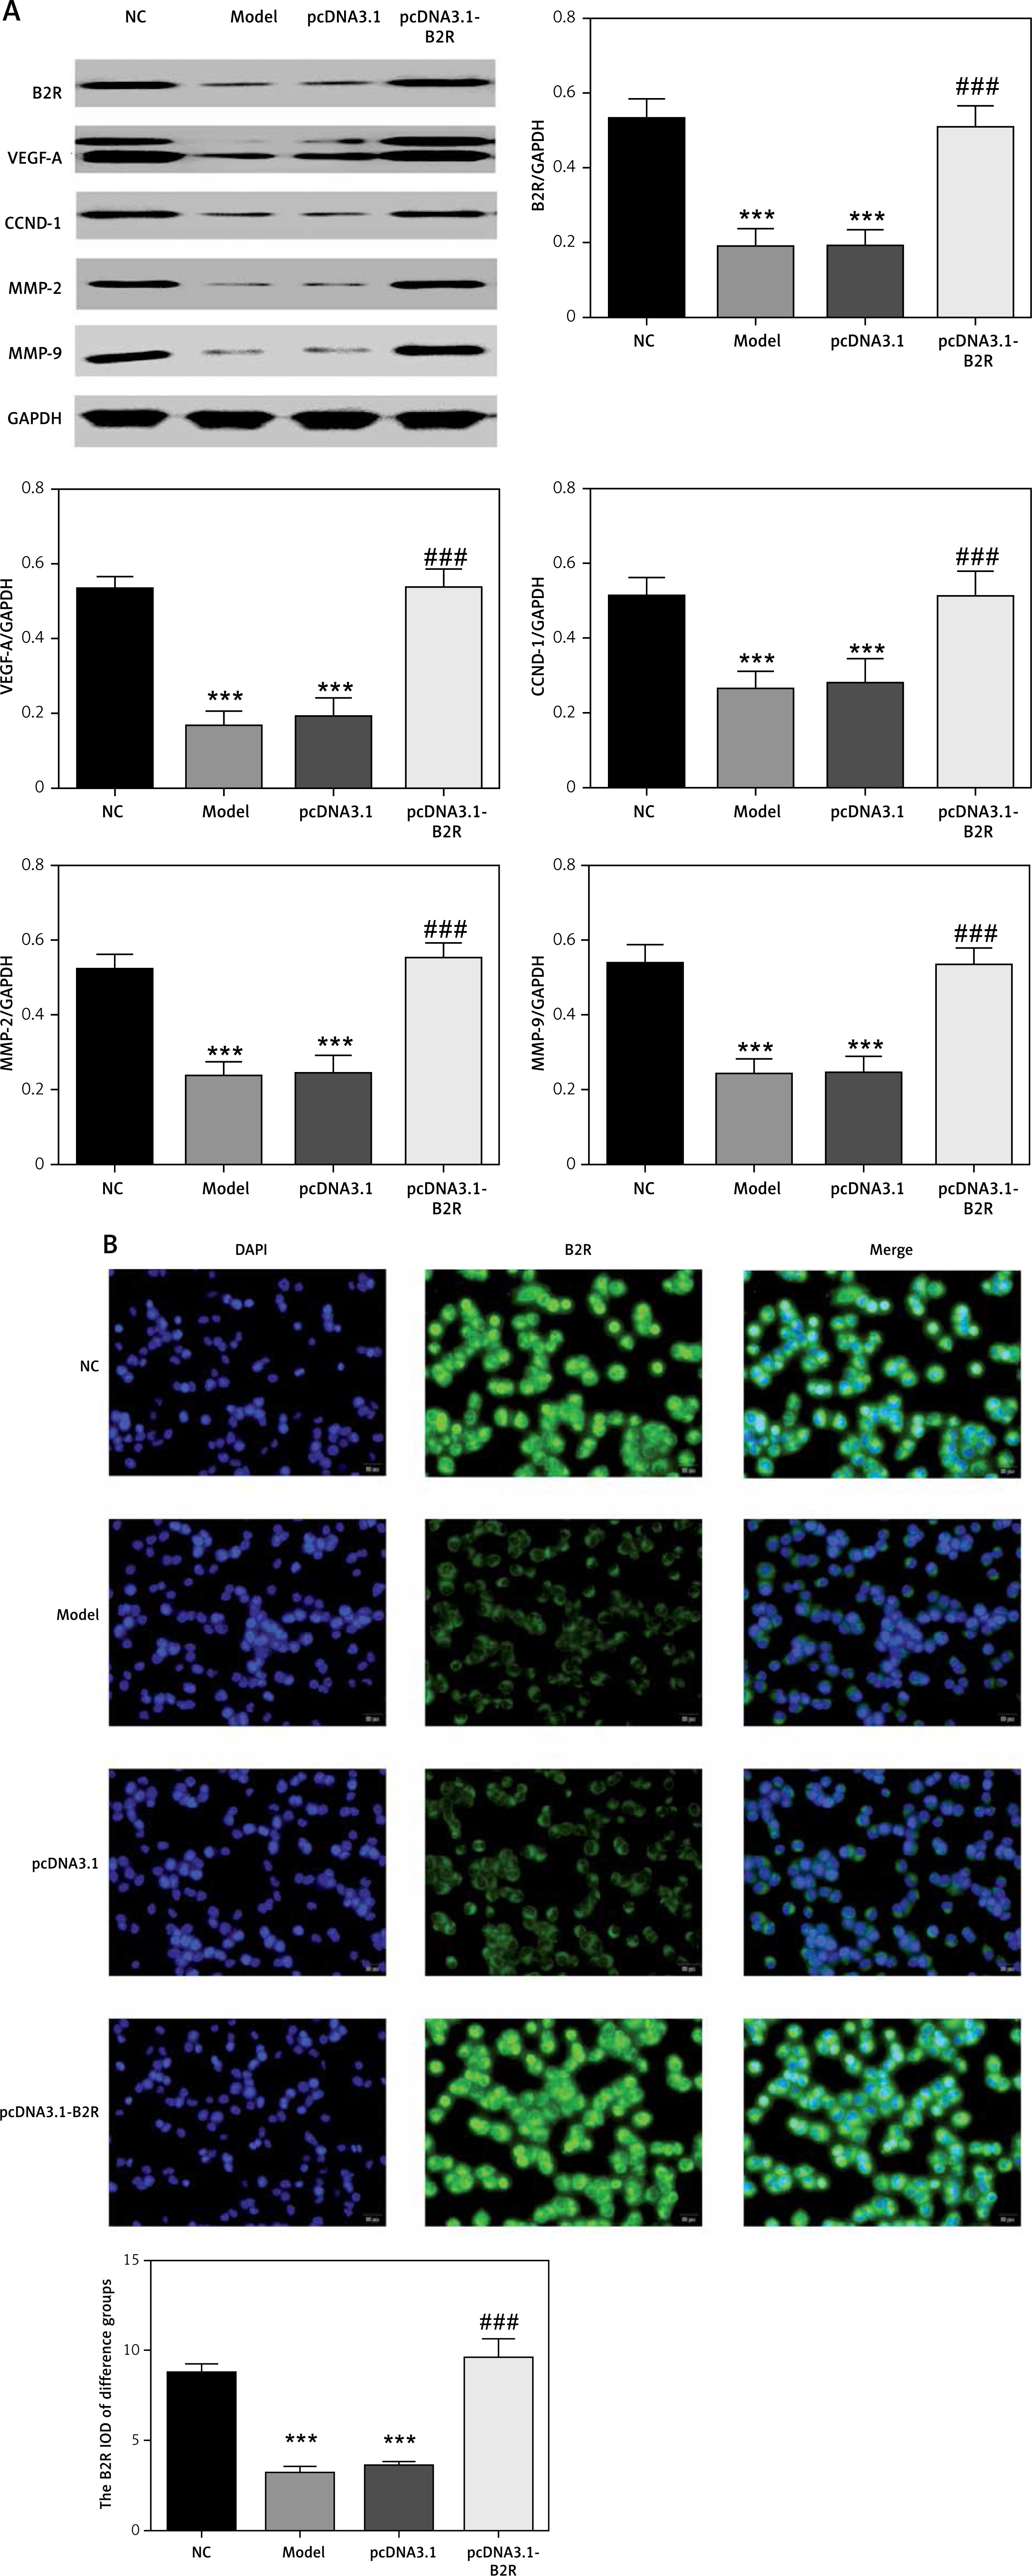
Expression of B2R and relevant proteins
By Western blot, the protein expression of B2R, VEGF-A, CCND1, MMP-2 and MMP-9 significantly decreased in the model and pcDNA 3.1 groups, compared with the NC group (p < 0.001; Figure 9 A). By contrast, treatment with pcDNA 3.1-B2R significantly increased the expression of these proteins compared with the model group (p < 0.001; Figure 9 A). Immunofluorescence staining demonstrated significantly decreased B2R protein expression in the model and pcDNA 3.1 groups compared with the NC group (p < 0.001; Figure 2 B), whereas pcDNA 3.1-B2R transfection significantly increased B2R expression compared with the model group (p < 0.001; Figure 9 B).
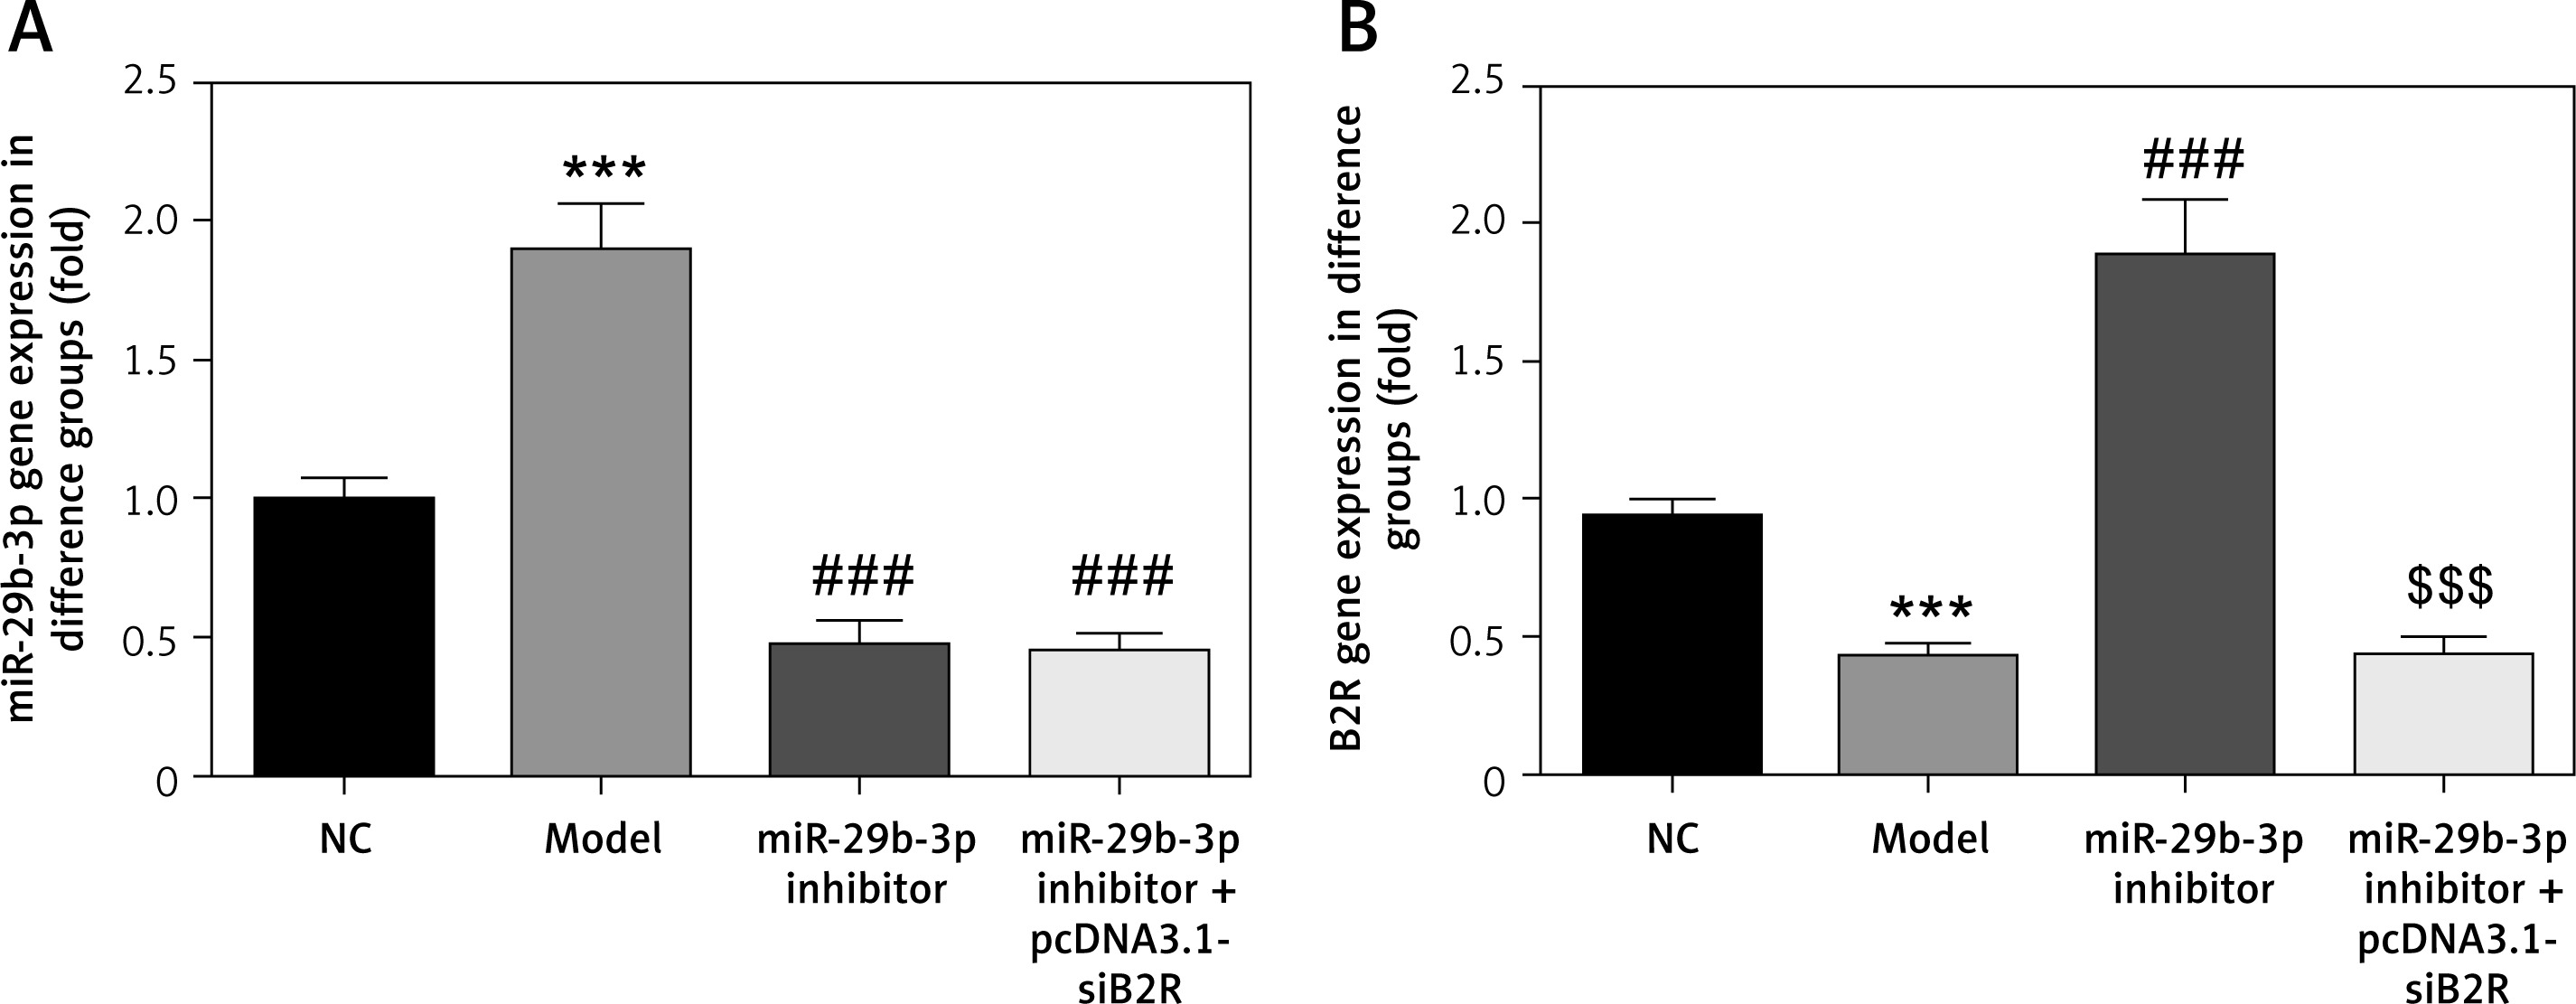
Effect of miR-29b-3p inhibitor and/or pcDNA 3.1-siB2R on miRNA expression of relevant genes
MiR-29b-3p and B2R expression of the model group differed significantly from those in the NC group (p < 0.001; Figures 10 A and B). In particular, miR-29b-3p inhibitor treatment dramatically decreased miR-29b-3p expression p < 0.001; Figure 10 A) and increased B2R expression (p < 0.001; Figure 10 B). Treatment with pcDNA 3.1-siB2R in addition to miR-29b-3p inhibitor significantly decreased B2R mRNA expression compared with the miR-29b-3p inhibitor group.
Figure 10
miR-29b-3p inhibitor and/or pcDNA 3.1-siB2R affects relative mRNA expression. A – miR-29b-3p mRNA expression in different groups by RT-qPCR, B – B2R mRNA expression in different groups by RT-qPCR
***p < 0.001 compared with NC group, ###p < 0.001 compared with Model group, $$$p < 0.001 compared with miR-29b-3p inhibitor group.
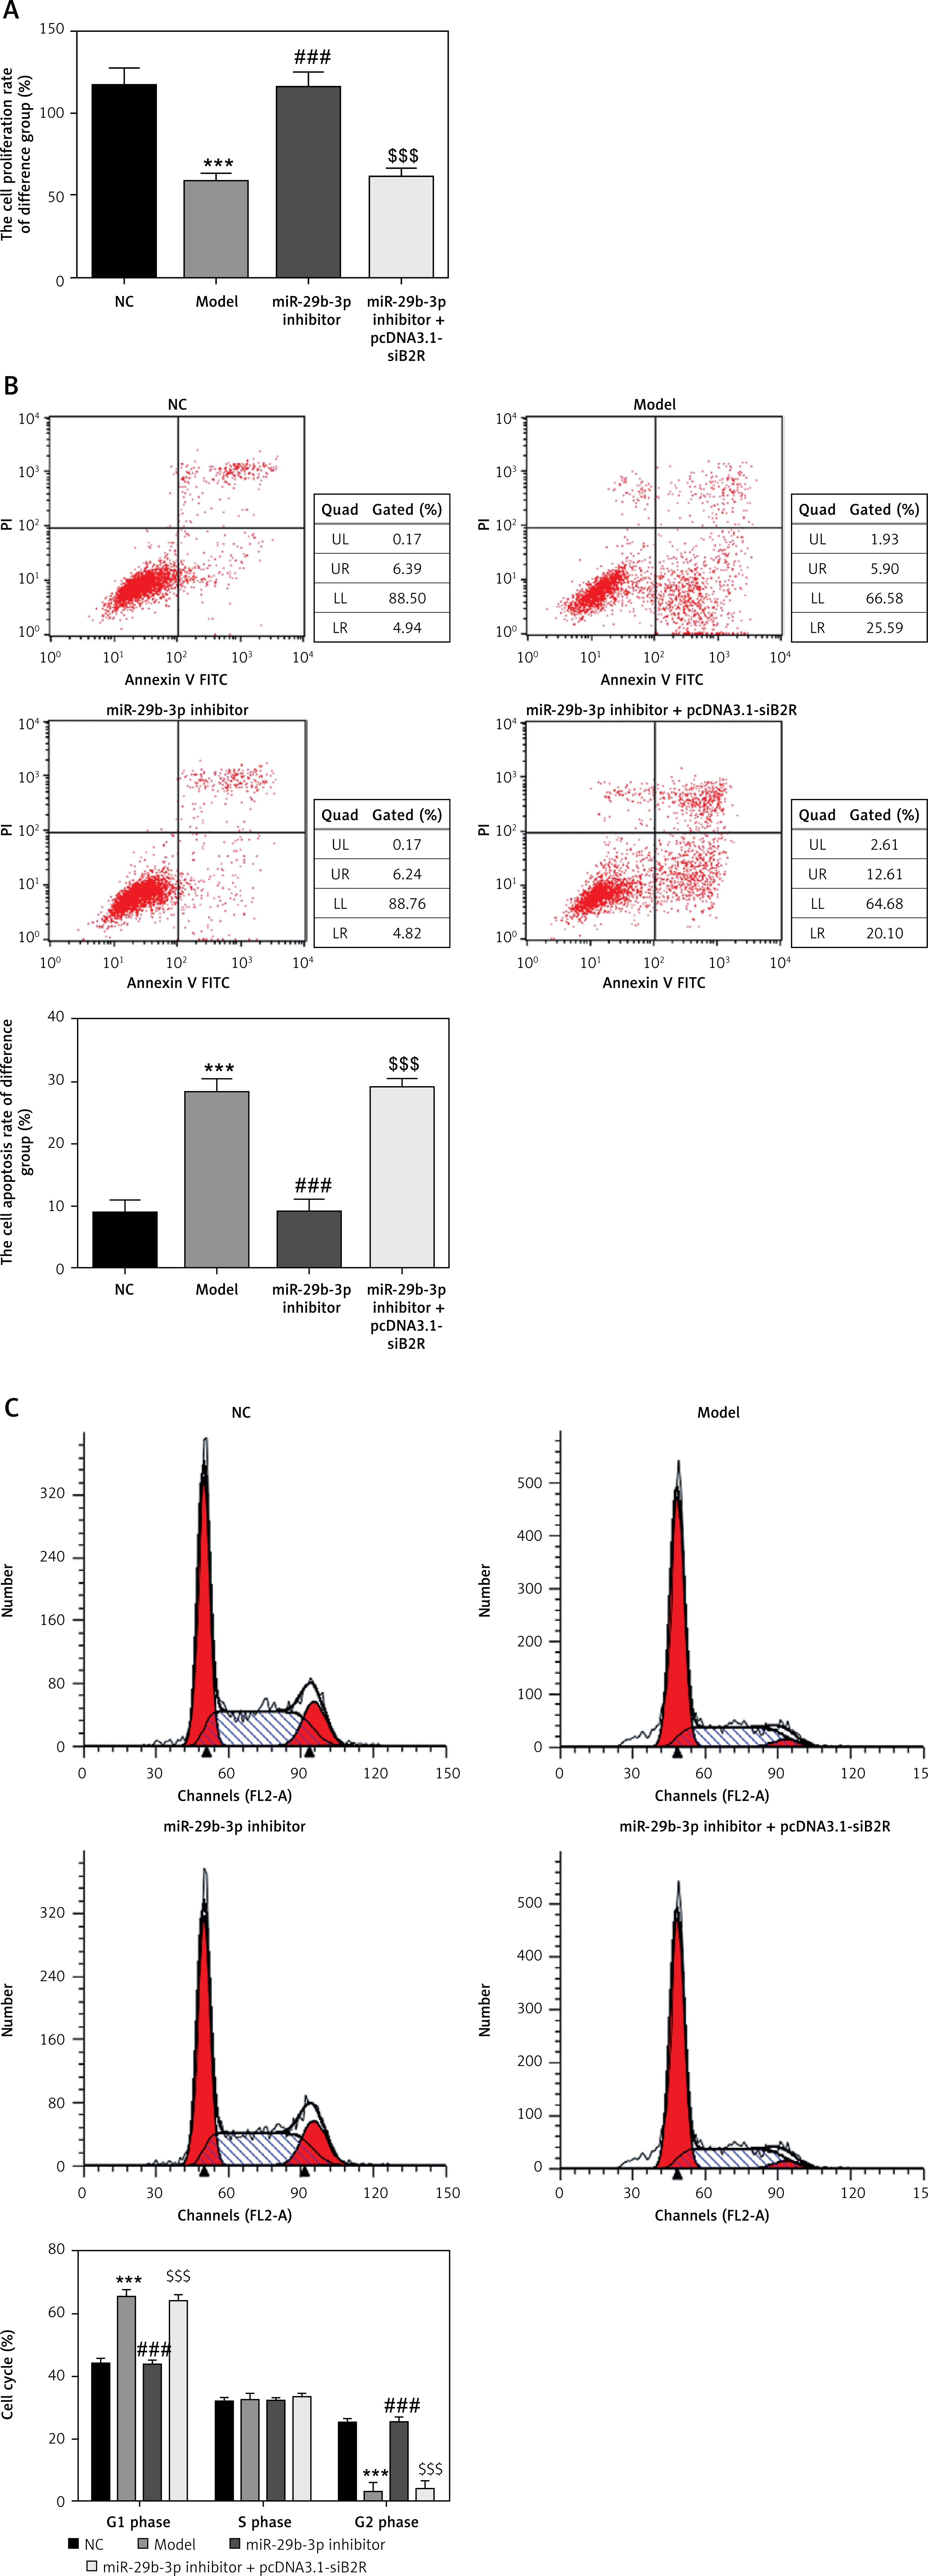
Effects of miR-29b-3p inhibitor and/or pcDNA 3.1-siB2R on cell proliferation, apoptosis and cell cycle
Unlike the NC group, the model group showed significantly decreased cell proliferation (p < 0.001; Figure 11 A), increased apoptosis and elevated G1 retention (p < 0.001; Figures 11 B and C). Treatment with the miR-29b-3p inhibitor increased cell proliferation, inhibited apoptosis and alleviated G1 retention compared with the model group (p < 0.001; Figures 11 A–C). By contrast, treatment with pcDNA 3.1-siB2R in addition to miR-29b-3p inhibitor significantly decreased cell proliferation, increased apoptosis and enhanced G1 retention (p < 0.001; Figures 11 A–C).
Figure 11
miR-29b-3p inhibitor and/or pcDNA 3.1-siB2R affects cell proliferation, apoptosis and cell cycle. A – miR-29b-3p inhibitor and/or pcDNA 3.1-siB2R affects cell proliferation by CCK-8, B – miR-29b-3p inhibitor and/or pcDNA 3.1-siB2R affects cell apoptosis by flow cytometry, C – miR-29b-3p inhibitor and/or pcDNA 3.1-siB2R affects cell cycle by flow cytometry
***p < 0.001 compared with NC group, ###p < 0.001 compared with Model group, $$$p < 0.001 compared with miR-29b-3p inhibitor group.
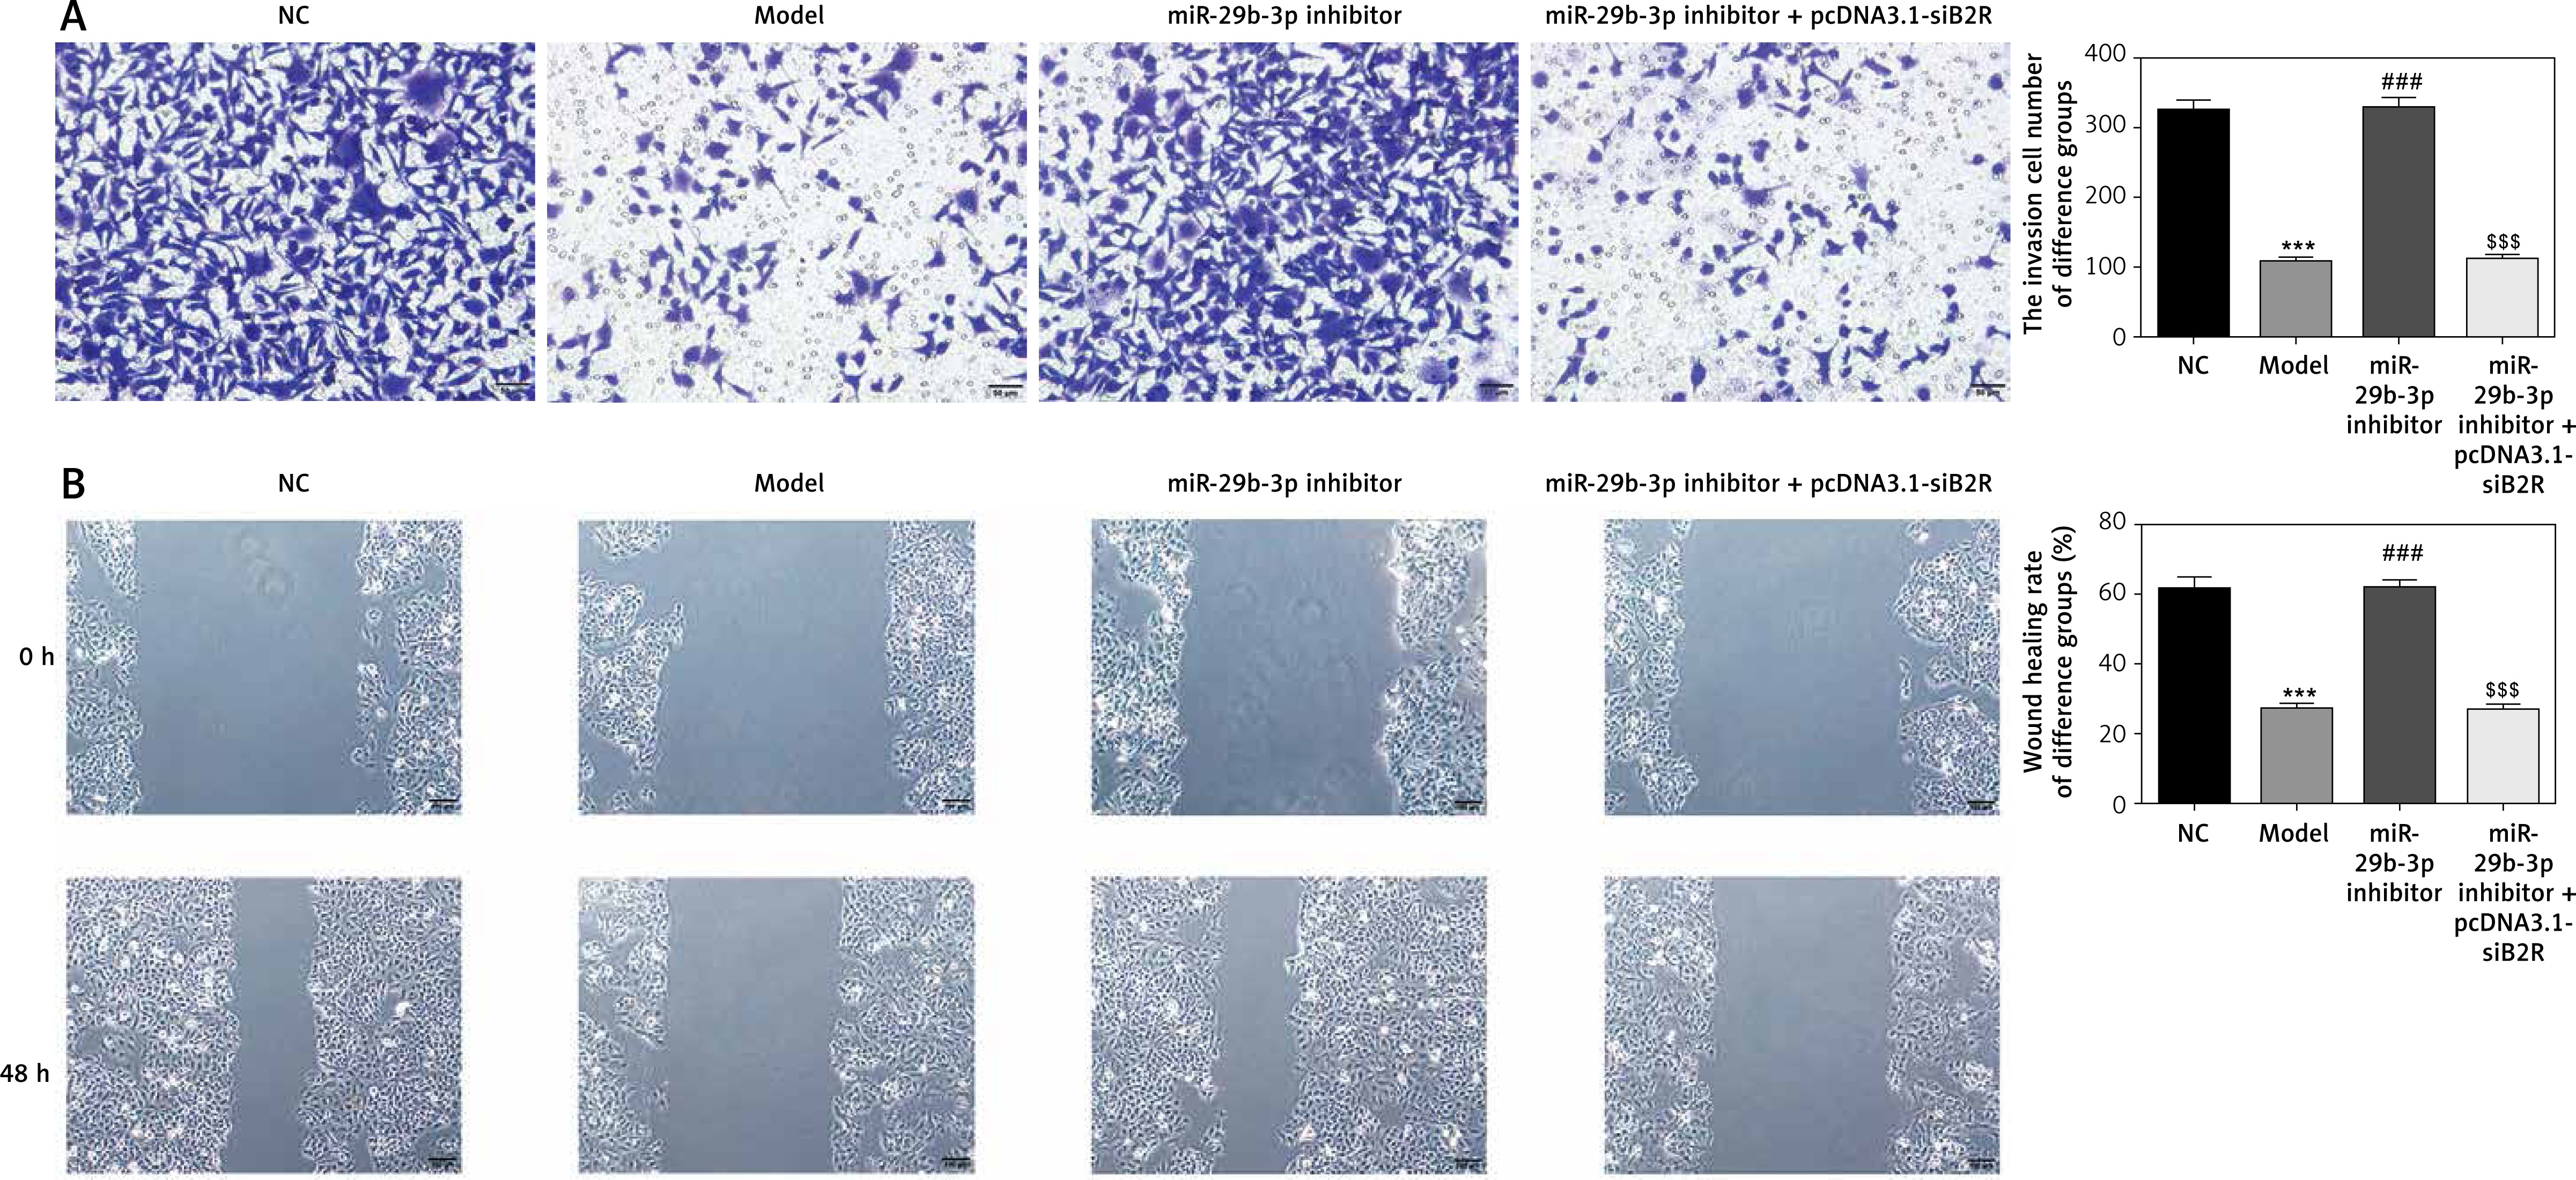
Effect of miR-29b-3p inhibitor and/or pcDNA 3.1-siB2R on cell invasion and migration
Transwell assay showed a significant reduction in invading cells in the model group, compared with the NC group (p < 0.001; Figure 12 A). The miR-29b-3p inhibitor significantly increased cell invasion compared with the model group (p < 0.001; Figure 12 A). Treatment with pcDNA 3.1-siB2R in addition to miR-29b-3p inhibitor significantly inhibited cell invasion compared with the miR-29b-3p inhibitor group (p < 0.001; Figure 12 A). Wound healing assay showed similar results. Wound healing was significantly inhibited in the model group compared with that in the NC group (p < 0.001; Figure 12 B). The miR-29b-3p inhibitor significantly increased cell migration compared with the model group (p < 0.001; Figure 12 B), whereas treatment with pcDNA 3.1-siB2R in addition to miR-29b-3p inhibitor significantly inhibited cell migration compared with the miR-29b-3p inhibitor group (p < 0.001; Figure 12 B).
Figure 12
miR-29b-3p inhibitor and/or pcDNA 3.1-siB2R affects cell invasion and migration. A – miR-29b-3p inhibitor and/or pcDNA 3.1-siB2R affects cell invasion by transwell (200×), B – miR-29b-3p inhibitor and/or pcDNA 3.1-siB2R affects cell migration by wound healing (100×)
***p < 0.001 compared with NC group, ###p < 0.001 compared with Model group, $$$p < 0.001 compared with miR-29b-3p inhibitor group.
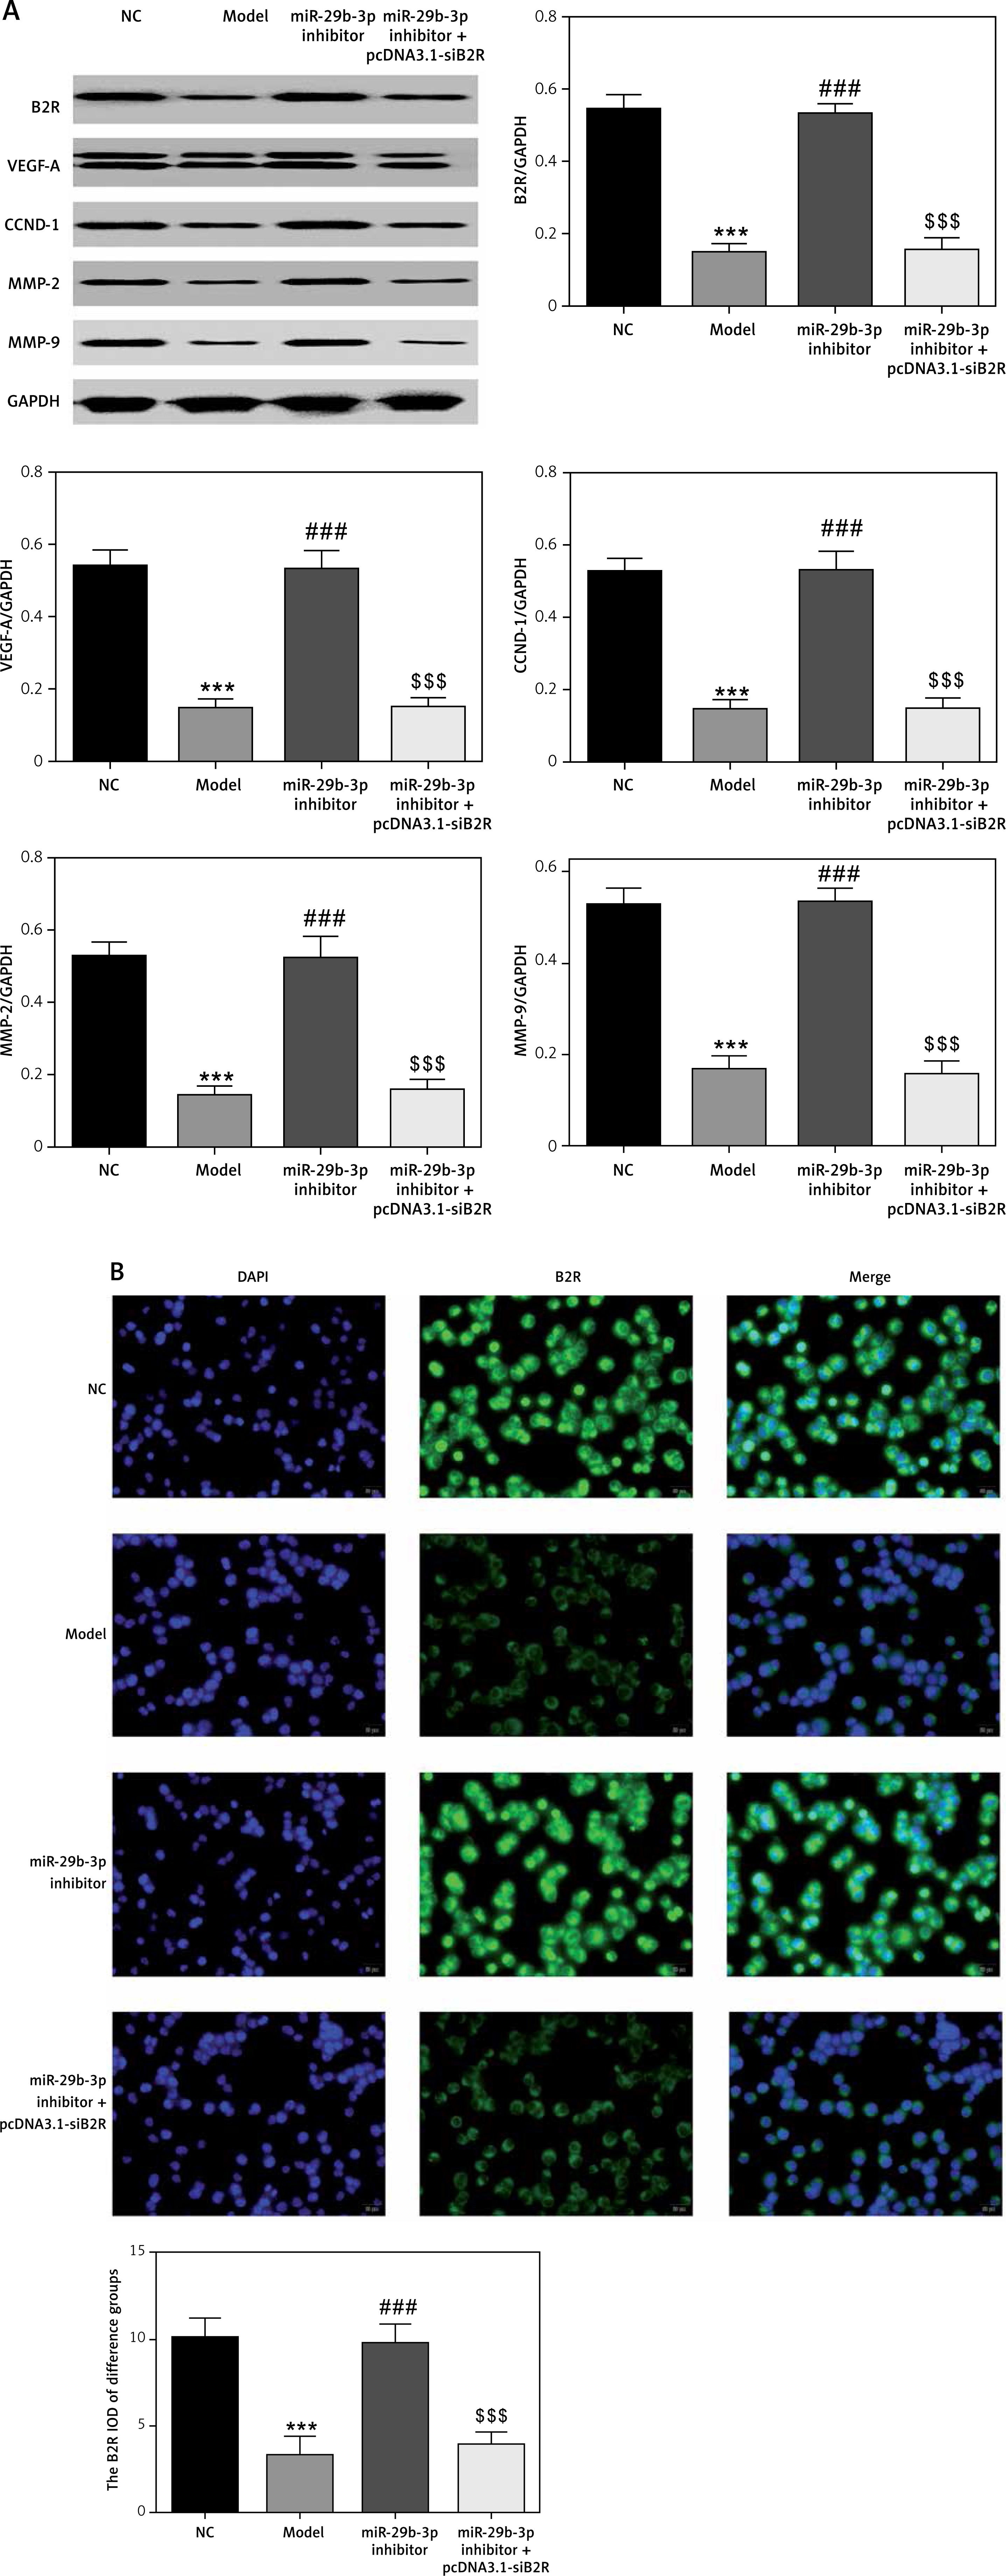
Effect of miR-29b-3p inhibitor and/or pcDNA 3.1-siB2R on protein expression of relevant genes
Western blot showed significantly decreased protein expression of B2R, VEGF-A, CCND1, MMP-2 and MMP-9 in the model group compared with the NC group (p < 0.001; Figure 13 A). The miR-29b-3p inhibitor significantly increased the expression of these proteins compared with the model group (p < 0.001; Figure 13 A), whereas treatment with pcDNA 3.1-siB2R in addition to miR-29b-3p inhibitor significantly inhibited the expression of these proteins compared with the miR-29b-3p inhibitor group (p < 0.001; Figure 13 A). Immunofluorescence staining showed significantly decreased B2R expression in the model group compared with the NC group (p < 0.001; Figure 13 B). The miR-29b-3p inhibitor significantly increased B2R expression compared with the model group (p < 0.001; Figure 13 B), whereas treatment with pcDNA 3.1-siB2R in addition to miR-29b-3p inhibitor significantly inhibited B2R expression compared with the miR-29b-3p inhibitor group (p < 0.001; Figure 13 B).
Discussion
Preeclampsia is an idiopathic disease that causes significantly increased morbidity and mortality of pregnant women and perinatal infants, yet its pathogenesis remains unclear [8, 9]. Normal extravillous trophoblasts’ biological activities (proliferation, migration and invasion) are the key factors for remodelling of uterine spiral arteries. During the formation of the placenta, extravillous trophoblasts invade into the basal aponeurosis and the superficial myometrium of the uterus, replacing the endothelial cells on the vascular wall of the uterine spiral artery and remodelling the uterine spiral artery [10]. Preeclampsia is a pregnancy-related disease caused by trophoblast dysfunction [11]. Relative studies have reported that miRNAs played a significant part in the occurrence of PE; they may affect the invasiveness of trophoblasts by regulating expression of downstream target genes [12, 13]. MiR-29b-3p played a key role in tumours’ occurrence and development, but its expression and function during PE have not been clarified; moreover, the correlation between miR-29b-3p and B2R has rarely been reported [13, 14]. DNA microarray gene screening revealed a significant reduction in B2R expression in early villus tissue in patients with PE [15], suggesting that B2R may be involved in trophoblast function. This study firstly evaluated miR-29b-3p and B2R expression levels in normal, mild and severe PE placenta and then explored their association with B2R and role in eclampsia by in vitro cell experiments.
In this study, we used CCK-8 and flow cytometry to determine the effects of miR-29b-3p and B2R on trophoblastic proliferation and cell cycle progression. These results also identified that miR-29b-3p downregulation or B2R overexpression improved the proliferation of HTR-8/SVneo cells and cell cycle progression from G1 phase to S phase. Meanwhile, treatment with siB2R suppressed HTR-8/SVneo cell proliferation and kept the cell cycle in the G1 phase.
Extravillous trophoblasts show active migration, invasion and ring formation, which are important in placental formation and uterine spiral arterial remodelling. Therefore, this study also explored the effect of miR-29b-3p and B2R on the migration of HTR-8/SVneo cells. By cell migration and invasion assays, the results showed that miR-29b-3p inhibitor or B2R supplement significantly promoted migration and invasion compared with those of the model group in HTR-8/SVneo cells. By contrast, transfecting siB2R in addition to miR-29b-3p inhibitor significantly inhibited HTR-8/SVneo cell migration and invasion compared with the miR-29b-3p inhibitor group. This study also examined molecules associated with cell migration and invasion, such as MMP-2 and MMP-9 [4]. The results showed that MMP-2 and MMP-9 in HTR-8/SVneo cells transfected with miR-29b-3p inhibitor or B2R-expressing plasmid significantly increased compared with those in the model group. In conclusion, high expression of B2R or miR-29b-3p inhibitor promoted the proliferation, invasion and migration of HTR-8/SVneo cells, whereas B2R reduction had the opposite effect. Our results also suggested that B2R may be a target of miR-29b-3p.
B2R is a bradykinin receptor that participates in many cellular functions primarily through activation of downstream signalling pathways in conjunction with bradykinin. In vascular endothelial cells, B2R in conjunction with bradykinin promotes the synthesis of nitric oxide, which relaxes blood vessels and increases vascular permeability, thereby promoting the formation of new blood vessels [16]. In tumour cells, B2R in conjunction with bradykinin promotes interleukin-6 expression, thereby inducing cell migration and invasion. In vitro cell migration assays and invasion assays also suggested that bradykinin promotes cell migration and invasion by activating B2R to increase pseudopods of extravillous trophoblasts [17, 18]. The results of this study suggested that miR-29b-3p inhibitor or B2R may directly activate downstream signalling pathways or mediate endogenous bradykinin or other ligands to promote trophoblast function. Previous studies have shown that receptors can function without corresponding ligands; for example, oestrogen receptors may promote the migration and invasion of ovarian cancer cell lines OVCA 420 and ES-2 independently of oestrogen [19, 20]. Given the complexity of the mechanism, the molecular mechanisms of how changes in B2R expression can influence biological function require further investigation.
The present research also detected the expression of cell cycle-associated CCND-1 and angiogenesis-associated VEGF-A. CCND-1 is a G1/S phase-specific cyclin that activates the E2F response gene by binding to cyclin kinase-4 to promote DNA synthesis, thereby promoting cell proliferation and regulating cell cycle progression [21]. In addition, the down-regulation of CCND-1 expression inhibits the proliferation and migration of human extravillous trophoblasts, suggesting that CCND-1 is also involved in the migration of these cells. VEGF-A is an indispensable molecule for trophoblast survival, proliferation, migration and invasion and promoted extravillous trophoblast migration [22], down-regulating VEGF-A expression and inhibiting extravillous trophoblast invasion [23]. Studies have shown that the expression of CCND-I and VEGF-A in placental tissue is significantly reduced in patients with PE [24, 25]. This study demonstrated that miR-29b-3p inhibitor promoted CCND-1 and VEGF-A protein levels by promoting B2R expression. Thus, increased B2R expression caused by miR-29b-3p inhibitor may promote trophoblast proliferation and migration/invasion by increasing CCND-1 and VEGF-A expression, respectively.
In conclusion, in extravillous trophoblast HTR-8/SVneo cells, B2R might be a potential target of miR-29b-3p. miR-29b-3p inhibition could effectively increase B2R expression, thereby promoting the extravillous trophoblasts’ biological activities including proliferation, migration and invasion, which are necessary for remodelling of the uterine spiral artery and are associated with many pregnancy complications. However, the specific molecular mechanism remains unclear.