Introduction
In Mexico, overweight and obesity represent a serious public health problem. According to the National Survey of Health and Nutrition data in 2018, over the last 12 years, overweight and obesity among adults increased by 15.2% [1].
In 2001, the National Institutes of Health introduced alternative clinical criteria for defining metabolic syndrome, and the National Cholesterol Education Program Adult Treatment III panel (ATP III) and the International Diabetes Federation (IDF) define metabolic syndrome as a set of metabolic disorders characterized by abdominal obesity, a decreased concentration of high-density lipoprotein cholesterol (HDL-C), hypertriglyceridemia, arterial hypertension, and hyperglycemia [2].
Obesity and metabolic syndrome are complex and heterogeneous clinical entities with a strong genetic component [3]. Their expression is influenced by environmental, social, cultural and economic factors [2, 4]. Obesity affects tissues at various levels, leading to macrophage infiltration into white adipose tissue, and high fat levels are associated with oxidative stress. Moreover, the activation of the proinflammatory transcription factor nuclear factor-kB (NF-kB) has been reported in overweight and obese people and in individuals suffering from diabetes [5]. In metabolic syndrome, genomic instability is present due to oxidative stress resulting from the promotion and formation of free radicals by reactive oxygen species (ROS); it has also been established that DNA instability is mediated by oxidative damage due to chronically high glucose levels [6].
Various genotoxic agents can lead to genomic instability and may induce micronuclei formation, resulting in the induction of cell death. Micronuclei are extranuclear bodies containing chromosomal material that arise due to chromatid fragments that lag during the anaphase of dividing cells that are not included in the nucleus near the end of the cellular cycle [7].
Extant studies suggest that a diet rich in fruit, fiber and antioxidants could promote a decrease in micronucleated (MN) cell frequency and neutralize ROS by increasing mitochondrial stability [6, 8]. Various studies have been conducted to determine the prophylactic actions of flaxseed oil and different drugs, such as cyclophosphamide, on oxidative stress [9, 10]. Recently, flaxseed has been promoted as a functional food due to its health benefits, which are mainly attributable to its high omega-3 fatty acid, lignan, dietary fiber and antioxidant contents [11–15]. The protective role of flaxseed oil against oxidative stress in metabolic syndrome has been documented in a murine model [14]. The beneficial effect of flaxseed supplementation on amelioration of central obesity and reduction of insulin resistance is also documented [16]. Nevertheless, limited studies have focused on biomonitoring genetic damage (nuclear anomalies) via buccal micronuclei assays (BMAs) and dietary effects [17], among them flaxseed supplementation.
The aim of the present quasi-experimental study was to biomonitor genetic damage via BMA by counting MN and binucleated (BN) cells, nuclear buds (NB) and broken eggs. In addition, we evaluated biochemical and anthropometric parameters in metabolic syndrome patients treated with a rich flaxseed diet and compared these patients to patients who received a conventional diet, to confirm the hypothesis that diet supplemented with flaxseed is favorable in metabolic syndrome patients, especially in terms of decreased genomic damage.
Material and methods
Subjects
Fifty-eight patients of both sexes aged 30–60 years with metabolic syndrome according to the ATP III criteria [18] who received nutrition services at the Hospital Civil Fray Antonio Alcalde and resided in western Mexico were included. All patients received treatment for diabetes. The nutritional records, including demographic and inherited data, were acquired for all patients. The sample included subjects without cancer or neurodegenerative or autoimmune diseases; subjects who were active smokers, alcohol drinkers and drug users and subjects with any genetic condition diagnosed at the onset of the study were excluded from the study.
The sample size was calculated by assuming a 28% MN reduction in the control group (CG) and a confidence interval of 95%, via the Fleiss formula [19], with a minimum of 26 patients per group. Fifty-eight patients were included and divided into two groups; the CG comprised 29 subjects who were given a personalized diet to treat metabolic syndrome, which was calculated according to the basal energy requirement by the Harris and Benedict formula [20]. The intervention group (IG) comprised 29 subjects who were given a diet supplemented with flaxseed and followed for 3 months. The flaxseed quantity was calculated by the Codex Committee on fats and oils Joint FAO/WHO Program on food standards and the Regulatory Framework for Flaxseed as an Ingredient for Human Feeding in Canada and the United States. Thus, the patients in the IG received 1.8 g/day of whole flaxseed for 3 months [21]. Patients were randomly assigned to take a personalized diet supplemented with flaxseed, to treat metabolic syndrome, or only follow a personalized diet for 3 months. The two groups were comparable in age, education level, occupation, body mass index (BMI), and comorbidities.
Anthropometric and biochemistry parameters
The anthropometric parameters included weight, height, BMI, and waist, hip and arm circumference. The percentage of fat and water was measured using a bioimpedance scale (FitScan BC-545F Tanita). The biochemical parameters, including the glucose, urea, creatinine, total cholesterol, HDL, low-density lipoprotein (LDL), very low-density lipoprotein (VLDL), and triglyceride levels, were measured, and an MN assay was performed at the beginning and end of the study.
Buccal micronucleus assay
The samples were obtained from the mucosal epithelial cells of the lateral cheek using glass slides. We used the Giemsa-Wright stain as described above [22]. The samples were analyzed by counting a total of 2000 cells from each patient (1000 cells at the beginning and 1000 cells at the end of follow-up). All frequencies were reported as the number of nuclear anomalies per 1000 cells observed. The following anomalies were observed: micronucleated (MN) cells, BN cells, NB and broken eggs.
Ethics statement
This study was conducted according to the guidelines of the Declaration of Helsinki and was approved by the Ethics and Research Committee (HCG/CI/0820/15). Written informed consent was obtained from all subjects who met the inclusion criteria and agreed to participate in the study.
Statistical analysis
The parametric data are expressed as the mean ± standard deviation (SD), and the non-parametric data are expressed as the frequency. The parametric (paired t-test) analyses used in the comparisons between the groups were performed using SPSS v.20 for Windows (IBM, Armonk, NY, USA), and p < 0.05 (two-tailed test) was considered to indicate statistical significance.
Results
In both groups, most participants were female (CG, 79% and IG, 73%) and housewives (CG, 52% and IG, 69%). The mean age of the participants in the CG and IG was over 40 years. Regarding the BMI, before the follow-up, in the CG, most participants had obesity grade 3 (32%), while in the IG, 38% of the participants were overweight; after the follow-up period, in the CG, 28% of the participants (highest value) had obesity grade 1, and 38% of the participants in the IG were overweight (Table I). No differences were observed between the groups in the sociodemographic characteristics. The complete demographic and clinical results of both groups are shown in Table I.
Table I
Sociodemographic characteristics of the subjects with metabolic syndrome
| Sociodemographic characteristics | Control group N (%) | Intervention group N (%) | P-value |
|---|---|---|---|
| Sex: | |||
| Women | 23 (79) | 25 (73) | 0.73 |
| Men | 6 (21) | 4 (27) | |
| Education: | |||
| Illiterate | 2 (14) | 1 (3) | |
| Primary | 12 (41) | 9 (31) | > 0.99 |
| High school | 8 (28) | 15 (52) | 0.54 |
| Baccalaureate | 5 (16) | 0 (0) | 0.38 |
| Technical career | 2 (1) | 1 (3) | 0.25 |
| Bachelor’s degree | 0 (0) | 3 (11) | 0.40 |
| Occupation: | |||
| Housewife | 15 (52) | 20 (69) | > 0.99 |
| Merchant | 2 (7) | 4 (14) | |
| Other occupation | 12 (41) | 5 (17) | 0.16 |
| BMI before follow-up: | |||
| Overweight | 7 (24) | 11 (38) | 0.60 |
| Obesity grade 1 | 6 (21) | 6 (21) | 1.00 |
| Obesity grade 2 | 7 (24) | 9 (31) | 0.60 |
| Obesity grade 3 | 9 (31) | 3 (10) | 0.21 |
| BMI after follow-up: | |||
| Overweight | 7 (24) | 11 (38) | 0.30 |
| Obesity grade 1 | 8 (28) | 6 (21) | |
| Obesity grade 2 | 6 (21) | 10 (34) | 0.93 |
| Obesity grade 3 | 8 (27) | 2 (7) | 0.05 |
| Age* | 47.14 (7.73) | 50.69 (7.12) | 0.24 |
Regarding the anthropometric parameters, only in the CG, the percentage of fat was significantly decreased after 3 months of adherence to the personalized diet (before, 45.40%; after, 37.89%) (Table II); however, the biochemical parameters urea and high-density lipoprotein were increased (before, 28.1 ±10.4, after, 33.34 ±10.9; before, 35.5 ±8, after, 40.5 ±9.8). The biochemical parameters, i.e., glycosylated hemoglobin, creatinine, total cholesterol and low-density lipoprotein (LDL), were decreased; nevertheless, the differences between the groups were not statistically significant, and an increase of very low-density lipoprotein (VLDL) was observed after the follow-up period in the CG (Table II).
Table II
Demographic and biochemical parameters of the metabolic syndrome patients before and after 3 months of follow-up
| Parameter | Control group | Intervention group | P-value** | ||||||
|---|---|---|---|---|---|---|---|---|---|
| Before follow-up Mean (SD) | After follow-up Mean (SD) | Mean differences (SD) | P-value* | Before follow-up Mean (SD) | After follow-up Mean (SD) | Mean differences (SD) | P-value* | ||
| Anthropometric: | |||||||||
| Weight [kg] | 90.87 (17.58) | 90.27 (17.13) | 0.59 (2.88) | 0.28 | 81.03 (13.17) | 79.81 (13.47) | 1.21 (2.30) | 0.01 | 0.02 |
| BMI [kg/m2] | 35.16 (6.88) | 34.98 (6.41) | 0.18 (1.32) | 0.48 | 32.70 (5.49) | 32.22 (5.64) | 0.48 (0.91) | 0.009 | 0.14 |
| Waista | 109.78 (13.30) | 108.11 (14.71) | 1.66 (4.61) | 0.06 | 103.76 (13.44) | 102.63 (13.17) | 1.13 (4.09) | 0.17 | 0.10 |
| Hipa | 120.62 (22.36) | 116.81 (16.21) | 3.81 (18.03) | 0.27 | 110.94 (11.48) | 110.80 (11.89) | 0.14 (5.88) | 0.90 | 0.04 |
| Arma | 33.09 (4.48) | 32.86 (3.97) | 0.23 (2.55) | 0.63 | 31.30 (2.78) | 31.07 (2.72) | 0.22 (2.03) | 0.57 | 0.12 |
| Fat (%) | 45.40 (10.25) | 37.89 (11.67) | 7.51 (4.99) | < 0.001 | 43.30 (8.53) | 41.36 (11.09) | 1.95 (7.43) | 0.17 | 0.40 |
| Water (%) | 39.14 (6.04) | 39.03 (6.17) | 0.11 (0.84) | 0.49 | 35.78 (4.99) | 34.78 (6.34) | 0.99 (3.73) | 0.16 | 0.03 |
| Biochemical: | |||||||||
| Glycosylated HGB (%) | 9.93 (10.71) | 7.70 (2.39) | 2.23 (10.95) | 0.32 | 7.13 (1.74) | 6.94 (1.69) | 0.19 (0.97) | 0.38 | 0.20 |
| Fasting glucoseb | 153.62 (54.34) | 167.79 (73.63) | –14.17 (68.03) | 0.27 | 140.76 (53.06) | 126.27 (39.99) | 13.91 (41.89) | 0.10 | 0.27 |
| Ureab | 28.13 (10.47) | 33.34 (10.92) | –5.21 (8.88) | 0.005 | 29.27 (11.90) | 32.61 (12.01) | –3.34 (8.37) | 0.05 | 0.70 |
| Creatinineb | 1.57 (4.38) | 0.76 (0.23) | 0.80 (4.41) | 0.34 | 0.67 (0.12) | 0.70 (0.12) | –0.04 (0.09) | 0.06 | 0.30 |
| Total cholesterolb | 197.78 (39.02) | 191.95 (40.75) | 5.82 (31.98) | 0.35 | 198.97 (55.80) | 187.36 (33.20) | 11.61 (59.70) | 0.37 | 0.89 |
| Triglyceridesb | 175.65 (60.10) | 186.14 (81.29) | –10.48 (69.90) | 0.45 | 149.61 (67.60) | 139.33 (58.10) | 10.27 (59.29) | 0.44 | 0.11 |
| HDLb | 35.54 (8.04) | 40.57 (9.85) | –5.03 (13.31) | 0.09 | 41.27 (9.26) | 42.33 (8.51) | –1.06 (6.43) | 0.53 | 0.03 |
| LDLb | 120.95 (34.94) | 113.29 (41.87) | 7.66 (25.63) | 0.19 | 115.42 (26.86) | 105.73 (35.95) | 9.69 (32.90) | 0.27 | 0.96 |
| VLDLb | 33.64 (11.23) | 41.17 (22.46) | –7.53 (24.79) | 0.17 | 31.96 (15.23) | 26.13 (7.54) | 5.83 (9.90) | 0.04 | 0.22 |
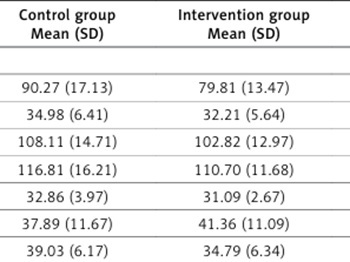
In the IG, the anthropometric and biochemical parameters, including weight (before, 81.03 ±13.17 kg; after, 79.81 ±13.47 kg) and BMI (before, 32.7 ±5.4; after, 32.2 ±5.6), were significantly lower after the addition of flaxseed to the personalized diet (Table II). The fat and water percentages and fasting glucose, total cholesterol, triglyceride, and LDL levels were decreased without statistical significance (Table II). An increase in the creatinine level was observed in the IG (before 0.67 ±0.12; after 0.7 ±0.12). Regarding the HDL and VLDL levels in the IG, a decrease was observed in both parameters after 3 months of follow-up (Table II). The results of the comparison of the anthropometric and biochemical parameters between the CG and IG at the end of follow-up are shown in Table III, and only weight, arm circumference, water average, and fasting glucose were significantly lower in the IG than in the CG.
Table III
Results after follow-up in patients with metabolic syndrome: control vs. intervention group
| Parameter | Control group Mean (SD) | Intervention group Mean (SD) | Mean differences | P-value * | |
|---|---|---|---|---|---|
| Anthropometric: | |||||
| Weight [kg] | 90.27 (17.13) | 79.81 (13.47) | –10.46 | 0.01 | |
| BMI [kg/m2] | 34.98 (6.41) | 32.21 (5.64) | –2.77 | 0.09 | |
| Waista | 108.11 (14.71) | 102.82 (12.97) | –5.29 | 0.16 | |
| Hipa | 116.81 (16.21) | 110.70 (11.68) | –6.11 | 0.11 | |
| Arma | 32.86 (3.97) | 31.09 (2.67) | –1.76 | 0.06 | |
| Fat (%) | 37.89 (11.67) | 41.36 (11.09) | 3.46 | 0.25 | |
| Water (%) | 39.03 (6.17) | 34.79 (6.34) | –4.25 | 0.01 | |
| Biochemical: | |||||
| Glycosylated HGB (%) | 7.59 (2.29) | 6.89 (1.59) | –0.70 | 0.21 | |
| Fasting glucoseb | 167.79 (73.63) | 126.85 (39.99) | –40.94 | 0.01 | |
| Ureab | 33.22 (10.73) | 33.29 (12.30) | –0.07 | 0.98 | |
| Creatinineb | 0.76 (0.23) | 0.70 (0.12) | 0.60 | 0.23 | |
| Total cholesterolb | 191.89 (41.75) | 193.00 (36.08) | 1.11 | 0.92 | |
| Triglyceridesb | 181.34 (80.91) | 162.85 (181.34) | 18.49 | 0.46 | |
| HDLb | 40.22 (9.18) | 40.96 (8.30) | 0.74 | 0.77 | |
| LDLb | 117.60 (42.20) | 114.13 (35.70) | –3.48 | 0.76 | |
| VLDLb | 40.87 (23.37) | 32.29 (20.72) | –8.58 | 0.18 | |
The results of the biomonitoring genetic damage BMA of the groups are shown in Table IV. Interestingly, the frequency of MN and BN cells was decreased after 3 months of follow-up in the CG (before, 14.03 ±5.28, after 11.17 ±3.68; before, 2.66 ±3.5, after, 1.10 ±1.66), but in the IG, the frequency of the MN and BN cells and NB was significantly lower after 3 months of follow-up than at the beginning of the study (MN before, 4.97 ±5.47, after, 1.38 ±1.97; BN before, 23.69 ±21.93, after, 10.66 ±10.34; and NB before, 5.10 ±6.63, after, 2.17 ±2.74). Before the nutritional follow-up, differences in the MN, BN and NB frequencies were found between the groups (MN (CG, 14.03 ±5.28; IG, 4.97 ±5.47), BN (CG, 2.66 ±3.51; IG, 23.6 ±21.93) and NB (CG, 0; IG, 5.1 ±6.6)) at the beginning of the study (Table III). Regarding the anthropometric and biochemical parameters, significant differences were found between the groups before the 3 months of follow-up; weight, hip circumference, and water percentage in the CG were higher than those in the IG, while the HDL level in the CG was significantly lower than that in the IG (Table II).
Table IV
Comparison of nuclear anomalies in the patients with metabolic syndrome in the control and intervention groups before and after 3 months of follow-up
Discussion
According to the National Survey of Health and Nutrition, metabolic syndrome and obesity have become growing public health problems in Mexico since 2006 and can result in unfavorable anthropometric measurements and chronic diseases.
Regarding sociodemographic characteristics, it is recognized that obesity and metabolic syndrome show a preferential distribution in women [3]; as expected, a great number of women were admitted in the present study.
The analysis of the anthropometric parameters between groups before follow-up showed that the weight of the participants in the CG was higher than that of the participants in the IG, which may also explain the differences in hip circumference between the groups at the beginning of the study. Close to 80% of individuals in the groups were female, and the waist-to-hip ratio averages before and after were close to 0.93 (high cardiovascular risk); at the end of follow-up, the high risk remained. In 2008 and 2011, Andreassi et al. described the damage to DNA caused by ROS, specifically the expansion of abdominal fat associated with free fatty acids (FFAs) and their associated effects on the insulin signaling transduction pathway and endothelial dysfunction, in obesity, diabetes and cardiovascular diseases due to chronic oxidative stress [6, 23].
After the nutritional follow-up, the groups showed decreases in most parameters, which were expected and desired (weight, BMI, waist, fat, glycosylated HGB, total cholesterol, and LDL); however, some parameters were significantly decreased differentially by group (in the CG, fat percentage, but in the IG, weight, BMI and VLDL), which may be due to the size of the sample. Large studies are necessary to clarify the effect of diet plus linseed in metabolic syndrome patients. In the case of the urea levels, in both groups, slight increases within normal values were expected due to the protein ingested as a part of the dietary adjustment. Similarly, the observed increase in HDL is favorable and desired in this group of patients [24]. Regarding the triglyceride and VLDL levels, in our small group of patients analyzed in the present study, interestingly, both factors were decreased in the IG but increased in the CG after the follow-up period; however, only VLDL showed a significant reduction (Table II). Studies investigating flaxseed supplementation in humans have identified a significant decrease in blood pressure values; a reduction in the total LDL, total cholesterol, triglyceride, blood glucose, and tumor necrosis factor a levels [25–28]; and the inhibition of platelet aggregation, suggesting that the metabolites of flaxseed have protective effects on the alterations generated by this disease in terms of both disease control and decreases in the biomarkers and clinical symptomatology of the patients, translating to a decreased risk for cardiovascular and hematological diseases [12–15, 28]. Regarding creatinine levels, the IG showed a significant increase after 3 months of follow-up, which may be due to differential physical activity, and this difference should be tested in a study involving a larger number of patients and a longer follow-up.
By comparing the groups after follow-up, in the IG, reductions were observed in most parameters (Table III) compared to the CG values; nonetheless, significant reductions were observed only in weight, arm circumference, water percentage, and fasting glucose. In general, according to the reductions in the anthropometric and biochemical values, it can be established that the diet supplemented with flaxseed in the present study was more favorable in the metabolic syndrome patients analyzed.
Regarding the nuclear anomalies, the MN frequency in the CG was higher than that in the IG; in contrast, the BN frequency in the IG was higher than that in the CG at the beginning of the study. NB cells were observed only in the IG. The differences in the MN, BN and NB frequencies between the groups could be partially explained. The weight, hip circumference, water percentage and HDL values in the CG were higher (p = 0.02–0.04) than those in the CG, indicating that the CG could have metabolic differences. Additionally, in this study, we could not perform a reliable analysis of the associations between the parameters (weight, hip circumference, water percentage and HDL values) and nuclear anomalies because of the small number of patients, as patients with concomitant disease were excluded and the number of participants was greatly reduced, and variations due to chance effects or unknown factors present in the IG that could be associated with the high presence of BN. Even though the groups at the beginning of the study presented differences in the frequency of nuclear abnormalities (not comparable groups), the diet supplemented with flaxseed showed a clear beneficial effect on nuclear anomalies, reducing the frequency of Micronucleated and Binuclear cells in both groups.
Regarding the MN cells, the frequencies observed in the two groups (GC 14.03 and IG 4.97) were higher than those in unexposed/healthy controls (0.74 per 1000 cells) reported in a previous report [17]; in obesity and diabetes, oxidative stress has been shown to impair genetic stability, as reflected by the high MN frequency [8, 29]. Karaman et al. studied patients aged 27 to 80 years and reported that the micronucleus frequency was higher in populations with obesity than without; the age range of these patients was 32 to 68 years. Bonassi et al. reported that among individuals older than 40 years in the heterogeneous population, the frequency of micronuclear cells was increased (2.26–2.85). In contrast, a study conducted in Culiacan, Sinaloa, Mexico involving patients with diabetes mellitus types 1 and 2 (DM1 and DM2) reported MN frequencies of 0.75 ±0.31 and 0.52 ±0.27 in DM1 and DM2, respectively, with BMIs of 24.5 ±3.2 in DM1 and 32.8 ±12.0 in DM2 [30], suggesting less genotoxic damage than that reported in the present study.
A high frequency of BN cells was observed in the IG (23.69 ±21.93), while in the unexposed/healthy controls, the BN frequency was 3.04 (per 1000 cells) [17]; however, our results were different. Compared with previous studies investigating metabolic syndrome and obesity, the number of binucleated cells in the patients enrolled in the present study was similar. Donmez-Altuntas et al. reported a BN frequency of 29.29 ±13.03.
Nuclear buds were observed only in the IG (5.1 per 1000 cells), and their frequency was higher than that previously reported in healthy controls (1.36 per 1000 cells) and in populations with obesity (1.64 ±0.84) [17, 29]. A few studies have shown that “nuclear buds” are genotoxicity indicators when they are present in lymphocytes. However, in exfoliated cells it is not clear if they are associated. Thus, it can be assumed that cells with nuclear buds are not associated with genotoxic, clastogenic, or aneuploidogenic events, but perhaps they could be associated with degenerative processes in the first layer of mucosal epithelial cells (germ layer) [31–33].
To the best of our knowledge, this study is the first follow-up study in North America to evaluate the effects of a diet supplemented with flaxseed on anthropometric and biochemical variables and nuclear anomalies. In the present study, a nutritional intervention based on antioxidant supplementation was performed over a period of 3 months to determine whether antioxidants could modify the level of genotoxic damage in metabolic syndrome. The amount of whole flaxseed used in the present study was lower (1.8 g/day during 3 months of follow-up) than the amounts used in two independent studies (milled flaxseed, 30–40 g/day) [16, 34], according to the recommendations of the Committee on fats and oils (FAO/WHO).
The results show differences in genotoxicity between a nutritional treatment, including an antioxidant, and conventional management (basic diet). In Mexico, the prevalence of obesity has been increasing, as mentioned above; however, it is a worldwide health problem; in the US, the prevalence of obesity among adults increased over 9 years by 5.9% (33.7% (2007–2008) to 39.6% (2015–2016)) [35], and worldwide obesity has nearly tripled since 1975 (data from the World Health Organization in 2019). The global obesity epidemic requires a collaborative care model in multidisciplinary teams including nursing professionals.
It is important to recognize the dependency between age and increased MN cells. The minimum age in our population was close to 40 years, and it is established that above the age of 40 years, the incidence of MN increases. Therefore, our results might not be extrapolated to a population younger than 40 years of age; additionally, the number of patients with metabolic syndrome was small, the patients had different drug treatments according their cardiovascular risk, and the time of metabolic syndrome evolution was heterogeneous, all of which could represent limitations of the present study.
In conclusion, the group that consumed a diet supplemented with flaxseed showed a greater decrease in weight, BMI and VLDL than the CG. The number of nuclear anomalies decreased in both groups, but a greater mean decrease in micronuclei and binuclear cells was observed in the IG after 3 months. A large study is necessary to establish the effect of diets supplemented with flaxseed in young patients with metabolic syndrome, which in Mexico is a public health problem in this age group.