Myopia is a very common eye condition that is rapidly increasing in occurrence. It is the most common eye disease in teenagers [1], and uncorrected ametropia is the main cause of moderate or severe visual impairment in people aged 50 years and above [2]. It is estimated that the number of patients with myopia will reach 4.758 billion by 2050, accounting for 49.8% of the global population [3]. The severity of a patient’s myopia is also associated with increased risk of visual impairment due to macular degeneration, cataracts, retinal detachment, and glaucoma caused by high myopia [4]. A decreased visual function in the early stage of myopia [5–7] has also been noted, but the molecular mechanism remains unclear. Due to the existence of a large number of genes that affect biological function, retinal pigmental epithelium (RPE) single-cell captured ribonucleic acid (RNA) sequencing technology was adopted to explore the molecular mechanism of RPE cell apoptosis in myopia and provide a theoretical basis for clinical guidance aimed at protecting early visual function in myopic patients.
The original data of the gene expression profiles in the samples were uploaded to the GCBI analysis platform (https://www.gcbi.com.cn/gclib/html/index). The samples were divided into 2 groups of 3 samples each: the negative control group and the myopic model group. The samples of the 2 groups were compared and labelled as the model group and the control group (i.e. the myopic model group compared with the negative control group). The signal values of the original data expression spectrum were read respectively, and the differences in gene expression between the myopic model group and the negative control group were analysed. The criteria for the screening of the differential gene were as follows: p < 0.05, Q < 0.05, fold change (FC) > 2. The up-regulated and down-regulated genes in the expression profile in the model group vs. the control group were obtained.
The edgeR package was used to perform difference analysis. The false discovery rate (FDR) < 0.05 and | log2 (multiple change) > 1 were set as the cut-off values for the screening of the differentially expressed genes (DEG). The gene co-expression network was constructed using the EBcoexpress package. The GO enrichment analysis of the DEG in the co-expression network was carried out using the Database for Annotation, Visualisation, and Integrated Discovery (DAVID) (https://david.ncifcrf.gov/). KOBAS 3.0 (http://kobas.cbi.pku.edu.cn/) was adopted to form a path map reflecting the DEG by the KEGG pathway enrichment analysis of DEG.
At the beginning of the experiment, there was no correlation between the ocular axial length of the two groups (p > 0.05). Six weeks after the beginning of the experiment, the ocular axial length of the mice in the model group was significantly longer than that of the mice in the control group (p < 0.01). The changes in the ocular axial length at each stage of the experiment are shown in Table I.
Table I
The changes in the ocular axial length at each stage of the experiment (x ± s)
The cluster map showed that 3900 genes were identified in the model group vs. the control group. DEG analysis identified 617 genes, including 96 up-regulated genes and 521 down-regulated genes. Different gene expression patterns were observed between the two groups, indicating the reliability of DEGs.
In the differential genes of the model group vs. the control group, the genes with a statistical significance of p < 0.05 were screened out, which indicates that there are gene expression changes in RPE cells during myopia.
Through the functional enrichment analysis of differential genes, a total of 1801 GO items were detected in the model group vs. the control group. Among these items, 1039 GO items had a statistical significance of p < 0.05, including 774 in the biological process, 152 in the cellular components, and 111 in molecular function.
In the model group vs. the control group, GO correlated with the negative regulation of the neurotransmitter transportation, Tau protein binding, long-term neuronal synaptic plasticity regulation, and GABA transport, and other biological processes related to neuronal apoptosis and neurotransmitter regulation were found. These genes were correlated with the neurodegenerative diseases related to β-amyloid metabolism and with glycolysis related to fructose 6-phosphate. This suggests that the RPE cells were in a state of anaerobic oxidation, protein dysfunction, and neuromodulation disorder during myopia.
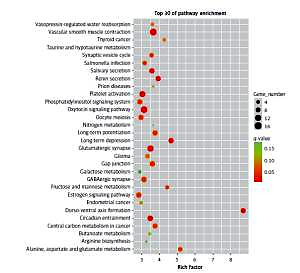
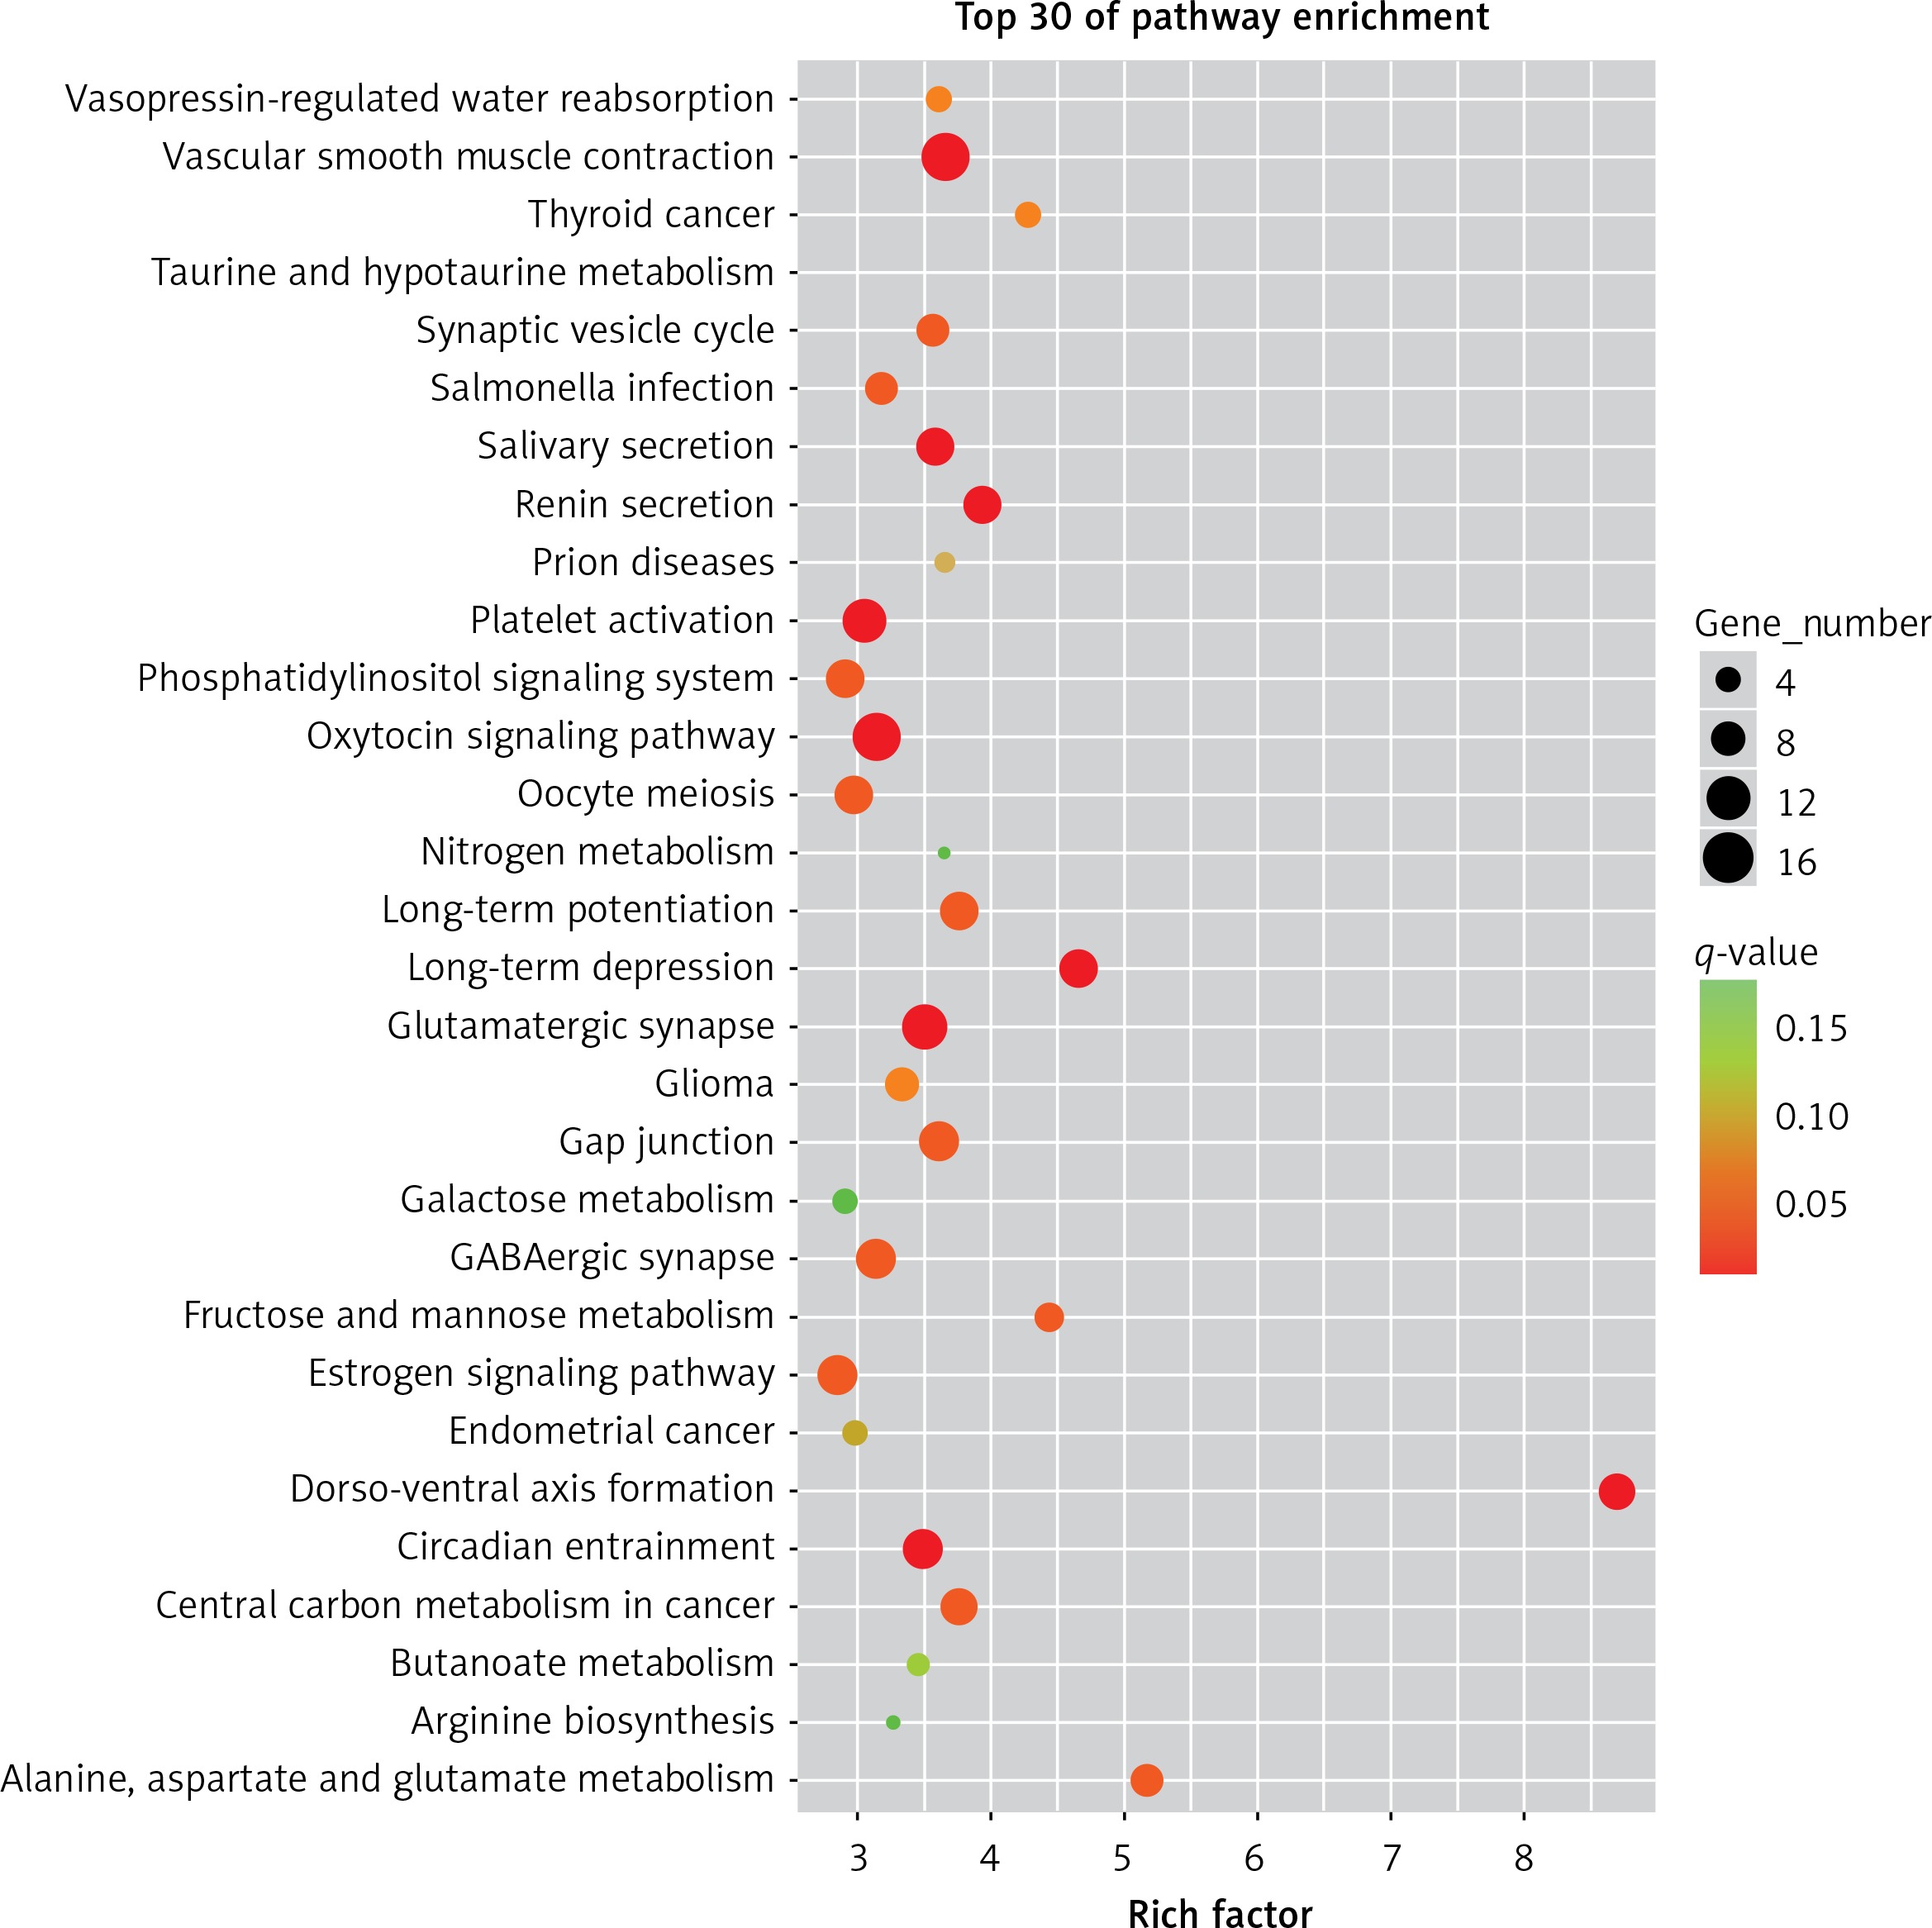
The results of the signal pathway enrichment analysis showed that 219 pathways were detected in the model group vs. the control group, of which 87 were statistically significant (p < 0.05). The 30 highest expressions of the KEGG pathway in the RPE cells of mice in the myopic model group showed that neurotransmitter-related pathways (such as the glutamatergic synapses and GABAergic synapses), oxidative-phosphorylation-related pathways (such as the fructose/mannose metabolism), and protein-related pathways (such as the oxytocin pathway) were activated (Figure 1).
Figure 1
The first 30 pathways of the enrichment of KEGG in the model group vs. the control group. Each point in the figure represented a KEGG path, and the path name was shown in the left coordinate axis. The horizontal ordinate was the Enrichment Factor, which represented the ratio of the proportion of differentially expressed proteins annotated to the pathway to that of the species. The higher the enrichment factor, the more significant the enrichment of the differential proteins in the pathway
Through the single-cell RNA sequencing of the RPE cells, it was found that the cells were exposed to hypoxia during the development of myopia and that hypoxia might lead to functional limitations in the RPE cells [8]. The GO items with statistical significance, such as adenosine triphosphate (ATP) production, oxidative phosphorylation, and glycolysis through fructose 6-phosphate, were found in the RPE cells of the mice in the myopic model group. Glycolysis (specifically the process of anaerobic oxidation) may have occurred in the RPE cells of these mice [9]. Thus, it can be inferred that RPE cells are exposed to hypoxia during myopia; as RPE cells are oxygen-consuming cells, this hypoxia may activate glycolysis and oxidative phosphorylation in the cells [10–12].
In addition, protein phosphorylation regulation, protein localisation, endoplasmic reticulum localisation, and negative regulation of the glycoprotein process were found in the GO affecting the function of protein. It can be inferred that the protein function of RPE cells might be affected during myopia, leading to protein phosphorylation and endoplasmic reticulum stress [13].
In the analysis of the KEGG pathway, it was found that a large number of pathways associated with amino acids, dopamine, and other neurotransmitters in the RPE cells of the mice in the myopic model, as well as the oxidation-related pathways (such as the fructose/mannose metabolism) and galactose metabolism pathway, were activated, suggesting the occurrence of glycolysis [14]. This confirmed that RPE cells are in hypoxia during the development of myopia, causing anaerobic metabolism. Some related pathways concerning the dysfunction of neurons and neurotransmitters, such as the dopaminergic synapses, glutamate, and cholinergic synaptic signalling pathways, were also found (the dysfunction of neurotransmitters may affect the development of RPE) [15].
Further analysis of INSIG1, PABPC1, PSMD11, SCD1, and other genes is helpful in further understanding the effect of myopia on the injury of the RPE cells in mice. In the current study, the expressions of INSIG1, SCD1, and PABPC1 were up-regulated in the eyes of the mice in the myopic model group. The RNA sequencing revealed that PABPC1, the substrate of caspase, was up-regulated in the mice in the myopic model group (RNA degradation is one of the markers of apoptosis). Our previous study found that c-Jun, an autophagy inhibitor protein, is the upstream trigger signal of apoptosis and autophagy. Bcl-2 is the homologous domain protein of the apoptosis inhibitor Beclin-1, which can induce autophagy. However, the results of the present study show that these two factors were decreased in the RPE cells of the mice in the myopic model group by Western Blot (WB) and PCR. Bcl-2 and caspase are bidirectional regulators of autophagic apoptosis. Caspase is the main driving force of apoptosis, and activated caspase can degrade autophagy proteins (namely Beclin-1, ATG5, and ATG7) to prevent autophagy. Caspase can also change an autophagy protein into a pro-apoptotic protein, thus triggering the apoptotic death of cells.
The present experiment found that the expression of INSIG1 was up-regulated in the eyes of the mice in the myopic model group and that SREBP1 was significantly activated after the rapid degradation of the endoplasmic reticulum protein INSIG1, leading to neuronal apoptosis induced by glutamate excitotoxicity. It was hypothesised that the up-regulation of INSIG1 might be a firing of the mechanism of neuronal self-protection. The expression of TDO2 was also up-regulated in the RPE cells of the mice in the myopic model group. TDO2 is a tryptophan 2,3-dioxygenase, which is the metabolite of tryptophan. A strong expression of tryptophan hydroxylase was observed in the bipolar cells, amacrine ganglion cells, ganglion cells, and photoreceptors. In the nervous system, TDO2 is a rate-limiting enzyme in the canine urethane pathway that can induce the expression of the neuronal survival factor. The results of Fiedorowicz et al. showed that the kynurenine pathway is out of balance in an injured retina: during the process of retinal/optic nerve injury, the concentration of kynurenic acid transiently increases. The up-regulation of TDO2 therefore indicates the activation of the kynurenine pathway, while the increase of the concentration of kynurenic acid suggests retinal injury.
In conclusion, RPE cell dysfunction was found to occur during the development of myopia, which might be correlated with gene expression and pathway regulation related to glycolysis and oxidation, neurodegenerative disease, and the regulatory function of protein.