Introduction
According to the latest report of the Global Burden of Disease published in 2019 (GBD 2019), oral disorders, including dental caries, periodontitis, and tooth loss, affect more than 44.5% of the global population [1]. Serious disability caused by oral disorders leads to pain, sepsis, reduced school time, decreased work efficiency, and decreased overall quality of life [2, 3]. Although oral disorders can be prevented to a large extent, they are a neglected problem and are rarely regarded as a health policy priority [4].
The WHO has long listed oral health as one of the top 10 standards for human health, and its analysis report suggests that oral diseases have become a decisive factor in human quality of life and a global public health burden [5, 6]. Although with the development of social economy and culture, people’s overall health status continues to improve, and oral health has also improved, oral diseases are still a very common health problem. Moreover, rapid demographic, economic, and educational changes will inevitably have an impact on the epidemiology of dental caries, periodontal disease, and oral cancer [7]. Therefore, the severity of oral diseases varies significantly by region, ethnicity, age, and gender, with significant differences in oral health among different regions and populations. It is particularly worrisome that the incidence of oral disorders is increasing in many low-income and middle-income countries [8].
Information about disease burden is important for monitoring the macro health status and changes of a country’s or region’s population. The measurement of the burden of oral diseases helps us to understand the objective impact of oral diseases on health, and it can provide a strong decision-making basis for relevant health policies. However, due to a lack of comparable data, there are few comprehensive studies assessing inequalities in oral disorders between different countries and regions.
The GBD 2019 study assessed the burden of 369 diseases in 21 regions and 204 countries and regions globally. These data allow assessments of the burden and trends of oral disorders [9]. In this study, we evaluated the oral disorder data from the GBD 2019 study to estimate the distribution, burden (including incidence and disability adjusted life years (DALYs)), and trends of oral disorders in different regions and countries from 1990 to 2019. This is of great significance for accurately assessing the burden of oral disorders and rationally allocating limited healthcare resources.
Material and methods
Data sources
Using the Global Health Data Exchange of the GBD database for retrieval (https://ghdx.healthdata.org/), we collected the age-standardized incidence and DALY rate of oral disorders and their 95% uncertainty intervals (95% UIs) for 204 countries and regions from 1990 to 2019 by age, gender, country, and region [9]. We followed the Guidelines for Accurate and Transparent Health Estimates Reporting recommendations. The First Affiliated Hospital of Wenzhou Medical University reviewed and approved this study.
Definition of oral disorders
The oral disorders included in the analysis were caries of deciduous teeth, caries of permanent teeth, chronic periodontal disease, and other oral disorders.
Sociodemographic Index
The Sociodemographic Index (SDI) is a comprehensive index, including gross domestic product per capita, the average years of education, and the fertility rate. The SDI value reflects social development and is an important variable used to assess the disease burden and healthy development of a region. The GBD study divided 204 countries and regions into 5 SDI quintiles (low, low-middle, middle, high-middle, and high) [10].
Statistical analysis
We used the World Health Organization 2000–2025 global standard to calculate age-standardized rates (per 100,000 people) as follows:
In this formula, a1 is the specific age rate in the ith age group, wi is the population (or weight) of the corresponding ith age subgroup in the selected reference standard population, and A is the number of age groups.
The estimated annual percent change (EAPC) is a recognized metric to describe the trends in age-standardized rates within a regression model [11, 12]. It calculates the average annual change in the age-standardized rate for all specific intervals. Linear regression was used to estimate the EAPC, using the equation y = α + βx + ε, where y = ln (age standardized rate) and x = the Gregorian calendar year. The EAPC was calculated using the formula 100 × [exp(β) – 1], and the 95% confidence interval (CI) was calculated using the linear regression model. When the EAPC value and its 95% CI were greater than 0, it was defined as an increasing trend. Conversely, when the EAPC value and its 95% CI were less than 0, it was defined as a decreasing trend. The age standardized rate has been shown to be relatively stable over a specific period. The 95% UI was used to describe the absolute numbers for incidence, mortality, and DALYs, and the corresponding rates (per 100,000 people) [13].
All statistical analyses were performed using the R program (V4.0.4, https://www.r-project. org/), and p < 0.05 was considered statistically significant.
Results
Oral disorders globally
Globally, the age-standardized incidence rate of oral disorders increased from 57,146 in 1990 to 57,481 in 2019 (Table I). The age-standardized DALY rate associated with oral disorders was 295 in 1990 and 284 in 2019 (Table II).
Table I
The age-standardized incidence rate (ASIR) of oral disorders in 1990 and 2019 and its temporal trends
Table II
The age-standardized DALY rate of oral disorder in 1990 and 2019 and its temporal trends
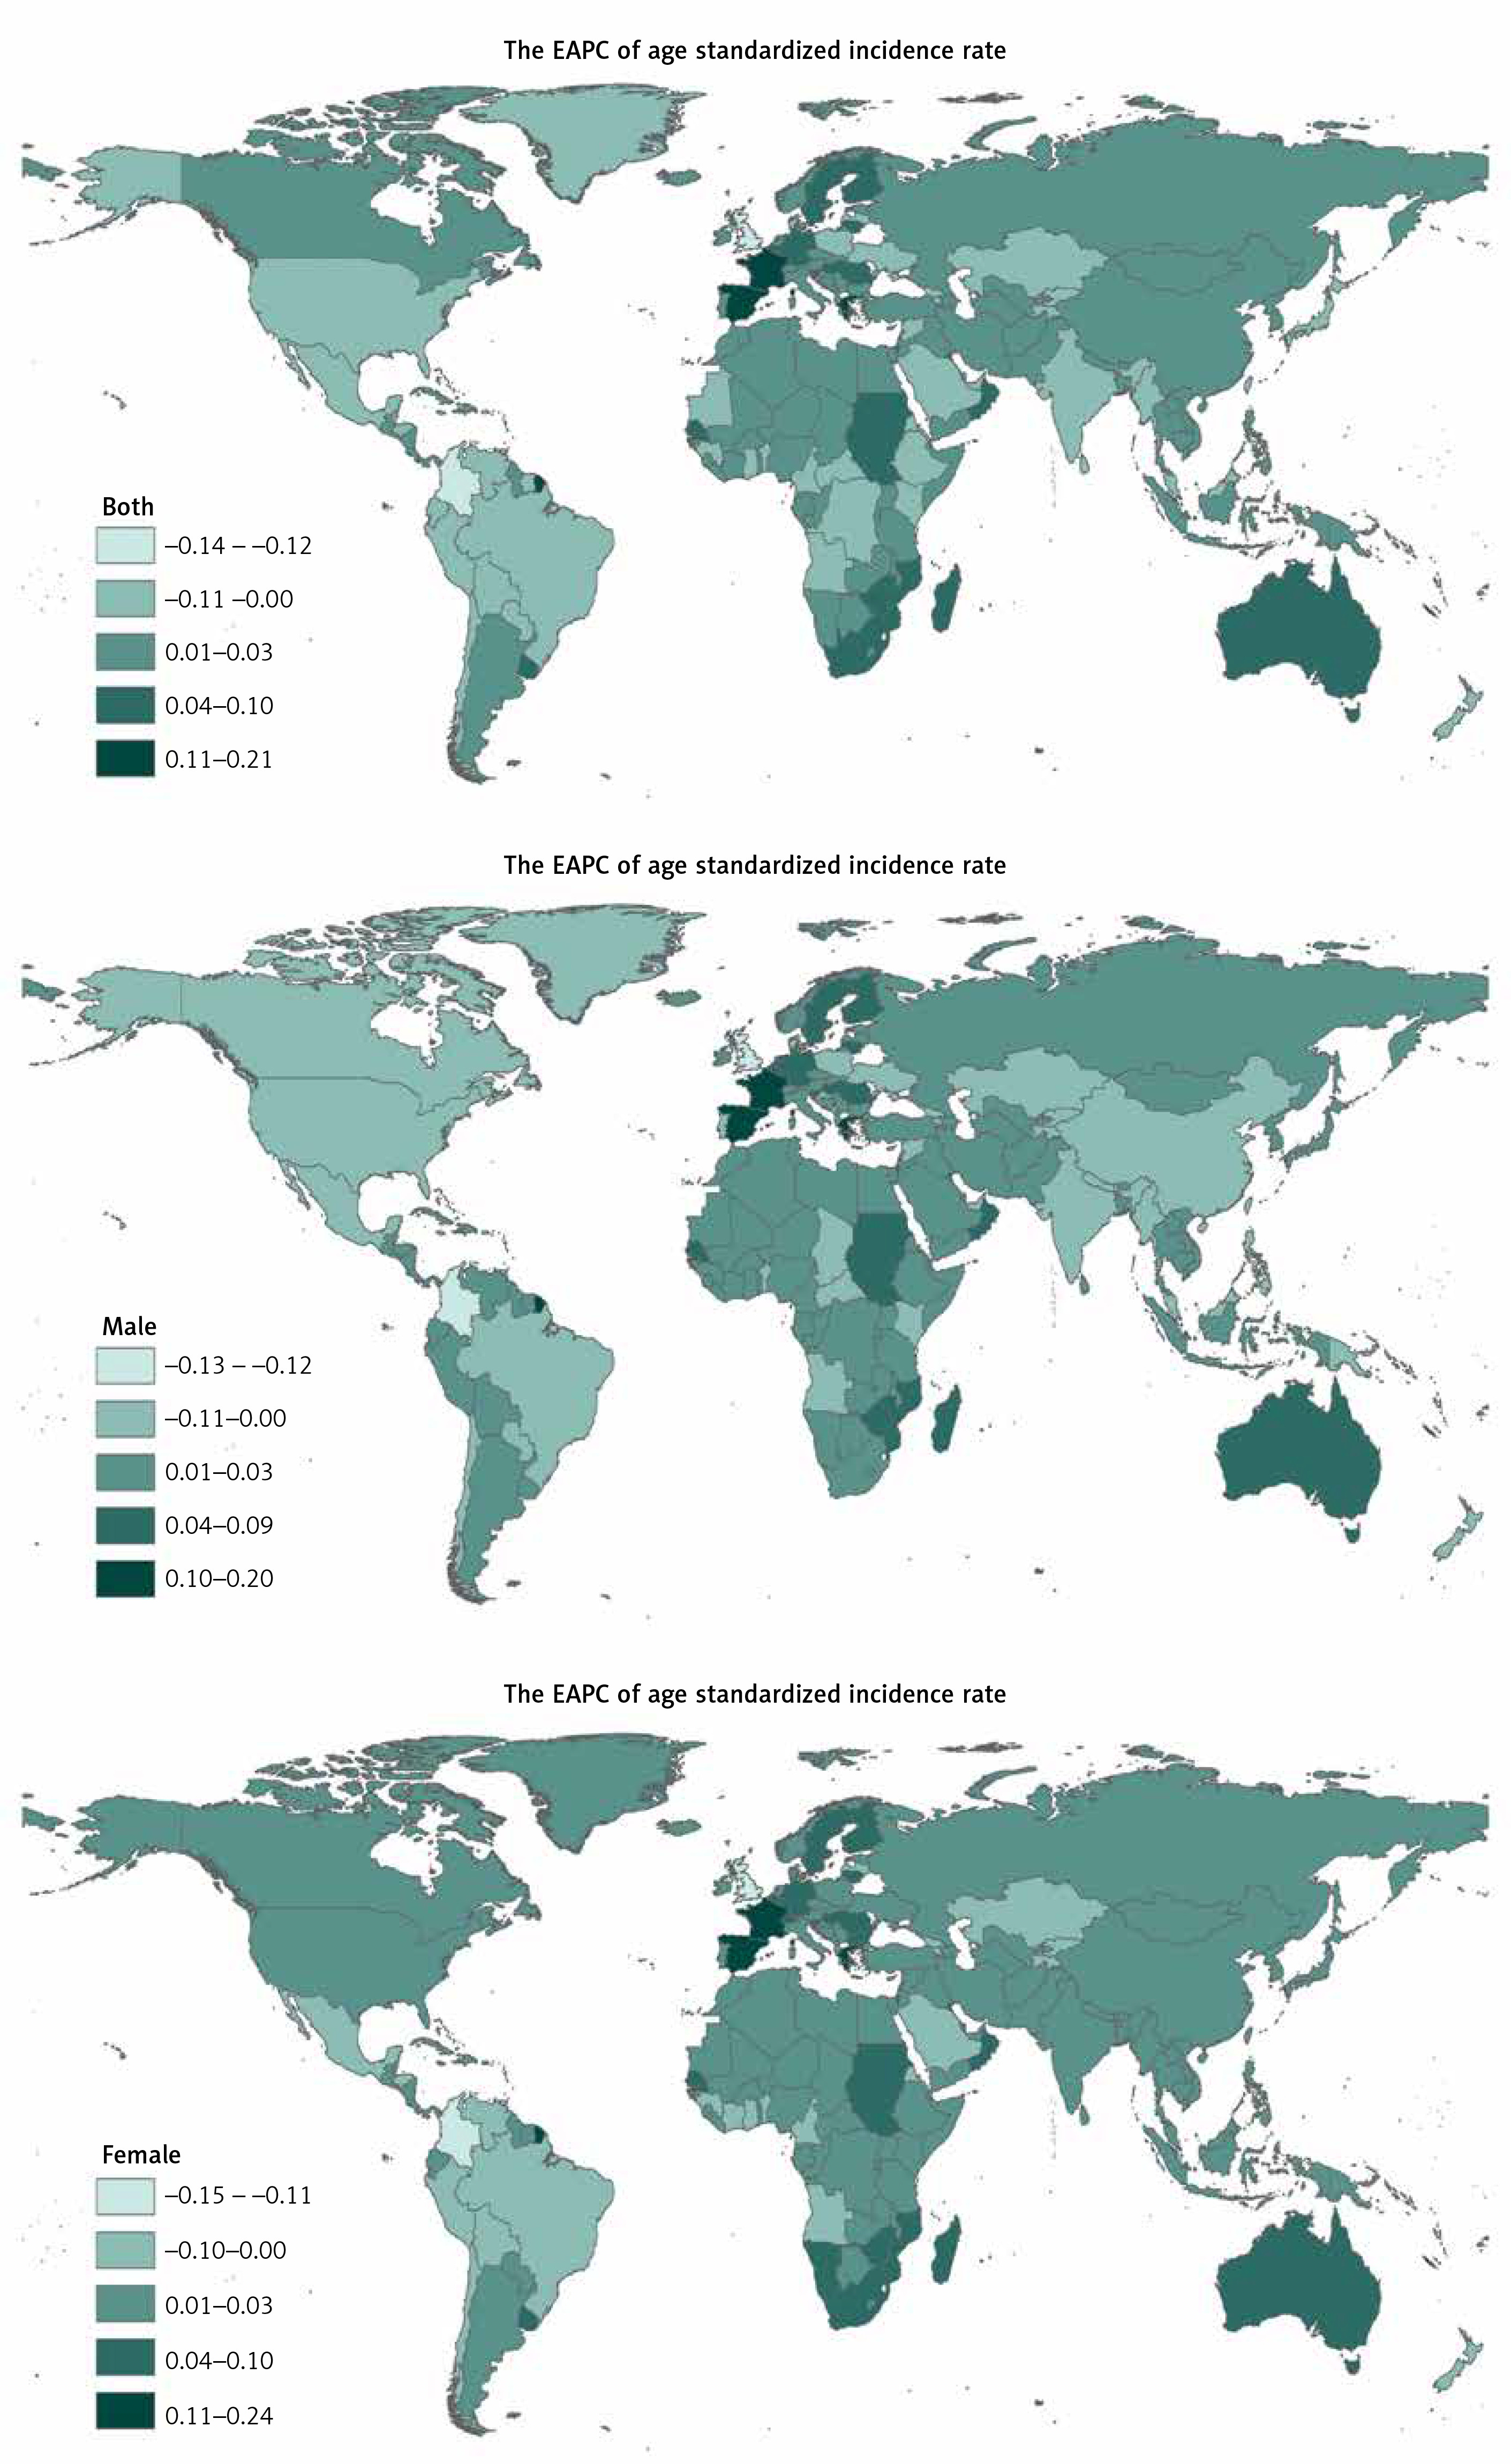
At the global level, from 1990 to 2019, the age-standardized incidence rate of oral disorders showed an upward trend (Figure 1 A). Furthermore, the age-standardized rates and their trends varied between different regions (Figure 1 A, Supplementary Table SI, and Supplementary Figure S1 A). The 3 countries with the largest increases in oral disorder incidence from 1990 to 2019 were India, China, and the United States (Supplementary Table SII). China also showed the largest increase in oral disorder-related DALYs from 1990 to 2019 (Supplementary Table SII, Figure 2).
Oral disorder incidence
As reported in Supplementary Table SIII, the greatest decrease in the age-standardized incidence rate of oral disorder was in Colombia (total: EAPC = –0.75; females: EAPC = –0.77; males: EAPC = –0.73), while the greatest increase was in Spain (total: EAPC = 0.64; females: EAPC = 0.73; males: EAPC = 0.57). The greatest increase in the age-standardized incidence rate of oral disorders in males was in Belgium (EAPC = 0.61). The region with the greatest change in the incidence of oral disorders from 1990 to 2019 was South Asia, whereas the region with the smallest change was Oceania (Supplementary Table SI).
The greatest increase in the age-standardized incidence rate of oral disorders from 1990 to 2019 was observed in countries in the high-middle SDI quintile (EAPC = 0.04; 95% CI: 0.01–0.07; Table I). Low-middle-SDI countries had the highest age-standardized incidence rate (57,968 in 1990 and 58,087 in 2019), whereas high-SDI countries had the lowest age-standardized incidence rate (54,954 in 1990 and 55,671 in 2019; Table I).
The EAPC in the age-standardized incidence rate of oral disorders was found to be positively correlated with the age-standardized incidence rate of oral disorders (ρ = 0.023, p = 0.001, Supplementary Figure S2 A) but negatively correlated with the SDI value (ρ = –0.960, p = 0.171, Supplementary Figure S2 B). We also found that regions with higher SDI values had lower proportions of oral disorder cases in young people, and regions in which the SDI value increased from 1990 to 2019 had a higher proportion of oral disorder cases in younger adults (Supplementary Figures S3 A and S3 B). The annual proportions of oral disorder cases in young people and older adults were relatively stable from year to year (Supplementary Figure S4 A). The age distribution of the incidence (per 100,000) of oral disorders in different countries in 2019 is shown in Supplementary Table SIV and Supplementary Figure S5.
Oral-disorder-related DALYs
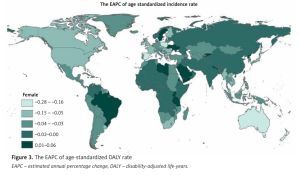
From 1990 to 2019, the age-standardized DALY rate of oral disorders showed different trends globally and between different regions (Figure 1 B, Supplementary Table SI, and Supplementary Figure S1 B). As shown in Supplementary Table SII, Peru (total: 457; females: 495; males: 416) had the highest age-standardized DALY rate in 2019. As shown in Supplementary Table SV, the greatest decrease in the age-standardized DALY rate was observed in Spain (total: EAPC = –0.94; females: EAPC = –0.96; males: EAPC = –0.86, Figure 3), while the greatest increase was observed in India (total: EAPC = 0.82; females: EAPC = 0.89; males: EAPC = 0.73; Figure 3, Supplementary Table SII).
Figure 3
The EAPC of age-standardized DALY rate
EAPC – estimated annual percentage change, DALY – disability-adjusted life-years.
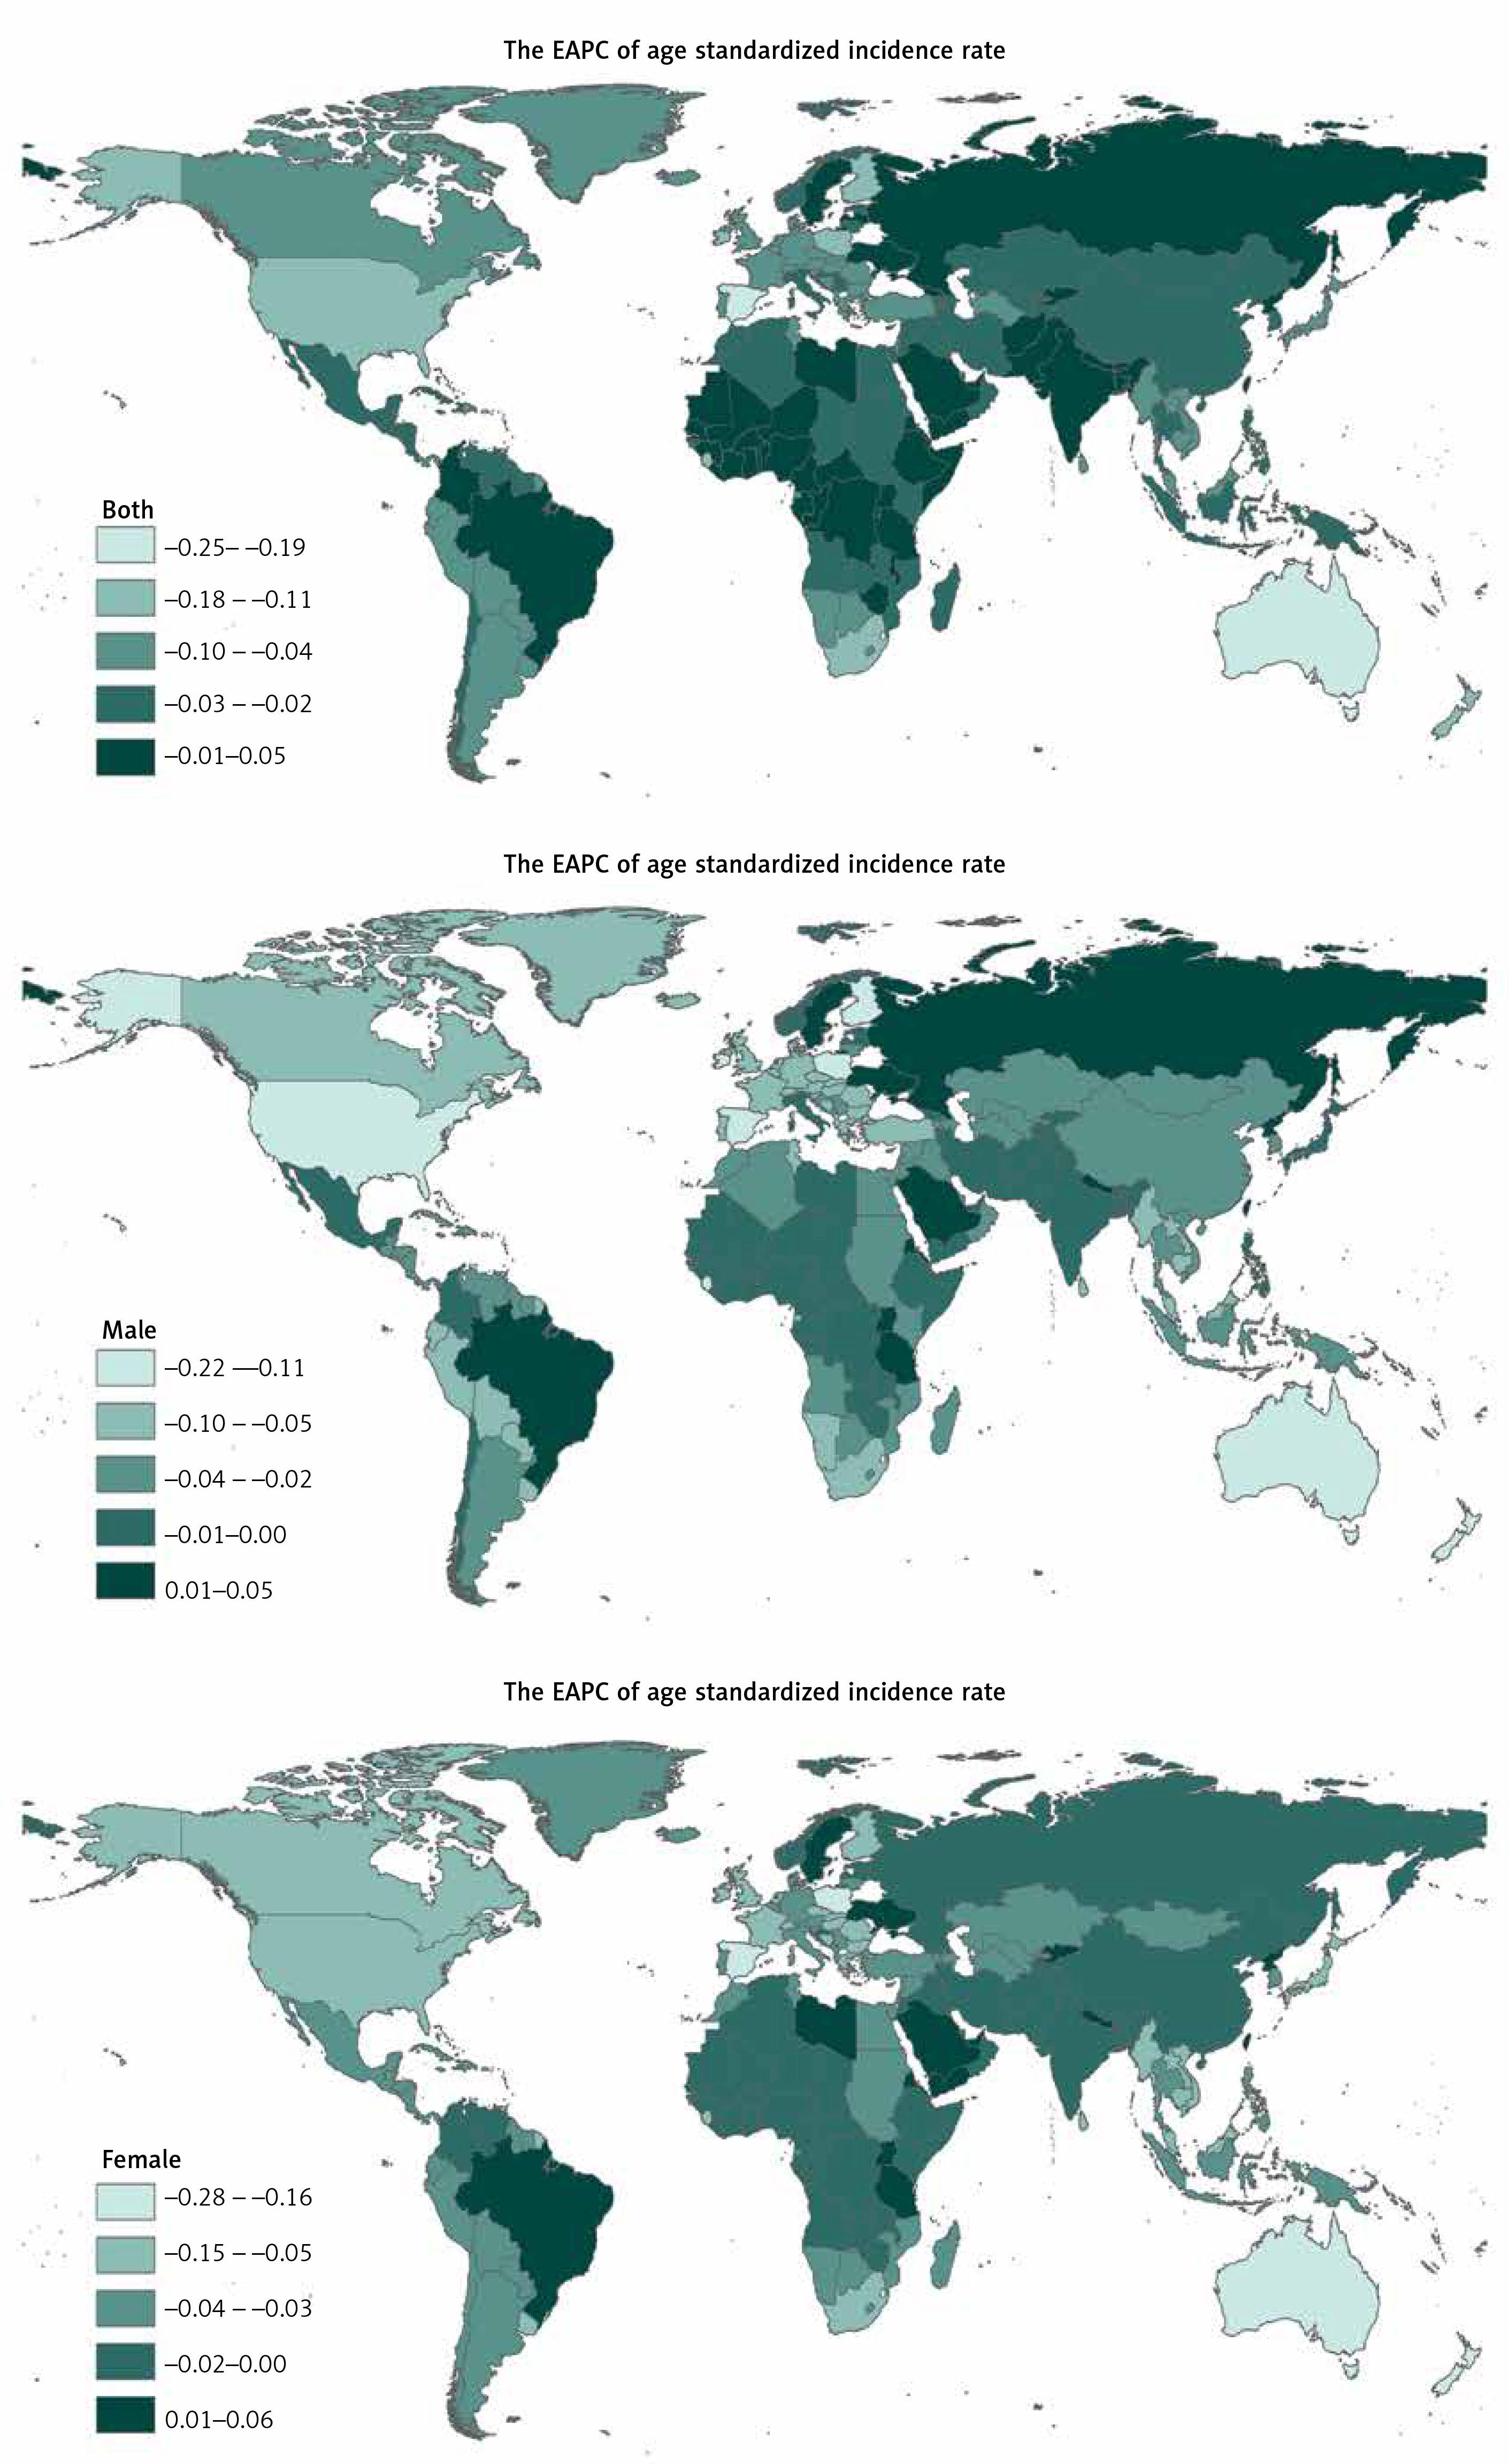
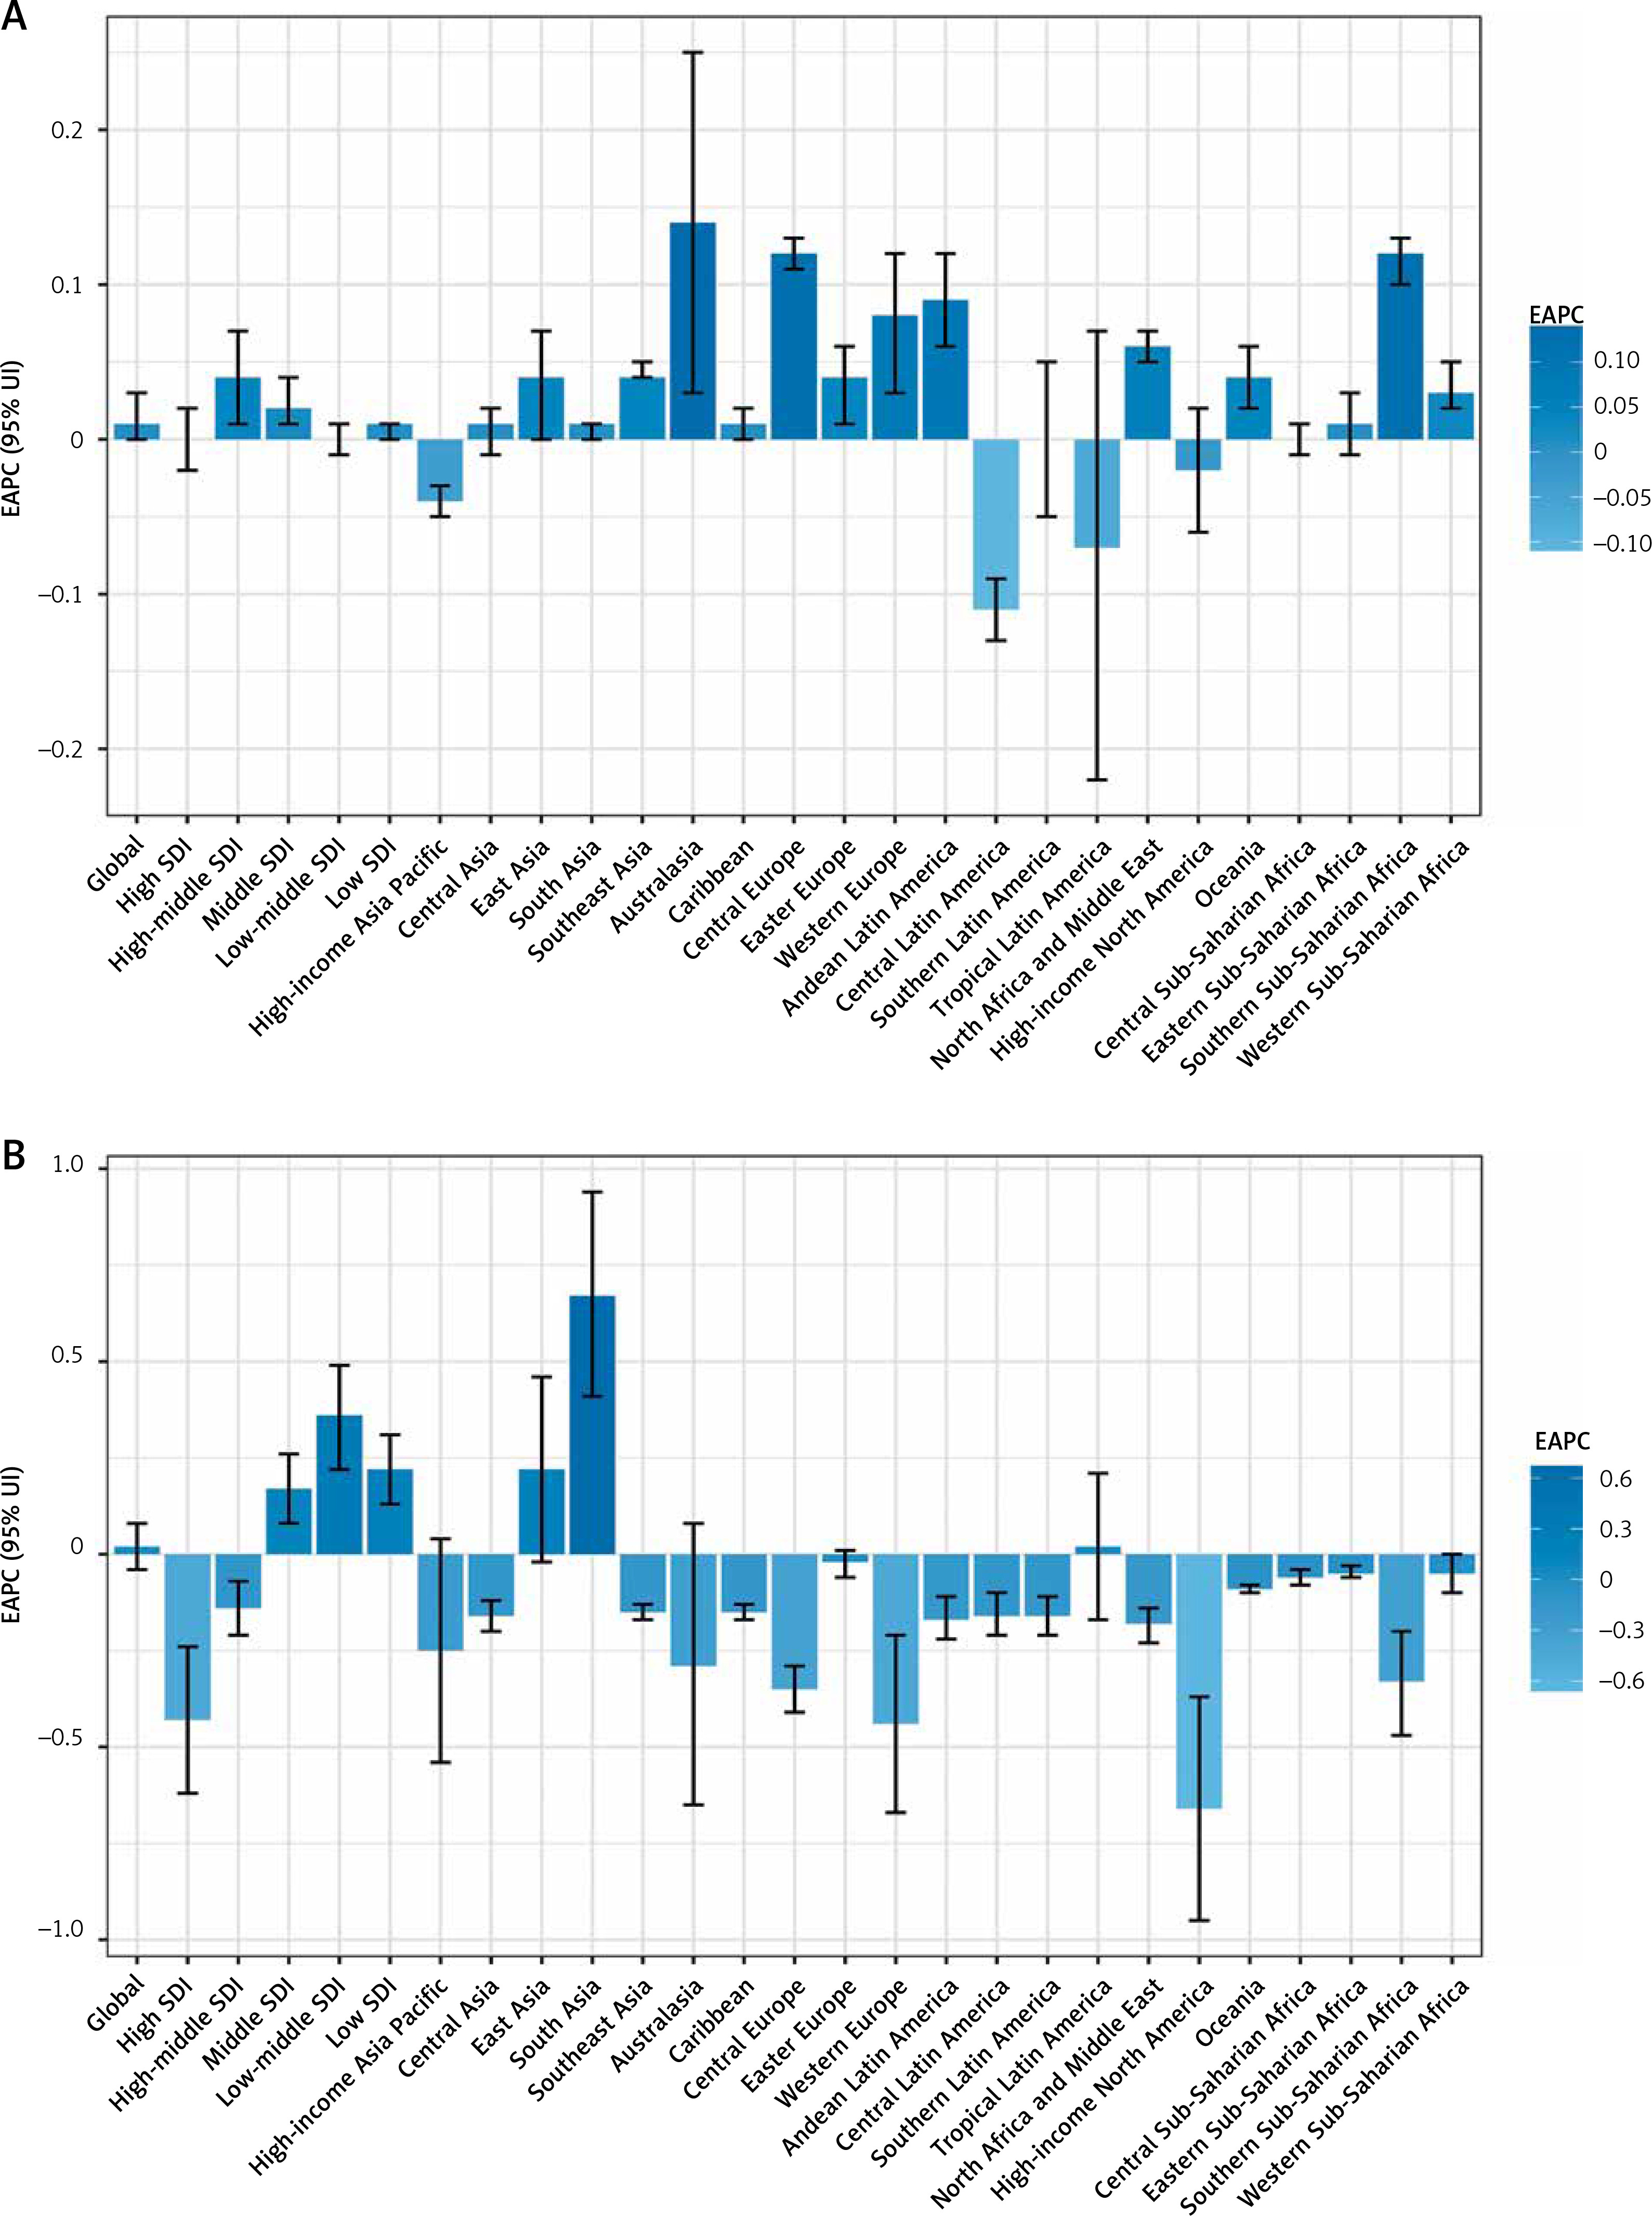
The 3 regions with the highest age-standardized DALY rate of oral disorders in 2019 were Andean Latin America (444), Tropical Latin America (407), and Central Asia (375; Table II, Supplementary Table SI), whereas those with the lowest age-standardized DALY rates were East Asia (234), high-income Asia Pacific (244), and Eastern Sub-Saharan Africa (249; Table II, Supplementary Table SI). The greatest increase in the age-standardized DALY rate was in South Asia (total: EAPC = 0.67; females: EAPC = 0.73; males: EAPC = 0.61), while the largest decrease was in high-income North America (total: EAPC = –0.66; females: EAPC = –0.59; males: EAPC = –0.73; Table II, Supplementary Table SI).
The highest age-standardized DALY rates of oral disorders were observed in high-middle-SDI regions in 1990 (303) but in middle-SDI regions in 2019 (285). The lowest age-standardized DALY rates were in low-middle-SDI regions (278) in 1990 and in high-SDI regions (275) in 2019 (Table II).
The EAPC in the age-standardized DALY rate of oral disorders was found to be positively correlated with the age-standardized DALY rate of oral disorders (ρ = 0.037, p = 0.599, Supplementary Figure S2 C) but negatively correlated with the SDI value of the region (ρ = –0.402, p = 0.001, Supplementary Figure S2 D). In 2019, low-SDI regions had the highest proportion of oral-disorder-related DALYs in young people (15–49 years old), and regions in which the SDI value increased from 1990 to 2019 had a higher proportion of DALYs in older adults than regions that showed no increase in the SDI value (Supplementary Figures S3 C and S3 D). The annual proportions of oral-disorder-related DALYs increased in young people but decreased from year to year in older adults (Supplementary Figure S4 B). The age distribution of DALYs (per 100,000) for colon and rectal cancer in different countries in 2019 are shown in Supplementary Table SVI and Supplementary Figures S5 and S6.
Discussion
We used the latest GBD data to analyse the incidence and DALYs of oral disorders by sex, age, and SDI value from 1990 to 2019. Our results showed that the age-standardized incidence of oral disorders experienced a slight increasing trend globally from 1990 to 2019, while the age-standardized DALY rate did not change significantly. This indicates that the loss of life due to non-lethal causes is the main reason for the burden of oral disorders, and that oral health has not significantly improved globally in the past 30 years. Oral disorders are chronic and progressive in nature. For example, dental caries (tooth decay) can affect very young children but is a lifelong disease that runs through adolescence and adulthood until old age [14]. Early screening and oral protection are necessary to prevent oral disorders. The changes in the age-standardized DALY rates for men and women were consistent with the changes in the general population. Moreover, the age-standardized incidence and DALY rates for 2019 were similar between men and women, indicating that there is no gender difference in the disease burden caused by oral disorders globally.
Oral disorders are currently one of the key chronic non communicable diseases to be prevented and treated. Because dental disease does not cause death, unlike for example cardiovascular and cerebrovascular diseases, cancer and diabetes, and its severity is far from being recognized [15], the task of prevention and treatment of dental disease is very difficult. The WHO lists oral disorders as the second largest disease besides cancer and cardiovascular disease, and disease prevention and treatment work has been given more and more attention by all countries [5, 6]. This indicates that the harm of oral disorders to human health has attracted attention, and the prevention and treatment of oral disorders is an important topic for future research.
The burden of oral disorders was found to be different in regions with different SDI values. In 2019, the highest age-standardized incidence rate occurred in middle-SDI regions, and the highest age-standardized DALY rate occurred in middle- and low-SDI regions. From 1990 to 2019, the age-standardized incidence rate of oral disorders did not change significantly in high-SDI countries, but the age-standardized DALY rate decreased. Meanwhile, the age-standardized incidence and DALY rates in low- and middle-SDI areas showed an increasing trend. Previous studies have shown that the patterns and trends of oral disorders in developing countries, underdeveloped countries, and developed countries reflect different risk profiles and differences in the establishment of preventive oral health care plans [16, 17]. The risk of oral disorders is related to environmental factors, unhealthy lifestyles (i.e., poor diet, nutrition, and oral hygiene, and the use of tobacco and alcohol), and the limited availability and accessibility of oral healthcare services. These factors have relatively low exposure rates in high-income regions [8]. In low- and middle-income countries, there is little emphasis on health promotion, early intervention provided outside traditional dental clinics, or upstream policy solutions for social determinants [18]. Therefore, it is necessary to improve our understanding of oral disorders and their associated risk factors, to strengthen self-management practices, and to formulate and implement evidence-based recommendations for cost-effective interventions (“best buy”) against oral disorders to address the serious inequality in oral health [12].
We found that the biggest increase in the burden of oral-disorder-related diseases between 1990 and 2019 occurred in South Asia, mainly due to the contribution of India. This is mainly due to a lack of equitable access to health maintenance resources, health service accessibility, and oral-health-related policies. For example, in India, due to limitations of medical insurance coverage, patients are usually required to pay out of pocket to receive treatment from public and private dentists, and health resources are scarce, and oral health departments have no separate budget allocation [19, 20]. Moreover, existing prevention interventions do not prioritize the most common oral disorders and risk factors (such as cavities and tobacco use), even though there is sufficient evidence for the public health benefits of such prioritization [21, 22]. Therefore, it is urgent to develop new population-based models to promote oral health according to national and regional characteristics.
Lip and oral cancer is a complex multifactorial disease, and a comprehensive estimation and comparison of the disease burden attributed to various controllable risk factors can help in the development of specific and effective disease prevention and control strategies. Research has shown that behaviour and bad habits, as well as environmental and biological factors, are closely related to the occurrence of lip and oral cancer, such as smoking, drinking alcohol, chewing betel nuts, etc. [23–25]. However, there have been no studies on the risk factors of lip and oral cancer attributed to disease burden analysis.
To the best of our knowledge, this is the first study to describe the latest data on the prevalence of oral disorders by sex, age, and SDI value at global, regional, and national levels, and to determine the trend in oral disorders. The advantage of this study is that we systematically analysed the latest GBD data to assess the incidence of oral disorders and associated DALYs in various regions of the world from 1990 to 2019.
Although our research was based on GBD 2019 data and methods, there are still some limitations. First, the accuracy and robustness of GBD estimations largely depend on the quality and quantity of the data used in the modelling, but the original data did not cover all countries and regions in the world. Second, due to the differences in data sources and estimation methods used in GBD studies, our estimates may be higher than those in other studies. Third, the diseases analysed in this study did not include oral cancer, congenital malformations (including maxillofacial cleft), or temporomandibular joint disorders.
In the past 30 years, global oral health has not improved significantly, the age-standardized incidence of oral disorders has shown a slight increasing trend, and the age-standardized DALY rate has not changed significantly. The global distribution and trends in oral disorders are similar between genders, but there are differences at different SDI, regional, and national levels. It is necessary to control the increase in the incidence and disease burden of oral disorders in low- and medium-SDI regions, especially in South Asia.