Introduction
Aortic dissection (AD) is a critical cardiovascular system disease caused by blood in the aortic cavity penetrating into the middle layer of the aortic wall through the intimal rift and extending along the long axis of the aorta. The cause of AD is mainly related to hypertension [1]. In addition, genetics is also a very important factor. Current research shows that congenital genetic diseases such as Marfan syndrome, Eller-Danlow syndrome, Loeys-Dietz syndrome, and bicuspid aortic valve (BAV) can affect the growth of connective tissue, resulting in aortic dissection, especially Stanford type A aortic dissection [2, 3]. Epidemiological studies show that approximately 3–4 cases per 100,000 people develop acute aortic dissection every year [4]. Currently, the main treatment methods include drug therapy, intracavitary isolation therapy, classic surgery, and hybrid surgery, but morbidity and mortality are still high [5]. A possible molecular mechanism of AD is an imbalance in extracellular matrix (ECM) protein turnover and depletion of vascular smooth muscle cells (VSMCs) [6–8]. However, research on the molecular mechanism of AD is still limited.
Long noncoding RNA (lncRNA) refers to a class of RNA molecules longer than 200 nt that are widely present in the nucleus and cytoplasm of eukaryotic cells [9]. LncRNAs do not encode proteins but can be involved in many physiological and pathological processes through various mechanisms [10–13]. MicroRNA (miRNA) is a type of noncoding endogenous small-molecule single-stranded RNA with a length of 22 nt [14]. MiRNAs suppress the expression of target genes by partially complementing the miRNA response elements (MREs) in mRNA, and they participate in a series of important biological processes, including cell development, proliferation, apoptosis, death, differentiation, and fat metabolism [15]. In AD, miRNAs can further affect the homeostasis of arterial smooth muscle and ECM by affecting the synthesis of signalling pathway molecules and related substances in cells, thereby affecting the function and structure of the aorta [16–18]. The competitive endogenous RNA (ceRNA) hypothesis proposes that lncRNAs cannot only directly regulate the expression of target genes but may also affect the number of miRNA molecules by binding to the core seed sequences of miRNAs and further affecting the levels of target mRNAs [19]. ceRNAs are widely involved in important biological activity regulatory processes, such as inflammation, apoptosis, and differentiation [20–22].
Numerous studies have shown that this regulatory mechanism is also active in many cardiovascular diseases, such as myocardial hypertrophy, myocardial infarction, atherosclerosis, and atrial fibrillation [23–26]. Currently, however, research on the role and mechanism of ceRNA in AD is still lacking. The purpose of this study is to use bioinformatics methods to construct and analyse the lncRNA-miRNA-mRNA ceRNA network in AD by reanalysing the gene expression profile of GSE52093 [27]. These results may provide useful information regarding the diagnosis of, and potential therapeutic targets for, AD.
Material and methods
Microarray data
Gene expression profiles of GSE52093 were obtained from the Gene Expression Omnibus (GEO) database (http://www.ncbi.nlm.nih.gov/geo/). GSE52093 is publicly available and can be downloaded free of charge with confirmation that all relevant informed consent has been obtained. This dataset includes five normal ascending aorta samples and seven Stanford type A aortic dissection aorta samples. All the samples were analysed using an Illumina HumanHT-12 v4.0 Expression BeadChip (USA).
Identification of differentially expressed mRNAs (DEmRNAs) and lncRNAs (DElncRNAs)
Raw data were obtained from the GEO database and preprocessed by log2 transformation. Then, the data were normalised by the limma package [28] in R statistical software. Linear models and the empirical Bayes method (limma) were used to analyse and identify DElncRNAs and DEmRNAs between the normal samples and AD samples from the GEO database. The Benjamini and Hochberg method was applied to correct the p-value to the false discovery rate (FDR), and the cut-off criteria were |logFC| > 1 and FDR < 0.05. In addition, mRNA and lncRNA annotation was performed using the Encyclopedia of DNA Elements (ENCODE) with ENSEMBL.
GO and KEGG pathway analysis
We used the DAVID (https://david.ncifcrf.gov/) online database for GO enrichment analysis of DEmRNAs, which included biological processes (BPs), cellular components (CCs), and molecular functions (MFs). The KOBAS online database (http://kobas.cbi.pku.edu.cn/) was used for KEGG pathway enrichment analysis. Records with an adjusted p-value < 0.05 and enrichment > 2.0 were considered to have statistical significance. The R package “ggplot2” (version 3.3.0) was used for visualisation.
Construction of the ceRNA and PPI networks
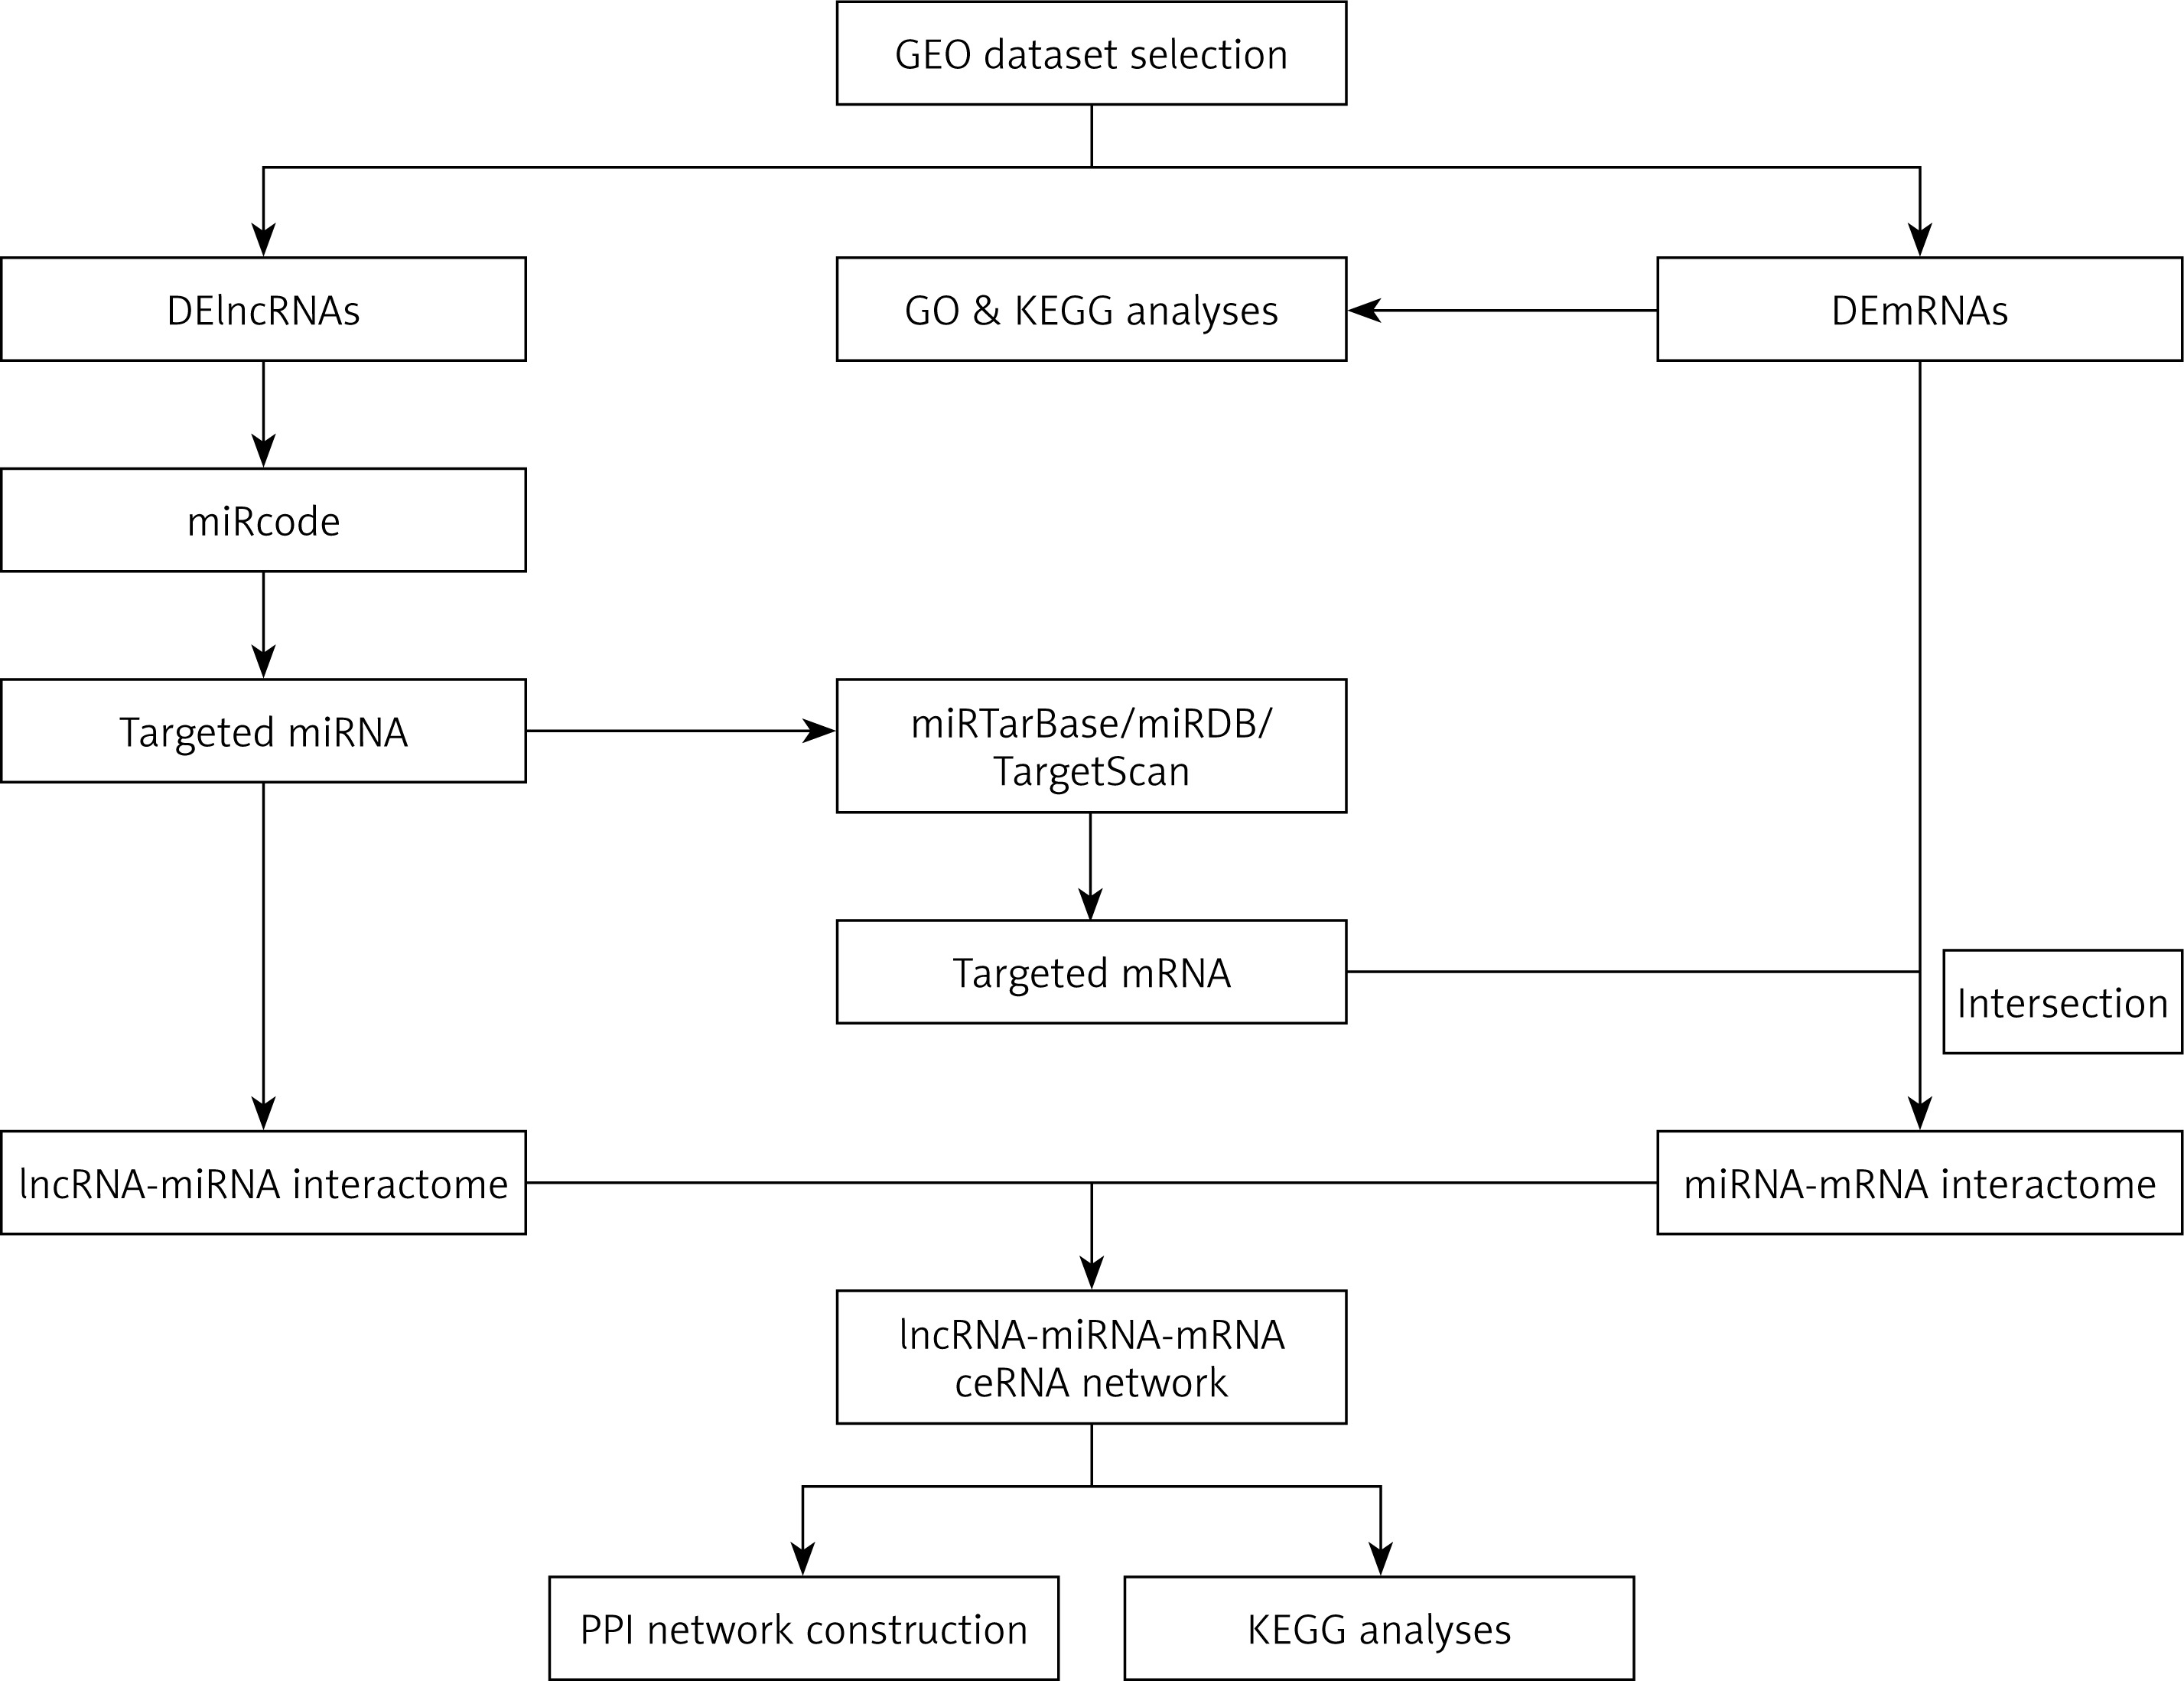
The flowchart of ceRNA network construction is shown in Figure 1. First, the miRcode database (www.mircode.org/) was used to predict the lncRNA-miRNA interactome. Second, miRTarBase, miRDB, and TargetScan were used to predict the miRNA-mRNA interactome. The target mRNAs and DEmRNAs were then intersected. Finally, the ceRNA network was constructed by combining the lncRNA-miRNA interactions and miRNA-mRNA interactions, and visualised by Cytoscape v3.6.1. In addition, a protein-protein interaction (PPI) network of DEmRNAs in the ceRNA network was constructed using the Search Tool for the Retrieval of Interacting Genes (STRING). The parameter of interactive relationships was set up with high confidence > 0.700.
Statistical analysis
Numerical data were expressed as the mean ± standard deviation (SD) of at least three measurements. Statistical comparisons between groups of normalised data were performed using the t-test or Mann-Whitney U-test according to the test condition. A p-value < 0.05 was considered statistically significant with a 95% confidence level.
Results
Identification of DEmRNAs and DElncRNAs in AD
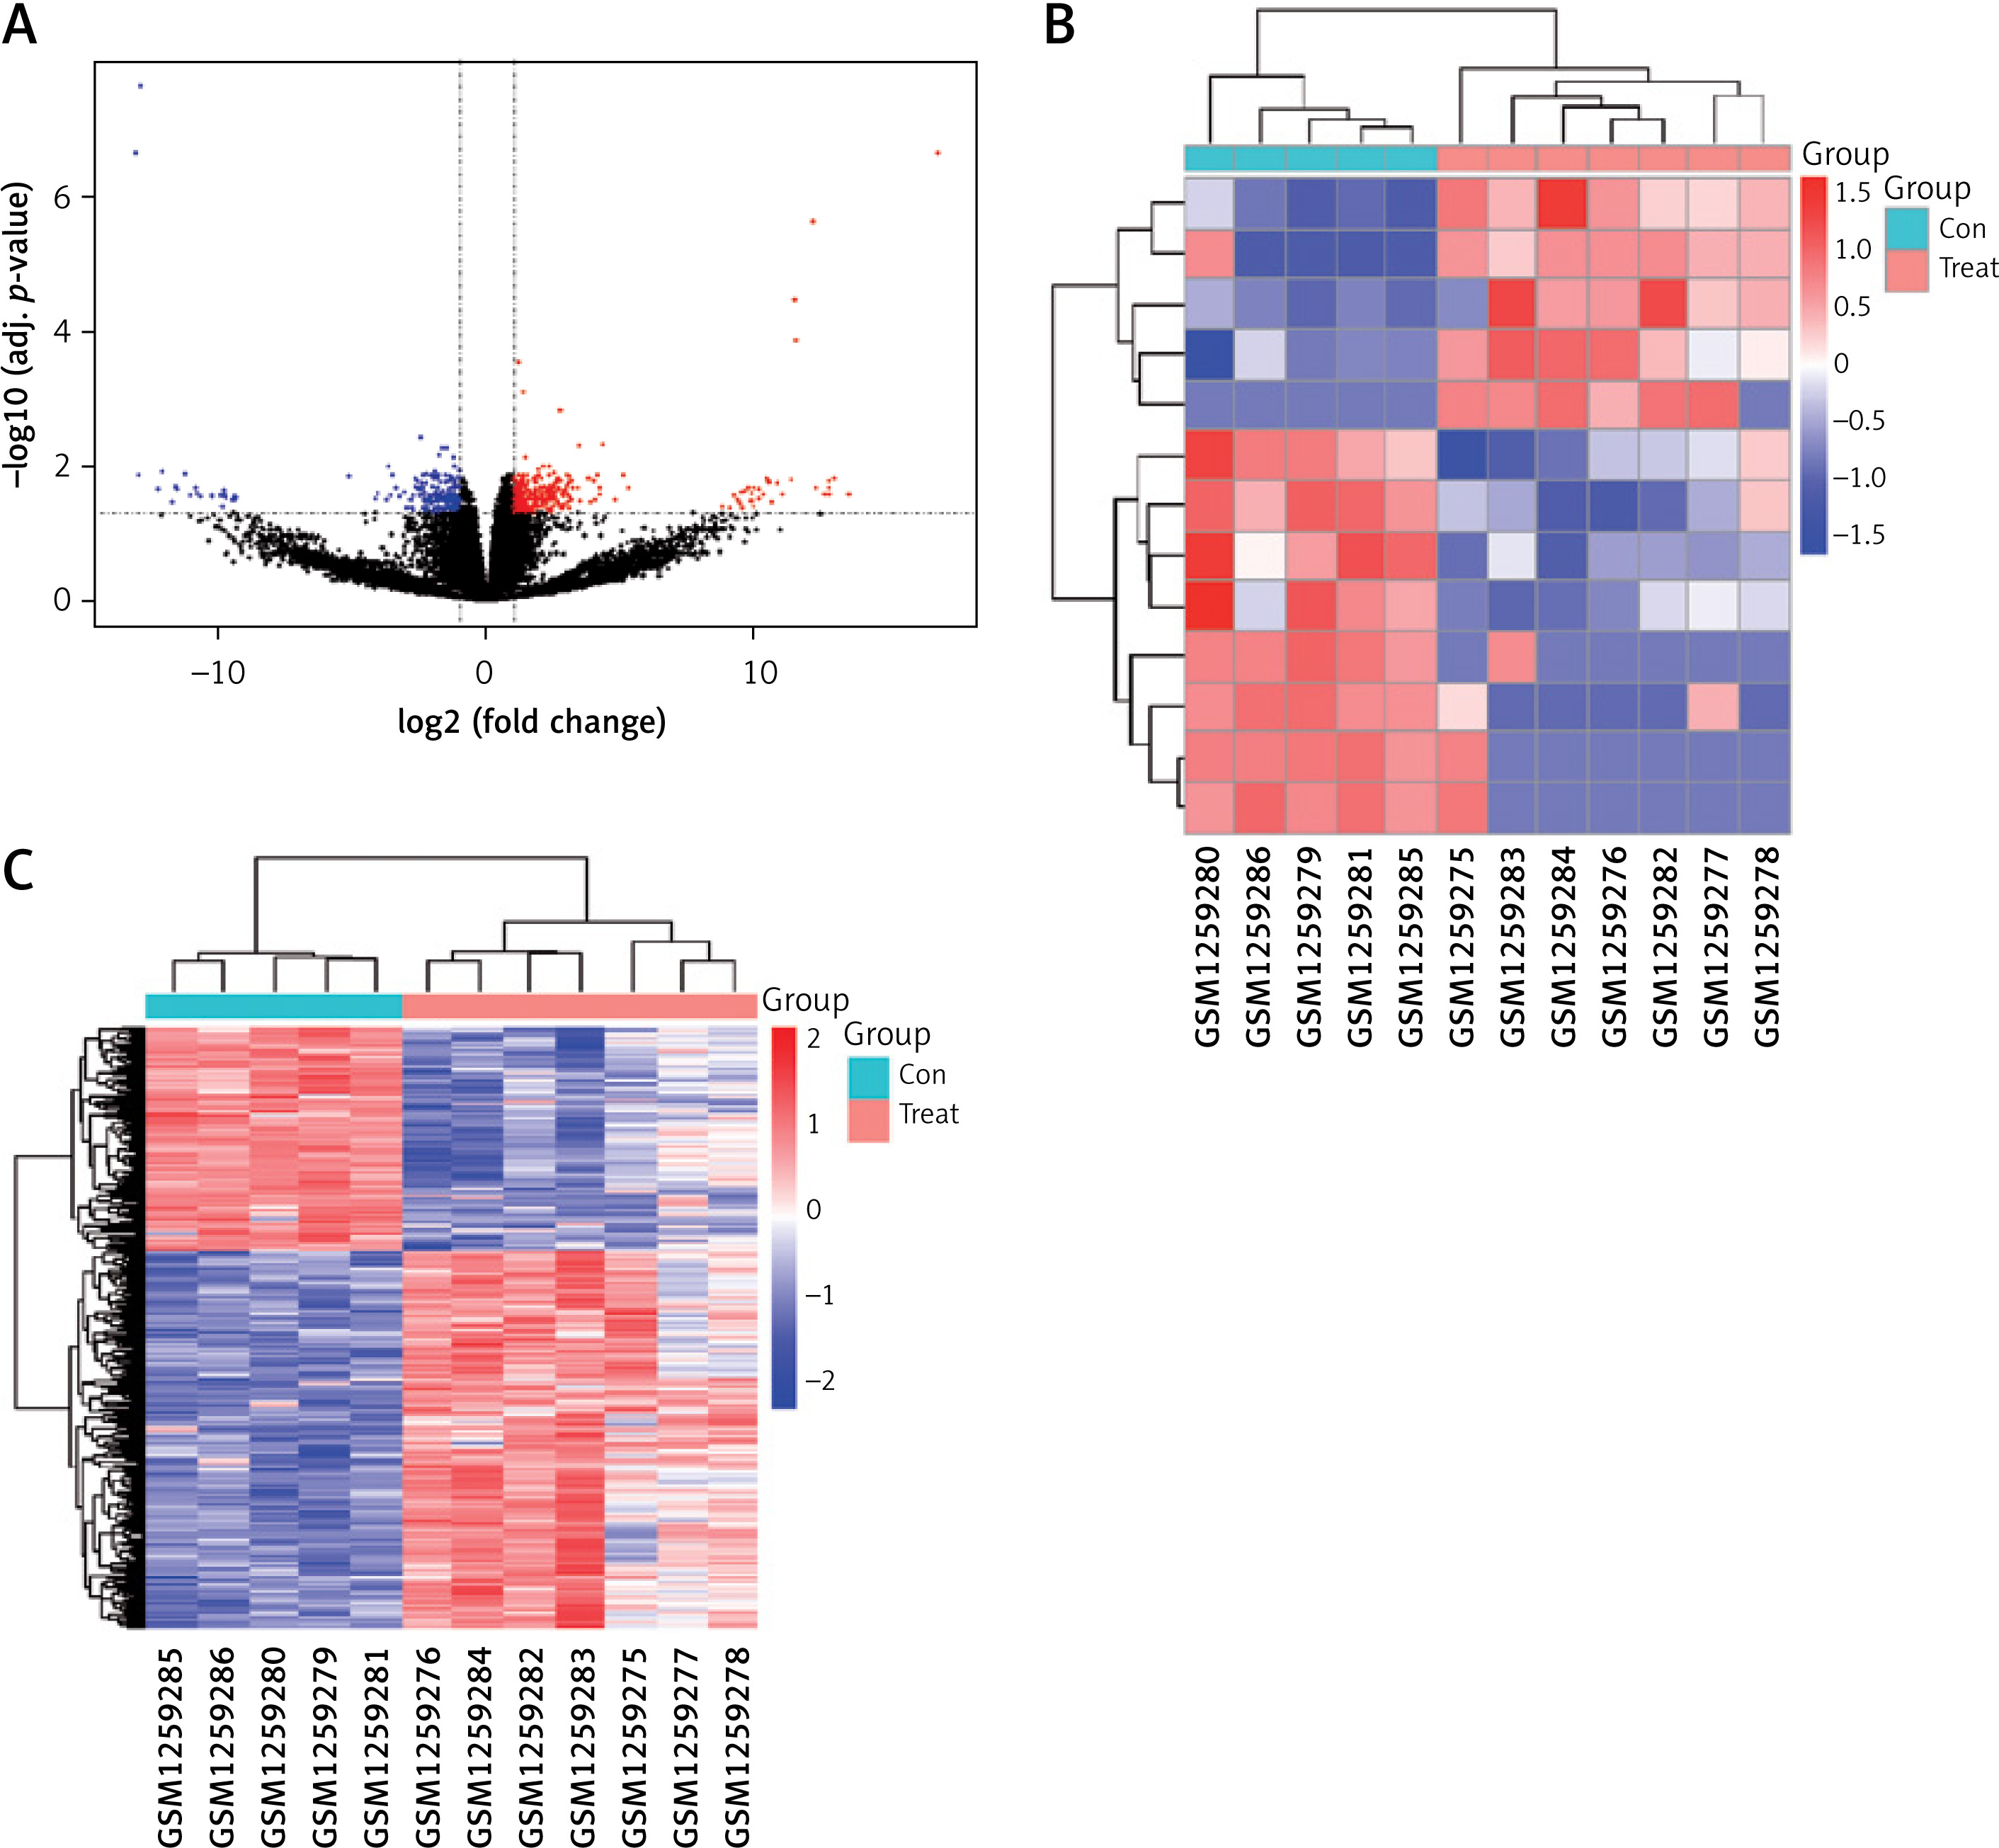
Based on the cut-off criteria of |logFC| < 1 and FDR < 0.05, we found 485 differentially expressed genes between the AD and normal aortic samples, as shown in the volcano map in Figure 2 A. We identified 13 DElncRNAs, five of which were upregulated, while eight were downregulated (Table I). In addition, 472 mRNAs were identified as differentially expressed, 296 of which were upregulated, while 176 were downregulated. The heatmaps of DElncRNAs and DEmRNAs are shown in Figures 2 B and C, respectively.
Table I
Dysregulated lncRNAs between normal controls and aortic dissection patients
| lncRNA | Expression change | LogFC(AD/N) | Adj. p-value |
|---|---|---|---|
| AATBC | Upregulation | 9.25238493 | 0.028727158 |
| C15orf32* | Upregulation | 9.10185404 | 0.042884568 |
| FBXL19-AS1* | Upregulation | 1.588913174 | 0.017449507 |
| CHEK2P2* | Upregulation | 1.394313623 | 0.028336018 |
| LINC00467* | Upregulation | 1.110905614 | 0.044152098 |
| NUP210P1* | Downregulation | –1.394044025 | 0.041875981 |
| LINC01252 | Downregulation | –1.814109151 | 0.041887661 |
| CARMN | Downregulation | –1.845765285 | 0.02165766 |
| UCA1* | Downregulation | –2.424119434 | 0.018942266 |
| RGPD4-AS1 | Downregulation | –9.503621401 | 0.032708119 |
| SMG1P5 | Downregulation | –9.79031617 | 0.027508735 |
| INGX* | Downregulation | –9.854377146 | 0.023345615 |
| LINC01114 | Downregulation | –10.78663878 | 0.025996043 |
Figure 2
Differentially expressed genes between AD patients and normal controls. A – The volcano plot of the differentially expressed genes. The X-axis is –log10 (adjusted p-value), while the Y-axis is log-2FC. Black dots indicate non-differently expressed genes. The red dots indicate upregulated genes, while the blue dots indicate downregulated genes. B – Heatmap of differentially expressed lncRNAs. C – Heatmap of differentially expressed mRNAs. B, C – The X-axis is the sample serial number, and the Y-axis is the differentially expressed genes. Red blocks represent upregulation, and green blocks represent downregulation
Enrichment analysis of DEmRNAs in AD
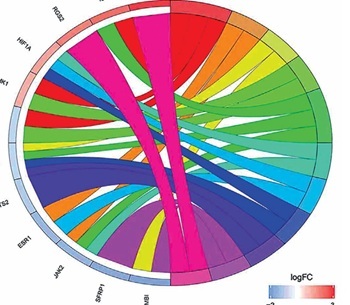
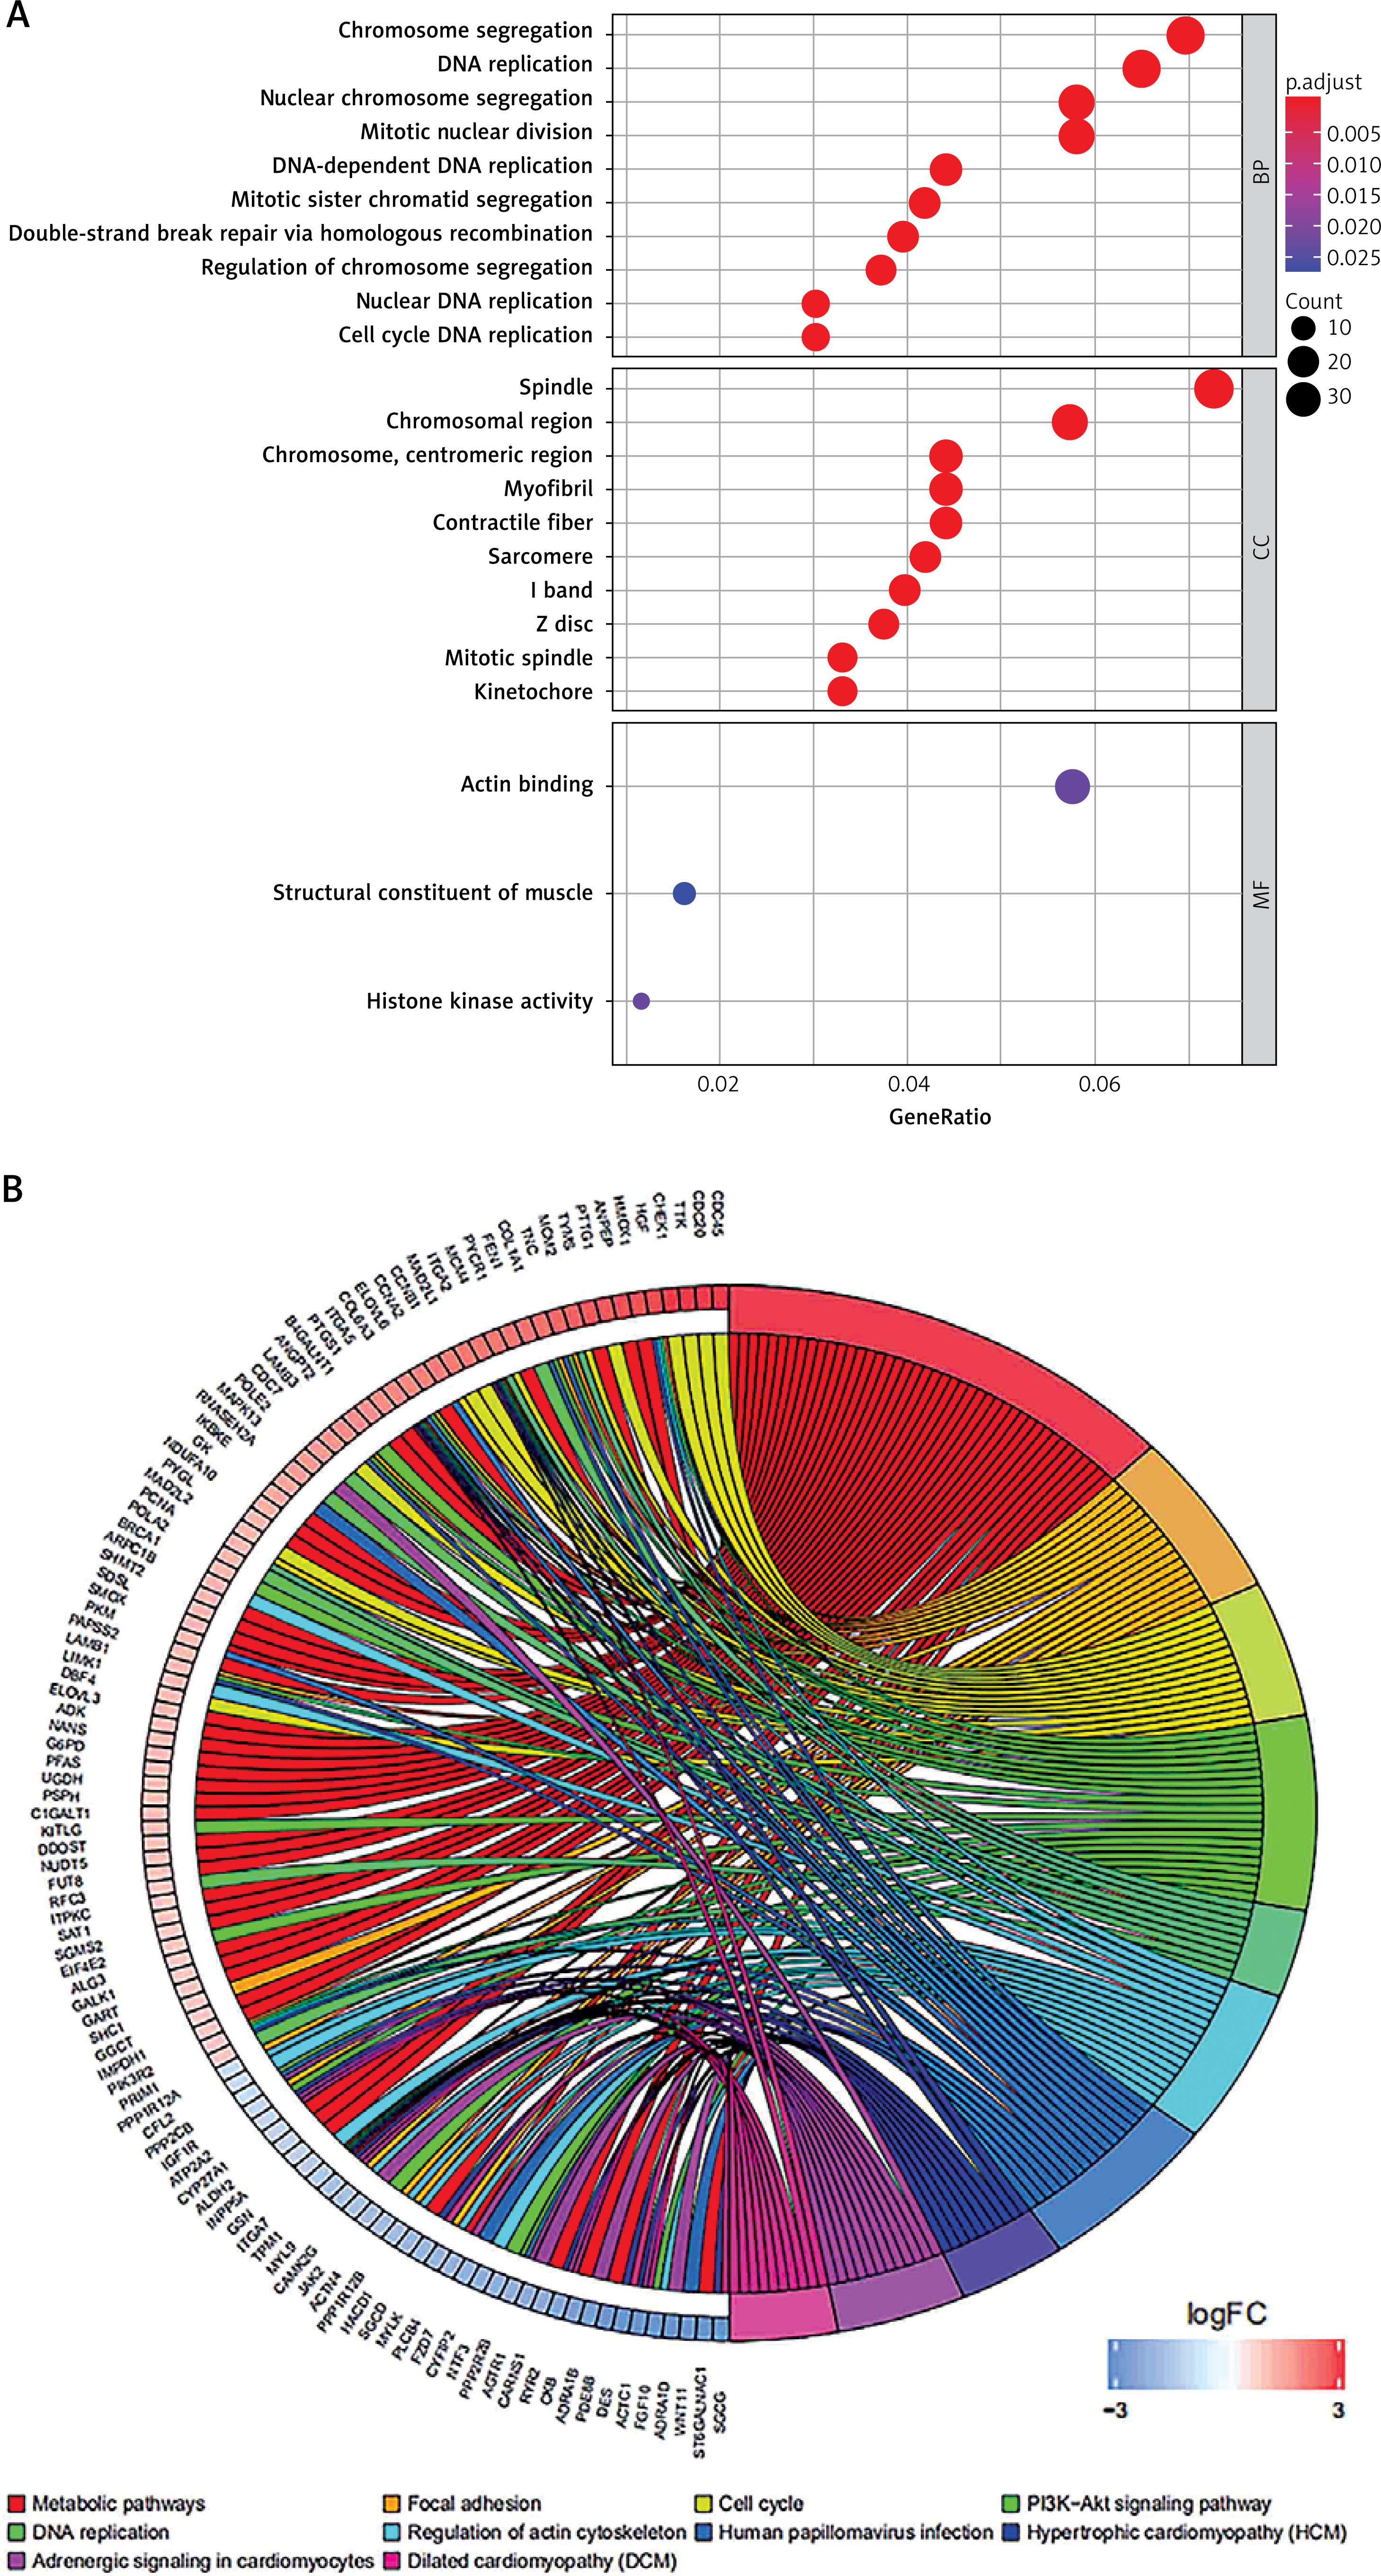
To further explore the biological functions of the 472 DEmRNAs in AD, we performed GO and KEGG enrichment analyses. The results show that the top enriched GO terms for BPs were chromosome segregation, DNA replication, nuclear chromosome segregation, mitotic nuclear division, and DNA-dependent DNA replication. The most enriched CCs were spindle, chromosomal region, chromosome, centromeric region, myofibril, and contractile fibre. Finally, the most enriched MFs were actin binding, structural constituent of muscle, and histone kinase activity (Figure 3 A). The KEGG enrichment analysis revealed that the DEmRNAs were significantly enriched in the following pathways: metabolic pathways, focal adhesion, cell cycle, PI3K-Akt signalling pathway, DNA replication, and regulation of actin cytoskeleton (Figure 3 B).
Construction of the ceRNA and PPI networks in AD
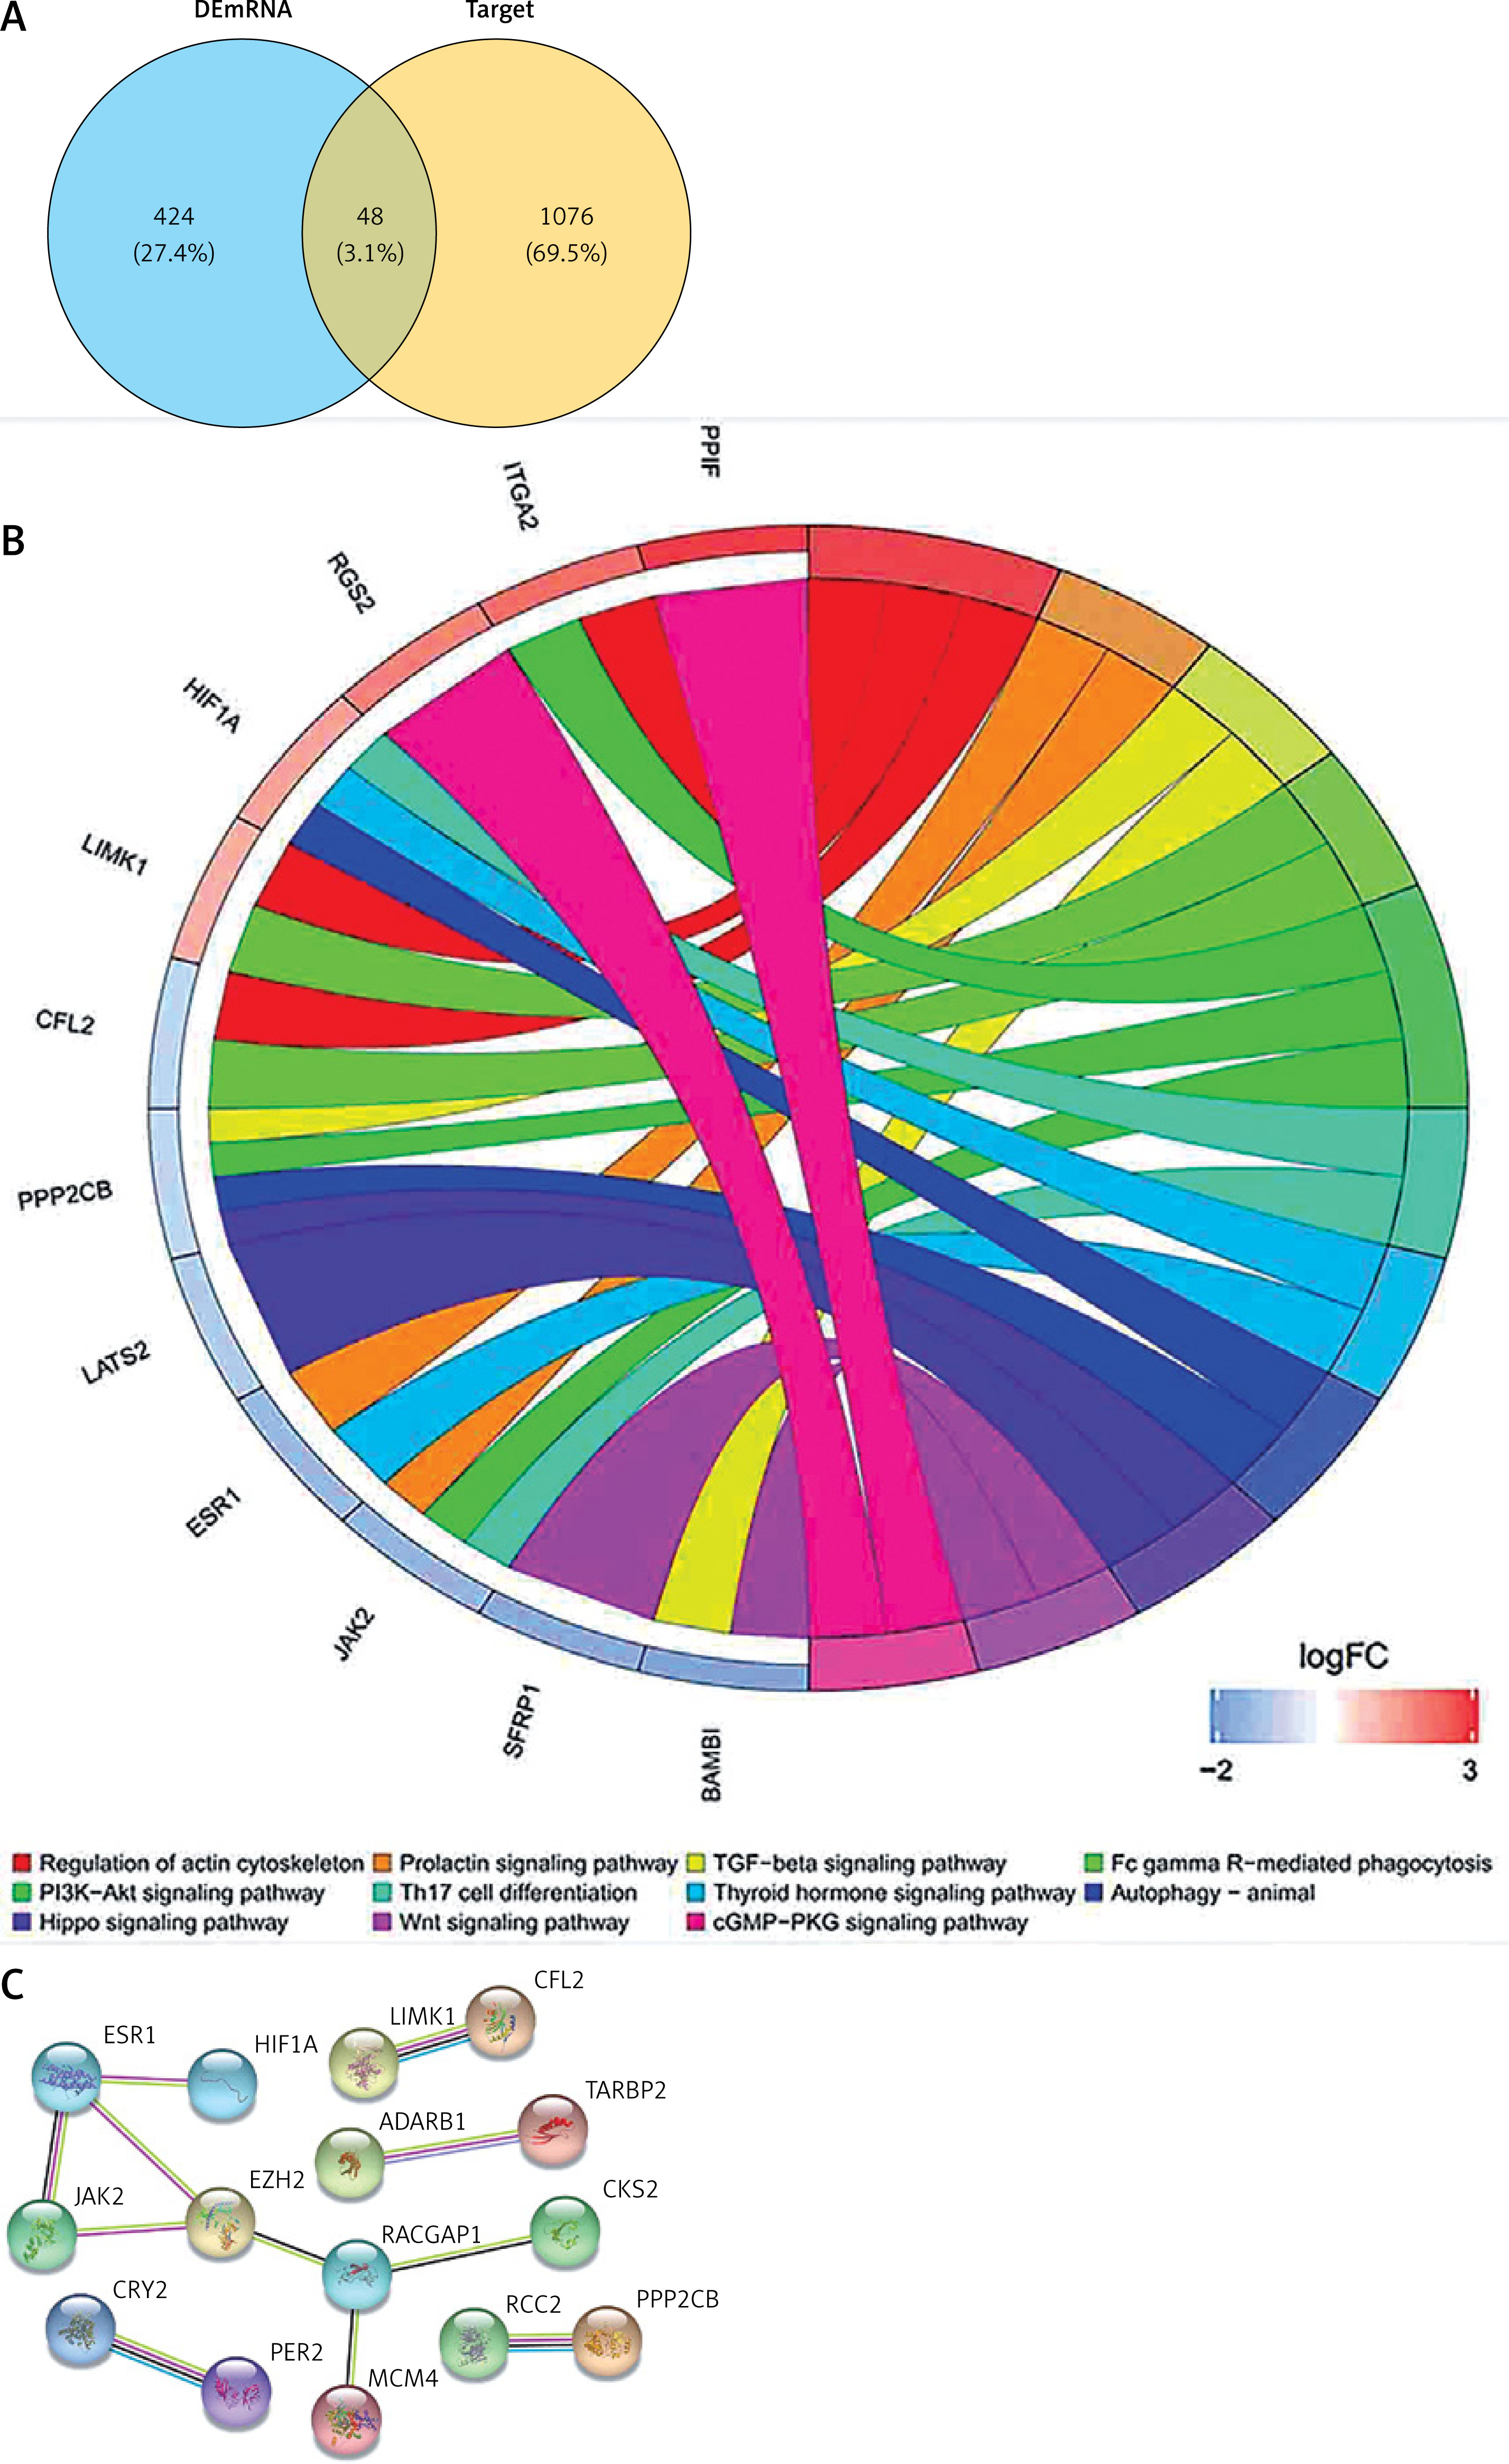
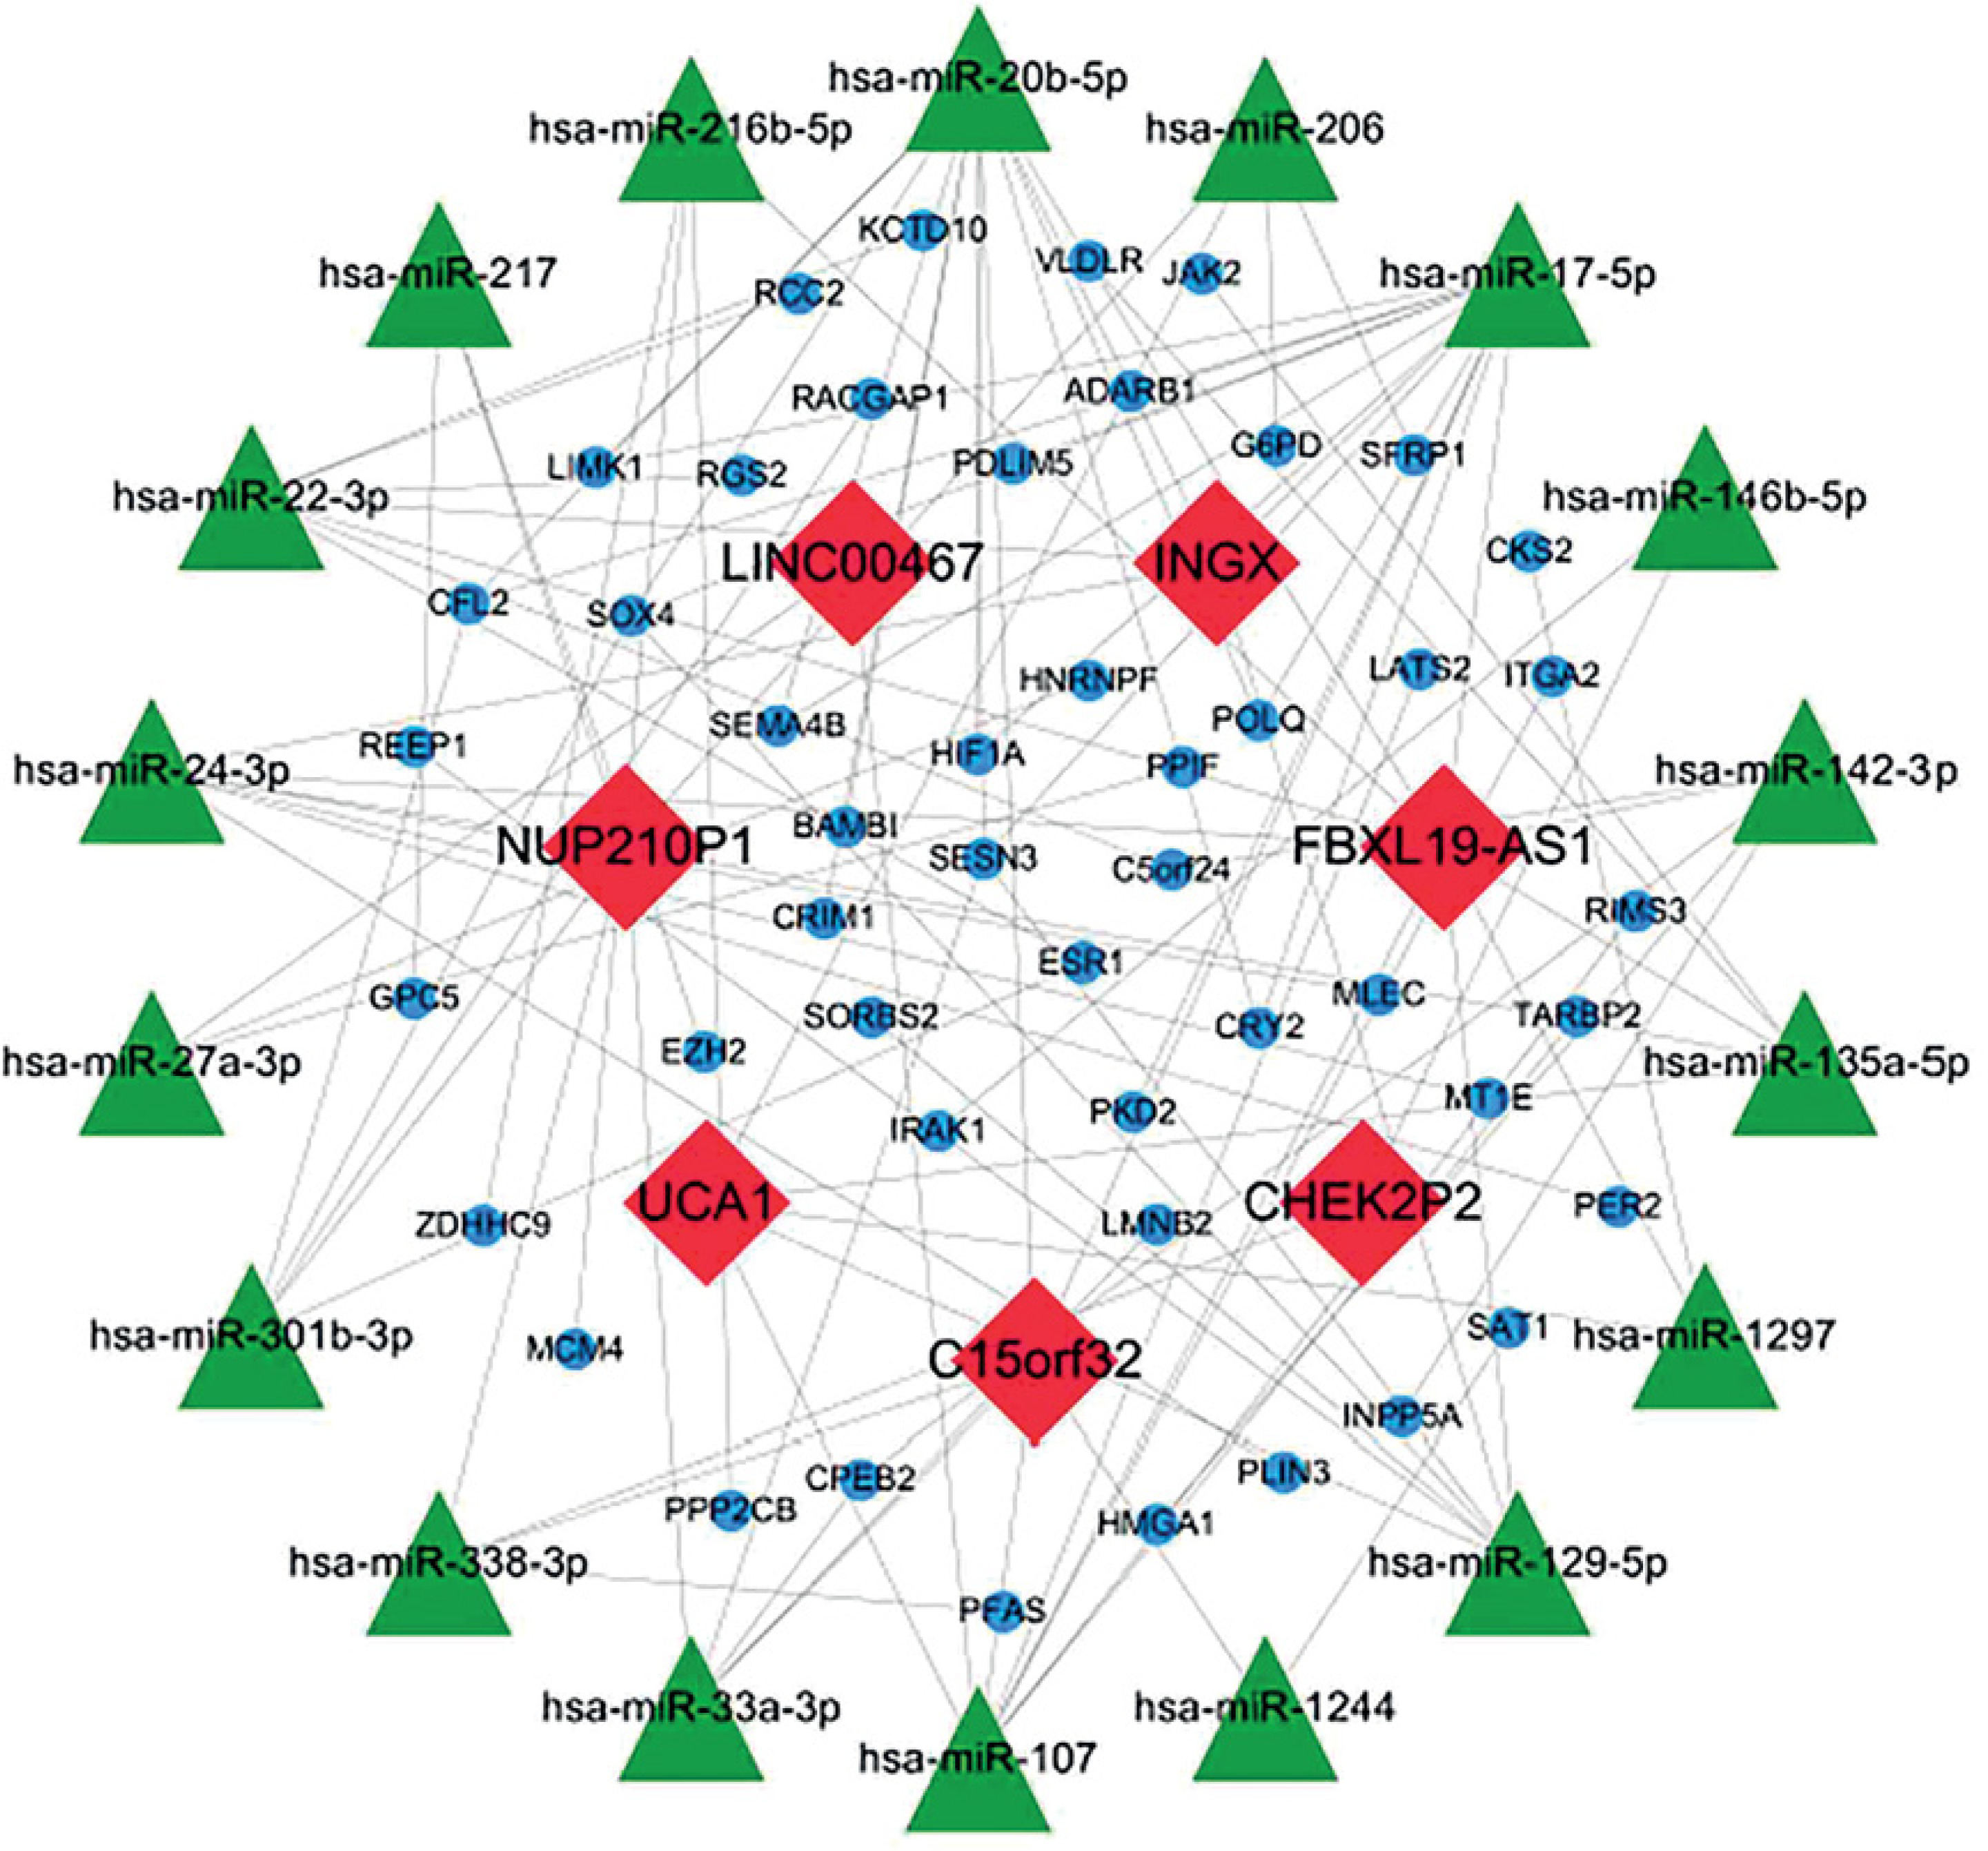
To further understand how lncRNAs regulate mRNA expression by binding to miRNAs in AD, a ceRNA network was constructed. Eighteen miRNAs were predicted to interact with seven DElncRNAs by using the miRcode database (Table II). A total of 1124 miRNA-targeted mRNAs based on the 18 miRNAs were predicted through the miRDB, miRTarBase, and TargetScan databases. We selected 48 mRNAs among the 472 DEmRNAs that were identified as miRNA targets of mRNAs (Figure 4 A, Table III). Finally, the ceRNA network was constructed based on the seven lncRNAs, 18 miRNAs, and 48 mRNAs and visualised by using Cytoscape v3.6.1 (Figure 5). In addition, most KEGG pathways enriched for DEmRNAs in the ceRNA network were associated with regulation of the actin cytoskeleton, the prolactin signalling pathway, the TGF-β signalling pathway, FcγR-mediated phagocytosis, and the PI3K-Akt signalling pathway (Figure 4 B). The PPI network constructed for the 48 mRNAs provided 15 genes with a high confidence of 0.700 (Figure 4 C).
Table II
lncRNAs and specific targeted miRNAs in the ceRNA network
Table III
miRNAs and specific targeted mRNAs in the ceRNA network
Discussion
AD is caused by a variety of factors inflicting damage on the aortic intima, and then blood flows into the aortic intima and tears the media, thereby forming an intravascular pseudocavity, which can cause aorta rupture and seriously threaten the lives of patients. Treatment options are limited [1]. In-depth research on the pathogenesis of AD can help us to further develop screening tools, identify different risk categories, and discover potential therapeutic targets, which is of great clinical significance. A previous study detected the expression profiles of seven AD samples and five normal samples in GSE52093 but focused mainly on a subset of DEmRNAs [29, 30]. In this study, we focused not only on DEmRNAs but also DElncRNAs. At the same time, we constructed a ceRNA network and conducted a comprehensive bioinformatics analysis of DEmRNAs and DElncRNAs in the ceRNA network by reanalysing the published microarray data of GSE52093.
In our study, we found 472 DEmRNAs in AD samples compared to normal samples. The results of the GO pathway analysis for BPs showed that DEmRNAs are related to chromosome segregation and DNA replication, which in turn are associated with the characteristics of cells. Previous studies have shown that chromosome segregation is related to the development of aortic dissection [31], which is consistent with the results of our GO analysis. These results show that the physiological process of arterial wall cells play a key role in maintaining the stability of the aorta and warrants further exploration. In addition to vascular smooth muscle contraction and ECM-receptor interactions, which have been reported as two potential pathways in AD [6–8, 30], the KEGG results show that AD is also associated with metabolic pathways and regulation of the actin cytoskeleton. Studies have found that metabolite products related to the choline metabolic pathway are differentially expressed in AD and can be used as biomarkers for the diagnosis of AD and evaluations of therapeutic effects [32]. Studies show that regulation of the actin cytoskeleton can affect VSMC migration by regulating the migration process [33]. Therefore, we believe that metabolic pathways and regulation of the actin cytoskeleton may play important roles in AD and are worth studying. In addition, we found that MCM4 as a DEmRNA is not only a hub gene in AD, according to a previous study [29], but also contributed to the construction of the ceRNA network in this study, indicating that MCM4 may play an important role in AD. MCM4 is a member of the MCM family, which is essential for initiating replication of eukaryotic genomes and may be involved in the repair of DNA double-strand breaks, the formation of replication forks, and the assembly of other replication-related proteins [34]. Research shows that MCM4 is involved in the proliferation of multiple tumours, suggesting that MCM4 is an important indicator of cell proliferation and warrants further study [35, 36].
A total of 18 miRNAs were predicted to interact with the seven lncRNAs in the ceRNA network of AD in our study. Among them, hsa-miR-17-5p, hsa-miR-20b-5p, and hsa-miR-22-3p interrelated with five or more protein-coding genes, which may play more important roles in the ceRNA network. These aberrantly expressed miRNAs are also involved in the pathological processes of other diseases. For example, studies have shown that hsa-miR-17-5p promotes apoptosis induced by oxidative stress by targeting Stat3, hsa-miR-20b-5p has been observed to promote lung cancer cell proliferation and migration by targeting BTG3, and hsa-miR-22-3p was reported to inhibit the proliferation and migration of arterial smooth muscle cells by targeting HMGB1 in arteriosclerosis obliterans [37–39]. However, the specific mechanisms of these miRNAs in AD have rarely been studied.
In the ceRNA network, lncRNAs can regulate mRNA expression through competitive binding with miRNAs, thereby participating in the regulation of cell biology. We found 18 DElncRNAs in AD, seven of which participated in the ceRNA network. C15orf32 was the most upregulated lncRNA in the ceRNA network, indicating that C15orf32 plays an important role in AD. Few studies on C15orf32 are available to date. According to limited studies, C15orf32 is a neurodevelopment-related gene and is thought to be related to Alzheimer’s disease [40]. In addition, another notable lncRNA in the ceRNA network was FBXL19-AS1, which interacted with as many as 10 miRNAs. FBXL19-AS1 is an oncogene that can promote cancer cell proliferation and metastasis in breast cancer and lung cancer [41, 42]. Studies have found that lncRNAs are not only associated with human cancers but can also affect the proliferation of VSMCs [43–46]. Therefore, we speculate that FBXL19-AS1 may also have this function, and jointly with regulation of the actin cytoskeleton affect the biological processes of VSMCs and thus participate in the formation of AD. However, research on the function of lncRNA as a miRNA sponge in AD is still lacking.
Some limitations of this study must be acknowledged. First, the sample size in this study was not large. Second, the samples were almost all from males (only one AD sample was from a female), which may introduce a gender bias. Third, the genotype and phenotype data of patients was lacking in the study. Last, the bioinformatics analysis in our study is just the first step. Therefore, it is necessary for us to validate the findings by collecting more clinical samples and conducting more in-depth experiments in the future.
In conclusion, we identified 13 DElncRNAs and 472 DEmRNAs in AD and constructed a lncRNA-miRNA-mRNA ceRNA network for the first time. These findings may provide new insights into the pathogenesis of AD and a novel perspective for further developing screening tools, identifying different risk categories, and discovering potential therapeutic targets for AD.