Ischemic stroke (IS) is a common neurological disease and its onset is about 7.6 million every year [1]. A series of studies indicate that metal toxic is involved in stroke [2]. Plasma copper together with other metals are risk factors for the ischemic stroke, while selenium (one of the anti-oxidants) is a protective factor in the hemorrhagic stroke [3]. Patients with higher blood copper have an OR at 1.29 (95% CI: 1.13–1.46), indicating copper is a risk factor for IS [4]. A recent in-vivo study showed that rats with oral CuSO4 demonstrated excitotoxicity and neuronal death [5]. A novel cell death form, named cuproptosis has been identified recently, and the elevated mitochondrial copper level is able to cause the cell death [6].
We have recently proposed a risk model for clinical outcome prediction in IS patients with intravenous thrombolysis and found identified both hypertension and dyslipidemia are risk factors for poor neurological outcome [7]. However, its exact role in stroke is not clear, which needs to be further investigated. Therefore, we intended to investigate the relationship between immune cells and cuproptosis-related genes in this study with CIBERSORT, and weighted gene co-expression network analysis (WGCNA) to locate the hub modules.
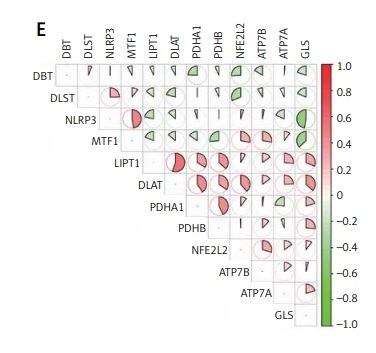
Results. Data Processing and CuDEGs identifying. PCA analysis showed a mixture distribution of samples between two GSE datasets (Figure 1 A). The cuproptosis-related gene list was summarized from the literature review and shown in Supplementary Table SI [8]. With a criterion of adjusted p-value < 0.05, a total of 12 cuproptosis-related genes were considered as CuDEGs, of which five genes were upregulated and seven genes were downregulated. The heatmap and circos plot of CuDEGs and their chromosome location are displayed in Figures 1 B and D. The boxplot further shows the expression comparison of CuDEGs (Figure 1 C), and the top 12 were illustrated by correlational heatmap (Figure 1 E).
Figure 1
The CuDEGs in IS. A – The PCA analysis shows the distribution of two datasets of IS. B – The heatmap shows the expression of cuproptosis-related genes in the two groups. C – The boxplot shows the comparison of cuproptosis-related genes between the two groups. D – The circos plot shows the chromosome location of Cu-DEGs. E – The correlation heatmap of significant CuDEGs in the IS group. F – The correlation heatmap of significant CuDEGs and infiltrated immune cells in the IS group by CIBERSORT. G – The boxplot shows the comparison of infiltrated immune cells between the two groups
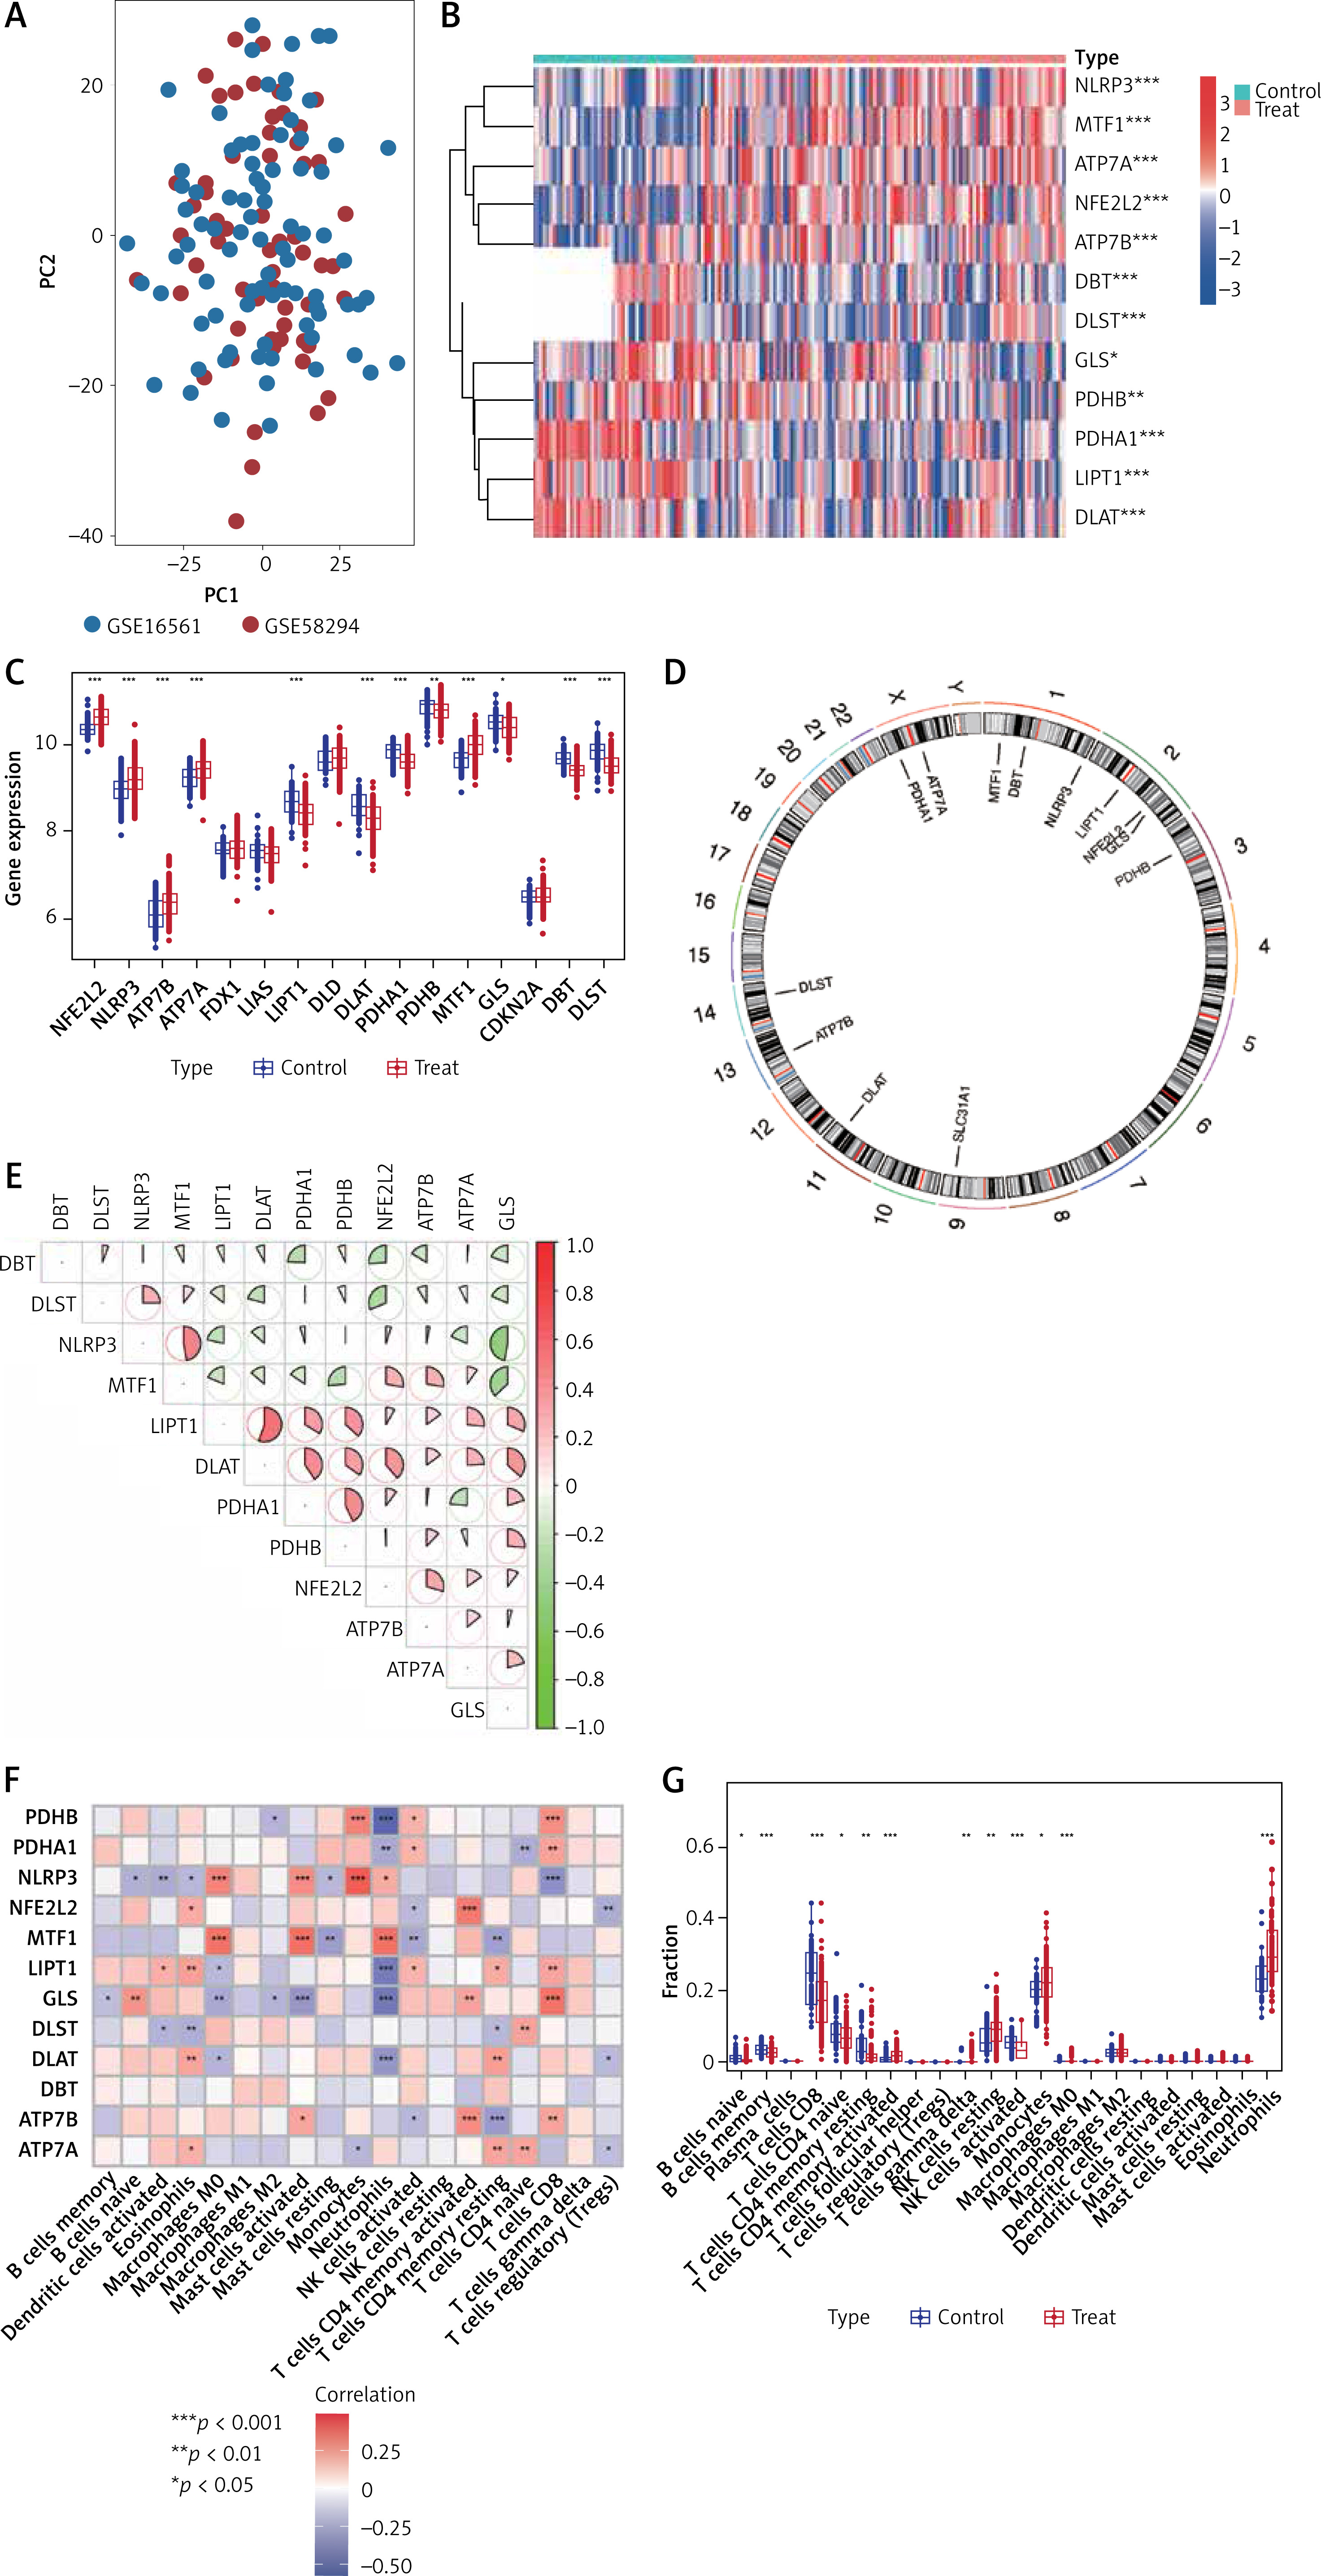
Infiltrated immune cell analysis. With the CIBERSORT package, we further investigated the correlation of infiltrated immune cells and the expression of CuDEGs (Figure 1 F), which shows that both PDHA1 and LIPT1 have a negative correlation with neutrophils; while they have a positive relationship with CD8 T cells, activated NK cells. Both the expression of infiltrated 22 immune cells and correlation between 19 immune cells and cuproptosis-related genes were summarized in Supplementary Tables SII and SIII. And NLRP3 has a positive correlation with neutrophils, monocytes, mast cells activated and M0 macrophages and is negatively correlated with CD8 T cells. We then applied the COBERSORT and found that stroke patients have a higher expression of neutrophils, and lower infiltration of B cells, CD8 T cells and NK cells activated (Figure 1 G).
Clustering of IS patients based on cuproptosis phenotype. We classified stroke samples by a consistent clustering approach. The optimal number of clusters was two by consistent score (Supplementary Figures S1 A, S2). The box plot shows different expression of CuDEGs between the two groups, and the expression of NLRP3, MTF1 and DLST have a reduced expression in Cluster one (C1), while ATP7A, LIPT1, DLAT, PDHA1, PDHB and GLS have a higher expression in C1 (Supplementary Figure S1 B). Accordingly, the C2 has a lower infiltration of B cells, T cells, NK cells and enrichment of neutrophils, M0 macrophages suggesting that a higher cuproptosis group has immune deficiency and inflammation phenotype (Supplementary Figure S1 C). The GSVA analysis of the two groups also demonstrate that C2 have a higher pathway enrichment in RNA degeneration, protein export and primary immunodeficiency; while the C1 group has enriched pathways in a series of metabolism (Supplementary Figure S1 D).
Construction of co-expression network. When we intersected the genes from three groups (disease-related genes in WGCNA1, cluster-related genes in WGCNA2 and cuproptosis-related genes), we crossed only one gene: NLRP3 among the three groups (Supplementary Figures S3, S4). We further identified the hub CuDEGs in stroke, by applying four machine learning model: GLM, SVM, XGB and RFE and found DBT, DLST, PDHA1 and LIPT1 were at the top. The ROC shows the four diagnostic models has a very high AUC > 0.89, except GLM (AUC = 0.711) to predict the occurrence of stroke (Supplementary Figure S3 B). The box plot of mean square of residues were less than 30% in RF, SVM and XGB (Supplementary Figures S4 C, D). The feature importance of each method was listed in Supplementary Figure S4 E.
Based on the GLM results, we applied PDHA1, DLST, LIPT1 and DBT to construct a nomogram model (Table I, Supplementary Figure S5 A) and this model has a high predicted probability according to the calibration curve and DCA method (Supplementary Figures S5 B, C). To test the efficacy of this model, we further validated this in the external dataset (GSE22255) and found only XGB model has a very high AUC value at 0.861. The AUC value in GLM, SVM and RF is 0.778, 0.556 and 0.778, respectively (Supplementary Figure S5 D). We further explored the hub CuDEGs with clinical feature and found with aging, the expression of PDHA1 increased and DLST, DBT decreased (Supplementary Figure S5 E). We did not find a correlation between hub CuDEGs expression and hours post stroke (Supplementary Figure S6).
Table I
The linear regression analysis for the hub CuDEGs in ischemic stroke
To further clarify the role of CuDEGs in the ischemic stroke, we analyzed the sc-RNA seq data from GSE 174574, which had three IS and three sham mice as there were no human stroke sc-RNA seq data. The detailed information regarding the samples were reported previously [9]. We first compared the cuproptosis extent in the brains from sham and MCAO mice in different cell groups (Supplementary Figures S7 A, B). The cuproptosis level was statistically different in endothelial cells, monocytes, microglia and fibroblasts. As the microglia hold the smallest p-value, we took them for re-clustering, which showed the obvious difference between sham and MCAO groups. We mapped the hub CuDEGs in the UMAP (Supplementary Figure S8). Moreover, we could also identify the microglia cuproptosis level was statistically increased in the MCAO group (Supplementary Figure S7 C, D). As we found the different microglia clusters between sham and MCAO mice, we then applied the pseudo-time analysis to identify the transition of microglia sub-clusters. We could see a clear stage change of microglia from sham to MCAO mice and accordingly alteration of cuproptosis genes (NLRP3) during the transition (Supplementary Figure S7 E, F).
As cuproptosis-related genes have a critical role in immune infiltration assessed by CIBERSORT, we further explored the cell-cell interaction at a single cell level with CellChat R package. We first found the tight interaction between several cell types (Supplementary Figure S9 A, B). We then specifically showed the TNF and SPP1 signaling pathway network among low and high cuproptosis microglia, with other cell types (Supplementary Figure S9 C, D). In addition, we showed the interaction between microglia with high or low cuproptosis and other cell types in both outgoing and incoming signaling patterns (Supplementary Figure S9 E).
Discussion. Ischemic stroke results in a higher rate of morbidity and mortality, which is a common neurological disease with poor prognosis. Previous studies indicate that inflammation, immunity and metabolic alterations get involved in the initiation and progression of IS [9]. Regarding the immune cell infiltration, we found that a higher neutrophil to lymphocyte ratio (NLR) is correlated with hemorrhagic transformation in stroke patients [10, 11]. However, we did not further investigate the cell-cell interactions among them previously. This time, we supplemented the sc-RNA seq method to demonstrate the high infiltration of neutrophils and lower level of B cells, T cells in MCAO mice, especially in those with a high cuproptosis level. We further showed the microglia with high cuproptosis extent had increased the connection with other cells via TNF receptors.
In our study, we found two stages of microglia from sham to stroke based on the pseudotime analysis and the CuDEGs: NLRP3 has a critical role in the stage transition. When we classified the microglia with high and low cuproptosis, we found that only microglia with a high cuproptosis level had a tight cell-cell interaction with monocytes, macrophages, granulocytes and fibroblasts via Tnf-Tnfrsf1a/Tnfrsf1b, while this connection was missed in microglia with a low cuproptosis level. Tumor necrosis factor-α (TNFα) is a specific pro-inflammatory cytokine, which is highly expressed in stroke. It can bind to two receptors: TNF receptor super-family member 1A (TNFRSF1A) and TNF receptor super-family member 1B (TNFRSF1B). Depletion of Tnfrsf1a is able to form the neuroblasts and subventricular zone cell proliferation [12]. A soluble TNF inhibitor can reduce the infarct volume in MCAO mice [13]. A current study reported the different role of TNFR1 and TNFR2 in demyelination disease, which is similar to M1 and M2 roles [14]. However, these studies did not elucidate the source of TNF. In our study, we applied the CellChat analysis to find microglia secret TNF to monocytes, macrophages, granulocytes and fibroblasts and bind to TNF receptors. This is the first time that the copper is linked to TNF in stroke. Furthermore, TNF-α is thought to be a triggering factor in thrombus via activation of the complement system [15]. The complex relationship between copper, TNF and coagulation in stroke is well deserved to be investigated in future studies.
There are also several limitations to be addressed. Firstly, the input data in this study were publicly shared, which were limited in the sample size and heterogenicity. The multi-center data with a bigger sample size are essential to validate our findings. Secondly, the potential function of CuDEGs in stroke is complicated, and further experimental study is required as well.
In conclusion, the integrated bulk RNA-seq and sc RNA-seq reveal cuproptosis-related hub genes and their role in immune and inflammation phenotypes in stroke, which can provide useful biomarkers and interventional strategy.