

Introduction
Cardiovascular diseases (CVDs) are the leading cause of death all over the world. There are more people dying from CVDs than from any other cause [1]. Therefore, it is important to know and understand dependencies of their occurrence. Chronobiology is a field of science that examines how natural rhythms affect living organisms [2]. In this study, we were focused on acute coronary syndromes (ACS) and wanted to determine whether season or day of hospitalization relates to the admissions due to ACS and how this dependency is changing in the time of climate change over the decade.
Many studies have shown an increased number of ACS, stroke, and aortic dissection cases during the winter season [3–8]. One of the first ones dates back to 1926, when Wolff and White observed the relationship between cases of coronary thrombosis and season [9]. There are also studies that show an escalation of cardiovascular deaths directly related to low temperature [10–12]. Additionally, there are data that link extremely high temperatures with higher acute myocardial infarction rates [13, 14]. However, only a few studies mention the importance of relative change in temperature, which has an impact on the occurrence of ACS [15, 16]. Another branch of chronobiology is the weekly rhythm, which has also been described in many prior studies. Most of the results indicated the peak for ACS occurrence on Monday [17, 18], which was associated with the stress of returning to work after a weekend break. Although it was the most common result, there were some exceptions to this, which pointed to another day or the lack of any connection between the occurrence of ACS and the day of the week [19, 20]. The aim of this study was to assess the influence of climate change on hospital admissions due to acute coronary syndromes.
Material and methods
Bialystok County
Białystok city and Białystok County comprise a multicultural and multiethnic area with a population of almost 450,000 inhabitants, which is located in the north-eastern part of Poland.
The study was conducted at the Clinical Hospital of Medical University of Bialystok, which was the only center in the Bialystok city and Bialystok County with 24-hour services available for cases related to invasive cardiology during the entire observation period.
Based on medical records, 10 529 patients from Bialystok County were hospitalized in the Department of Invasive Cardiology between 2007 and 2018 for ACS.
The study protocol was approved by the ethics committee of the Medical University of Bialystok (R-1-002/18/2019).
Data collection
Demographic, clinical data and type of acute coronary syndromes were evaluated. Patients with acute coronary syndromes (ACS) were divided into three groups: patients hospitalized due to ST-elevation myocardial infarction (STEMI), non-ST-elevation myocardial infarction (NSTEMI) and unstable angina (UA). The clinical diagnosis of unstable angina, STEMI and NSTEMI was made by physicians based on symptoms, level of myocardial infarction markers and electrocardiographic recordings. Troponin was the primary biomarker used to diagnose AMI. From 2014 highly sensitive troponin I was used (hs-cTnI).
Daily weather conditions data for Bialystok County were obtained from the Institute of Meteorology and Water Management for the same period. There were no missing observations during the study. We defined seasons as follows: Spring – months from March to the end of May, Summer – June to the end of August, Autumn – September to the end of November, Winter – December to the end of February.
Statistical analysis
In statistical analysis, the distribution of variables was evaluated using the Kolmogorov-Smirnov test. Kruskal-Wallis and Mann-Whitney U tests were used for comparative analysis. Obtained results were presented as mean values with standard deviation or percentage values corresponding to relative frequency.
The risk of ACS was calculated according to the Altman method and the p-value for this test was calculated according to the Sheskin method. The analyzed day or season was defined as the exposed period, while control periods included the rest of the days or seasons. Results were presented as odds ratios (ORs) from the 5th to the 95th percentile [21–23].
In addition, multivariable Poisson distributed regression was used to assess the effect of weather conditions and temperature on acute coronary syndromes. To minimize the collinearity effect, each parameter was modelled individually. In order to control the short-term trends, we included categorical variables for the day of the week as confounders. To exclude the impact of long-term variations a time stratified model was used. The time interval for daily data was elapsed calendar month, which resulted in creating 144 strata. In addition, we divided the study period in half and conducted separate analyses for the years 2007–2012 and 2013–2018 and also conducted separate calculations for patients over 70 years old.
Variables were considered significant at p < 0.05. All analyses were performed with the StatSoft Statistica 12 software (StatSoft, 2017, Poland) and MedCalc Software (MedCalc Software Ltd, 2020, Belgium) and Microsoft Excel (Microsoft, 2020, USA).
Results
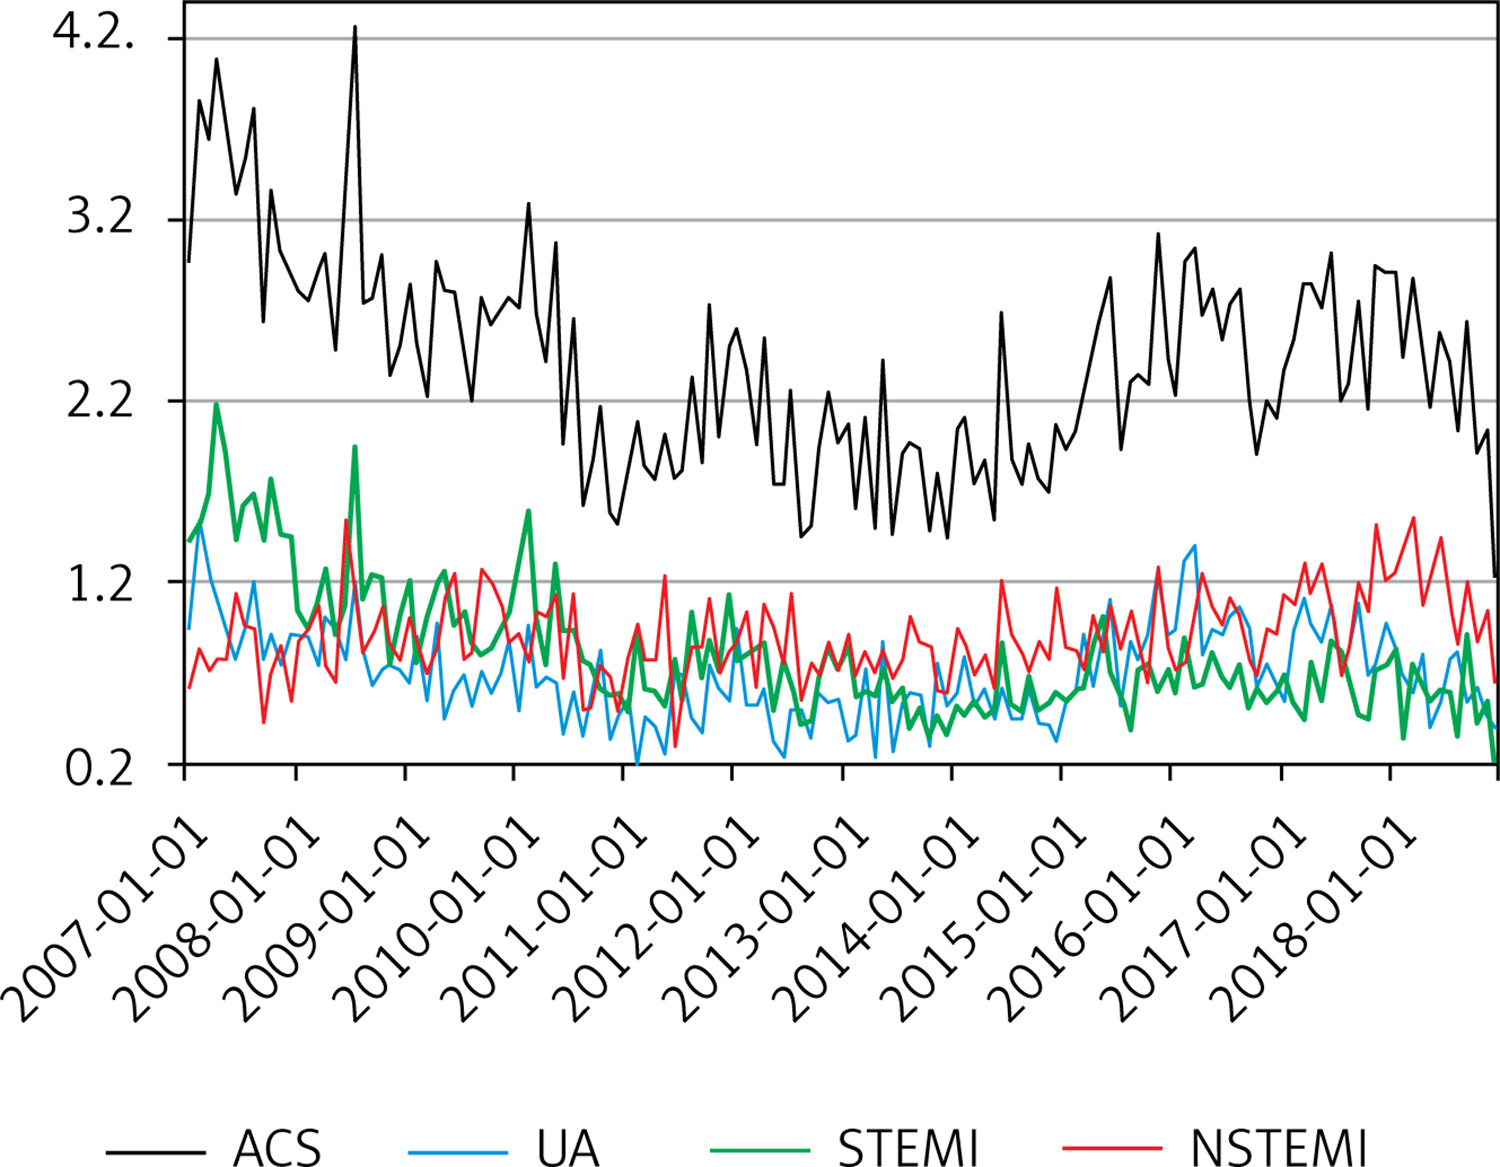
The study included 10 529 patients admitted for ACS between 2007 and 2018 from Bialystok County. The daily mean of admissions for ACS was 2.40 (SD = 1.70), median = 2.0, further on 0.81 (SD = 0.97) for STEMI, 0.90 (SD = 0.99) for NSTEMI and 0.69 (SD = 0.81) for UA. Most ACS cases occurred in 2007 and the fewest in 2013. Since 2007 the number of NSTEMI cases has been increasing. Between 2007 and 2018 we can observe that the proportion of STEMI and NSTEMI changed, from STEMI (n = 592) being the most frequent of all ACS cases and NSTEMI (n = 278) being the least frequent in 2007, to NSTEMI (n = 415) being more frequent than STEMI (n = 205) in 2018 (Table I, Figure 1).
Table I
Acute coronary syndromes and weather conditions in Bialystok County
Figure 1
Average monthly occurrence of acute coronary syndromes over the course of the study
NSTEMI – non-ST-segment elevation myocardial infarction, STEMI – ST-segment elevation myocardial infarction, UA – unstable angina.
The mean age was 66.62 years (SD = 12.2), median was 66 years and men were in the majority (62%, n = 6563). The youngest patient included in the study was aged 15, the oldest 105. Among the patients, 3537 (33.6%) were hospitalized for STEMI, 3947 (37.5%) for NSTEMI and 3045 (28.9%) for UA. Patients with NSTEMI were the oldest in the study population (66.9 years, SD = 12.2) and patients with STEMI were the youngest (62.8 years, SD = 12.2).
The most common risk factor in all ACSs was arterial hypertension, 7897 (75%), followed by hyperlipidemia, obesity, and diabetes mellitus. Atrial fibrillation was found to be the least common comorbidity, 1790 (17%). The subgroup hospitalized due to NSTEMI was found to be the most burdened with arterial hypertension, 3158 (80%, p < 0.001). A distinguished population of people over 70 years old, apart from hyperlipidemia, suffered more from coexisting diseases compared to the general population (Table II).
Table II
Demographic and clinical characteristics of the study population
Frequencies of patient admissions were also different across different seasons. The highest seasonal mean was recorded in the spring (n = 2816, mean = 2.55, SD = 1.74, OR = 1.08, 95% CI: 1.00–1.18, p = 0.049) compared to the mean for the other seasons. Analysis of the ACS frequency by change of temperature shows that there were more admissions during seasons with a greater temperature change such as spring (n = 2816, temperature changes day to day – ∆ temp. = 11.01) (Table III).
Table III
Seasonal changes in the frequency of acute coronary syndrome occurrence in the study population
The analysis of weekly changes showed that the highest mean frequency of ACS occurred on Thursday (n = 1705, mean = 2.72, SD = 1.85, OR = 1.16, 95% CI: 1.05–1.28, p = 0.003) and the lowest on Sunday (n = 1095, mean = 1.75, SD = 1.39, OR = 0.70, 95% CI: 0.63–0.77, p < 0.001). This pattern can be observed in both NSTEMI and UA. However, the highest mean frequency of STEMI occurred on Monday (n = 592, mean = 0.94, SD = 1.04, OR = 1.20, 95% CI: 1.07–1.36, p = 0.003) and the lowest on Sunday as well as in the rest of ACS cases. Overall, there are significant differences in admissions between weekends and weekdays (Table IV).
Table IV
Weekly changes in the frequency of acute coronary syndrome occurrence in the study population
Temperature fluctuations were associated with an increase in the number of hospitalizations (RR = 1.13, 95% CI: 1.04–1.3, p = 0.008). No influence of atmospheric pressure (RR = 1.115, 95% CI: 0.996–1.224, p = 0.319) or humidity (RR = 1.223, 95% CI: 0.995–1.02, p = 0.240) on the occurrence of ACS was noted at lag 0. The study also analyzed the delayed influence of atmospheric conditions on the occurrence of ACS. In the case of lag 1, a 1.6% increase in the occurrence of ACS was observed due to a 10-percentage point decrease in humidity (RR = 1.016, 95% CI: 1.001–1.033, p = 0.044). In addition, we also divided the study period in half and conducted separate analyses for the years 2007-2012 and 2013-2018. In the first half of the study period, a 10 percentage point decrease in humidity had an impact on the occurrence of ACS (RR = 1.029, 95% CI: 1.005–1.055, p = 0.017). For the years 2013–2018, the relative risk of hospital admissions due to ACS were 1.043 (95% CI: 1.009–1.079, p = 0.014, lag 0) and 0.957 (95%CI: 0.925–0.990, p = 0.010, lag 1) for each 10ºC decrease in temperature; 1.049 (95% CI: 1.015–1.084, p = 0.004, lag 0) and 1.045 (95% CI: 1.011–1.080, p = 0.008, lag 1) for each 10 hPa decrease in atmospheric pressure and 1.180 (95% CI: 1.078–1.324, p = 0.007, lag 0) for every 10ºC change in temperature (Table V).
Table V
Multivariable Poisson regression. The impact of weather conditions on the number of hospital admissions due to acute coronary syndrome. Each parameter was modelled individually for lag 0, lag 1 and lag 2
In the distinguished group of patients over 70 years old, in the second half of the study period, the influence of weather conditions had a greater impact on the occurrence of ACS and lasted longer. Each 10 percentage point decrease in humidity affected the number of admissions to the hospital due to ACS (RR = 1.034, 95% CI: 1.001–1.071, p = 0.042, lag 0). This effect persisted for two days (RR = 1.062, 95% CI: 1.018–1.108, p = 0.005, lag 1) (RR = 1.042, 95% CI: 1.005–1.081, p = 0.023, lag 2) and was greater than in lag 0. During the same period, each 10 hPa decrease in atmospheric pressure (RR = 1.055, 95% CI: 1.008–1.105, p = 0.022, lag 0) and every 10ºC change in temperature (RR = 1.002, 95% CI: 1.001–1.004, p = 0.042, lag 0) increased the number of admissions, and this effect lasted the following day for both variables (respectively RR = 1.061, 95% CI: 1.010–1.116, p = 0.020, lag 1 and RR = 1.118, 95% CI: 1.001–1.249, p = 0.048, lag 1) (Table VI).
Table VI
Multivariable Poisson regression. The impact of weather conditions on the number of hospital admissions due to acute coronary syndrome in patients over 70 years old. Each parameter was modelled individually for lag 0,lag 1 and lag 2
Discussion
We assessed the connection between chronobiology and the occurrence of ACS. The study showed a considerable seasonal and weekly variation in occurrence of acute coronary syndromes. Many previous studies all over the world have shown and confirmed this well-known correlation between low temperatures and hospital admissions due to cardiovascular reasons. Possible pathophysiological mechanisms involve many factors. There is a significant increase in sympathetic nervous activity; also oxygen demand and blood pressure increase, and blood viscosity and platelet count rise along with fibrinogen and cholesterol levels, which all together contribute to coagulation [24, 25]. External factors may include reduced physical activity, which is limited by weather conditions, and shortened exposure to the sun, which directly reduces the production of vitamin D in our bodies, and also intensified air pollution [26, 27]. A study conducted in Japan in 2020 showed seasonal variation in the incidence of myocardial infarction, with a peak in spring, associated with an increase in PM2.5 in the spring period [28]. The winter season also changes our eating habits; the amount of sodium intake and fat-rich foods increases.
Most of the research conducted so far has shown a seasonal pattern of acute myocardial infarction (AMI) or ACS occurrence, rarely dividing them into UA, NSTEMI and STEMI. A research team from Athens observed that with every 1ºC drop in mean daily temperature there was a 5% increase in admission rate for ACS [29]. In a study from New Zealand, which focused only on seasonal variations in admissions for STEMI, a winter peak was also observed [3]. However, in the analysis conducted in 2017 by Nagarajan et al. [30] winter predominance was noted in NSTEMI admissions but not in STEMI cases. It is interesting to note that Hodzic et al. [31] not only observed an increase in admissions in winter but also the fact that STEMI was the most common type of ACS, which does not correspond with the result of our study. Even though, in our study, the coldest period was in fact winter, collected data showed that the season with the highest admission rate for ACS was spring. Only a subgroup suffering from UA aligned with the results of previous studies having the highest number of admissions in winter. It may be due to the simple fact that it is very easily triggered by even walking in cold. That kind of exposure triggers a systemic response causing vasoconstriction and an increase in blood pressure that consequently leads to an increase in myocardial oxygen demand. Low temperature induces angina and also reduces tolerance for exercise, which has been confirmed by several researchers [32, 33].
The Eurowinter Group [8] noted that mortality increases with low temperature, but the increase in this mortality rate is greater if the temperature drops in a warm climate. They also emphasized the importance of adequate clothing for the weather among people who do not have cold winters on a daily basis. Lashari et al. [15] and Wolf et al. [34] pointed out that sudden temperature change may be as important as low temperature, in terms of having an effect on the occurrence of ACS. Similar conclusions were drawn in a study that examined seasonal variation in the occurrence of acute aortic dissection, which has comparable pathophysiological mechanisms to ACS triggered by cold weather [35]. Data from a recent study conducted in Northeast China also showed seasonal variation confirming the effect of low air temperature having a big impact on admissions during the warm season [36].
Our climate is changing and the effects of this can be seen across the globe. It is a progressively increasing process of atmospheric disturbances that causes profound changes. Glaciers continue to melt, thus raising water levels. Wildfires are more frequent, drought periods are longer and the life cycle of plants and animals is altered. In our study, atmospheric changes had a much more pronounced effect on admissions due to ACS in the second half of the analyzed period. This is in line with the dynamics of global climate change. Additionally, the population of people over 70 years of age was more sensitive to these changes and, apart from temperature changes, they were also affected by humidity decrease. A slight change in global temperature is enough to cause a change in seasons. Summers are warmer and longer, autumns arrive later, winters are milder and shorter. Moreover, spring arrives earlier and after its arrival there are episodes of frosty days giving us a great change in temperature which, as we know, has an impact on the occurrence of ACS [37, 38]. This shift in seasons may explain the findings from our study which move the seasonal peak for ACS occurrence from winter to spring. To our knowledge this is the first study that shows a possible connection between climate change and a shift in seasonal peak of ACS occurrence from winter to spring.
In our study, we found a significant weekly variation in admissions due to ACS with a dominant peak on Thursday. Furthermore, in subgroup analyses, we observed differences depending on ACS type and day of the week. Both NSTEMI and UA had their peak on Thursday. However, the highest mean frequency of STEMI occurred on Monday. Above that, the frequency of ACS was decreased over the weekend compared to admissions during the working week.
It is well known that emotional stressors have a direct impact on the occurrence of cardiovascular events [39]. It is due to acute risk factors such as work-related stress, anxiety, anger, and emotional upset, which may occur for example when people return to work after the weekend. All of them increase the risk of atherosclerotic plaque rupture, leading to complete or incomplete occlusion of an epicardial coronary artery which manifests itself as myocardial infarction [40].
Two major studies, which now provide a reference for almost every study in this area, have found an increased amount of AMI on Mondays, especially among the working class [41, 42]. It has been confirmed over the years in many further studies [17, 18] and recently in the findings from the SWEDEHEART observational study [43]. Our study group was not divided into working and nonworking populations. However, the average age for STEMI, which was the only one to demonstrate an increase on the first day of the week, was the lowest (62.8 years) in comparison to NSTEMI and UA. Assuming that there is a greater chance that this younger group is still actively working, this may partly explain our results.
In our study we observed a significant peak in admissions due to ACS on Thursday, which to our knowledge has not been previously reported. An explanation for this phenomenon may be the fact that nowadays more people have freelance jobs, which are not confined to the rigid framework of a working week. We can only speculate on the possible reasons which lead to an increase on Thursday. It is interesting to note that a study conducted in Japan detected a Saturday peak in the incidence of acute myocardial infarction in women, suggesting the hypothesis that Japanese women experience more stress during the weekend, which is related to household chores [20]. There is a need for further studies that will take into account the work schedule, which will give us a better insight into ACS occurrence during the course of the week.
As a final result, our study also confirmed the weekend drop in ACS incidence in comparison to weekday admissions [44, 45]. Many people still perceive Saturday and Sunday as an opportunity to relax, rest and dedicate time to family and hobbies. Consequently, this may lead to a reduction in the number of external triggers for cardiovascular diseases over the course of the weekend.
Any study showing the negative impact of climate change should put even greater pressure on the implementation of systemic changes that will be able to limit global warming.
The study was conducted in a specific region, known as the Green Lungs of Poland, where the air should be relatively clean. The influence of air pollution, which is a known trigger for cardiovascular diseases and is also becoming an increasingly common problem, has not been examined. Moreover, it was a single-center-based study, so it may not have general application. Our research did not take into account the division between working and non-working populations.
In conclusion, the study revealed considerable seasonal and weekly variation in the occurrence of acute coronary syndromes. We observed a shift in the seasonal peak of ACS occurrence from winter to spring, which may be related to climate change. There are statistically significant differences in the weekly occurrence of ACS with a dominant peak on Thursday. Most of the non-ST-elevation acute coronary syndromes took place on Thursday, but in the case of the STEMI subgroup, it was Monday, which can be linked to a different pathophysiological mechanism leading to its occurrence. Our study also confirms the decreased number of admissions on weekends compared to weekdays.

