Cardiac resynchronization therapy (CRT) has developed into an important method for the management of heart failure patients with left ventricular systolic dysfunction and ventricular conduction delay [1, 2]. Although the benefits of CRT have been consistently observed in large multicenter randomized studies, many patients with a poor response are classified as nonresponders. Generally, the nonresponder rate is estimated to be about 30%, which has not changed significantly in the past 10 years [3, 4]. There are many reasons for a CRT nonresponse, such as unreasonable device settings, incorrect positioning of the left ventricular lead, and suboptimal timing of the atrioventricular (AV) and interventricular (VV) delay. Optimal management of the AV and VV delay plays a significant role in reducing the proportion of patients with CRT nonresponse. The timing of optimal AV and VV delay varies from patient to patient and needs to be set individually. Several randomized and nonrandomized trials have evaluated the effects of AV and/or VV delay optimization on various clinical or echocardiographic outcomes at mid-term or long-term follow-up [5–7]. However, the results were controversial. In addition, there is no consensus on when, how or under what circumstances to optimize CRT for patients.
The aim of this study was to investigate the synchrony of the left and right ventricle, the left intraventricular synchrony and the cardiac function index by dynamic AV and VV delay optimization in patients with CRT. In addition, we evaluated the impact on neuroendocrine factors.
Congestive heart failure patients were selected by two professional cardiologists from among those who had come for a cardiac evaluation. This study complied with the Declaration of Helsinki and was approved by the medical ethics review committee of our hospital. Written informed consent was acquired from all patients.
Congestive heart failure was defined as the symptoms and signs of increased cardiac filling pressure caused by extracellular fluid accumulation [8]. All selected patients were over 18 years old, had been diagnosed with congestive heart failure at least 6 weeks previously, and were in New York Heart Association (NYHA) functional class III or IV despite receiving standard pharmacologic therapy, with a left ventricular ejection fraction (LVEF) ≤ 35% and a QRS duration ≥ 120 ms. Optimal drug treatment for congestive heart failure, including diuretics, β-blockers, aldosterone receptor antagonists and angiotensin-converting-enzyme inhibitors or angiotensin receptor blockers, was strongly encouraged.
Patients who had a major cardiovascular event (for example, myocardial infarction, stroke or transient ischemic attack, or unstable angina) or heart failure requiring continuous intravenous therapy in the previous 6 weeks were excluded. Patients with atrial fibrillation or previous myocardial infarction were also excluded because they might not benefit from cardiac resynchronization therapy [9]. Patients with serious liver dysfunction (bilirubin > 2 mg/dl, albumin < 34 g/l or prothrombin time < 50%), serious kidney dysfunction (defined as serum creatinine over 2.5 mg/dl, or renal replacement therapy by dialysis or kidney transplantation), malignant tumor, or other serious diseases (for example, autoimmune disease, acute infectious disease, acute myocarditis, hypertrophic or restrictive cardiomyopathy) were also excluded.
Coronary arteriography was performed in all patients. Dilated cardiomyopathy was a myocardial disease characterized by left ventricular or biventricular dilatation and systolic dysfunction, excluding any known cause (including coronary artery stenosis). Ischemic cardiomyopathy was defined as heart failure explained by severe coronary artery stenosis based on coronary angiography. This study finally included 40 patients, among whom 30 patients had dilated cardiomyopathy and 10 patients had ischemic cardiomyopathy.
At randomization, patients were implanted with a CRT/CRT defibrillator (CRTD) according to the routine procedure. All leads were implanted through the left subclavian vein. The atrial lead was placed high in the right atrium. The left ventricular lead was placed in a tributary of the coronary sinus and a venogram helped to optimize the position. An umbrella electrode wire was positioned in the right ventricle via the conventional way according to a previously described method [10].
AV delay optimization was based on biventricular capture. Under the double ventricular synchronous pacemaker, AV delays were analyzed from 100 to 180 ms, with steps of 10 ms. The Doppler mitral inflow method was used to optimize the AV delay. In this way, the AV delay that optimized the timing of the mitral valve closure to occur simultaneously with the onset of left ventricular systole was calculated from the pulsed Doppler mitral waveforms. The VV delay associated with the highest aortic valve forward flow velocity time integral (VTI) was considered optimal after the optimization of the AV delay. The VV delays were analyzed from –60 to +60 ms, with steps of 10 ms, and the default VV interval was 4 ms. The heart rate was stable at ±5 bpm during optimization of the AV and VV delay guided by echocardiography [11].
Two professional cardiologists performed transthoracic echocardiography on the subjects resting on their left side at preoperation, 1 day, 15 days, 1 month, 6 months and 12 months after the operation. The baseline measurements were performed before the CRT implantation. The echocardiography measurements were performed at each point in time during the follow-up before AV and VV optimization again. Complete two-dimensional, color, pulsed and continuous wave Doppler echocardiography examinations were performed according to the standard techniques [11]. Left ventricular end-diastolic diameter (LVEDD), left ventricular end-systolic diameter (LVESD), LVEF, VTI, mitral regurgitation area (MR) and interventricular mechanical delay (IVMD) were measured by echocardiography. The standard deviation of time-to-peak systolic velocity of 12 left ventricular segments (Ts-SD) was also measured by Doppler imaging.
The plasma endothelin (ET, normal range: 30–55 mg/ml), atrial natriuretic peptide (ANP, normal range: 50–150 pg/ml), plasma renin activity (PRA, normal range: 0.15–1.19 pg/ml.h), angiotensin II (Ang II, normal range: 28.2–52.2 pg/ml), aldosterone (ALD, normal range: 10–50 pg/ml) and N-terminal pro-brain natriuretic peptide (NT-proBNP, normal range < 300 ng/l) were measured by enzyme-linked immunosorbent assay (ELISA) before the operation and at 15 days, 1 month, 6 months and 12 months after the operation.
All patients regularly underwent AV or VV delay optimization at 1 day, 15 days, 1 month, 3 months, 6 months and 12 months after the operation under the guidance of echocardiography.
Patients underwent optimal AV delay 1 day after the implantation of the CRT under the guidance of echocardiography.
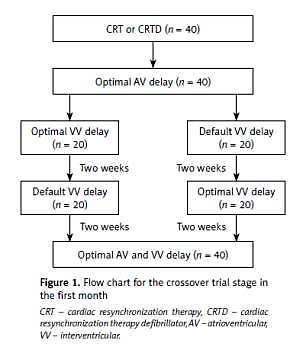
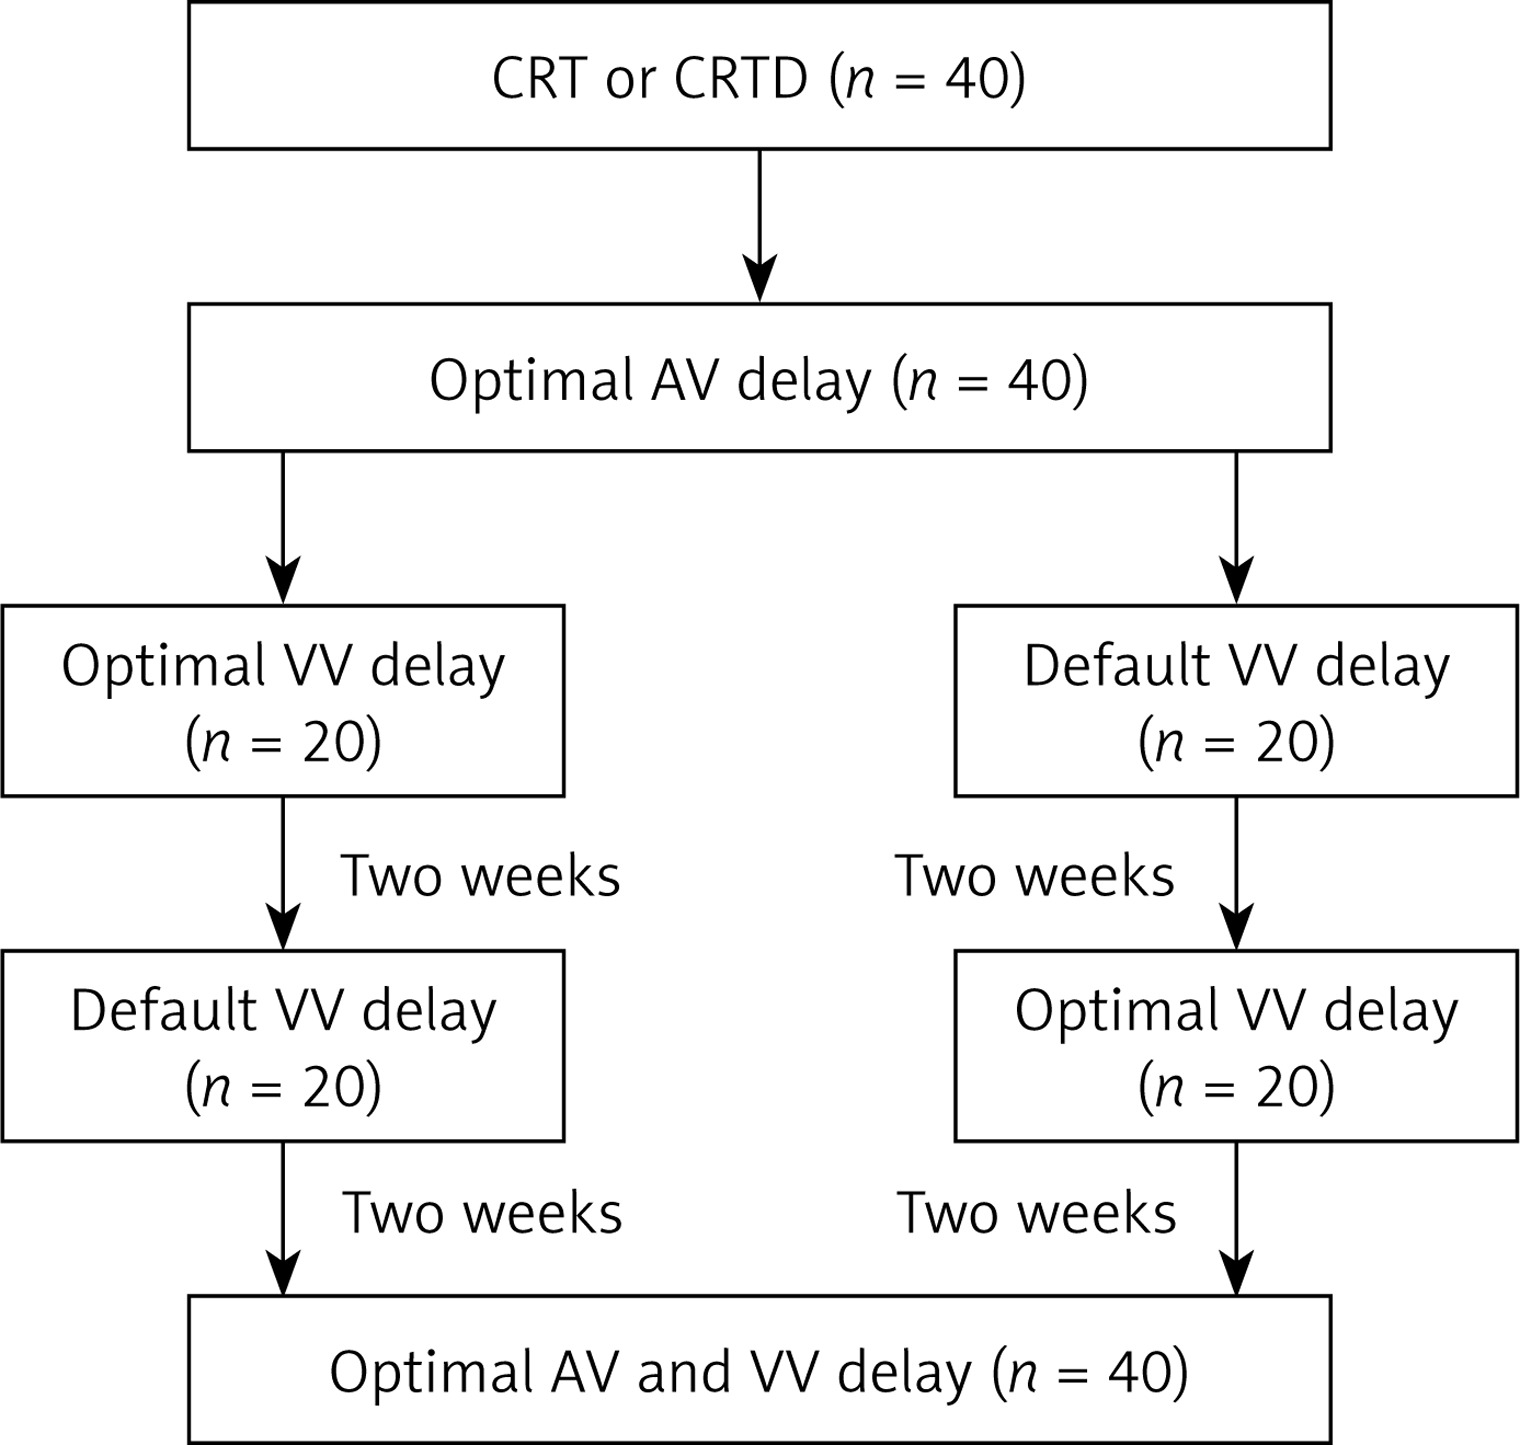
Thereafter, all patients entered into a randomized and crossover trial stage with default VV delay or individualized optimal VV delay during the first month (Figure 1). During this period, 40 patients were randomly divided into two groups, among which 20 patients underwent individualized optimal VV delay and 20 patients underwent default VV delay during the first 2 weeks. In the subsequent 2 weeks, the pacing mode was crossed over to the other mode of optimization.
All pacemakers were programmed for dynamic AV and VV delay optimization at 1 month, 3 months, 6 months and 12 months of follow-up.
For the continuous variables, the values are presented as mean ± standard deviation. Categorical variables are expressed as the number (%). Student’s t-test and one-way analysis of variance (ANOVA) were used to detect the differences between groups. A value of p < 0.05 was considered statistically significant. All statistical analyses were performed with SPSS version 20 (SPSS Inc., IBM Corp.).
Figure 1
Flow chart for the crossover trial stage in the first month
CRT – cardiac resynchronization therapy, CRTD – cardiac resynchronization therapy defibrillator, AV – atrioventricular, VV – interventricular.
The 40 enrolled patients were successfully implanted with the CRT. The baseline demographic and clinical characteristics of all subjects are summarized in Table I.
Table I
Baseline demographic and clinical characteristics of all subjects (n = 40)
Table II A shows the changes in cardiac function and the cardiac synchronization index between the default VV delay group and the optimal VV delay group at 1 month after implantation of the CRT. Optimization of the VV delay resulted in a significant improvement in the LVEF, Ts-SD and IVMD compared with the default VV delay group (p < 0.05).
Table II
Comparison of cardiac function, the cardiac synchronization index (A) and neuroendocrine factors (B) between the default VV delay group and the optimal VV delay group before AV and VV optimization at the 1-month follow-up (n = 40)
| A | |||||||
|---|---|---|---|---|---|---|---|
| Groups | LVEDD [ml] | LVESD [ml] | LVEF (%) | VTI [cm] | MR [cm2] | Ts-SD [ms] | IVMD [ms] |
| Default VV delay group | 67.5 ±14.4 | 59.3 ±11.0 | 29.3 ±4.1 | 15.9 ±3.8 | 8.8 ±4.1 | 40.5 ±21.7 | 28.2 ±11.1 |
| Optimal VV delay group | 67.2 ±7.6 | 54.6 ±10.8▴ | 32.6 ±5.1▴ | 16.8 ±4.5 | 8.9 ±2.8 | 30.6 ±19.6▴ | 21.5 ±9.4▴ |
| B | ||||||
|---|---|---|---|---|---|---|
| Groups | ET [mg/ml] | ANP [pg/ml] | PRA [pg/ml.h] | Ang II [pg/ml] | ALD [pg/ml] | NT-proBNP [ng/l] |
| Default VV delay group | 88.6 ±11.4 | 308.3 ±23.6 | 1.7 ±0.6 | 143.3 ±24.2 | 195.2 ±28.3 | 7048.2 ±2301.5 |
| Optimal VV delay group | 67.8 ±9.3▴ | 265.5 ±20.3▴ | 1.6 ±0.5 | 110.5 ±14.6▴ | 139.3 ±21.3▴ | 5682.2 ±1834.5▴ |
▴ P < 0.05 vs. default VV delay group. Data are shown as the mean ± standard deviation. VV – interventricular, LVEDD – left ventricular end-diastolic diameter, LVESD – left ventricular end-systolic diameter, LVEF – left ventricular ejection fraction, VTI – aortic valve forward flow velocity time integral, MR – mitral regurgitation area, Ts-SD – standard deviation of time-to-peak systolic velocity of 12 left ventricular segments, IVMD – interventricular mechanical delay, ET – endothelin, ANP – atrial natriuretic peptide, PRA – plasma renin activity, Ang II – angiotensin II, ALD – aldosterone, NT-proBNP – N terminal pro-brain natriuretic peptide.
Table II B shows the changes in the neuroendocrine factors between the default VV delay group and the optimal VV delay group at 1 month after implantation of the CRT. Optimization of the VV delay resulted in a significant reduction in the ET, ANP, Ang II, ALD and NT-proBNP levels compared with the default VV delay group (p < 0.05).
Table III A shows the changes in the cardiac function and the cardiac synchronization index before and after implantation of the CRT. Compared with preoperative values, patients at 6 months postoperatively and 12 months postoperatively showed a significant improvement in LVEDD, LVESD, LVEF, VTI, MR, Ts-SD and IVMD (p < 0.05). Compared with 6 months postoperatively, patients at 12 months postoperatively showed a significant improvement in LVEDD and LVEF (p < 0.05).
Table III
Comparison of cardiac function, the cardiac synchronization index (A) and neuroendocrine factors (B) at preoperation, 6 months and 12 months postoperation before AV and VV optimization again of follow-up (n = 40)
| A | |||||||
|---|---|---|---|---|---|---|---|
| Time | LVEDD [ml] | LVESD [ml] | LVEF (%) | VTI [cm] | MR [cm2] | Ts-SD [ms] | IVMD [ms] |
| Preoperation | 69.3 ±14.8 | 60.6 ±11.3 | 29.8 ±4.8 | 14.8 ±3.1 | 10.8 ±4.9 | 66.5 ±10.3 | 57.2 ±12.1 |
| 6 months postoperation | 61.5 ±10.8* | 49.4 ±9.6* | 34.1 ±3.8* | 17.8 ±4.2* | 5.6 ±3.5* | 30.3 ±9.3* | 16.6 ±6.8* |
| 12 months postoperation | 54.2 ±9.6*▴ | 49.6 ±8.9* | 39.2 ±6.4*▴ | 19.1 ±3.9* | 5.2 ±3.8* | 28.5 ±8.9* | 17.1 ±7.6* |
| B | ||||||
|---|---|---|---|---|---|---|
| Time | ET [mg/ml] | ANP [pg/ml] | PRA [pg/ml.h] | Ang II [pg/ml] | ALD [pg/ml] | NT-proBNP [ng/l] |
| Preoperation | 103.2 ±16.4 | 336.2 ±28.3 | 1.9 ±0.6 | 153.3 ±19.2 | 256.2 ±32.4 | 10449.2 ±4301.5 |
| 6 months postoperation | 60.9 ±10.9* | 267.4 ±89.9* | 1.7 ±0.5 | 78.6 ±8.5* | 132.6 ±18.7* | 2346.2 ±1081.6* |
| 12 months postoperation | 60.2 ±8.9* | 239.6 ±78.6*▴ | 1.5 ±0.4* | 77.2 ±6.8* | 132.3 ±17.9* | 2048.2 ±1012.3* |
▴ P < 0.05 vs. 6 months postoperation. Data are shown as the mean ± standard deviation. AV – atrioventricular, VV – interventricular, LVEDD – left ventricular end-diastolic diameter, LVESD – left ventricular end-systolic diameter, LVEF – left ventricular ejection fraction, VTI – aortic valve forward flow velocity time integral, MR – mitral regurgitation area, Ts-SD – standard deviation of time-to-peak systolic velocity of 12 left ventricular segments, IVMD – interventricular mechanical delay, ET – endothelin, ANP – atrial natriuretic peptide, PRA – plasma renin activity, Ang II – angiotensin II, ALD – aldosterone, NT-proBNP – N terminal pro-brain natriuretic peptide.
Table III B shows the changes in the neuroendocrine factors before and after implantation of the CRT. Compared with preoperative values, patients at 6 months postoperatively and 12 months postoperatively showed a significant reduction in ET, ANP, PRA, AngII, ALD and NT-proBNP levels (p < 0.05). Compared with 6 months postoperatively, patients at 12 months postoperatively showed a significant reduction in the ANP level (p < 0.05).
At 12 months of follow-up, there were no electrode dislocations, cardiac perforations, pericardial tamponade, death or other severe complications. There were 2 patients with supraventricular tachycardia and 5 patients with ventricular tachycardia, and antitachycardia pacing or defibrillation was used for cardioversion. Among the 13 patients with severe mitral regurgitation before the operation, 8 patients improved to moderate mitral regurgitation and 2 patients improved to mild mitral regurgitation. Among the 27 patients with moderate mitral regurgitation before the operation, 24 patients improved to mild mitral regurgitation and 3 patients remained at moderate mitral regurgitation with a decreased mitral regurgitation area. The clinical symptoms improved significantly in 37 patients from NYHA class III or IV before the operation to class I–II after the operation, among whom 26 patients improved to grade 1 and 11 patients improved to grade 2, and the LVEF of those 37 patients increased by more than 10%. Therefore, the responder rate for CRT was 92.5%. CRT did not improve the clinical symptoms in 3 patients who had dilated cardiomyopathy with severe mitral regurgitation.
Heart failure is characterized by high mortality and a high incidence and is still the most common discharge diagnosis for patients over 65 years old [12]. CRT, delivered via atrial-synchronous biventricular pacing, has become an effective method for the treatment of moderate to severe ventricular asynchrony heart failure. Although CRT has been shown to improve cardiac function, this method remains limited in clinical application due to a relatively high proportion of nonresponsive patients [13]. AV and VV delay optimization has become an important method to improve CRT therapy [14].
An optimally programmed AV delay can affect the acute hemodynamic response and clinical improvement with chronic pacing. The optimal AV delay setting is considered to allow the completion of the atrial contribution to diastolic filling before ventricular contraction, thus providing the longest diastolic filling time. If the AV delay is set too long, the diastolic filling time will change such that the atrial contribution to filling terminates before ventricular depolarization, resulting in the waste of diastole and suboptimal preload for ventricular contraction. On the other hand, if the AV delay is too short, the end-diastolic filling flow (mitral A wave) will be suddenly interrupted due to the onset of a ventricular contraction and closure of the mitral valve [15].
In addition to the benefits of AV delay optimization, changes in VV delay can also improve the hemodynamic response to CRT. Compared with simultaneous biventricular pacing, VV delay optimization with sequential pacing can gradually improve cardiac function, which may be due to the reduction of both inter- and intraventricular dyssynchrony. Echocardiography is the most commonly used noninvasive method for optimizing the AV and VV delay of CRT [16].
In this study, cardiac synchronization indexes (Ts-SD and IVMD), LVEF and neuroendocrine factors (ET, ANP, AngII, ALD and NT-proBNP) showed greater improvement in the optimal VV delay group compared with the default VV delay group at 1 month after the implantation of CRT. Thereby, postoperative CRT optimization is critical to improve cardiac synchronization and cardiac function. Patients at 6 months and 12 months after the operation with a gradual reduction in LVEDD and LVESD, improvement in the cardiac synchronization index and neuroendocrine factors, and an increase in LVEF compared with the preoperative value showed that cardiac function gradually improved with the passage of time to optimize the AV and VV delay. The responder rate for CRT in our study was 92.5%, which was significantly higher than the 70% previously reported. We believe that this study can provide clinicians with methods to improve the responder rate to CRT. The optimal AV and VV delay is not constant among different patients or patients at different stages. Thus, it is important to improve the efficacy of CRT by dynamic adjustment of the AV and VV delay.
There are several limitations of this study. First, this study was based on a small population. We performed AV and VV optimization only on subjects resting on their left side. It would be worthwhile to assess the AV and VV delay under other conditions, for example, during normal daily activity or exercise. Finally, our optimization method was based on a previous study. We optimized the AV delay during simultaneous biventricular pacing and then optimized the VV delay according to the optimal AV delay.