Introduction
Cerebral computed tomography perfusion (CTP) is a widely used and highly accurate imaging method for detecting ischemic lesions in acute stroke, CTP can distinguish the infarct core from penumbra brain tissues, and aid in the decision to use thrombolytic therapy [1–3]. However, the high radiation dose (RD) accompanying CTP remains a major concern for this technique [4]. Reducing the risk of radiation exposure has always been the goal of imaging studies. In modern computed tomography (CT), low tube voltage scanning has been commonly used as a strategy for dose reduction. Iodine attenuation is higher at low kilovolt peak (kVp). Therefore, the signal-to-noise ratio (SNR) can be kept constant with reduced radiation exposure. The greatest potential of a low kVp for reducing exposure is mainly limited to high iodine-enhancing examinations, such as CT angiography or arterial phase imaging [5].
An alternative approach for reducing the RD in CT is to reduce the tube current, since this current is linear with RD. However, as the tube current decreases, the image noise would inevitably increase, potentially jeopardizing the correct diagnosis. Therefore, it is important to determine whether the increased signal from the higher attenuation of iodine under lower tube current conditions could compensate for the increased noise in low-dose CTP scans, and thereby maintain image quality (IQ).
At present, iodinated contrast media (CM) at different concentrations are commercially available for daily CT vascular examinations. The clinical goal of CM administration and CT scan timing is to achieve a diagnostically adequate contrast enhancement in a target organ at the lowest radiation exposure (the shortest scan duration) and injected iodine mass (iodine load) acceptable for a given patient’s cardiovascular and renal function [6]. Previous studies have demonstrated that arterial enhancement is directly affected by the iodine delivery rate (IDR). Even with modern CT and the assistance of iterative reconstruction, increasing the IDR favors higher quality images [7].
Therefore, the present study was conducted to investigate the feasibility of maintaining the image quality of CTP and further reducing the RD by lower mAs in an already low kVp setting, using different concentrations of CM, and a fixed IDR and iodine load.
Material and methods
The prospective study was approved by the ethics committee of a local institutional review board. Informed consent was obtained from all patients.
Study population
A total of 200 consecutive patients, who underwent non-contrast CT and CTP between June 2016 and September 2017, were prospectively enrolled. Inclusion criteria: (1) patients suspected with acute ischemic stroke (AIS) and referred for non-contrast CT and CTP; (2) patients who were at least 18 years old. Exclusion criteria: (1) patients with non-contrast CT showing cerebral hemorrhage; (2) patients who suffered from a disease and cannot undergo a contrast-enhanced CT examination (such as thyrotoxicosis, severe renal insufficiency, allergies or severe congestive heart failure [III, IV], etc.); (3) patients with insufficient peripheral vein conditions that do not allow for the injection of a CM at the protocol flow rate; (4) patients with a body mass index (BMI) greater than 28 [8, 9]; (5) patients with a CTP showing cerebral ischemia or infarction occurring in the bilateral cerebral hemispheres; (6) patients with a disease that significantly affects the cerebral blood flow pattern (such as aneurysms, arteriovenous malformations, dural arteriovenous fistulas, etc.); (7) patients with significant motion artifacts during the CTP scan, resulting in the inability to perform an image analysis.
CTP acquisition and dataset reconstruction
All examinations were performed on a 256-slice multi-detector CT scanner (Philips Brilliance iCT; Philips Healthcare, Cleveland, OH, USA). The CTP protocol was as follows: FOV, 20 cm; matrix, 512 × 512; scan range, 8 cm from the sella floor to the high vertex. The CTP scan was initiated at 5 s after the CM bolus, and a total of 40 scans were acquired with a fixed temporal resolution of 1.5 s in both the arterial and venous phases, resulting in an overall scan duration of 60 s.
Patients were randomly assigned to four groups, according to different tube currents and CMs with different iodine concentrations. There were 50 patients in each group. In groups A and B, the CTP scan was performed with a low tube current of 60 mAs to reduce the RD. Patients in groups C and D were scanned with a conventional tube current of 100 mAs. Ioversol of 320 mg I/ml (Hengrui Pharmaceuticals, Jiangsu, China) was used for groups A and C, while iopamidol of 370 mg I/ml (Braccosine pharmaceuticals, Shanghai, China) was used for groups B and D. The CM was injected through the right cubital vein with the same IDR, total iodine load and injection time for each group, followed by a 30-ml saline flush at the same flow rate used for the CM injection. The grouping method and injection parameters are listed in Table I.
Table I
Patient demographic data and dose parameters for CTP in the four groups
Image post-processing
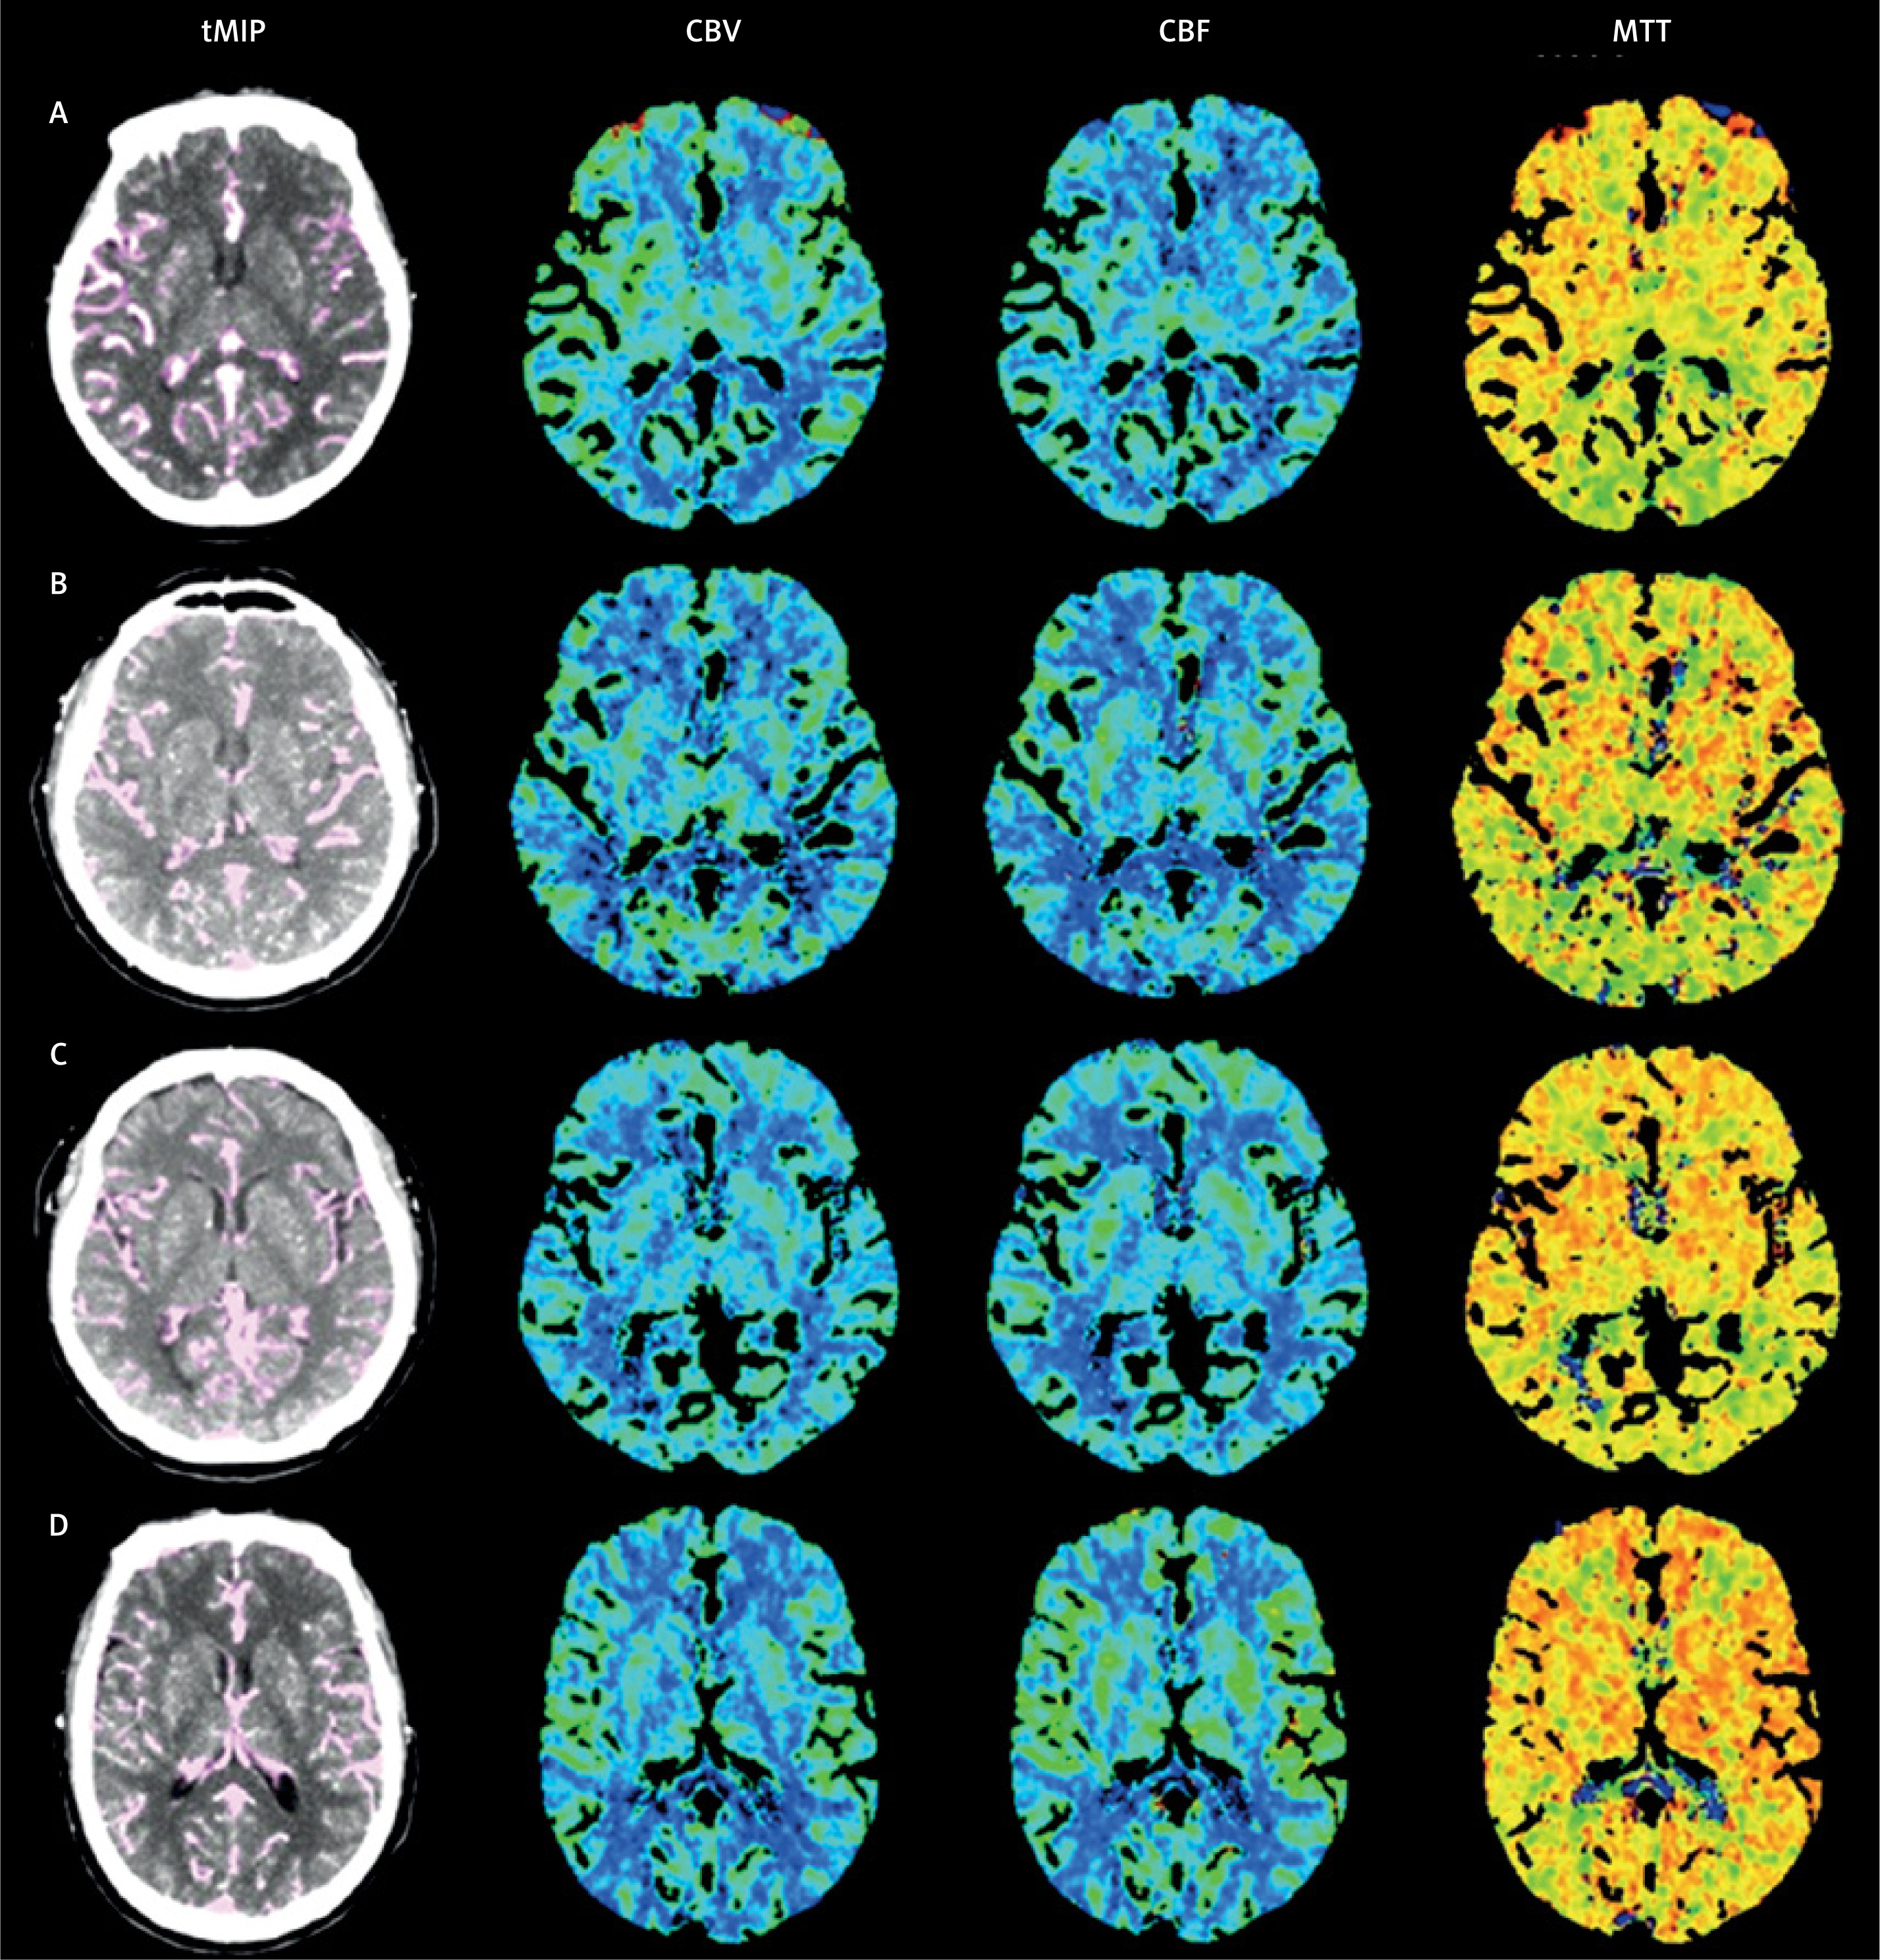
The CTP source images were automatically reconstructed into a 5-mm thick CTP source image using iterative reconstruction technology. The iDose4 level 3 was chosen for all groups to reduce the image noise and compensate for the decreased SNR of the reconstructed image due to the RD reduction. Then, the source images were post-processed using the Philips workstation’s Brain perfusion software, employing a deconvolution algorithm to obtain perfusion parameter maps of the cerebral blood volume (CBV), cerebral blood flow (CBF), and mean transit time (MTT). The software automatically selects the arterial input function from the anterior cerebral artery and selects the venous output function in the superior sagittal sinus.
Measurement of radiation exposure
The volume CT dose index (CTDIvol, unit mGy) and dose length product (DLP, unit mGy · cm) were extracted from the individual patient protocol record. The effective dose (ED, unit millisieverts) was estimated by multiplying DLP by a region-specific conversion coefficient of 0.0023 mSv/(mGy · cm) [10].
Quantitative image analysis
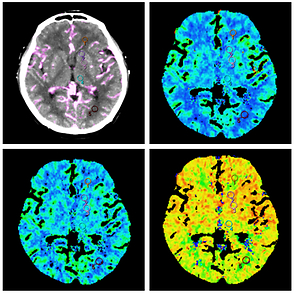
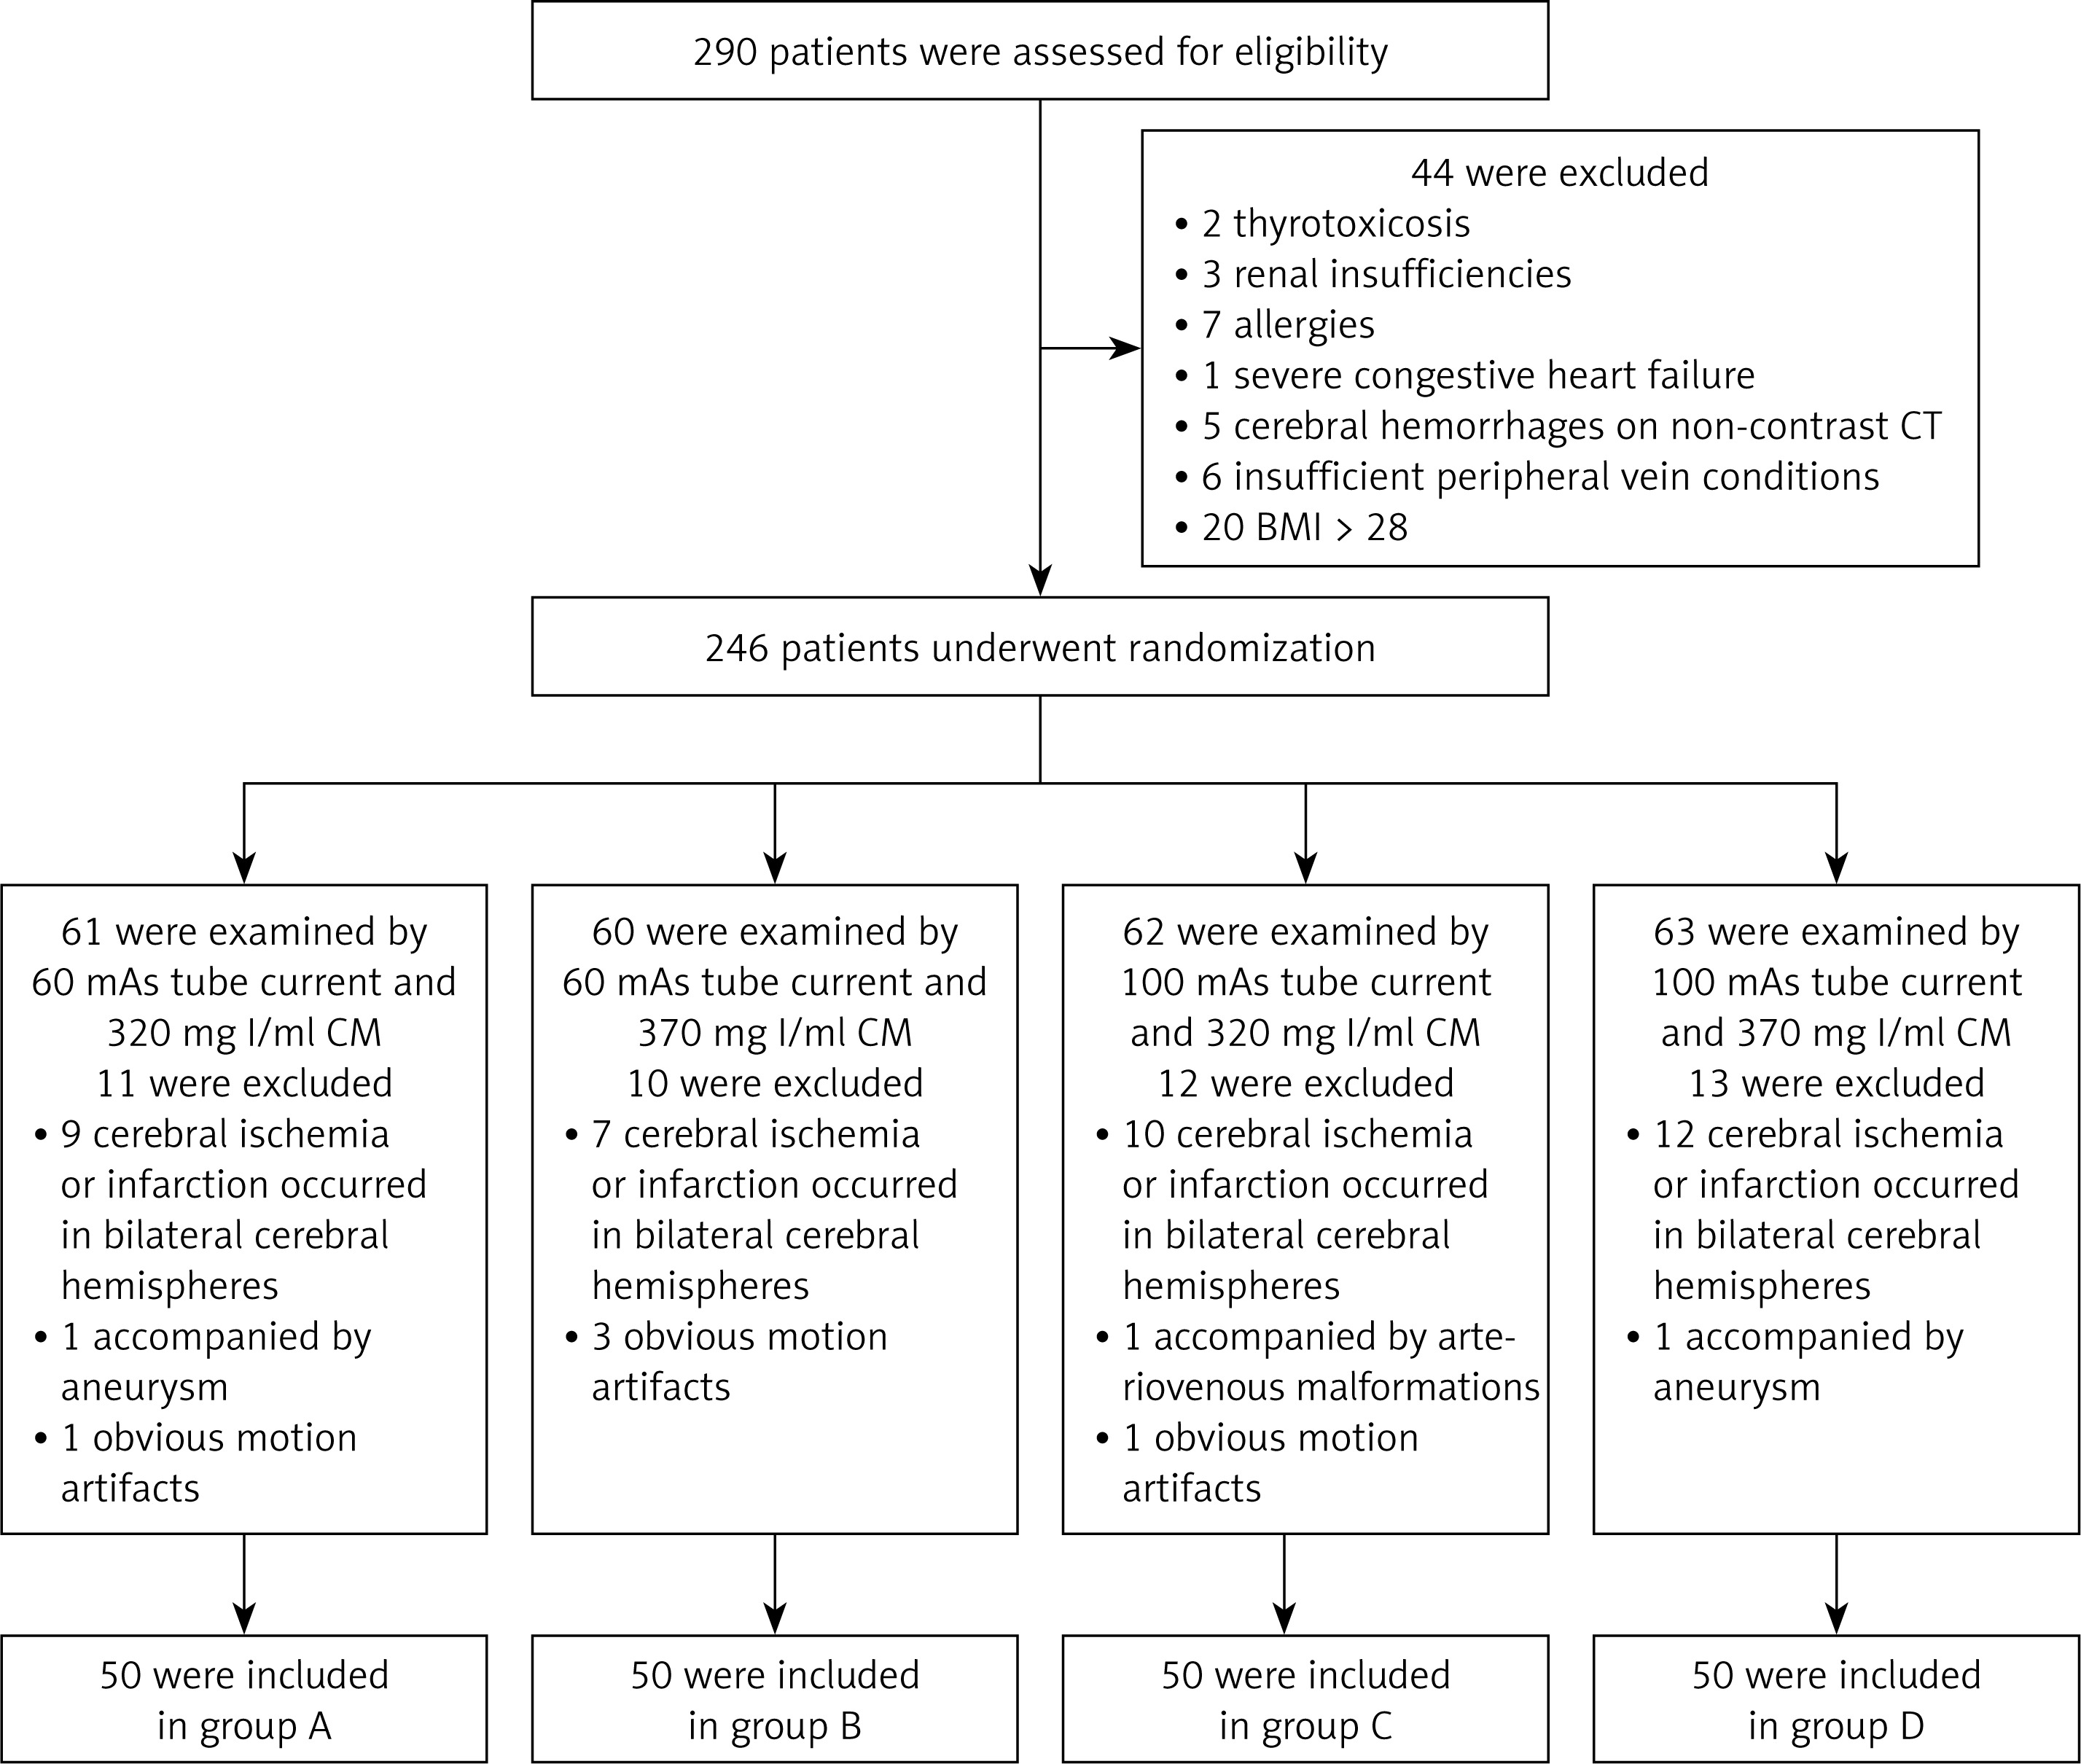
In order to analyze the IQ of the CTP source images, SNRs from five regions of interest (ROIs), which were selected at the basal ganglia level placed at the non-ischemic hemisphere of the temporal maximum intensity projection (tMIP), were calculated. The SNR was calculated using the following equation: SNR = mean of the maximum enhancement/noise (standard deviation). These five ROIs were in the frontal white matter, head of the caudate nucleus, lentiform nucleus, thalamus, and occipital white matter. The tMIP was derived from the CTP source images, which displays the maximum tissue enhancement in Hounsfield units for each pixel based on the time-attenuation curve (TAC). The mean of the maximum enhancement and noise from all pixels were measured within each ROI. The mean of each perfusion parameter was measured for the CBV, CBF and MTT maps, respectively, and the five ROIs were consistent with the tMIP. The methods used to achieve the quantitative parameters are presented in Figure 1.
Figure 1
Five ROIs in the non-ischemic hemisphere at the basal ganglia level of the tMIP were selected in the frontal white matter (ROI 1), the head of the caudate nucleus (ROI 2), the lent form nucleus (ROI 3), the thalamus (ROI 4), and the occipital white matter (ROI 5). The mean of the maximum enhancement and standard deviation (A) were measured within the ROI. The five ROIs were applied to the perfusion parameter maps at the same level, and the mean CBV (B), CBF (C) and MTT (D) were measured
Qualitative image analysis
The qualitative perfusion image analysis was independently performed by two radiologists with 12 and 5 years of experience in neurovascular imaging. The overall diagnostic image quality for the perfusion maps were rated using a 5-point scale for each patient (1 – unacceptable/non-diagnostic; 2 – poor, diagnostic confidence significantly reduced; 3 – moderate, but sufficient for diagnosis; 4 – good; 5 – excellent) [11]. Before the start of the assessment, the readers were instructed on the criteria for image grading, and together, they assessed 10 test cases that were not included in the study.
Statistical analysis
The software program SPSS 17.0 (SPSS Inc., Chicago, USA) was used to conduct the statistical analysis. Continuous variables were expressed as mean ± standard deviation (SD). Discontinuous variables were expressed as percentages (%). For multiple comparisons, each value was compared by one-way ANOVA after Dunnett’s test, with each dataset conforming to the normal distribution, while non-normally distributed continuous data were compared using non-parametric tests. The counting data were tested by the χ2 test. The comparison of age, body mass index and various RD parameters was analyzed by one-way ANOVA. The analysis of variance of factorial design was used to evaluate the statistical differences between the main effects of RD and CM iodine concentrations, and the interaction of these two factors for the mean of maximum enhancement, noise, SNR, and each perfusion parameter (CBV, CBF and MTT) among the four groups. The Kruskal-Wallis test was used to compare the statistical differences between the qualitative assessment results in each group, and κ analysis was used to evaluate the consistency between the two radiologists. A κ value higher than 0.75 was regarded as consistent, a value within 0.40–0.75 was regarded as fair, and a value of < 0.40 was regarded as poor. Value of p < 0.05 was considered statistically significant.
Patient demographics
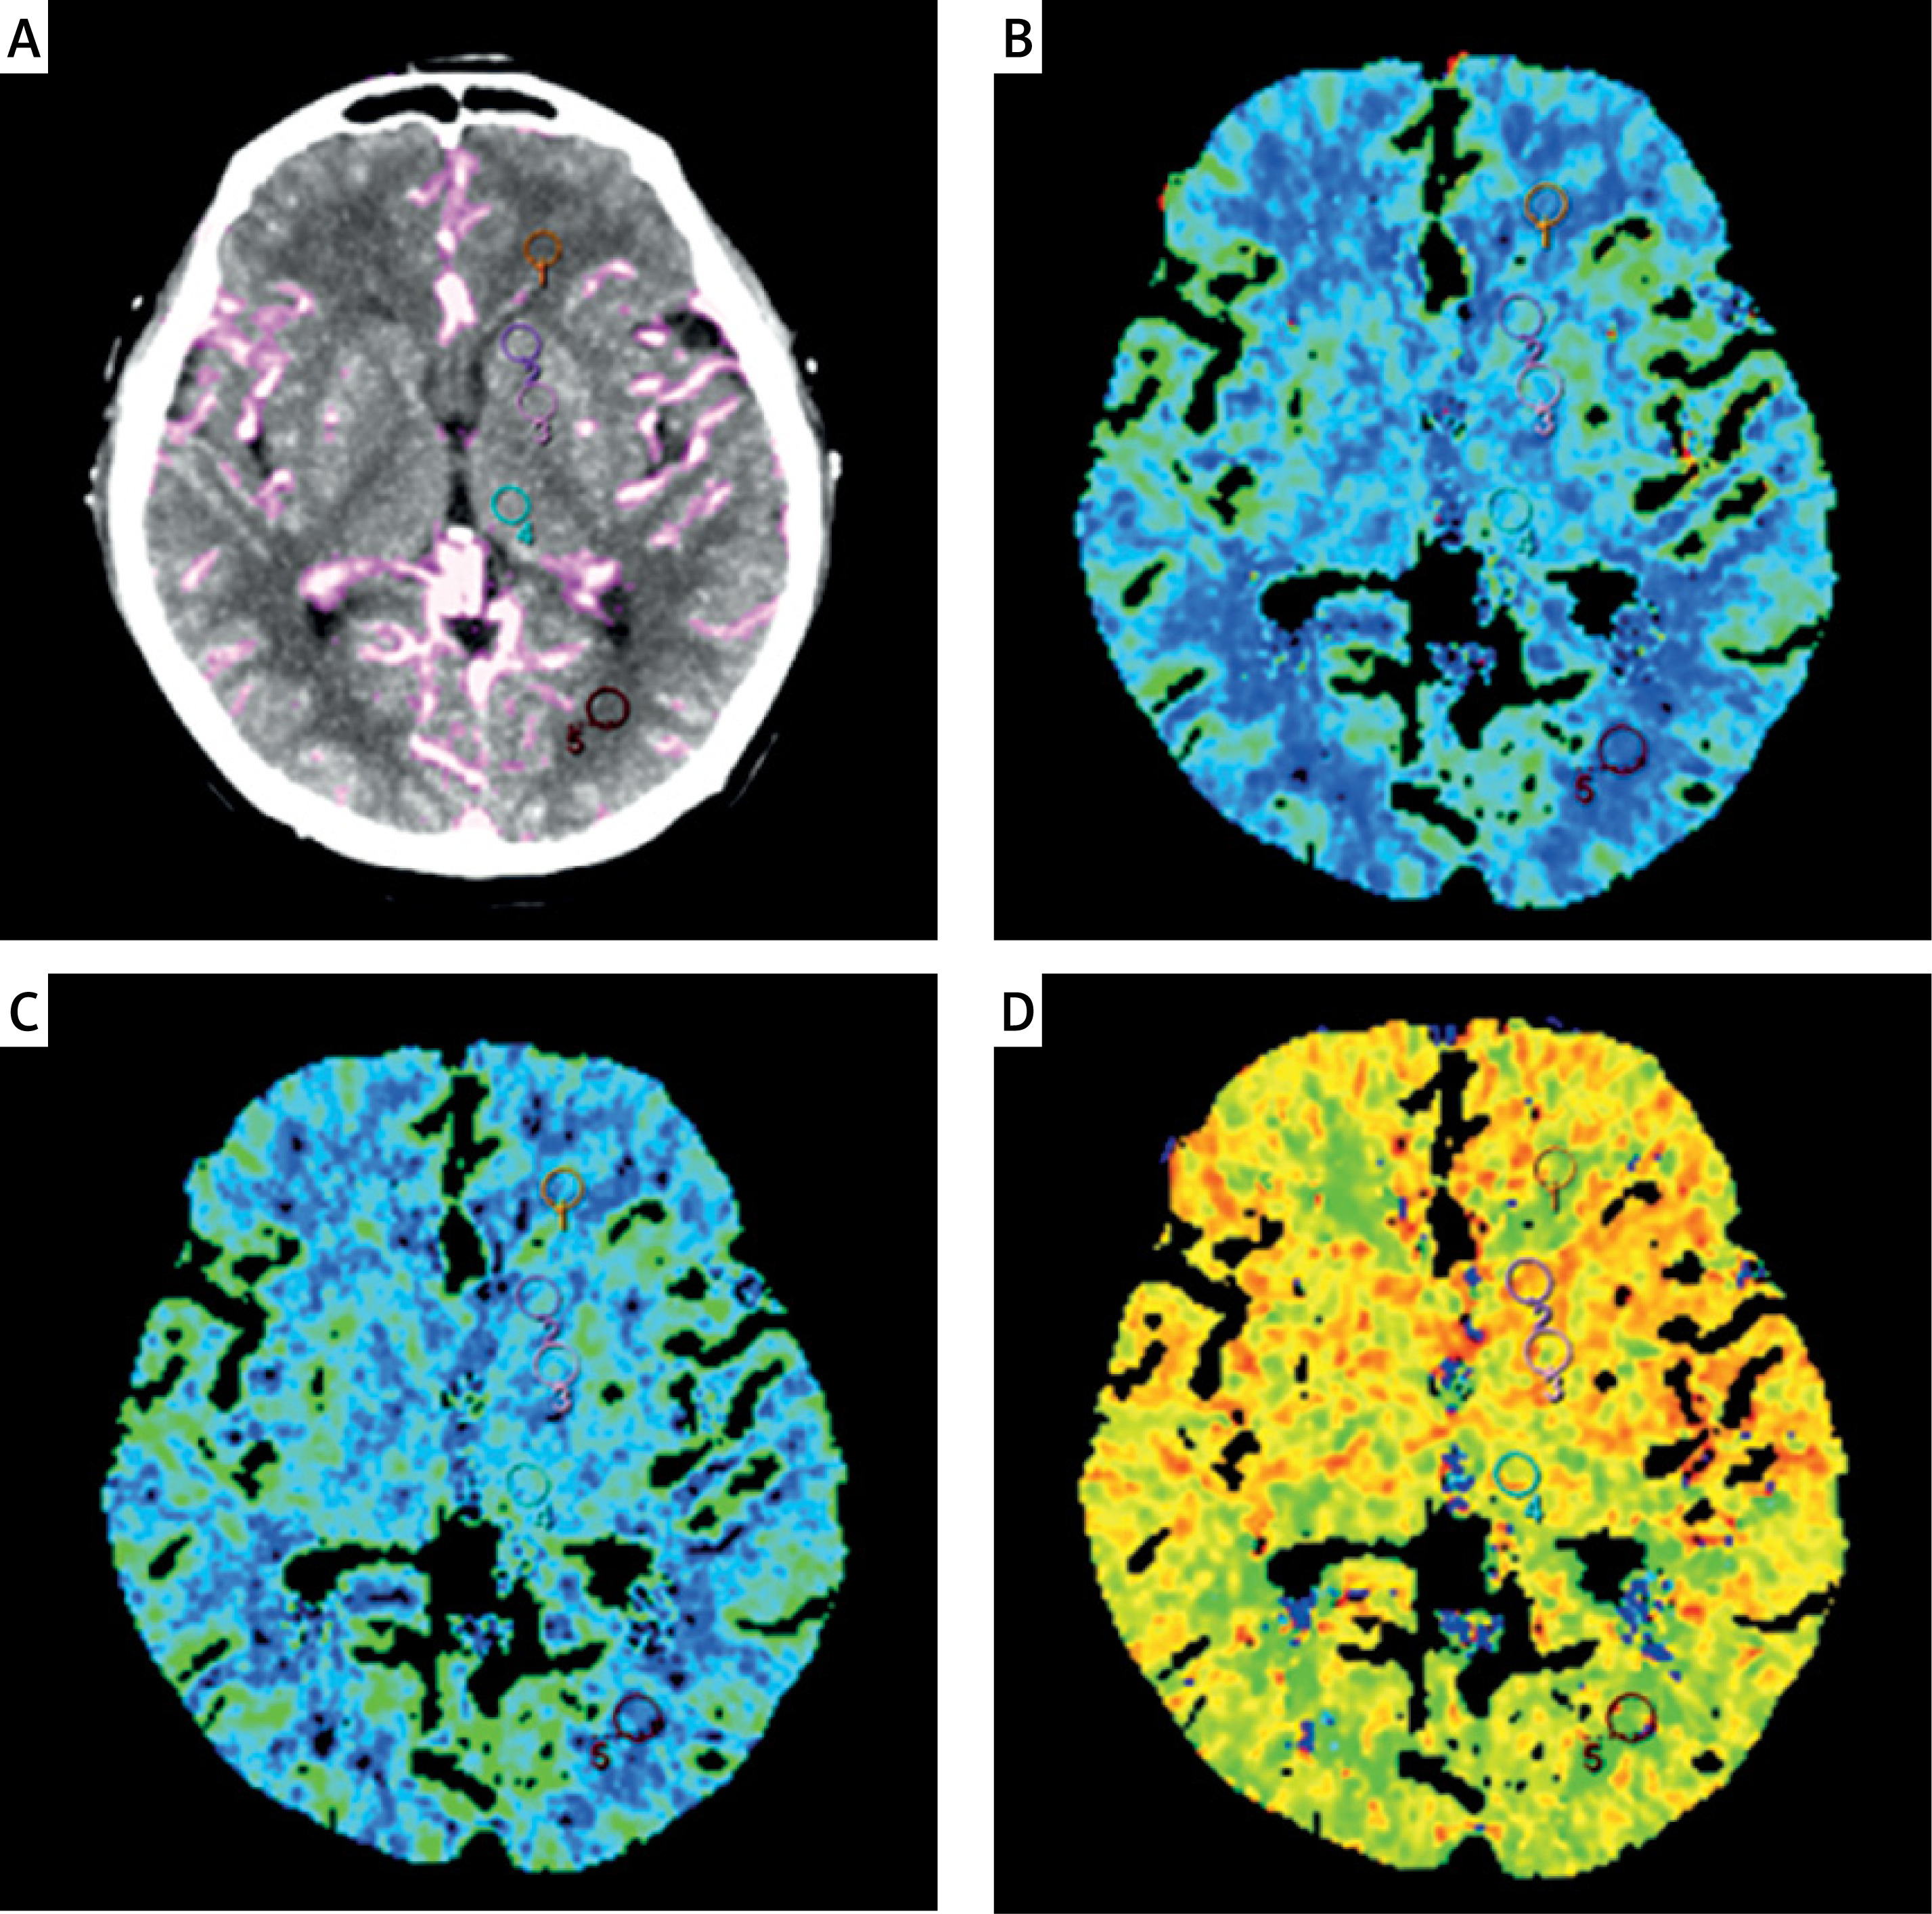
A total of 290 patients underwent non-contrast CT and CTP for eligibility in the trial. Among these patients, 90 patients were excluded, while the remaining 200 patients (132 males and 68 females; age range: 49–81 years old, mean age: 62.5 years old) were included in the final analysis. The eligibility of these patients is summarized in Figure 2. The detailed characteristics of the patient population are presented in Table I. There was no significant difference in age, gender and body mass index among the four groups (p > 0.05).
Radiation dose
The RDs represented by CTDIvol, DLP and ED in groups A and B were 40% lower than in groups C and D (96 mGy, 768 mGy/cm and 1.77 mSv vs. 160 mGy, 1,280 mGy/cm and 2.94 mSv). The dose parameters are summarized in Table I.
Quantitative image analysis
There was no significant difference in SNR among all groups. The main effects of the RD and CM iodine concentrations and the interactions were not statistically significant, in terms of the differences in SNR values in all ROIs for each group. The maximum enhancement of all ROIs on the tMIP images in groups A and B were higher than those in groups C and D, demonstrating a significant RD main effect (p < 0.01, for all ROIs). The image noise of all ROIs was lower in groups A and B than in groups C and D, demonstrating a significant RD main effect (p < 0.01, for ROI 1 and ROI 5; p < 0.05, for ROI 2, ROI 3 and ROI 4). In the frontal white matter only, the maximum enhancement and noise in groups A and C with low iodine concentrations of CM were significantly higher than those in groups B and D, demonstrating a significant main effect of CM iodine concentration (p < 0.05). The interaction of RD and CM iodine concentrations exhibited no significant differences, in terms of maximum enhancement and noise, among all ROIs in the four groups.
Comparing the perfusion parameters, the CBV values for all ROIs in groups B and D with high iodine concentrations were significantly higher than those in groups A and C, demonstrating a significant effect of CM iodine concentration (p < 0.05). The CBF values in the caudate nucleus head (ROI 2) in groups A and B were higher than the values in groups C and D, showing a significant RD effect (p < 0.05). No other ROI exhibited such an effect. Furthermore, the main effects of the RD and CM iodine concentrations and the interactions were not statistically significant, in terms of the differences in MTT values in all ROIs from each group. The detailed results for maximum enhancement, SNR, CBV, CBF and MTT for the five ROIs in the four groups are summarized in Tables II–V.
Table II
Comparison of maximum enhancement and noise in the four groups
Table III
Comparison of SNR in the four groups
Table IV
Comparison of CBV and CBF in the four groups
Table V
Comparison of MTT in the four groups
Qualitative image analysis
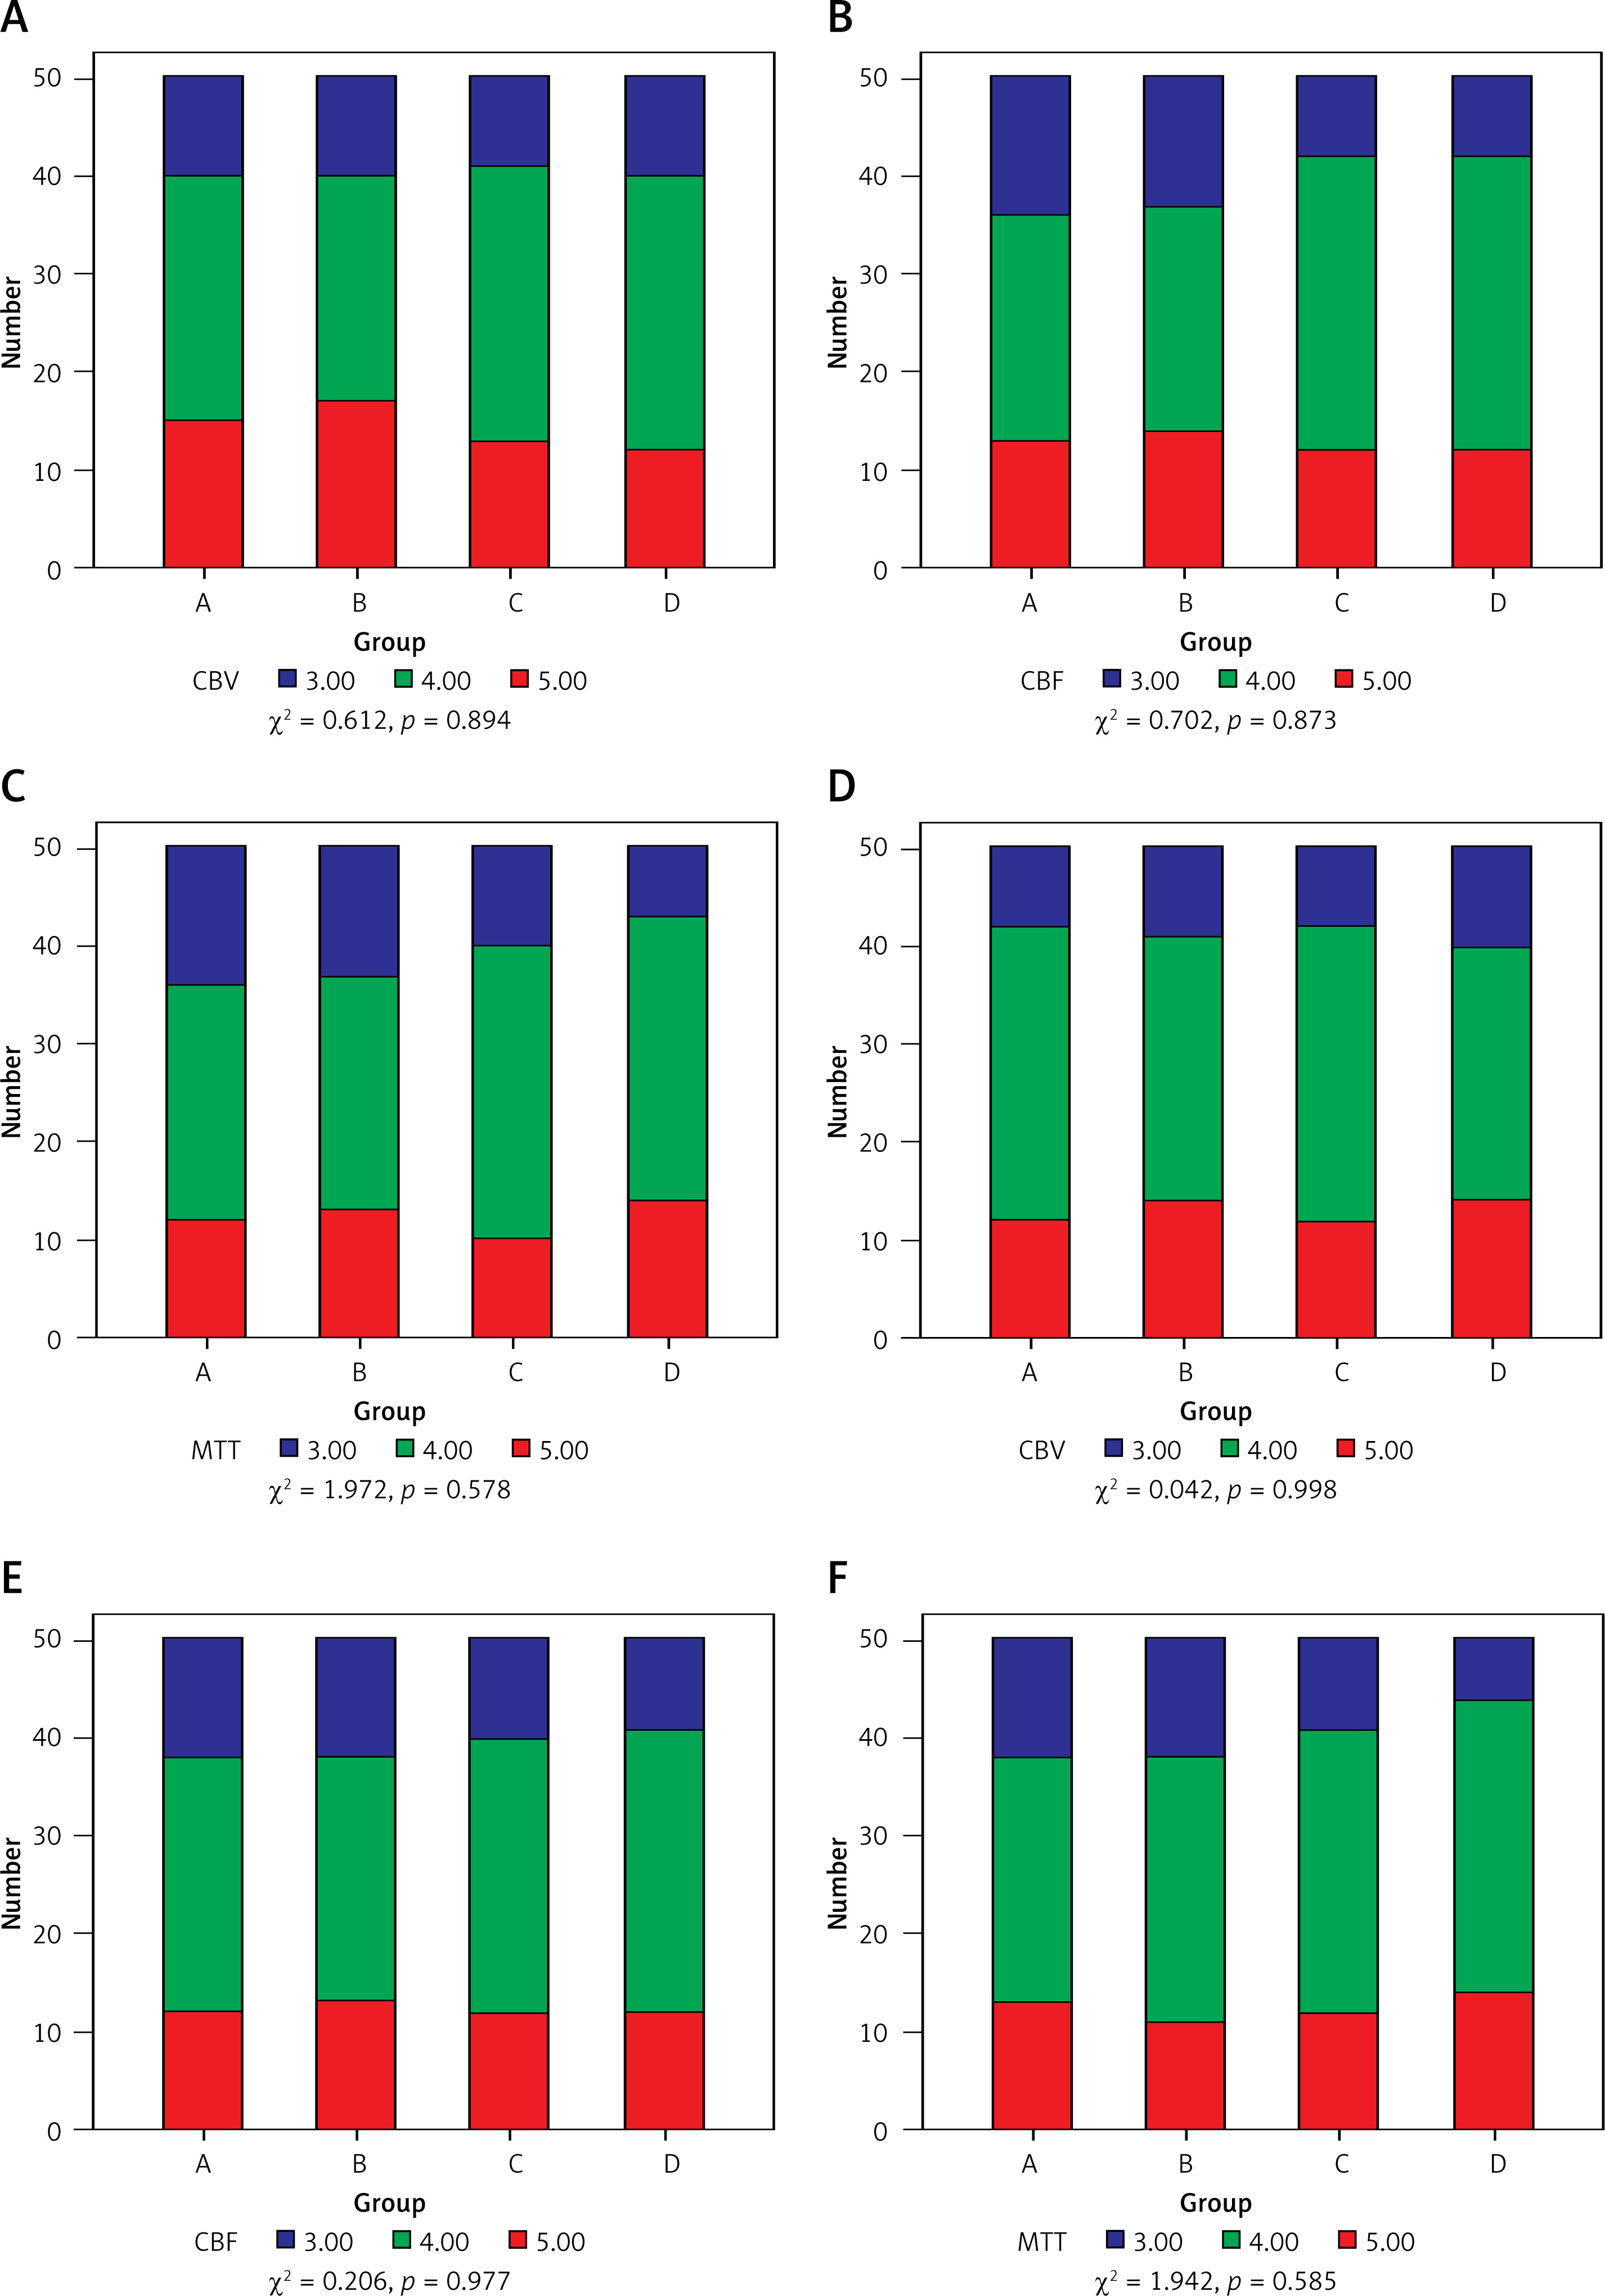
There were no significant differences in the qualitative image evaluation among the four groups for any of the perfusion image sets, demonstrating that the IQ from each group of perfusion maps met the requirements for imaging diagnosis. In terms of the consistency analysis, the κ values for the CBV in groups B and C were fair (0.742 and 0.746, respectively), while for groups A and D, these values, as well as the CBF and MTT in each group, were all consistent (κ value: 0.753–0.811). The results of the IQ assessment undertaken by the two radiologists for each group are presented in Figures 3, 4.
Discussion
To the best of our knowledge, the present study is the first to use a factorial design analysis to explore the effects of the simultaneous reduction of tube current and CM iodine concentration on the IQ of CTP source images and perfusion maps [12, 13]. Previously, a set of studies have shown that the IQ of CTP significantly decreased when the tube current dropped to 50 mAs or lower [14, 15]. Therefore, the lower tube current was reduced to 60 mAs in the present study to ensure an acceptable image quality. König et al. [16] compared the IQ of the CTP obtained with an iodine concentration of 300 mg I/ml and 400 mg I/ml, and the same injection rates between groups. The results revealed that higher IDRs resulted in significantly higher maximum enhancement, and a higher iodine concentration was beneficial for increasing the contrast between the gray and white matter in the perfusion images. However, when the same IDR and total iodine load were fixed among the groups, the contrast enhancement of different concentrations of CM tended to be consistent in the angiographies [17, 18], while evidence showing such effects on the perfusion imaging datasets is rare. In the present study, two CMs with different iodine concentrations (320 mg I/ml vs. 370 mg I/ml) were selected to determine the potential effects of CM concentrations on CTPs with a constant IDR and under low-tube current scanning. These results revealed that higher concentrations led to higher CBV values in the perfusion maps.
In the present study, both maximum enhancement and noise increased in the tMIP image in groups A and B, and these exhibited a significant RD main effect, while the SNR was not significantly affected by the changes in RD. Previous studies have also revealed that a decrease in the X-ray penetration ability caused by reduced RD can significantly increase the maximum enhancement in the CTP source image [14, 15, 19, 20]. The reason for the increase in maximum enhancement in these cases was that the tube current was lower, while it remains unclear whether the other conditions were constant. The most likely cause is that when the tube current dropped to a certain extent, the Philips scanner automatically adjusted the kV spectrum to ensure that the IQ of the original image would be acceptable.
Since the present study used a constant IDR when injecting the CM, theoretically, the contrast concentration in brain tissues should not be significantly different. Therefore, the difference in CM iodine concentration has no significant main effect on the tMIP images. In the present study, the SNR was not significantly affected by the changes in RD, indicating that the decrease in RD causes an increase in image noise, and increases the maximum enhancement. Therefore, the SNR is kept relatively stable. This also confirms the feasibility of further reducing RD, while maintaining a diagnostically acceptable image quality.
It is noteworthy that based on the findings from the perfusion parameters, although the IDR was adjusted to be the same, a higher CM concentration led to a significantly higher CBV value. However, there was no significant difference in the results for CBF and MTT. This may be due to the fact that the CBV value was calculated as the area under the time attenuation curves in a parenchymal region, divided by the arterial area under the TAC. Regardless of the fixed IDR used, there is still a significant difference in the morphology of TAC for the first pass of CM with different iodine concentrations [5, 21]. When AIS occurs, the CBV becomes a key parameter that distinguishes between the cerebral infarction core and ischemic penumbra [6, 22, 23]. Therefore, it is still prudent to use a CM with low iodine concentration in the CTP. Furthermore, in the case of the same IDR, compared with the low iodine concentration, the use of a CM with high iodine concentration can reduce the rate of bolus injection. This would be beneficial for patient comfort, and reduce the risk of extravasation [24–26].
There were several limitations in the present study. First, only the image quality for different combinations of tube current and CM iodine concentration on the CTP in normal brain tissue was evaluated. Hence, the ischemic and infarcted tissue remains unknown, and should be further researched. Second, the present study shows that the alteration in CM iodine concentration changes the CBV in normal brain tissue, and the apparent decrease in CBV is a vital parameter for identifying cerebral ischemia and infarction. Therefore, further research is needed to assess the impact of different combinations of RD and CM concentration on CTP, image quality, and even the diagnosis for ischemic and infarcted brain tissues. Third, the present study was only a single-center trial, and the sample size was limited. Fourth, the present study only investigated patients with acute ischemic stroke, and there were insufficient data on patients with other diseases. The value of CT perfusion by lower low-tube current in different diseases remains unknown, and should be further researched in the future.
In conclusion, the reduction in tube current from 100 mAs to 60 mAs for cerebral CT perfusion leads to a 40% reduction in radiation dose without sacrificing image quality.