Introduction
Thyroid hormone synthesis by thyroid peroxidase (TPO) requires iodide (I–) supply to the thyroid follicle lumen. Iodide is actively transported to the thyroid cell by the Na+/I– symporter (NIS; SLC5A5) located on the basolateral membrane of thyroid follicular cells. Efflux of iodide to the lumen, on the other hand, is conducted by the electroneutral anion exchanger pendrin (PDS; SLC26A4) expressed on the apical membrane of the thyroid cell [1].
Human NIS is a 643-amino acid protein with 13 transmembrane domains and predicted molecular mass of around 65 kDa [2]. NIS maturation involves N-glycosylation of three asparagine residues yielding protein with a molecular mass of around 87 kDa [3]. NIS glycosylation is not absolutely required for, but greatly increases, protein activity, stability or membranous localization [4, 5]. PDS/SLC26A4 was initially identified and cloned as a gene mutated in Pendred syndrome, an autosomal recessive genetic disorder manifested by hearing impairment, goiter and reduced iodide organification. In the inner ear PDS, acting as a Cl–/HCO3 – exchanger, controls pH of the endolymph, whereas in the kidney, where it is also abundantly expressed, it is involved in urine pH and blood pressure control [6]. The role of PDS as the only thyrocyte apical membrane I– transporter has been questioned, since Pendred syndrome patients show only partial iodide organification impairment and mild thyroid symptoms and, in addition, PDS knockout mice do not present thyroid phenotype [7]. Therefore, it has been suggested that iodide efflux through the apical membrane of the thyroid cell might also be mediated by other transporters and the involvement of ANO1/TMEM16A, SMCT/AIT/SLC5A8, CFTR and CLC-5 was proposed [6, 8, 9]. PDS is a 780-amino acid protein with three putative N-glycosylation sites forming a glycoprotein with 12 transmembrane domains [10]. Unglycosylated PDS has a molecular weight of about 85 kDa, whereas glycosylated protein migrates in SDS-PAGE gels as a single band of 105–115 kDa [11–13]. PDS glycosylation was shown to be essential for protein activity and proper localization [13], but in another study opposite results were obtained [14].
Previously we and others have shown that TPO is expressed, apart from the thyroid, also in normal and cancerous human breast tissue [15, 16]. Moreover, we observed that TPO expressed in the breast tissue undergoes N-glycosylation, partially localizes to the membrane and shows enzymatic activity [17]. However, to perform its biochemical activity in the mammary gland tissue TPO needs iodide supply that might be mediated by NIS and PDS transporters. The capacity of human breast tissue for NIS-dependent I– accumulation has been widely studied [9]. NIS-mediated iodide transport in lactating mammary gland provides the only source of this essential micronutrient to newborns for thyroid hormone synthesis [18]. NIS expression in breast tissue is increased during lactation and regulated hormonally by estradiol, oxytocin and prolactin, whereas non-lactating mammary gland lacks this iodine transporter [9, 18, 19]. Multiple reports have shown that NIS levels are greatly increased in tumor breast in comparison to normal breast and peri-tumoral breast tissue. Thus radioiodide administration was proposed as a diagnostic and therapeutic tool in breast cancer management [9, 18, 20, 21]. However, although in lactating mammary gland, as in thyroid tissue, NIS expression is confined to the basolateral plasma membrane of the alveolar and ductal epithelial cells, in breast cancer tissue the protein shows mainly cytoplasmic and rather weak or undetectable membrane staining. Moreover, I– accumulation is observed only in a small subset of NIS-positive breast tumors [18, 20, 22]. Therefore, there have been attempts to improve NIS expression, proper membranous localization and thus functional activity by pharmacological intervention or targeted NIS gene therapy [23–25]. PDS expression was observed in mouse mammary gland, where it was also upregulated by lactation and prolactin stimulation. Moreover, PDS expression in lactating breast tissue was confined to alveolar cells without specific localization to the apical or basolateral membrane [26]. In human breast, on the other hand, PDS expression was analyzed only in a limited number of patient tissue samples or by high-throughput methods, where it showed downregulation in cancer tissue [19, 27]. Therefore, taking into account the apparent lack of comprehensive analysis of iodide transporters in tumor and peri-tumoral breast tissue we decided to complement our previous TPO study by investigating NIS and PDS levels in the same group of subjects.
We believe that the current research will allow us to gain a better understanding of iodide metabolism in breast cancer.
Material and methods
A more extensive description of experimental procedures is provided in the Supplementary Material and Methods section.
Reagents
Reagents of analytical grade were obtained from Sigma-Aldrich (St. Louis, MO, USA) or Merck-Millipore (Temecula, CA, USA) unless otherwise specified.
Rabbit antibodies to synthetic peptide 1 (aa 1-15; pp1) and peptide 5 of PDS (aa 768–780; pp5) were generated in our laboratory [12]. Rabbit anti-peptide antisera to specific synthetic peptide 4 (aa 560-579; pp4) and peptide 5 (aa 629-643; pp5) of NIS were prepared following standard procedures in general as described for anti-PDS antibodies.
Study group and sample collection
The patient cohort included 41 subjects with nonmetastatic disease, who underwent mastectomy or breast-conserving treatment in Maria Skłodowska-Curie Memorial Cancer Center and Institute of Oncology (Warsaw, Poland). For RT-qPCR and Western blotting collected paired samples of tumor and surrounding normal breast tissue were immediately frozen in liquid nitrogen and kept at –70°C before further processing. For immunohistochemistry (IHC) formalin-fixed paraffin-embedded tissue specimens were sectioned using standard procedures. Histological analysis, tumor grading and staging, as well as estrogen receptor (ER), progesterone receptor (PGR) and human epidermal growth factor receptor 2 (HER2) status analysis were performed as a routine post-surgery diagnostic procedure. Archived thyroid tumor and peri-tumoral tissues, as well as Graves’ disease thyroid tissue samples, served as controls. The research was performed according to the Declaration of Helsinki, and the study design was approved by the medical ethics committees at the Memorial Cancer Center and Institute of Oncology and at the Center of Postgraduate Medical Education (Warsaw, Poland). All patients provided written informed consent.
Cell culture
MCF-7 and MDA-MB-231 cell lines were from the American Type Culture Collection (ATCC; Manassas, VA, USA). The Nthy-ori 3-1 cell line (referred herein as NTHY) was from the European Collection of Authenticated Cell Cultures (ECACC; Wiltshire, UK). Cells were cultured as already described [17].
Total RNA isolation and quantitative real-time PCR (RT-qPCR)
Total RNA was isolated, reverse-transcribed and analyzed on a CFX Connect real-time cycler (Bio-Rad, Munich, Germany) using Maxima SYBR Green/Fluorescein qPCR Master Mix (Thermo Fisher Scientific) as already described [15]. RT-qPCR primer sequences were as follows: NIS 5′-CCTCATCCTGAACCAAGTGAC-3′ and 5′-CTTAGCATCACCACGACCTG-3′ (detecting all NIS splice variants spanning the region from the exon 3/4 junction to exon 5); PDS 5′-CGGATATGGTCTCTACTCTGC-3′ and 5′-TGCTGCTGGATACGAGAAAGTG-3′ (detecting all PDS splice variants spanning the junction of exons 4 and 5 [27]); 18s rRNA 5′-CCAGTAAGTGCGGGTCATAAG-3′ and 5′-CCATCCAATCGGTAGTAGCG-3′.
Immunohistochemistry
Tissue sections (3–4 μm) were subjected to dewaxing, deparaffinization and rehydration, followed by heat antigen retrieval in target retrieval solution (TRS, pH 6.0; Dako) for 20 min at 98°C. Next, tissue sections were incubated overnight with rabbit anti-PDS (anti-pp5) or anti-NIS (anti-pp4 and anti-pp5) antibodies at 0.2 μg/ml in Antibody Diluent with Background Reducing Component (Dako) in a humid chamber at 4°C. Following endogenous peroxidase quenching (0.3% H2O2, 15 min) slides were incubated with secondary antibody REAL EnVision Detection System (Dako) for 30 min, visualized using 3′3′-diamino-benzidine (DAB; Dako) and counterstained with hematoxylin (Mar-Four, Lodz, Poland). Next, tissue sections were mounted and examined under a light microscope (Olympus BX41, Japan). Normal thyroid tissues were used as a positive control, whereas negative controls were prepared according to the standard procedure omitting primary antibodies. The results of immunohistochemical staining were evaluated by two independent expert researchers and scored according to the staining intensity as negative/0 or weakly/1+, moderately/2+ or strongly/3+ positive.
Western blotting
Total proteins were extracted from tissue samples and cell lines as already described ([15] and [17], respectively).
Pre-absorption of the primary antibody with its cognate peptide was performed by incubating IgG (final concentration 0.2 μg/ml) with the excess of appropriate peptide (final concentration 40 μg/ml) in 5% skimmed milk in Tris-buffered saline (TBS)-0.1% Tween 20 (TBST) for 2 h at room temperature.
Standard Western blot analyses were performed using PDS- or NIS-specific primary antibodies at 0.2 μg/ml in 5% skimmed milk/TBST by overnight incubation at 4°C, followed by secondary HRP-conjugated goat anti-rabbit IgG (Dako, Glostrup, Denmark) and visualization using SuperSignal West Dura Extended Duration Substrate (Thermo Fisher Scientific).
Immunocytochemistry
Cellular distribution of PDS was analyzed as already described [17]. Briefly, cells grown on uncoated cover glasses were fixed and permeabilized in methanol, followed by blocking 2% goat serum/2% BSA/PBS-0.1% Tween 20 and overnight incubation with rabbit anti-PDS antibodies (0.1 μg/ml in blocking buffer) in a humid chamber at 4°C. After staining with goat anti-rabbit IgG Alexa 488-conjugate (Thermo Fisher Scientific) cells were counterstained with 4′,6-diamidino-2′-phenylindole (DAPI), mounted and visualized using an LSM800 confocal microscope with the ZEN 2.1 software (Zeiss, Germany). Slides prepared without primary antibody served as a negative control.
Statistical analysis
Statistical calculations were performed using Statistica 12 software (StatSoft, Inc., USA). First, data were analyzed for a normal distribution and the homogeneity of variances. Next, the outliers, detected using the Tukey method, were excluded and further analysis was performed on 37 and 36 cases for PDS and NIS mRNA, respectively. RT-qPCR data for paired tumor and peri-tumoral breast tissue samples were compared using Wilcoxon’s test. The associations between the variables were evaluated using Spearman’s rank correlation coefficients. The effect of clinicopathologic features, as well as age of the patients, was evaluated using the Mann-Whitney U test. All results are presented as means ± SEM or SD from at least three replicates and p < 0.05 was considered statistically significant. The Cancer Genome Atlas (TCGA) data [28] were downloaded using UCSC Xena Functional Genomics Explorer (https://xenabrowser.net/) and analyzed using the Mann-Whitney U test.
Results
PDS and NIS expression in breast tumor tissue was analyzed using RT-qPCR, Western blotting and immunohistochemistry. For RT-qPCR analysis paired breast tumor and peri-tumoral tissue samples were obtained from forty-one patients and detailed clinicopathologic characteristics of the studied group are presented in Table I.
Table I
Descriptive statistics of the patient cohort (n = 41)
PDS and NIS mRNA levels in breast tumor and peri-tumoral tissue
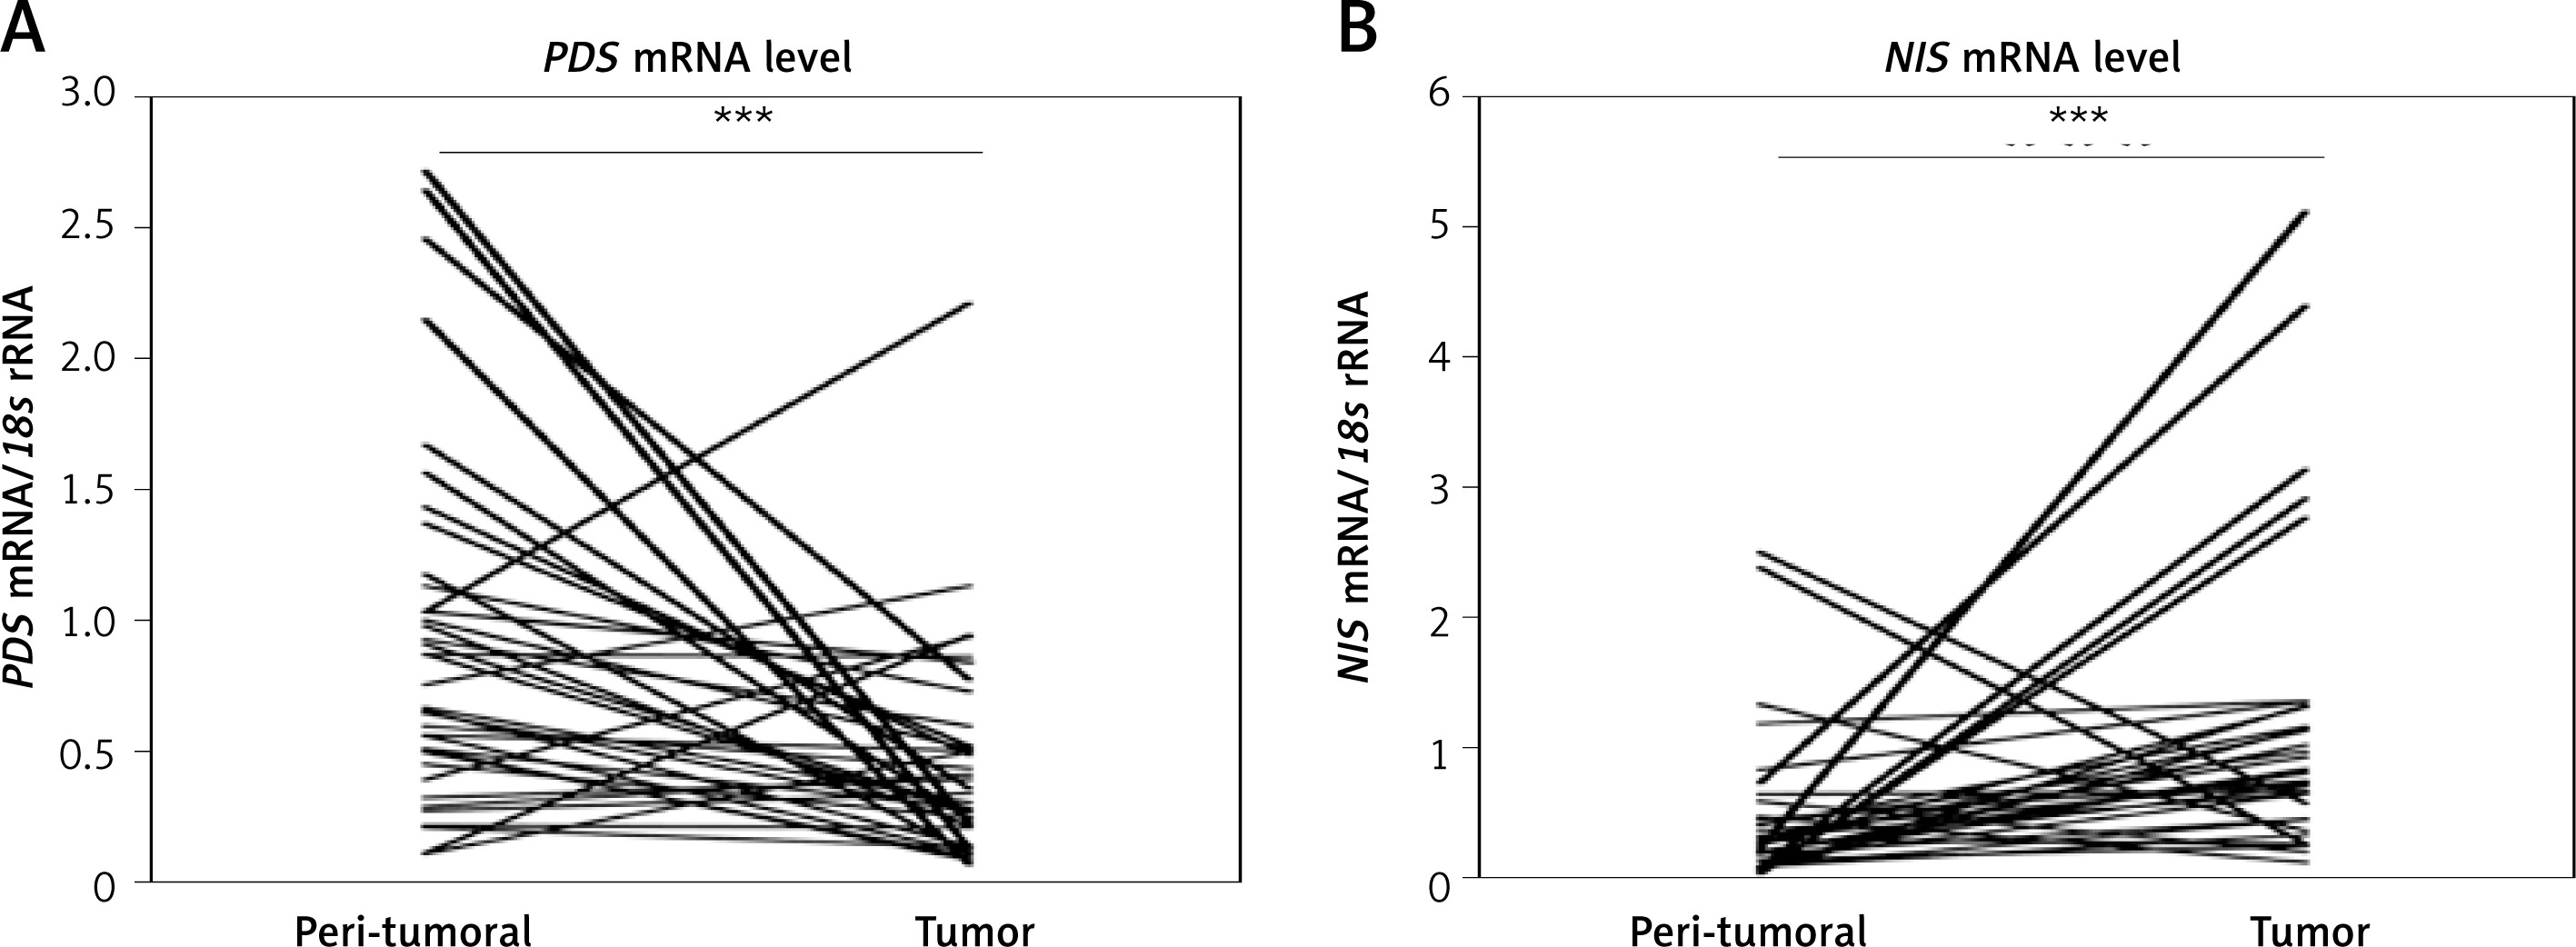
Analysis of PDS and NIS mRNA levels in paired breast tumor and peri-tumoral samples revealed high variability among patients. The respective mRNA level ranges were from 0.10 to 2.71 PDS mRNA/18s rRNA and 0.01 to 2.49 NIS mRNA/18s rRNA in normal breast tissue, and from 0.06 to 2.21 PDS mRNA/18s rRNA and 0.11 to 5.11 NIS mRNA/18s rRNA in tumor breast tissue. In general, PDS mRNA levels were decreased (breast tumor tissue 0.39 ±0.05; peri-tumoral tissue 0.90 ±0.11; p < 0.001; Figure 1 A), whereas NIS mRNA levels were increased (breast tumor tissue 1.23 ±0.20; peri-tumoral tissue 0.43 ±0.10; p < 0.001; Figure 1 B) in breast tumor tissue. Further statistical analysis revealed no correlation between mRNA levels of PDS and NIS, as well as TPO (TPO expression data were available from our previous study [15]), both in peri-tumoral and tumor breast tissue.
Figure 1
PDS and NIS mRNA expression in peri-tumoral and breast tumor tissue samples analyzed by RT-qPCR. A – PDS mRNA level is statistically significantly decreased in breast tumor tissue. B – NIS mRNA level is statistically significantly increased in breast tumor tissue
***P < 0.001, Wilcoxon signed-rank test.
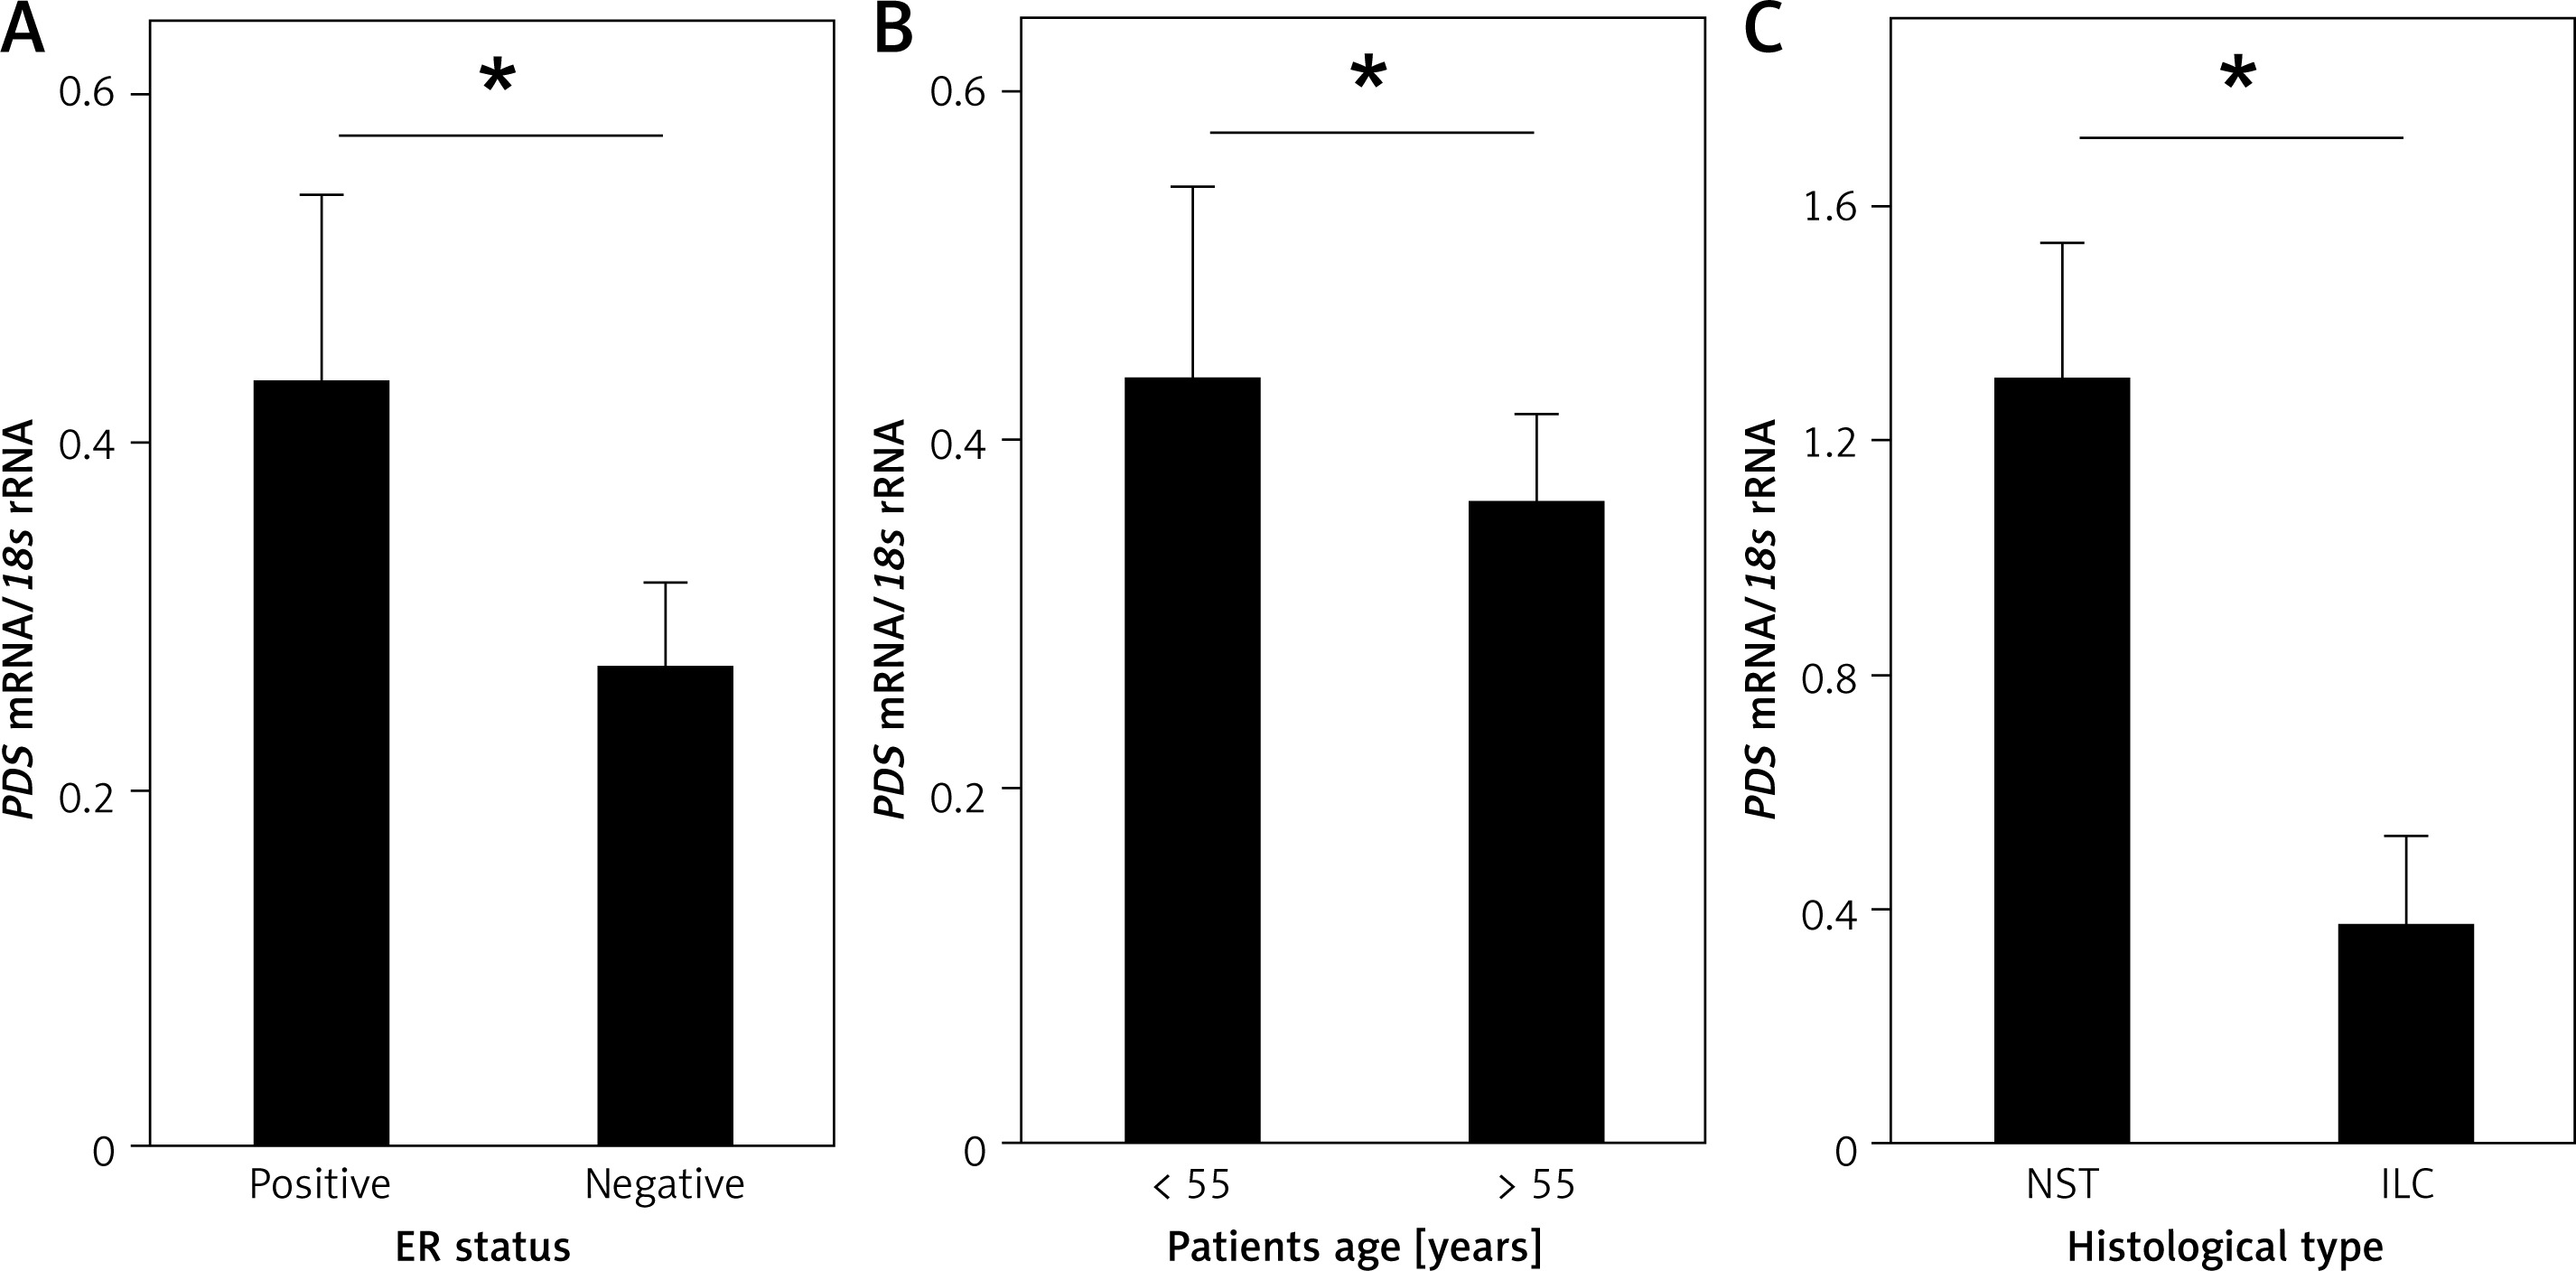
Further, the influence of clinicopathologic features, such as histological type of the tumor, tumor grade, tumor stage (TNM scale), lymph node involvement, tumor size, ER, PGR and HER2 status, as well as age of the patients, on PDS and NIS mRNA levels was evaluated. Among the studied parameters we detected a statistically significant association between PDS mRNA levels in tumor tissue and the ER status (Figure 2 A, Supplementary Table SI), as well as HER2 status in ER- and PGR-positive tumors (Supplementary Figure S1 E; Supplementary Table SI). PDS mRNA levels were also lowered in all HER2-positive tumors, but without reaching statistical significance (Supplementary Table SI; Supplementary Figure S1 E). Moreover, PDS mRNA levels in normal tissue were decreased in patients over 55 years old, i.e. mostly post-menopausal (Supplementary Table SI; Figure 2 B). For NIS mRNA expression, the only statistically significant relationship detected was between NST (invasive breast carcinoma of no special type) and ILC (invasive lobular carcinoma) histological types of the breast tumors (Supplementary Table SI; Figure 2 C).
Figure 2
Relationship of PDS and NIS mRNA expression with clinicopathologic characteristics of the studied patient cohort. A – PDS mRNA level is statistically significantly increased in ER-positive tumors. B – PDS mRNA level is statistically significantly decreased in normal tissues of older patients. C – NIS mRNA level is decreased in ILC tumors in comparison to NST tumors
*P < 0.05, Mann-Whitney U test. Data are shown as means ± SEM. ER – estrogen receptor, NST – invasive breast carcinoma of no special type, ILC – invasive lobular carcinoma.
Detection of PDS and NIS protein levels in breast tumor and peri-tumoral tissue specimens by immunohistochemistry
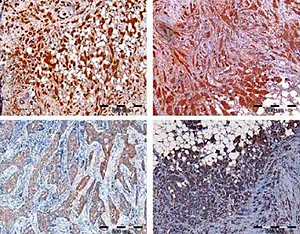
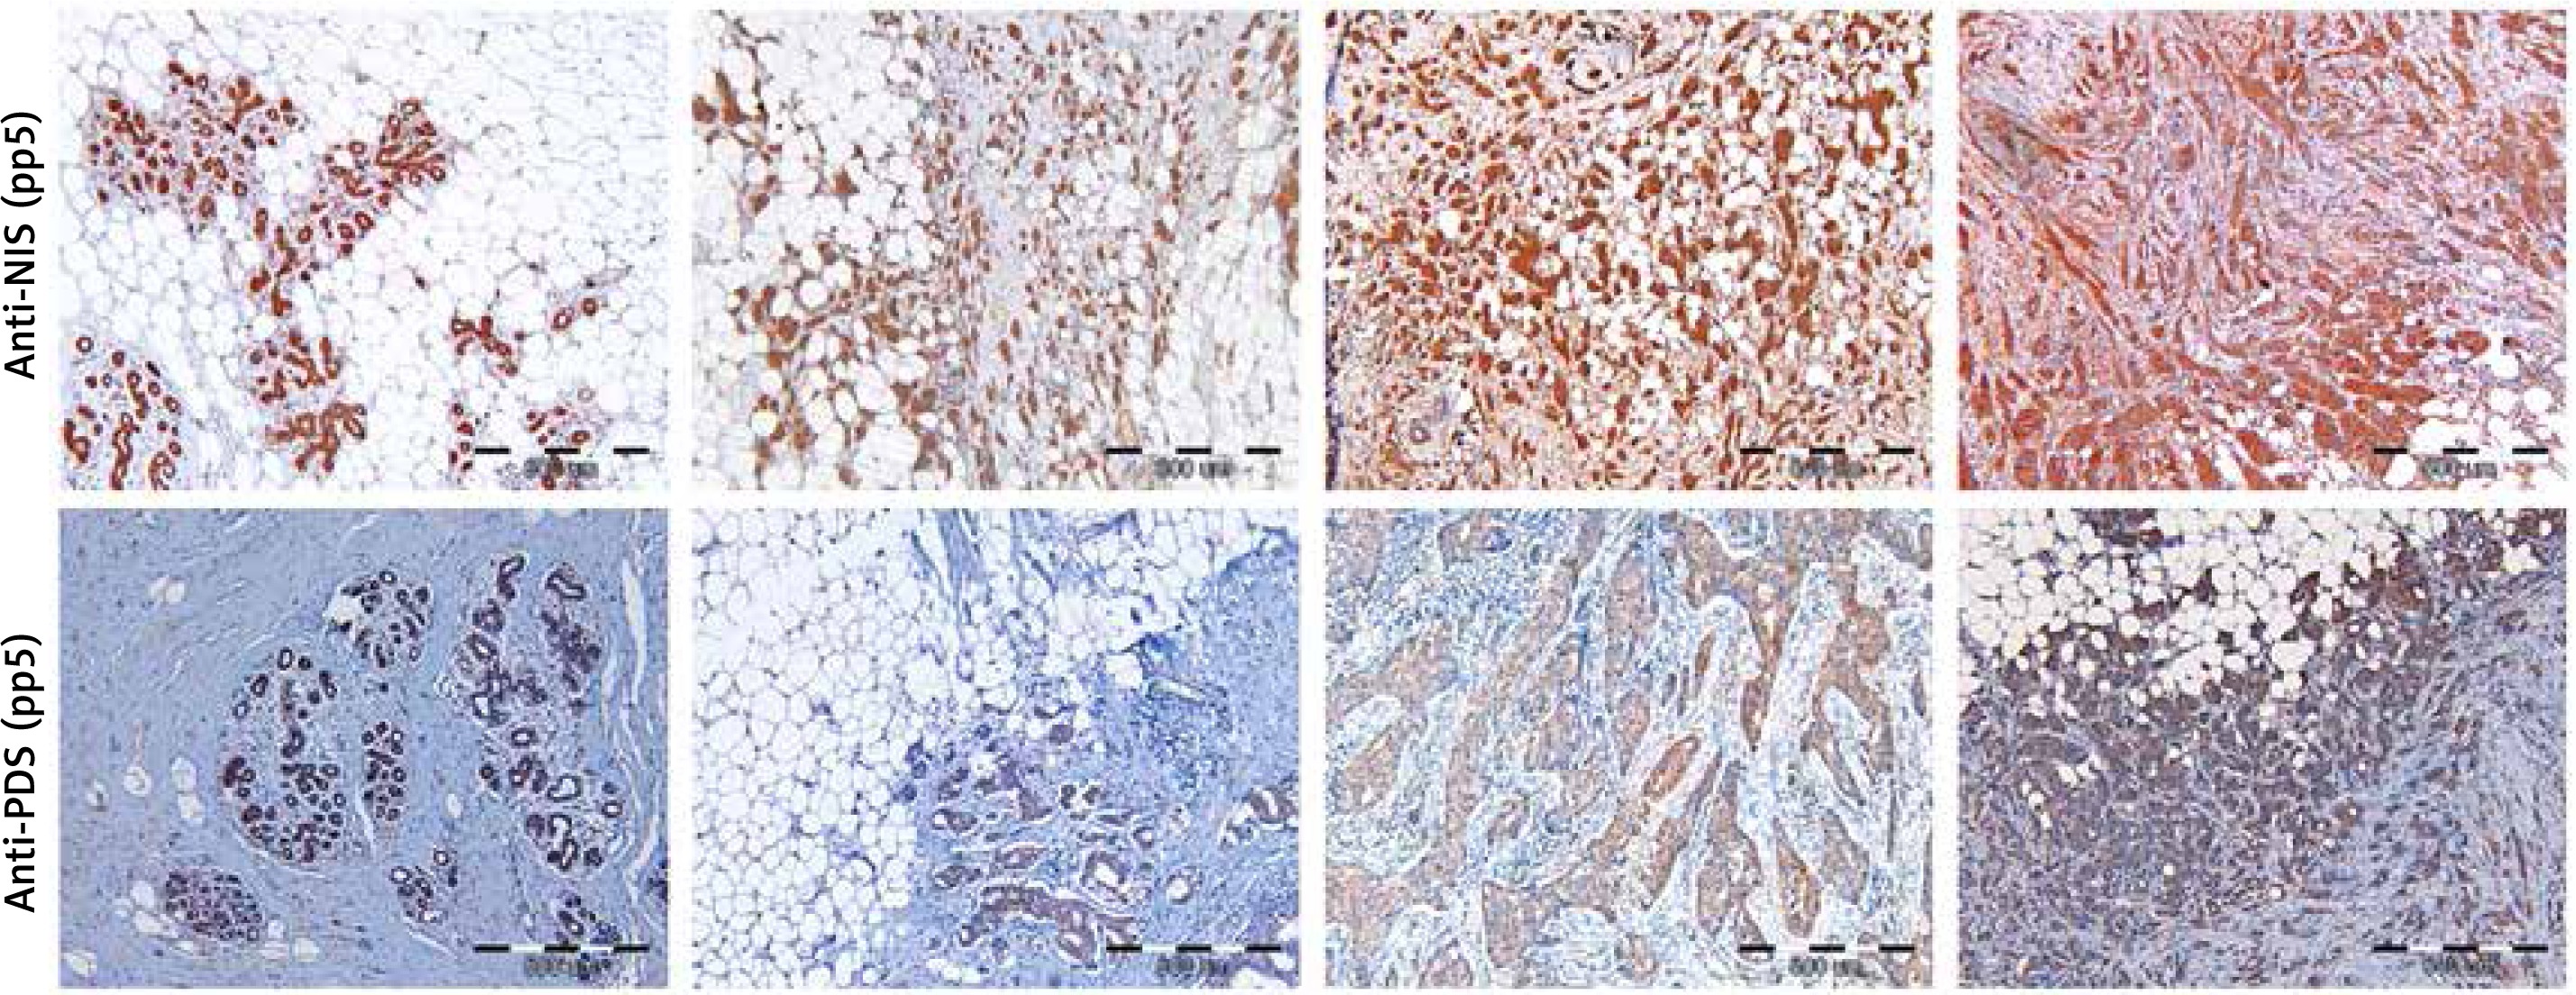
Initially, specificity of anti-NIS antibodies was verified by pre-absorption (Supplementary Figure S2 A), as well as immunohistochemistry analysis of normal thyroid tissue, which showed staining confined to the basal membrane of the cells surrounding thyroid follicles (Supplementary Figure S3 A). Specificity of anti-PDS antibodies applied in the current study was previously shown in cancerous and normal thyroid tissue samples [12] and additionally verified in the current study by pre-absorption (Supplementary Figure S2 B) and normal thyroid tissue staining (Supplementary Figure S3 B). Immunohistochemical analysis involved 37 breast tumor tissue specimens in the case of PDS protein, whereas NIS was analyzed in 43 (anti-pp5) or 41 (anti-pp4) breast tumor tissue sections. Representative images showing the range of PDS and NIS staining intensities are presented in Figure 3. For both proteins, positive staining with variable intensities was observed in both tumoral and peri-tumoral ductal tissue considered as normal breast epithelium. Among tested specimens 37 out of 37 samples (100%) were PDS-positive, with 19 cases (51%) scored 3+, 14 (38%) scored 2+ and 4 (11%) scored 1+. Anti-pp5 NIS antibodies stained positively 43 out of 43 samples (100%), with 21 (49%) cases scored 3+, 19 (44%) scored 2+ and 3 (7%) scored 1+. In general staining detected with anti-pp5 NIS antibodies was stronger than that observed for anti-pp4 NIS antibodies, but signal intensities detected for both anti-NIS antibodies were correlated between the patients. Both PDS and NIS staining was predominantly cytoplasmic.
Figure 3
Immunohistochemical images showing range of staining intensities detected in breast peri-tumoral and tumor tissue specimens using anti-NIS and anti-PDS antibodies. A – Breast tissues stained with anti-pp5 NIS antibody; B – breast tissues stained with anti-pp5 PDS antibody; leftmost panels – normal breast tissues, other panels – tumor breast tissues. Scale bar equals 500 μm
PDS and NIS protein levels analyzed in breast tumor and peri-tumoral tissues by Western blotting
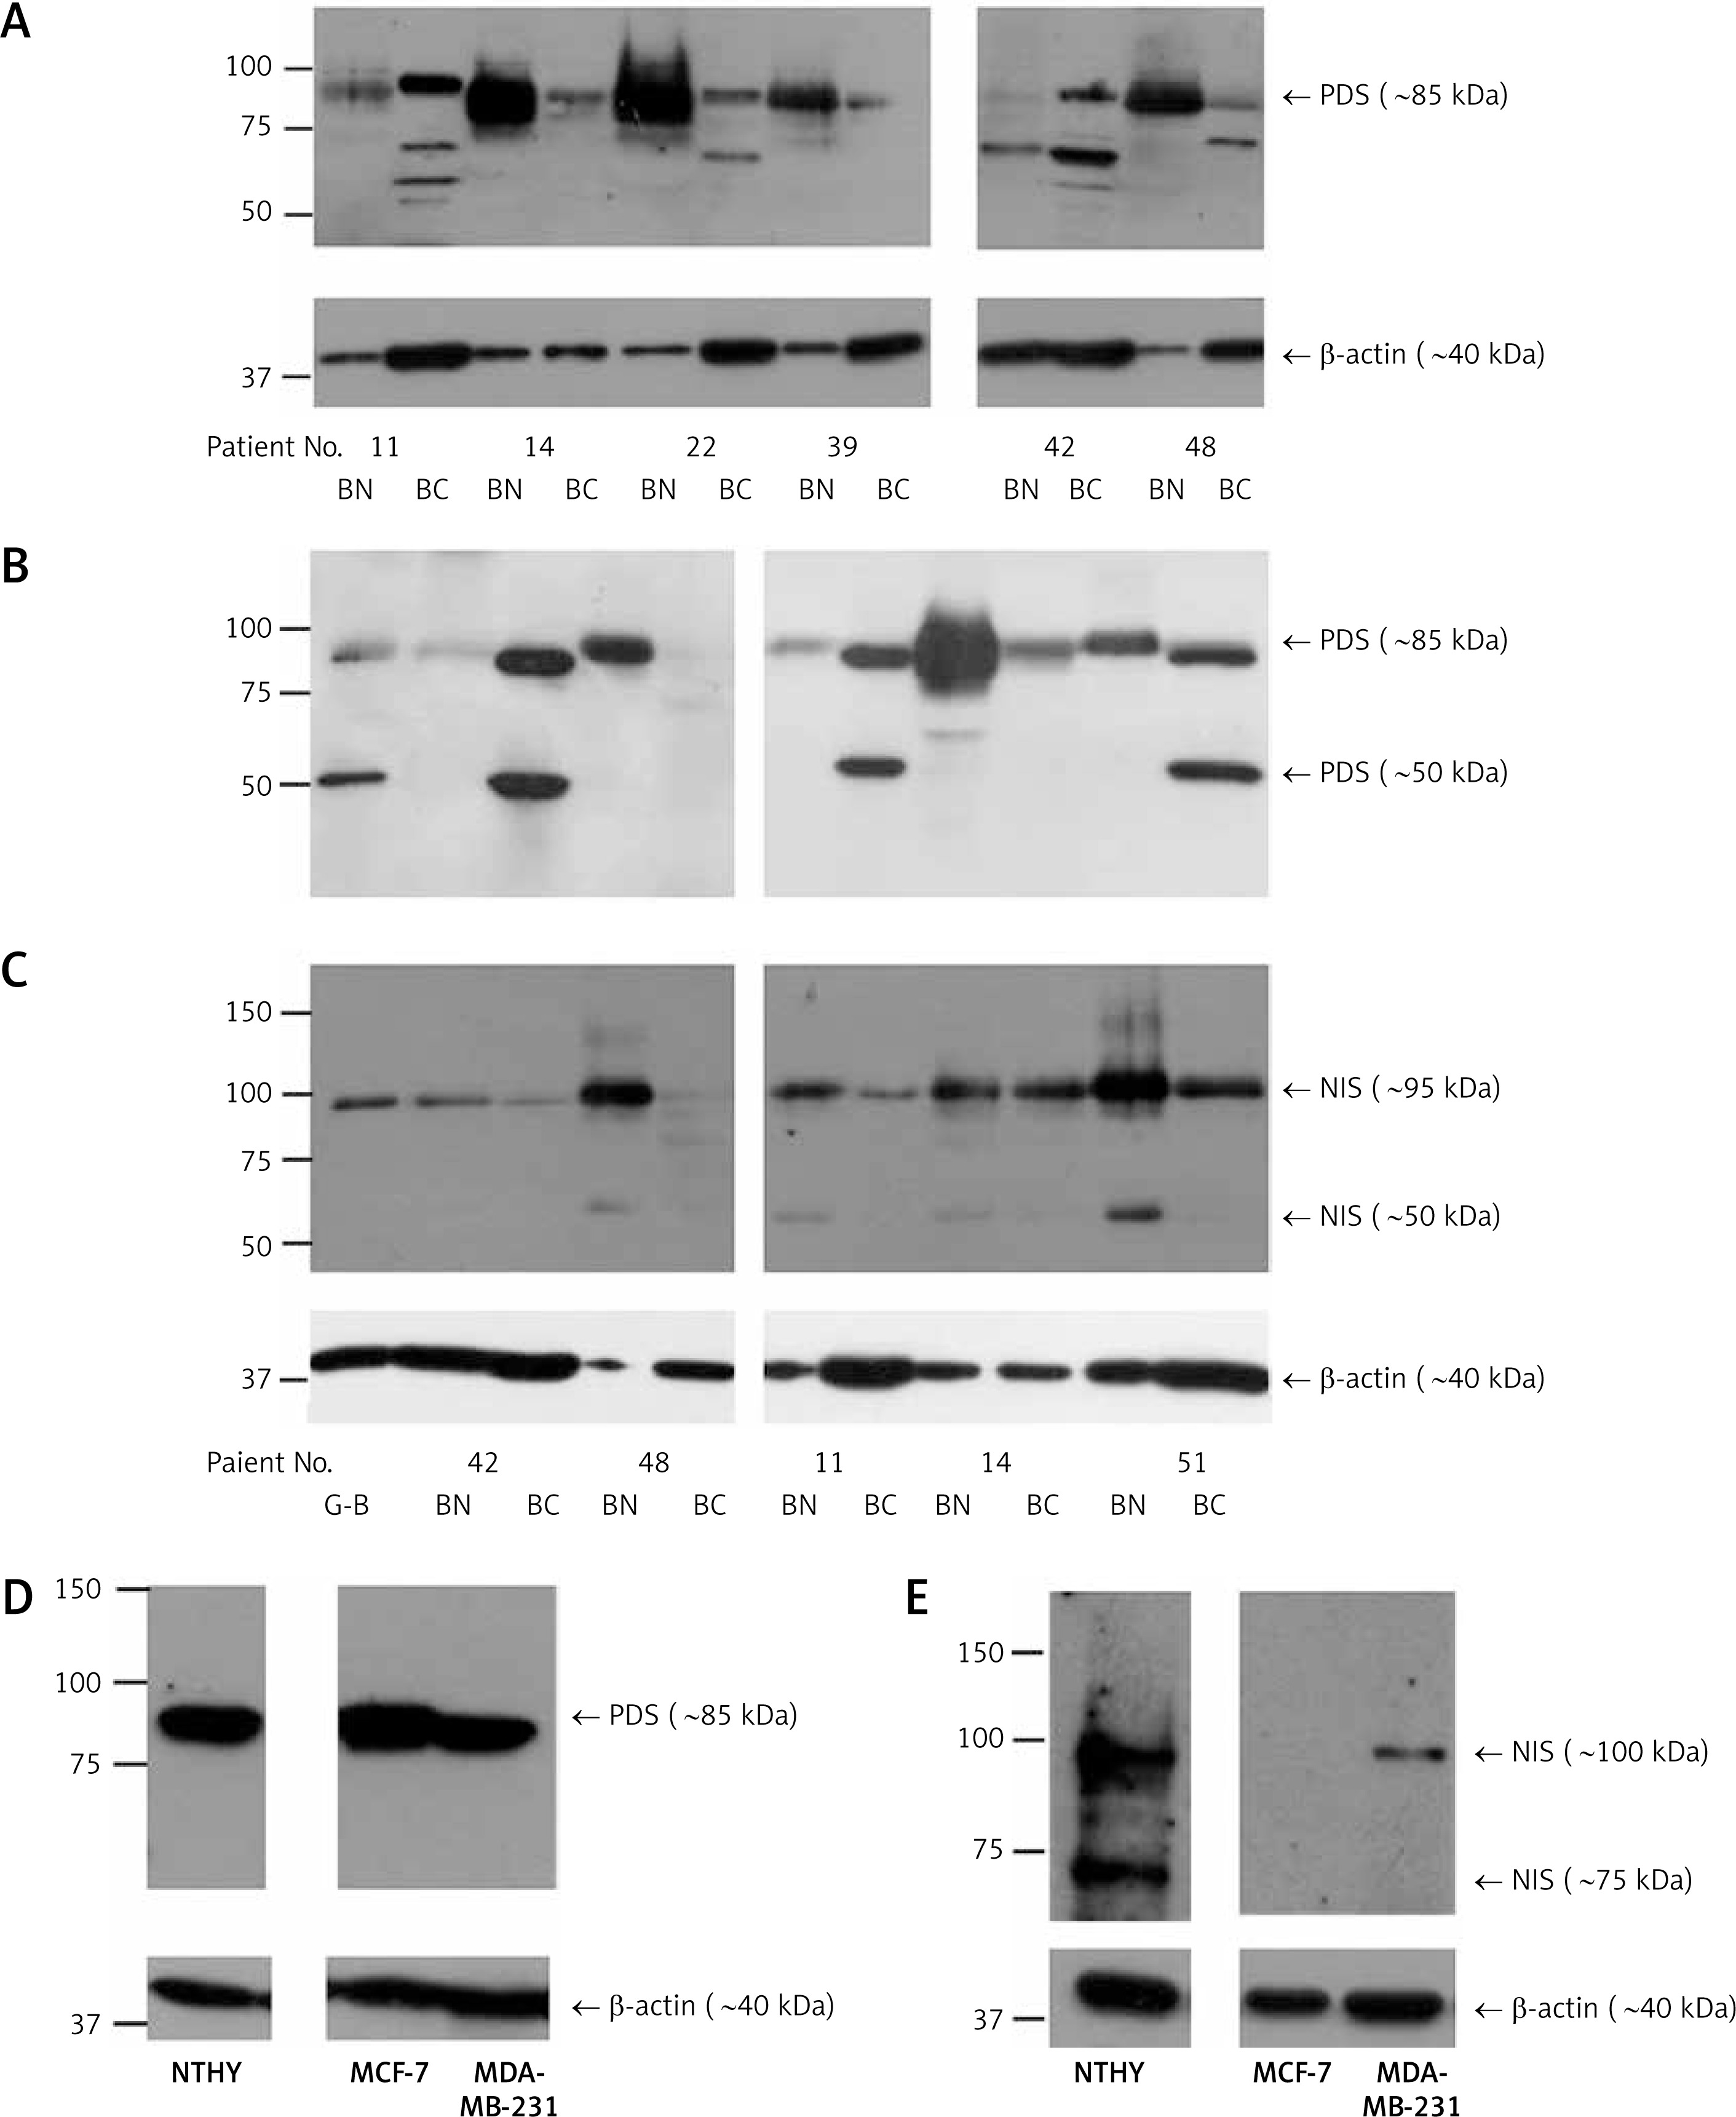
Further, PDS and NIS protein expression was analyzed by Western blotting in five to seven paired breast tumor and peri-tumoral tissues. Levels of both proteins varied considerably among patients. PDS protein levels were either decreased (patient no. 14, 22, 39, 48 and 51) or increased (patient no. 11 and 42) in breast cancer in comparison to normal breast tissue. Importantly, both patients showing an increased PDS protein level revealed upregulation of mRNA level in the tumor tissue (6- and 1.2-fold, respectively). Moreover, in most cases, a major PDS band of around 85 kDa was observed (Figures 4 A, B). NIS protein levels, on the other hand, were decreased in most of the studied tumor tissue samples with the main protein band detected at approximately 95 kDa (Figure 4 C). In cancer cell lines PDS mRNA levels were decreased in MCF-7 cells in comparison to MDA-MB-231 cells (Supplementary Figure S4), whereas PDS protein level changes revealed the opposite direction, with a slight increase in MCF-7 cells (Figure 4 D). On the other hand, NIS mRNA levels were upregulated in MCF-7 cells in comparison to MDA-MB-231 cells (Supplementary Figure S4), but the protein was detected only in MDA-MB-231 cells (Figure 4 E).
Figure 4
PDS and NIS protein expression in human breast tissue samples and breast cancer cell lines. A – Western blot analysis using antibody directed to C-terminus of PDS (pp5) performed on peri-tumoral and tumor breast tissues. B – Western blot analysis using antibody directed to N-terminus of PDS (pp1) performed on normal and cancer breast tissues. C – Western blot analysis using antibody directed to NIS (pp5) performed on normal and cancer breast tissues. D – Western blot analysis using antibody directed to N-terminus of PDS (pp1) performed on NTHY, MCF-7 and MDA-MB-231 cell lines. E – Western blot analysis using antibody directed to NIS (pp5) performed on NTHY, MCF-7 and MDA-MB-231 cell lines. β-actin served as loading control
BN – breast peri-tumoral tissue extract, BC – breast tumor tissue extract, G-B – Graves’ disease tissue extract.
Discussion
Detection of TPO expression in cancer breast tissue [15, 17] prompted us to extend this analysis by studying expression levels of NIS and PDS, major thyroid iodide transporters [1], in the same group of patients. NIS overexpression in breast tumor tissue is well documented [9, 18] and our RT-qPCR results again confirmed reported observations. Moreover, our immunohistochemical analysis is also in agreement with earlier reports with NIS positivity detected in more than 80% of breast cancer tissue samples [9, 18, 20, 24]. However, we failed to observe corresponding differences in NIS protein levels between tumor and peri-tumoral tissues in Western blots, probably because the analyzed patient group was too small. Additionally, in agreement with the immunohistochemical study by Wapnir et al. [20] we detected lowering of NIS mRNA levels in ILC in comparison to NST breast cancer tissues, but the small number of ILC cases, constituting approximately 10% of all breast cancer cases, as widely observed [29, 30], necessitates validation of the obtained data on a larger patient cohort. NIS mRNA and protein levels were previously shown to be positively correlated with ER status [31, 32]. However, in our patient cohort upregulation of NIS mRNA levels in ER-positive tumors (Supplementary Figure S1 A, Supplementary Table SI) was far from statistical significance (p = 0.590). This is however in agreement with another report, where no correlation of NIS IHC staining with ER status was detected [33], as well as with the high throughput expression data available from the TCGA database [28] (Supplementary Figure S1 B).
In agreement with a previous suggestion from high throughput analyses [27] we observed very strong lowering of PDS mRNA levels in breast cancer in comparison to normal tissue. Importantly, lowering of PDS expression in cancer tissue was also detected at the protein level, as revealed by Western blotting, in the majority of the paired tumor and peri-tumoral patient breast tissues. Nevertheless, in a few cases we detected an increased PDS mRNA or protein level in the breast tumor tissue. This reversed PDS expression pattern may be induced by several mechanisms. The development of breast cancer in some patients may differ in molecular background, leading to the observed variability. Factors that may be involved include, for example, mutations, promoter hypermethylation, regulation of splicing, regulation of transcription and translation, protein and transcript stability, hormonal regulation, tumor microenvironment and many others. The discussed phenomenon is widely observed, as for example in the case of TPO expression in breast cancer [15]. Moreover, although currently we are not able to elucidate precise mechanisms underlying PDS expression downregulation in breast tumor tissue, the most likely explanation comes from the previous observation that in thyroid cancer tissues PDS expression is silenced through hypermethylation [34].
Although currently there are no data showing hormonal regulation of PDS expression in human breast tissue, previously it was shown that in mice uterine supplementation of estradiol, but not progesterone, increases pendrin mRNA and protein levels [35]. Therefore, lack of such positive regulation through the estrogen receptor may explain the mechanism underlying lowering of PDS mRNA levels in all ER-negative breast cancer tissue samples. Additionally, the decrease of PDS mRNA levels in peri-tumoral breast tissue of older, and thus mostly post-menopausal, patients might be mediated by the decline of estrogen-induced PDS expression stimulation. However, this assumption is not substantiated by the data available from the TCGA database, where PDS mRNA levels show no correlation with menopausal status (Supplementary Figure S1 C). Moreover, we also observed an influence of HER2 status on PDS mRNA levels (Supplementary Figures S1 D, E), but the small number of cases necessitates validation of the obtained data on a larger patient cohort. Progesterone receptor status most likely has no influence on PDS expression, as we observed no difference in PDS mRNA levels between PGR+ and PGR– samples (data not shown). This conclusion is also supported by the lack of PDS expression regulation by progesterone supplementation in mouse uterus [35]. Importantly, similarly to our observations for TPO mRNA levels, PDS mRNA also decreased with the tumor grade, but the difference did not reach statistical significance (Supplementary Figure S1 F). This observation is in agreement with the reduced PDS mRNA levels in HER2-positive, and thus more aggressive breast cancers (Supplementary Figures S1 D, E). In conclusion, ER status seems to be an important factor strongly influencing PDS expression in breast cancer samples.
Finally, molecular weight of the major PDS band detected in breast tissue and breast cancer derived cell line extracts was around 85 kDa. On the other hand, in the thyroid tissue extracts additionally a heavier 106 kDa PDS species was detected, which was almost undetectable in the breast tissue protein samples (Supplementary Figure S5 A). This suggests that, in contrast to the thyroid tissue, breast PDS is present almost exclusively in unglycosylated form [11]. Lack of PDS glycosylation was further confirmed by the treatment with deglycosylating enzyme peptide-N-glycosidase F (PNGase F; Supplementary Figure S5 B). Consistently, IHC analysis as well as immunocytochemical analyses performed on MCF-7 and MDA-MB-231 cells (Supplementary Figure S6) revealed mainly cytoplasmic PDS staining; therefore it might be concluded that the protein is probably non-functional. However, predominant cytoplasmic localization of PDS does not exclude that it might have some functional role, as observed, for example, in the case of intracellularly expressed NIS [36]. Similarly, NIS-specific antibodies stained mainly the cytoplasmic compartment. However, the molecular weight of the major NIS band detected in breast peri-tumoral and tumor tissue extracts of around 95 kDa suggests that the protein undergoes full glycosylation [37], as was further confirmed by PNGase F treatment (Supplementary Figure S5 C). Importantly, previously it was observed that full glycosylation supports proper NIS activity and membranous localization [5]. Therefore, it cannot be excluded that some fraction, too small to be detected in IHC analysis, of NIS protein expressed in the breast tumor tissue is localized to the membrane. In agreement with our IHC analysis, available literature supports mainly cytoplasmic NIS localization in breast cancer cells [18, 20, 38]. This has led to the conclusion that in the breast tumor NIS trafficking to the plasma membrane is impaired or that the very strong cytoplasmic signal in fact results from non-specific staining [24, 38]. Importantly, regardless of the basis for the mainly cytoplasmic localization of NIS in breast cancer cells, the protein is functional, as revealed by the ability of the breast tissue to support iodine transport and organification [22, 39]. To exclude the previously raised controversy concerning specificity of NIS staining by IHC in the current study we applied two antibodies generated against non-overlapping peptide epitopes located at the C-terminus. Both antibodies gave complementary results, which, together with the Western blotting results showing protein bands of the correct molecular masses, confirms the specificity and thus reliability of our NIS IHC staining results. Finally, it is interesting to note that cytoplasmic NIS localization was proposed to support metastatic potential of cancer cells through activation of the LARG-RhoA-ROCK pathway [36]. Therefore the extent of NIS mislocalization in the breast cancer tissue may give some information about the aggressiveness of the tumor.
In conclusion, we have observed that both major thyroid iodide transporters, i.e. NIS and PDS, are expressed in human breast tumor and peri-tumoral tissues. Interestingly, RT-qPCR analyses revealed that NIS expression is increased, whereas PDS expression is lowered in breast tumor tissue. Additionally, PDS mRNA level was dependent on ER status of human breast cancer tissue. Immunohistochemical and Western blotting analyses in general paralleled RT-qPCR data. Additionally, Western blotting revealed that the fraction of NIS protein is subject to full glycosylation and thus might be localized to the plasma membrane, which may suggest that the protein is capable of transporting iodide. However, IHC staining does not support NIS membranous localization. PDS, on the other hand, was not glycosylated and present exclusively in the cytoplasm, which excludes its activity as a functional iodide transporter.