Introduction
In clinical practice, kidney damage induced by diabetes mellitus (DM) can only be poorly controlled to avoid progressive aggravation of diabetic nephropathy (DN), even if the adopted comprehensive treatment is able to adjust blood sugar, blood pressure, blood lipids, and other indicators to ideal ranges. Moreover, early diagnosis of DN may also be difficult due to its latent onset. Recent studies have found that DN is closely associated with the inflammatory response and activated immune system in the case of metabolic disorders and haemodynamic abnormalities. Nuclear factor κB (NF-κB) plays a significant role in the complex network composed of various inflammatory factors that interact with each other. As the upstream signalling regulator of NF-κB, Toll-like receptors (TLRs) can mediate a series of immune and inflammatory responses by activating multiple cytokines [1]. Studies have shown that TLR4 and NF-κB, which act as important regulators in the inflammatory response activation pathway, are over-expressed and over-activated in the development of DN, which may be one of the important mechanisms leading to diabetic kidney disease [2, 3]. TLR4/NF-κB can achieve targeted activation of the NLR family pyrin domain containing 3 protein (NLRP3) inflammasome, thus inducing an inflammatory response in the liver [4]. A study on patients with DN indicated that NLRP3 expression in renal tubular epithelial cells is significantly associated with the level of inflammatory cytokine interleukin-1β (IL-1β), renal interstitial damage, and renal function changes, suggesting that NLRP3 inflammasome activation is involved in the oxidative stress injury of DN renal tubules [5]. Investigations in recent years revealed a close association between DN and the Notch signalling pathway, which has an effect on the former’s occurrence and development by participating in kidney development, glomerular pathological changes, tubulointerstitial renal fibrosis, and microangiopathy. In renal tubular epithelial cells, Notch signal transduction can aggravate the infiltration of peripheral inflammatory cells, promote the proliferation of interstitial fibroblasts, and eventually lead to interstitial fibrosis [6]. Nevertheless, no study has investigated whether the activation of TLR4 and NLRP3 inflammatory signals is regulated by the Notch signalling pathway during DN tubulointerstitial fibrosis.
Hydroxysafflor yellow A (HSYA) is isolated from Carthamus tinctorius L. and is featured owing to its multiple biological activities, including anti-oxidation, anti-inflammatory reaction, anti-platelet aggregation, and anti-tumour and anti-myocardial damage [7]. However, few studies have explored the protective effects of HSYA against inflammation and fibrosis in DN. Starting with the signalling pathways involved in the DN inflammatory responses and their interactions, this study was designed to explore the protective effects and mechanism of HSYA in the improvement of DN inflammatory response and fibrosis by investigating the impact of HSYA on the expressions of Notch2, TLR4, NLRP3, and inflammatory factors in renal tissues and renal epithelial HK-2 cells, thereby providing a theoretical and experimental basis for the identification of drug therapy targets.
Material and methods
Material
Experimental animals
Twenty-seven clean-grade Sprague-Dawley (SD) male rats with 180 ±20 g body weight were purchased from Beijing HFK Bioscience Co., Ltd. (lot No.: SCXK (Beijing) 2009-0004). All rats were kept in the animal room of the laboratory and were routinely fed. They were given free access to water. This study was supported by the Ethics Committee of Chongqing Hospital of Traditional Chinese Medicine.
Drugs and reagents
Streptozotocin (STZ, Sigma-Aldrich, USA); HSYA (mass fraction ≥ 98%; National Institute for the Control of Pharmaceutical and Biological Products, China); foetal bovine serum (FBS) and DMEMF12 medium (Gibco, USA); SuperReal PreMix Kit (Tiangen Biotech (Beijing) Co., Ltd, China); RNAiso Plus Kit, TRIzol Kit and M-PER Kit (Life Technologies, USA); Lipofectamine 2000 Transfection Reagent and Lipofectamine RNAiMAX Kit (Thermo Fisher Scientific, USA); BCA Protein Quantification Kit (Beyotime Biotechnology, Jiangsu, China); miRNA-140-5p mimic and inhibitor (RiboBio, Guangdong, China); rabbit anti-TLR4 polyclonal antibody (ProteinTech, USA); rabbit anti-NLRP3 polyclonal antibody (Bioss Antibodies, China); rabbit anti-Notch2 polyclonal antibody (MDL, China); anti-collagen type IV (Col-IV) protein monoclonal antibody (Sigma-Aldrich, USA); anti-β-actin antibody (Boster, Wuhan, China); Total Anti-oxidant Capacity (T-AOC) and Malondialdehyde (MDA) Assay Kits (Nanjing Jiancheng Bioengineering Institute, Nanjing, China); Immunohistochemical Streptavidin-Peroxidase (SP) Two-Step Assay Kit, diaminobenzidine (DAB) substrate solution (ZsBio, Beijing, China); Enzyme-Linked Immunosorbent Assay (ELISA) Kit (NEOBIOSCIENCE, Beijing, China); and Dual-Luciferase Reporter Gene Assay Kit (Promega, USA) were used.
Methods
Diabetic animal model establishment and animal grouping
With free access to water, the animals fasted for 4–6 h prior to modelling. Then, STZ (55 mg/kg) was administered via a single tail vein injection to establish the diabetic rat model. After 72 h, the animals fasted for 4 h, and then blood was collected from the tail vein tip for the measurement of fasting blood glucose. Blood glucose ≥ 16.7 mmol/l and a positive result of the urine glucose test indicate the successful establishment of the diabetes model [7]. The animals were randomly divided into the diabetic (DM) and HSYA groups 2 weeks after the establishment of eight model rats in each group. Another eight rats were assigned to the normal control (NC) group. The HSYA group was intragastrically administered a dose of 10 mg/kg daily for 6 consecutive weeks. The blank control and DM groups were administered the same volume of normal saline. Insulin was not utilised in the experiment. All animals were free to eat and drink, and no deaths were reported.
Cell culture and high glucose-induced renal tubular epithelial cells
The human immortalised renal tubular epithelial (HK-2) cells were purchased from the American Type Culture Collection. In the Thermo 3111 cell culture incubator set at a constant temperature of 37°C, the cells were cultured in a DMEM-F12 culture system containing 10% foetal bovine serum at 5% CO2 and 95% relative humidity. The HK-2 cells were processed with 30 mmol/L D-glucose for 48 h to construct the DN cell model.
The cells in the HSYA group were administered 10 mg/ml HSYA.
Transient transfection assay
The HK-2 cells were inoculated into the 35-mm dish and then left to stand for cell adhesion. Lipofectamine RNAiMAX was used to transfect the blank plasmids and inhibitor with the scrambled RNA fragment as the control. DMEM-F12 medium containing 10% FBS was replaced after 12 h, followed by high sugar stimulation at an appropriate time. The specific steps were as follows: 250 µl of Opti-MEM medium was first added with the fragment at the corresponding concentration, followed by 5 µl of Lipofectamine RNAiMAX. The diluted Lipofectamine RNAiMAX and miRNA-NC or miRNA-140-5p inhibitor were placed at room temperature for 5 min; the mixture was added dropwise to the transfection dish (medium volume, approximately 2.5 ml), thus making the volume of the final culture system 3 ml. miR-140-5p inhibitor (antisense 5’-CUA CCA UAG GGU AAA A CCA CUG-3’), NC empty vector (cat. no. v855-20; Invitrogen; Thermo Fisher Scientific, Inc.).
Specimen collection and indicator determination
The 24-h urine volume of rats was collected at the end of the eighth week of experiment, and the urine protein (UP) concentration was measured using the Biuret method. The 24-h total UP was defined as the product of UP concentration and 24-h urine volume. Subsequently, blood was collected from the common femoral artery under ether anaesthesia. The blood glucose (BG) level was detected using the glucose oxidase method, whereas the enzyme assay was employed to detect total cholesterol (TC) and triglyceride (TG) in the blood and culture supernatants. The normal saline pre-cooled at 4°C was injected via the left ventricle to repeatedly lavage the kidneys, which were then dissociated, fixed with 4% paraformaldehyde, and sectioned for immunohistochemical staining. For homogenisation, 0.1 g of kidney cortex was added to 500 µl of tissue protein lysate. The protein concentrations in the serum and culture supernatants were measured using the BCA method based on the T-AOC and MDA Kit instructions. The levels of interleukin-6 (IL-6) and tumour necrosis factor-α (TNF-α) in renal tissues and culture supernatants were determined using the ELISA Kit.
Immunohistochemical staining of the kidneys using he and masson stains
The fixed rat kidneys were cut into 3-µm thick paraffin sections for pathological observation via HE and Masson staining. The kidney cortex was stained using the immunohistochemical SP two-step assay to detect Notch2, NLRP3, and TLR4 (1 : 50), followed by dewaxing, hydration, microwave heating for antigen retrieval, antibody incubation, and DAB colour development. The expression sites were observed under light microscope and then photographed. ImageJ software was used for the analysis. The collagen volume fraction (CVF, %) was calculated using the equation CVF = collagen area/measured field area × 100%.
RT-qPCR assay
For the tissues, an appropriate amount of sample tissues was placed into 1 ml of RNAiso Plus and homogenised. The clarified liquid was transferred to a 1.5-ml centrifuge tube and then left to stand at room temperature for 5 min. Then, the total RNA was extracted according to the instructions. The cells in the logarithmic phase were inoculated into a six-well plate at a density of 2 × 10⁵ cells/well and then treated accordingly after adhesion. The supernatants were removed at the end of the treatment, and 1 ml of TRIzol Reagent was added to each well to extract cellular RNA according to the instructions. After determining the total RNA concentration using a Qubit 2.0 Fluorometer, 1 µg of total RNA was obtained for reverse transcription reaction, where the PCR parameters were set at 42°C for 60 min and then 70°C for 10 min to terminate the reaction. cDNA was treated according to the instructions in the SuperReal PreMix Kit and then submitted for real-time quantitative PCR experiment together with the primers. The primer sequences of miRNA-140-5p were as follows: miR-140-5p, F 5’-CAG TGG TTT TAC CCT ATG GTA G-3’ and R 5’-TGG TGT CGT GGA GTC G-3’; U6, F 5’-CTC GCT TCG GCA GCA CA-3’ and R 5’AAC GCT TCA CGA ATT TGC GT-3’. PCR parameters were set at 95°C for 10 min and 40 cycles of 95°C for 10 s, 62°C for 30 s and 72°C for 30 s, followed by slow warming to 95°C. After the completion of the reaction, the relative expression level of miRNA-140-5p was calculated according to the 2–ΔΔCt method.
Detection of protein expression using the western blot method
HK-2 cells were inoculated into the 35-mm culture dish. After the corresponding treatment, the supernatants were removed from all groups and then gently rinsed with pre-cooled PBS thrice. Approximately 200 µl of cell lysate, the concentration of which was determined using the BCA Kit, was added to each well. After the protein was quantified to the same concentration, 20 µg of the protein sample was placed in a 5 × SDS loading buffer and then heated in boiling water for 5 min to completely denature the protein. Then, separation was performed via sodium dodecyl sulphate–polyacrylamide gel electrophoresis (SDS-PAGE), followed by transfer to the PVDF membrane using the wet method. The sample was blocked with 5% skimmed milk powder at room temperature for 1 h and then incubated with the diluted primary antibody (antibody diluent, 5% BSA) overnight at 4°C. It was then rinsed with TBST thrice (5 min each) the next day, followed by incubation with the corresponding secondary antibody at room temperature for 1 h, TBST rinsing three times, and colour development by chemiluminescence and photographing.
Cellular immunofluorescence assay
The cells of the different groups were inoculated into 24-well plates, respectively, placed in a CO2 cell incubator for 24 h, and then fixed with 95% ethanol for 1 h. Subsequently, the flowing were perfomred: permeation by 0.05% Triton X-100 for 20 min, PBS rinsing, the addition of the primary antibody, dilution at 1 : 100 and incubation overnight at 4°C, PBS rinsing, incubation with goat anti-rabbit fluorescent-labelled secondary antibody for 1 h, 3× PBS rinsing, incubation with DAPI for 15 min in the dark, 3× PBS rinsing, observation, and photographing under a fluorescent inverted microscope. The expression sites and levels of TLR4, NLRP3, Notch2, and Col-IV proteins were detected using ImageJ software, and the translocation of NF-κB (p65) into nuclei was also analysed.
Dual-luciferase reporter assay
The TLR4 gene 3’-UTR was cloned into plasmid pGL3 to construct the pGL3-TLR4 wild- and mutant-type vectors. The HK-2 cells were inoculated into 12-well plates; after adhesion, Lipofectamine 2000 was utilised for the co-transfection of pGL3-TLR4 wild- or mutant-type vector and miRNA-140-5p mimic. Firefly luciferase activity was detected after 24 h using a Synergy H1 hybrid multi-mode microplate reader according to the instructions of the Dual-Luciferase Reporter Assay Kit, where Renilla luciferase activity was adopted as the internal reference.
Statistical analysis
Statistical analysis of the experimental data was conducted using the GraphPad Prism 6 software. All assays were performed ≥ 3 times, and the data were expressed as mean ± standard deviation (mean ± SD). Under normal distribution and homogeneous variance, the quantitative data were compared between the different groups via two-sided t-test and one-way analysis of variance. Statistical significance was defined as p < 0.05.
Results
Effects of HSYA on the pathological changes in rat kidney tissues
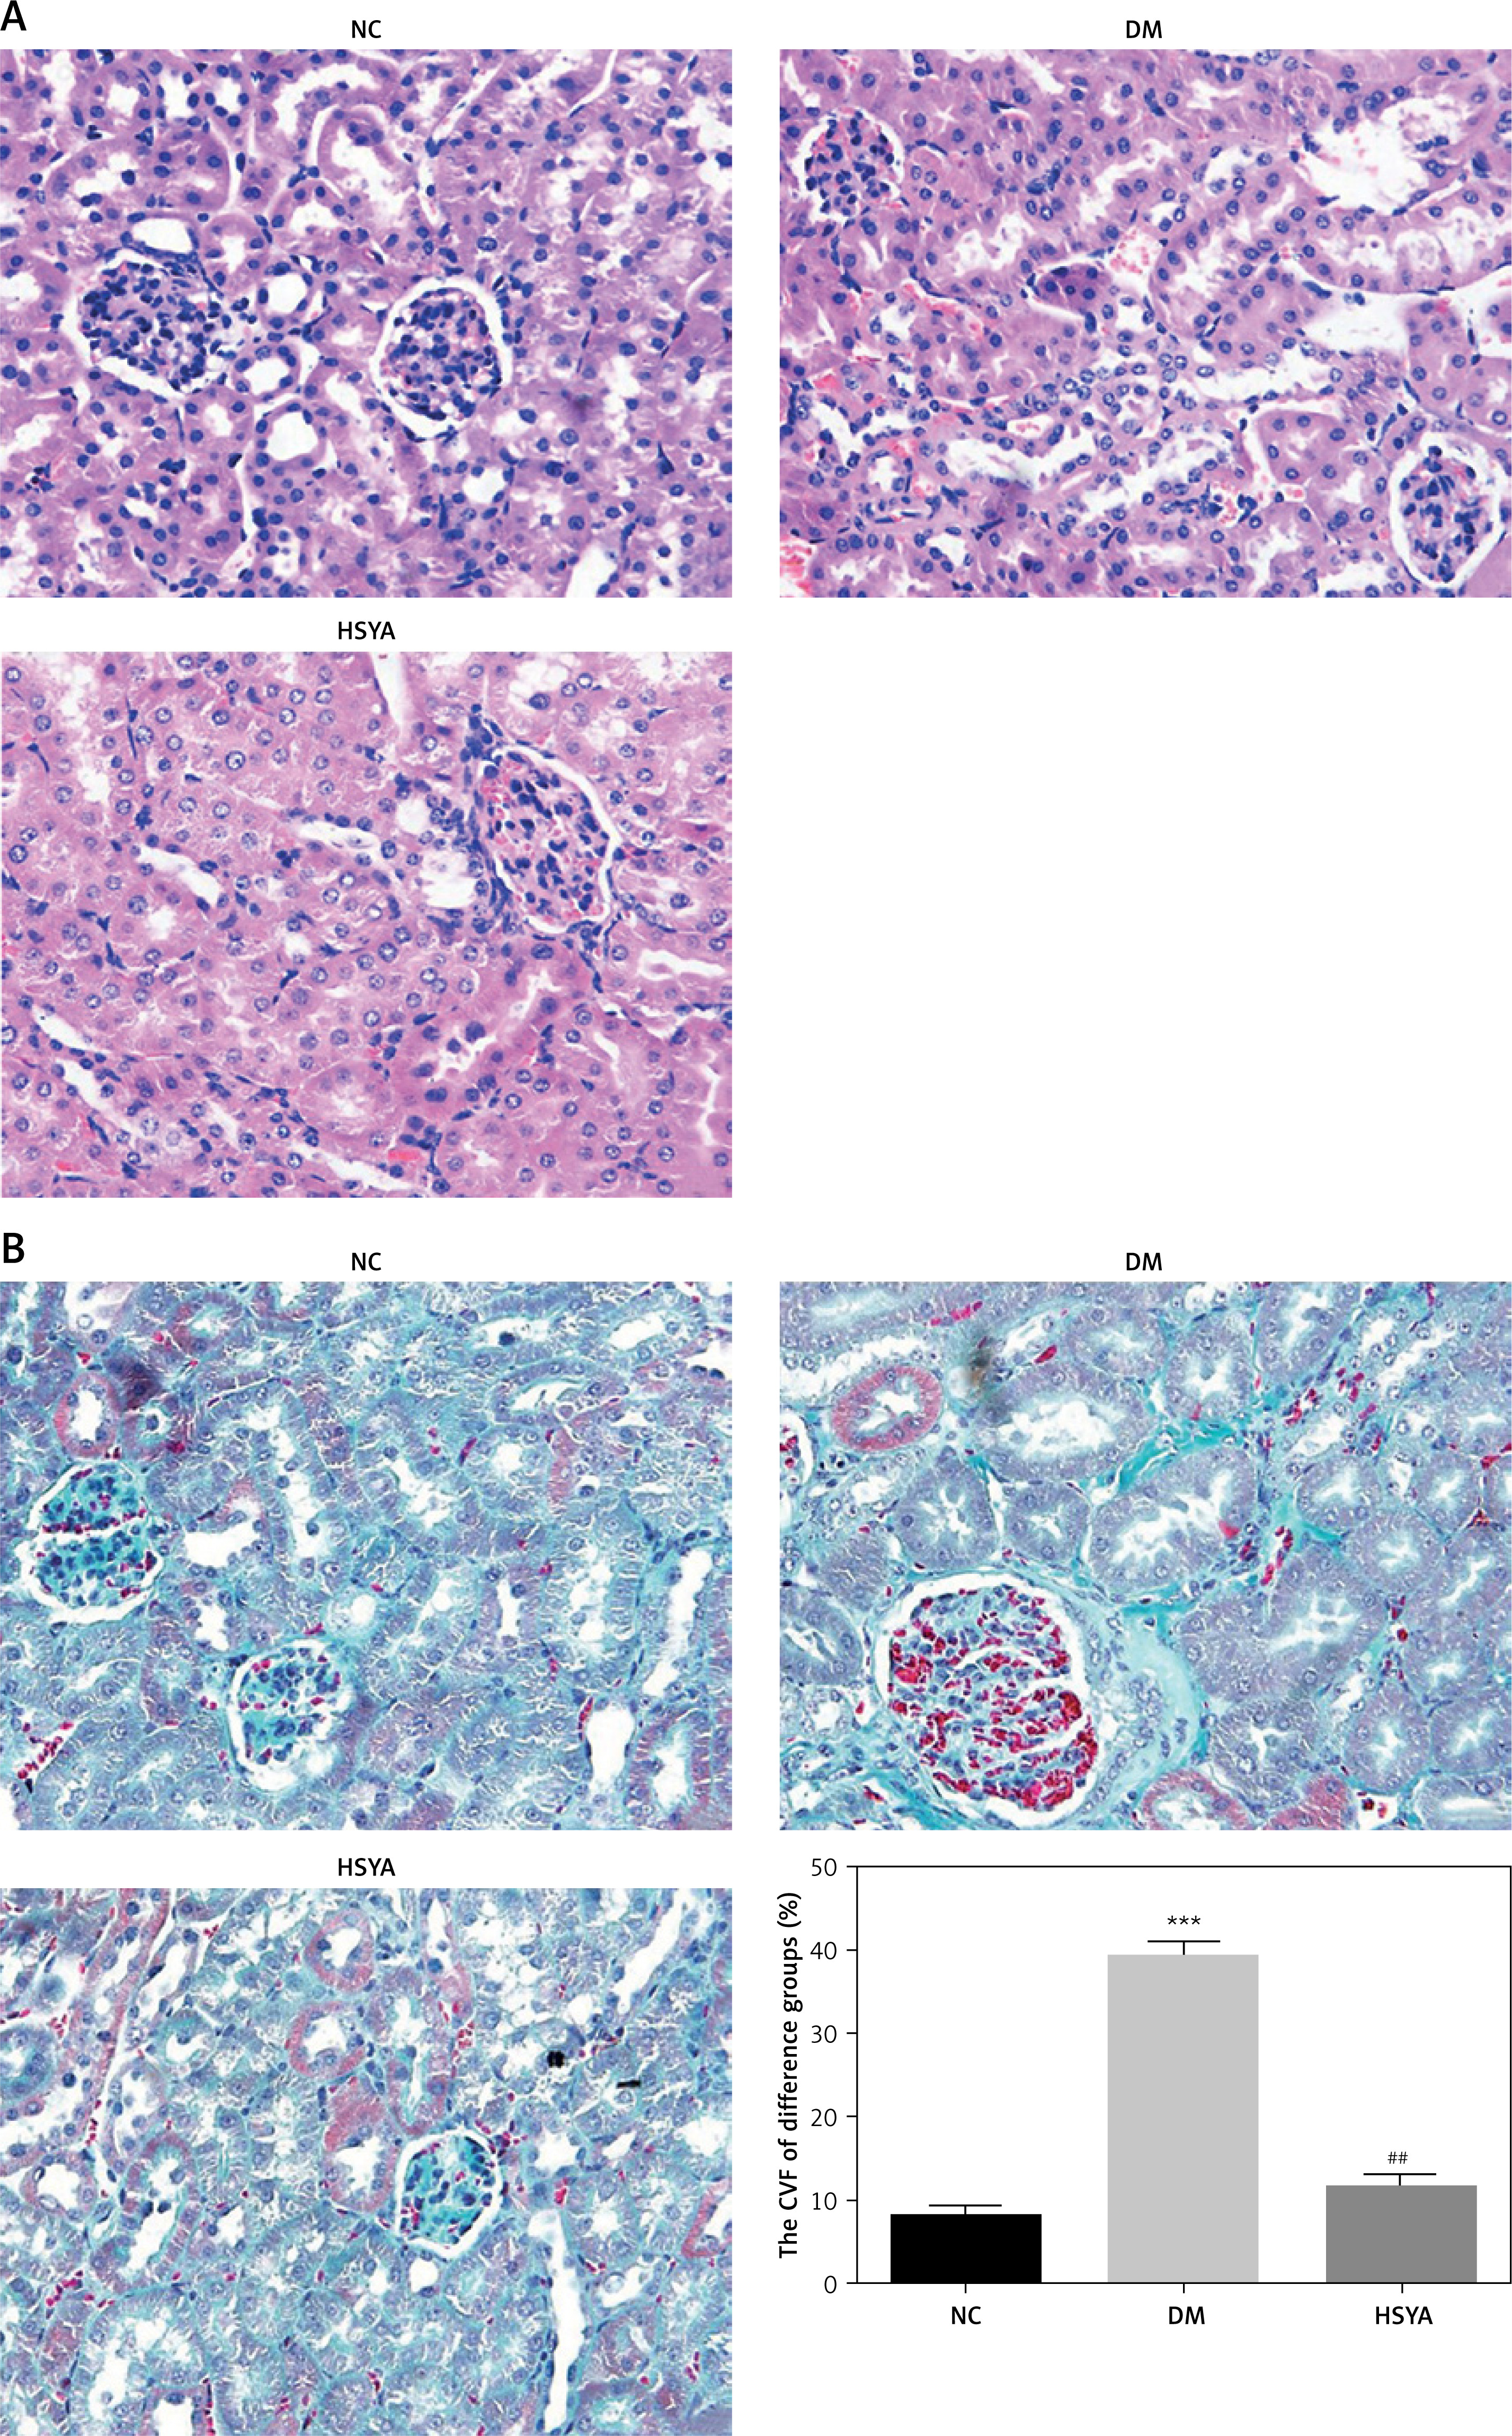
In the NC group, the features of HE-stained kidney tissues were clear glomerular contour, regular arrangement of renal tubular epithelial cells, and intact basement membrane. In the DM group, the partial tubular structure was damaged, and vesicular degeneration was observed in the epithelial cells, as well as obviously thickened basement membrane. Compared with the DM group, the glomerular and tubular lesions in the HSYA group improved to varying degrees (Figure 1 A). Compared with the NC group, the tubulointerstitium in the DM group was indicated in dark blue after Masson staining, and the CVF was significantly increased (p < 0.001, Figure 1 B). Compared with the DM group, the positive substance of the tubulointerstitium indicated in dark blue was significantly reduced in the HSYA group. The CVF value was also significantly decreased (p < 0.01, Figure 1 B).
Figure 1
The pathological changes in tissues of three groups observed by HIM and Masson (400×). NC: The rats were treated by normal saline; DM: The rats were treated with diabetes; HSYA: The diabetic rats were treated with HSYA (10 mg/kg). A – The pathological changes by HE staining (400×). B – The pathological changes by Masson staining (400×)
***P < 0.001, compared with NC; ##p < 0.01, compared with DM.
Effects of HSYA on miRNA-140-5p and BG, 24 UP, TC, and TG levels
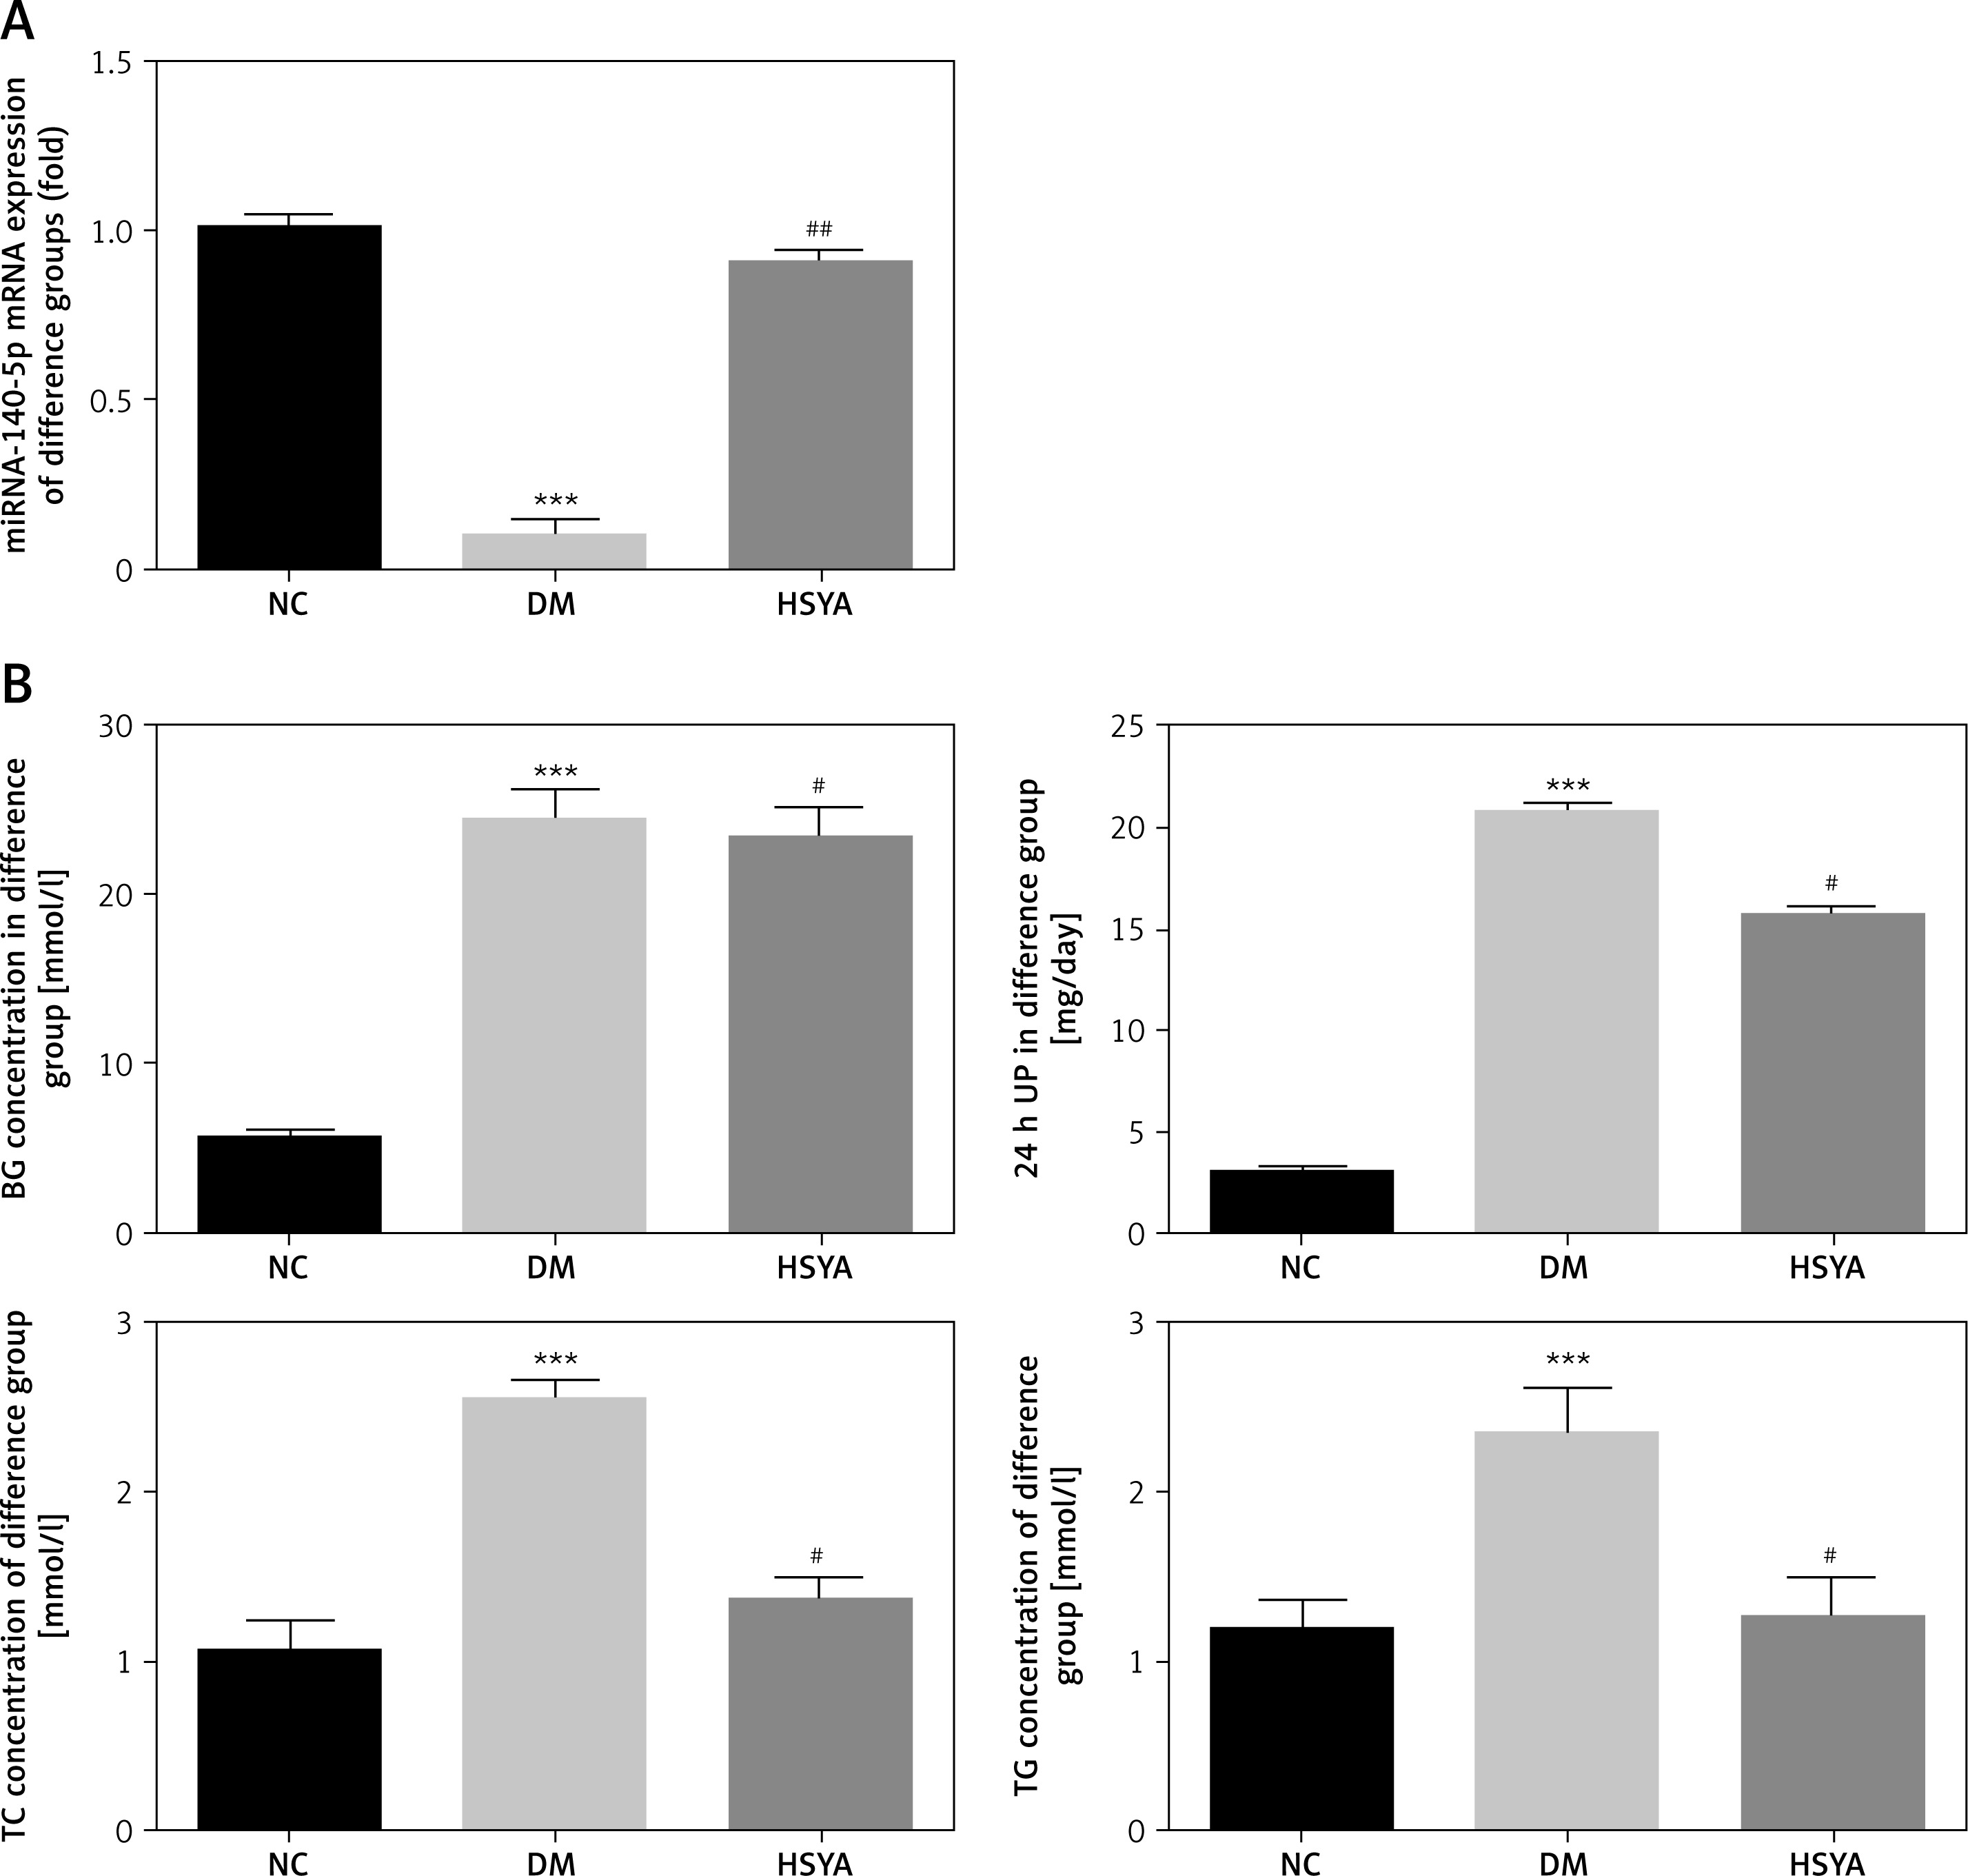
Figure 2 A shows that the miRNA-140-5p mRNA level in the DM group was significantly decreased compared with that in the NC group (p < 0.001); with HSYA supplement, the miRNA-140-5p mRNA level in the HSYA group significantly increased compared with that in the DM group (p < 0.01). Figure 2 B shows that BG, 24-h UP, TC, and TG levels significantly increased in the DM group in the ELISA assay (p < 0.001, respectively); with HSYA supplement, the BG, 24-h UP, TC, and TG levels in the HSYA group were significantly decreased compared with those in the DM group (p < 0.05, respectively, Figure 2 B).
Figure 2
Effects of HSYA on miRNA-140-5p and BG, 24 UP, TC, and TG levels. NC: The rats were treated by normal saline; DM: The rats were treated with diabetes; HSYA: The diabetic rats were treated with HSYA (10 mg/kg). A – miRNA-140-5p mRNA expression by RT-qPCR assay in difference groups. B – BG, 24 UP, TC, and TG levels in difference groups
***P < 0.001, compared with NC; ##p < 0.01, compared with DM.
HSYA affected T-AOC, MDA, IL-6, and TNF-α levels in rats
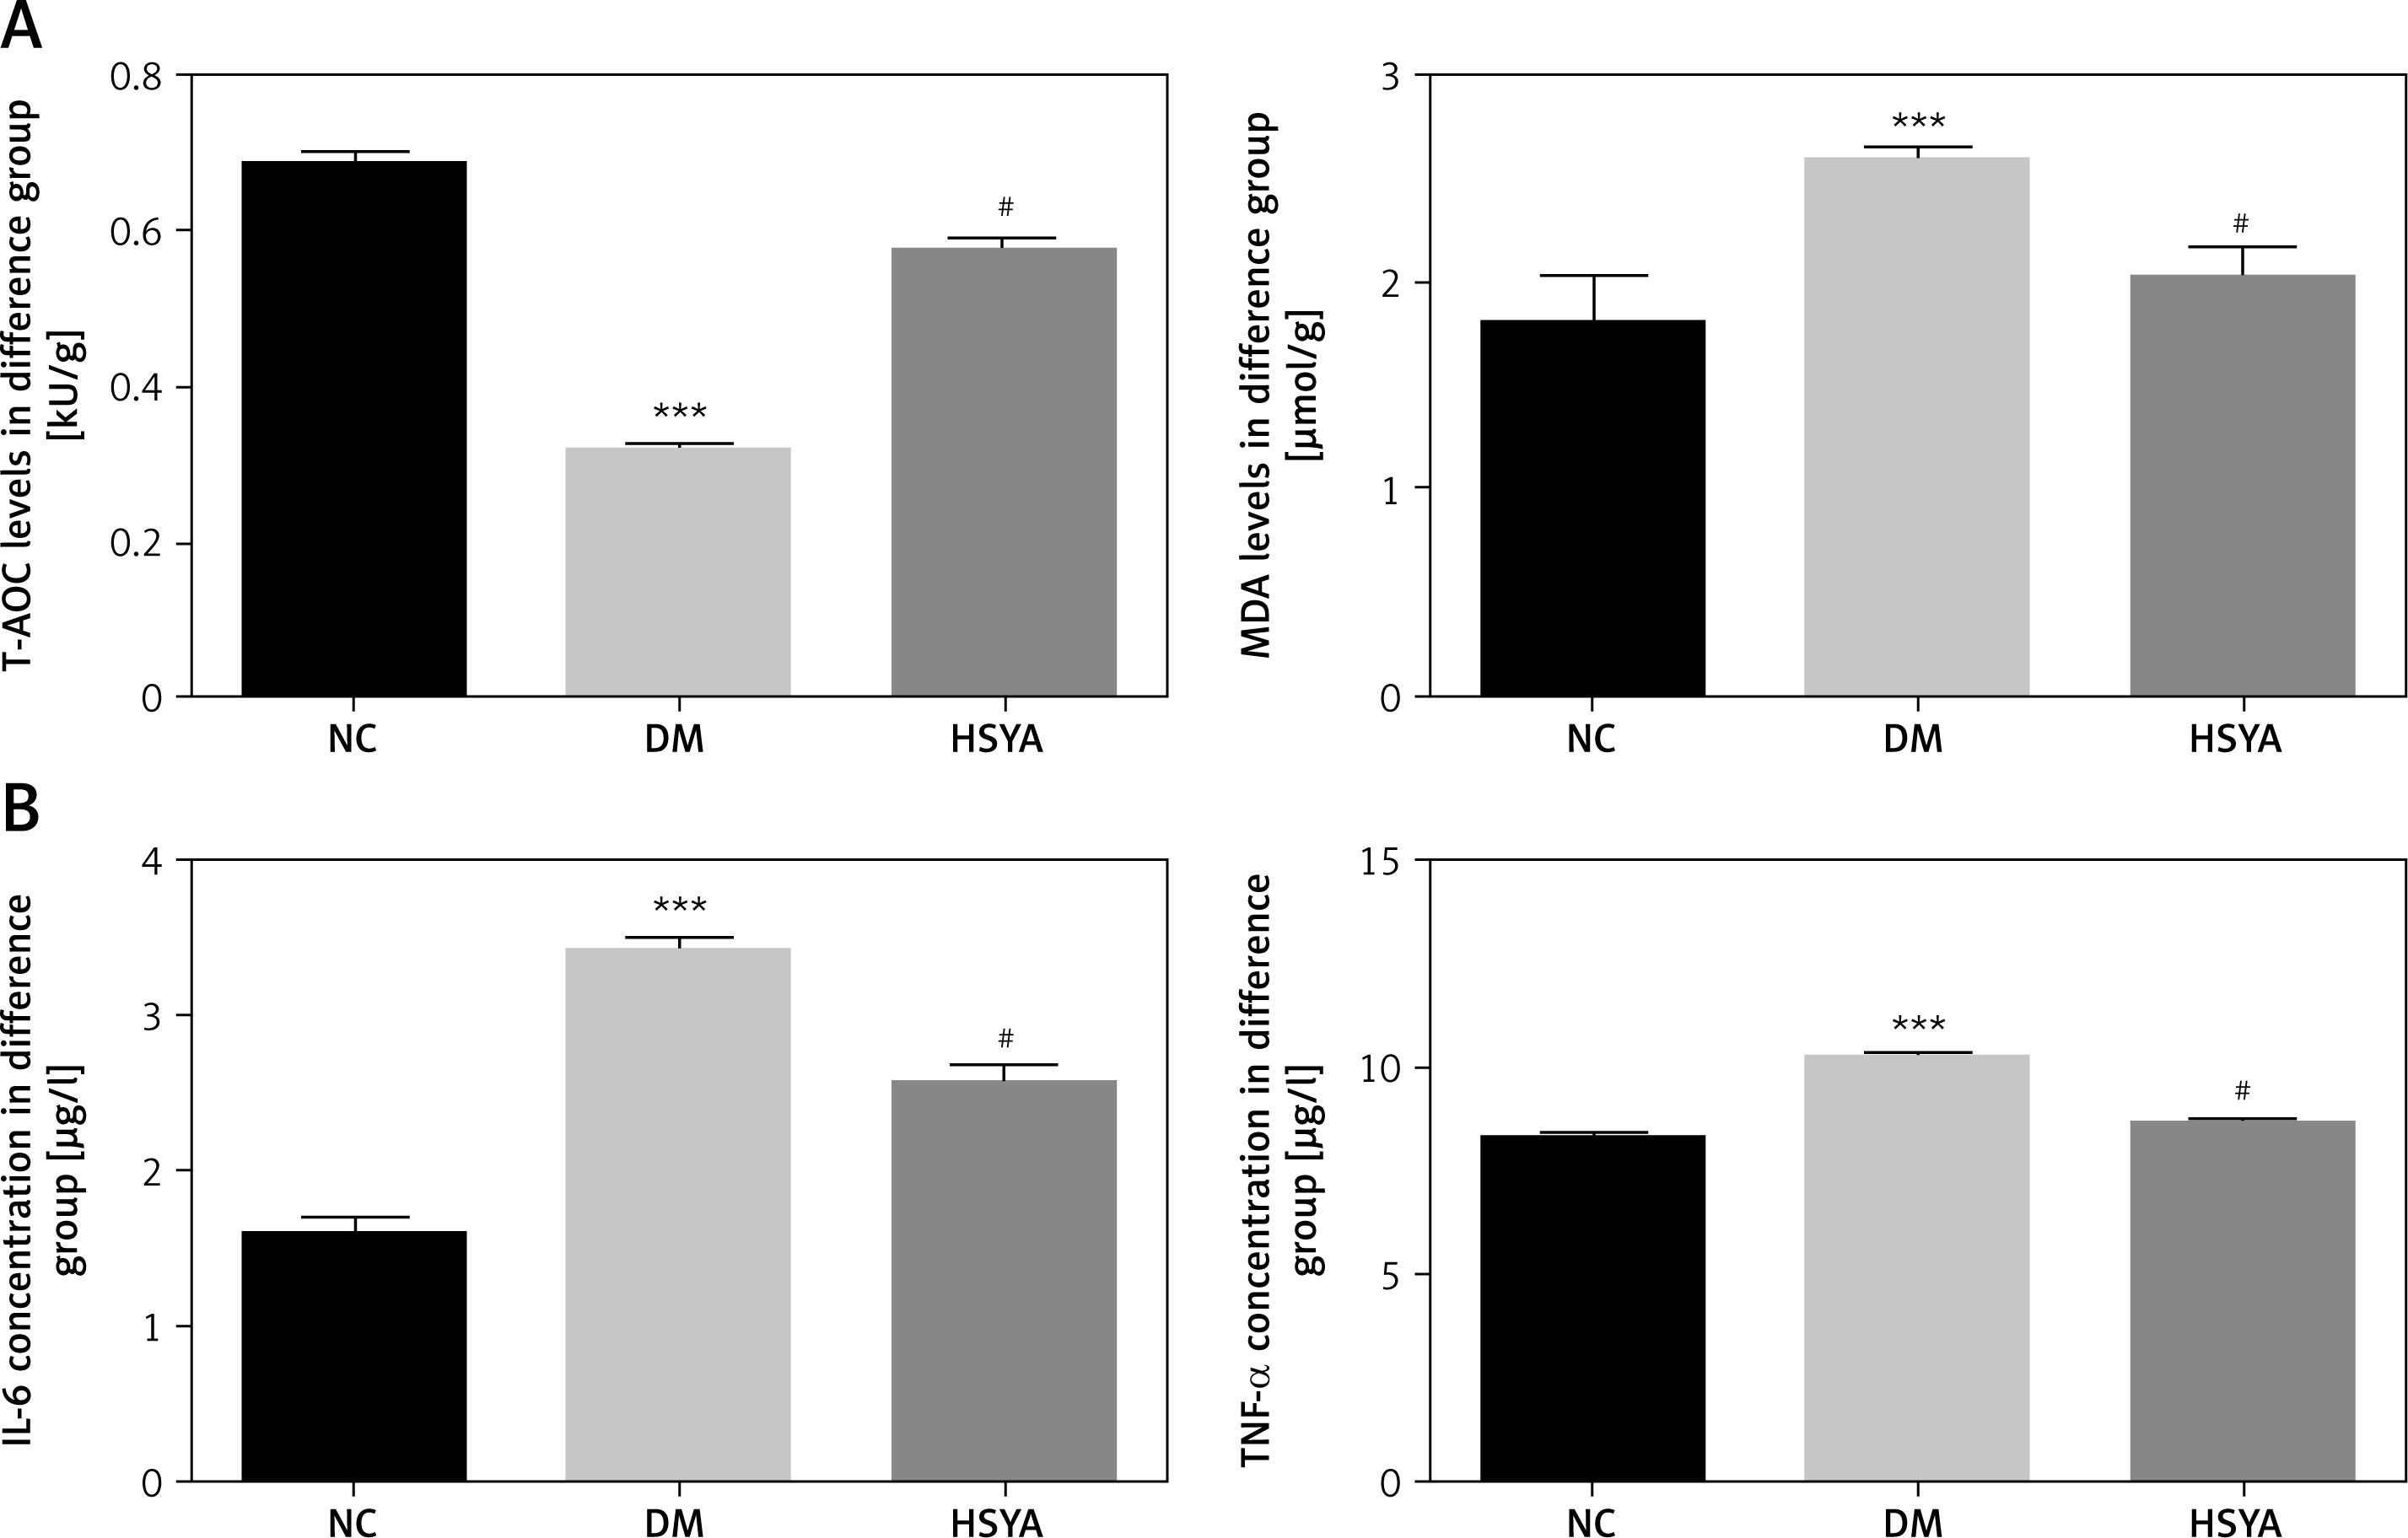
The T-AOC level was significantly down-regulated, and the MDA level was significantly up-regulated compared with those in the NC group (p < 0.001, respectively, Figure 3 A). With HSYA supplement, the T-AOC level in the HSYA group was significantly up-regulated and the MDA level was significantly down-regulated compared with those in the DM group (p < 0.05, respectively, Figure 3 A). Compared with the NC group, the inflammatory factors (IL-6 and TNF-α) were significantly increased (p < 0.001, respectively, Figure 3 B) in the DM group. Compared with the DM group, with HSYA supplement, the inflammatory factors (IL-6 and TNF-α) were significantly decreased in the HSYA group (p < 0.001, respectively, Figure 3 B).
Figure 3
Effects of HSYA to T-AOC, MDA, IL-6, and TNF-α. NC: The rats were treated by normal saline; DM: The rats were treated with diabetes; HSYA: The diabetic rats were treated with HSYA (10 mg/kg). A – T-AOC and MDA levels of difference groups. B – IL-6 and TNF-α levels of difference groups
***P < 0.001, compared with NC; ##p < 0.01, compared with DM.
HSYA affected relative protein expression using the IHC assay
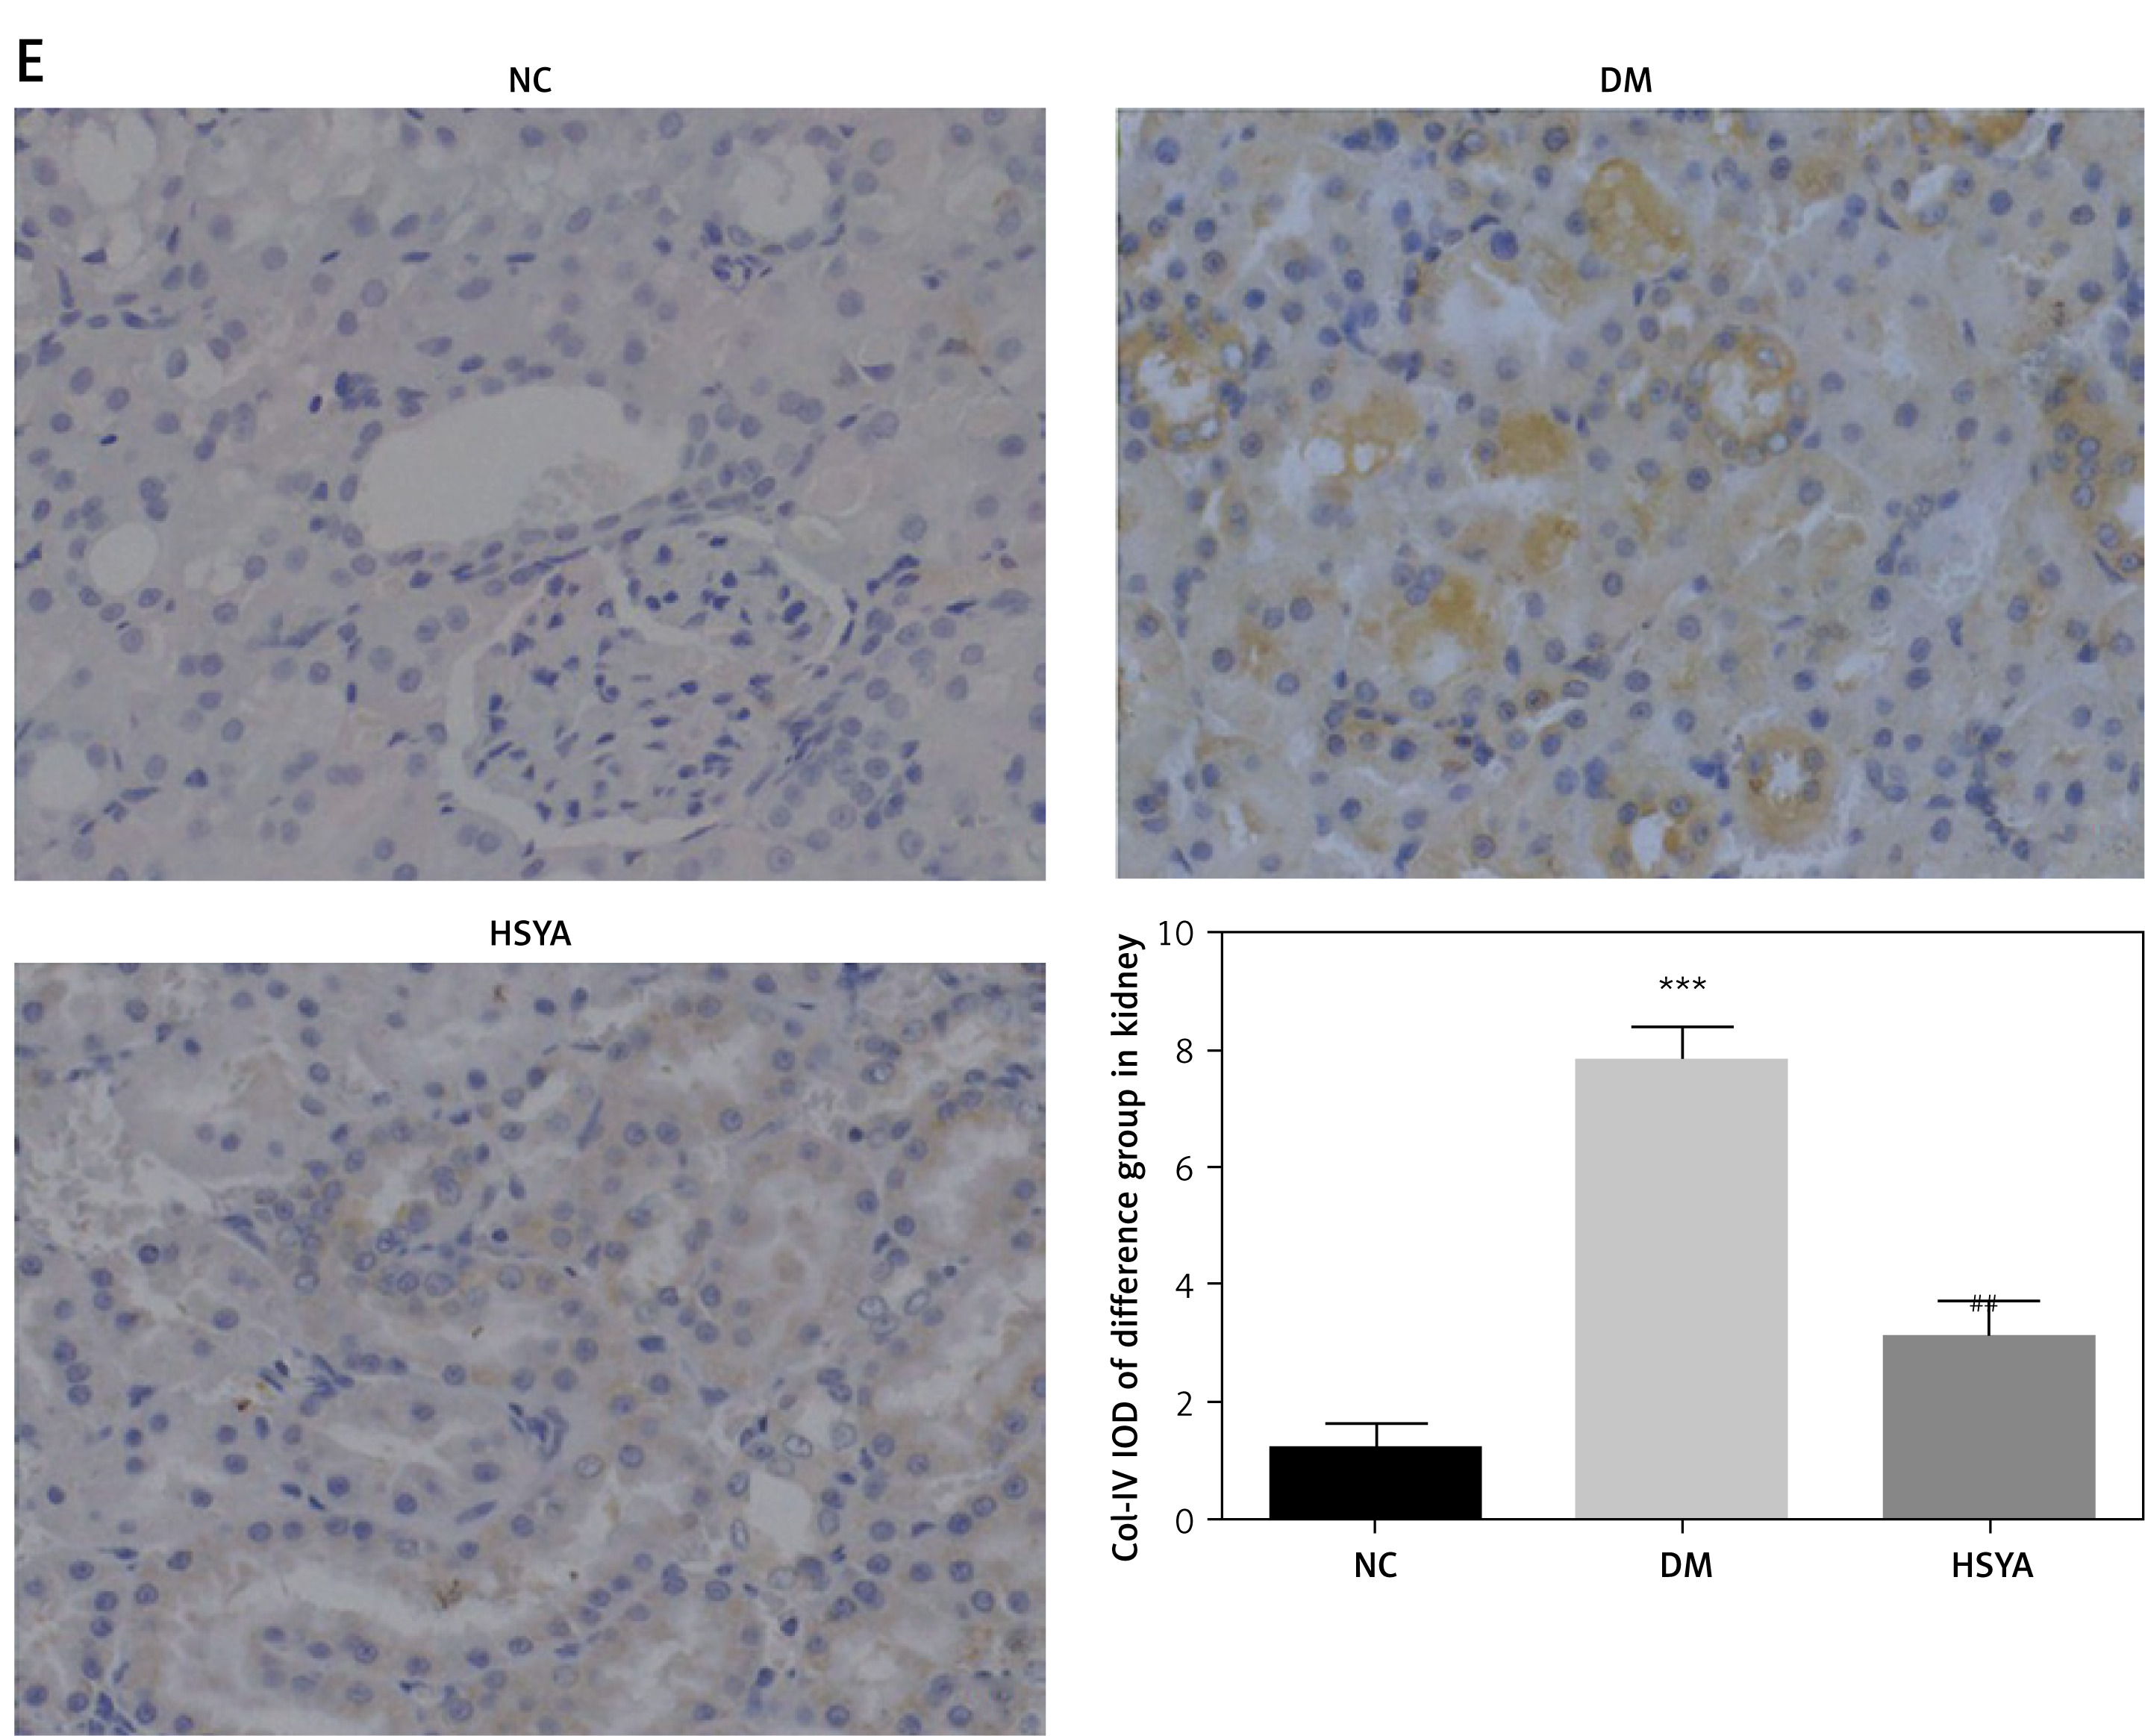
Compared with those in the NC group, the TLR4, NF-κB(p65), NLRP3, Notch2, and Col-IV protein expressions in the DM group significantly increased (p < 0.001, respectively, Figure 4). Compared with those in the DM group, with the HSYA supplement, the TLR4, NF-κB(p65), NLRP3, Notch2, and Col-IV protein expressions in the HSYA group significantly decreased (p < 0.01, respectively, Figure 4).
Figure 4
TLR4, NF-κB(p65), NLRP3, Notch2, and Col-IV protein levels in differet groups by IHC assay. NC: The rats were treated by normal saline; DM: The rats were treated with diabetes; HSYA: The diabetic rats were treated with HSYA (10 mg/kg). A – TLR4 protein level of difference groups by IHC assay (400×). B – NF-κB(p65) protein level of difference groups by IHC assay (400×). C – NLRP3 protein level of difference groups by IHC assay (400×). D – Notch2 protein level of difference groups by IHC assay (× 400). E – Col-IV protein level of difference groups by IHC assay (× 400)
***P < 0.001, compared with NC; ##p < 0.01, compared with DM.
miRNA-140-5p mRNA and relative factor expression in different groups
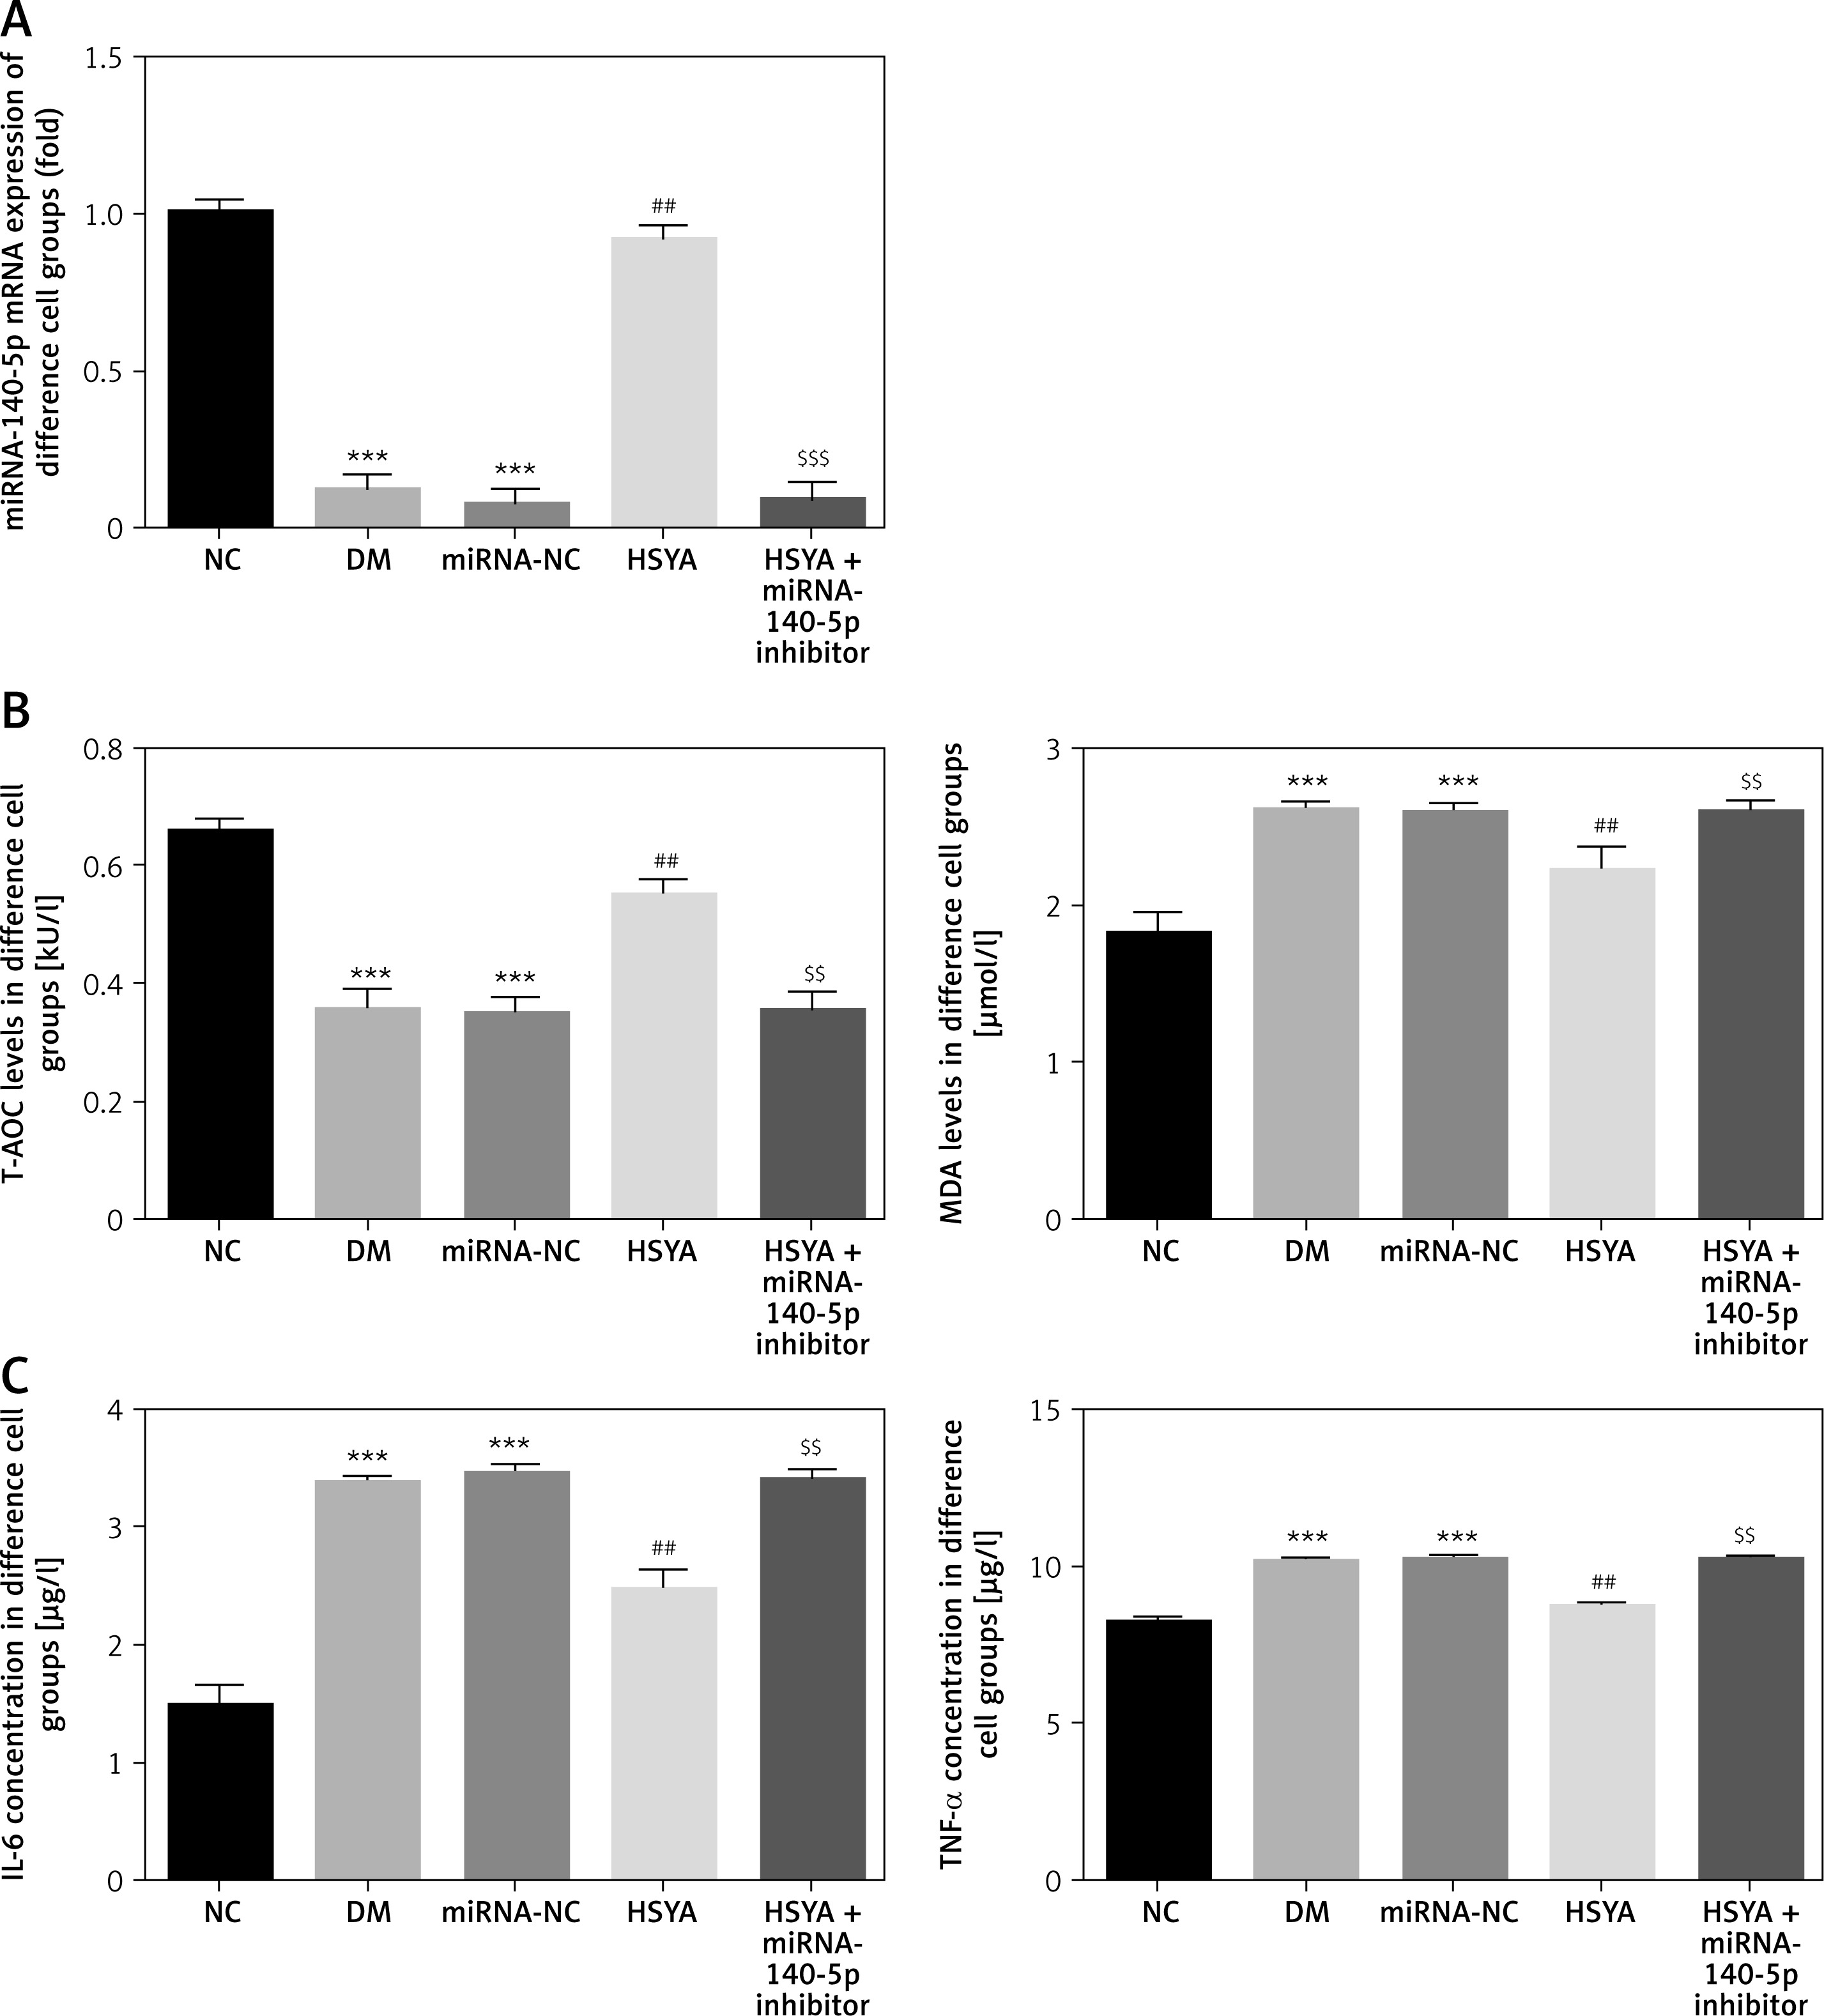
Using the RT-qPCR assay, the miRNA-140-5p mRNA level in the DM and miRNA-NC groups was significantly suppressed compared with that in the NC group (p < 0.001, respectively, Figure 5 A). With HSYA supplement, the miRNA-140-5p mRNA level in the HSYA group was significantly up-regulated (p < 0.01, Figure 5 A) compared with the DM group. With HSYA and miRNA-140-5p inhibitor transfection, the miRNA-140-5p mRNA level in the HSYA + miRNA-140-5p inhibitor group was significantly suppressed (p < 0.001, Figure 5 A) compared with the HSYA group. The T-AOC level in the DM and miRNA-NC groups was significantly down-regulated compared with that in the NC group (p < 0.001, respectively, Figure 5 B). The T-AOC level in the HSYA group was significantly up-regulated compared with that in the DM group (p < 0.01, Figure 5 B). The T-AOC level in the HSYA+miRNA-140-5p group was significantly down-regulated compared with that in the HSYA group (p < 0.01, Figure 5 B). The MDA, IL-6, and TNF-α levels in the DM and miRNA-NC groups were significantly up-regulated compared with those in the NC group (p < 0.001, respectively, Figures 5 B and C). Compared with the DM group, the MDA, IL-6, and TNF-α levels in the HSYA group were significantly down-regulated (p < 0.01, respectively, Figures 5 B, C). Compared with the HSYA group, the MDA, IL-6, and TNF-α levels in the HSYA group were significantly up-regulated (p < 0.01, respectively, Figure 5 B, C).
Figure 5
miRNA-140-5p mRNA expression, T-AOC, MDA, IL-6, and TNF-α concentration in different groups. NC: The HK-2 cells were cultured by conventional medium; DM: The HK-2 cells were treated with diabetes; HSYA: The HK-2 cells were treated with HSYA (10 mg/kg) based on high glucose; HSYA+miRNA-140-5p inhibitor: HK-2 cells were transfected with miRNA-140-5p and treated with HSYA (10 mg/kg) based on high glucose. A – miRNA-140-5p mRNA levels in different groups by RT-qPCR assay. B – T-AOC and MDA levels in different groups. C – IL-6 and TNF-α levels in different groups
***P < 0.001, compared with NC; ##p < 0.01, compared with DM; $$$p < 0.001, compared with HSYA.
miRNA-140-5p affects HSYA treatment
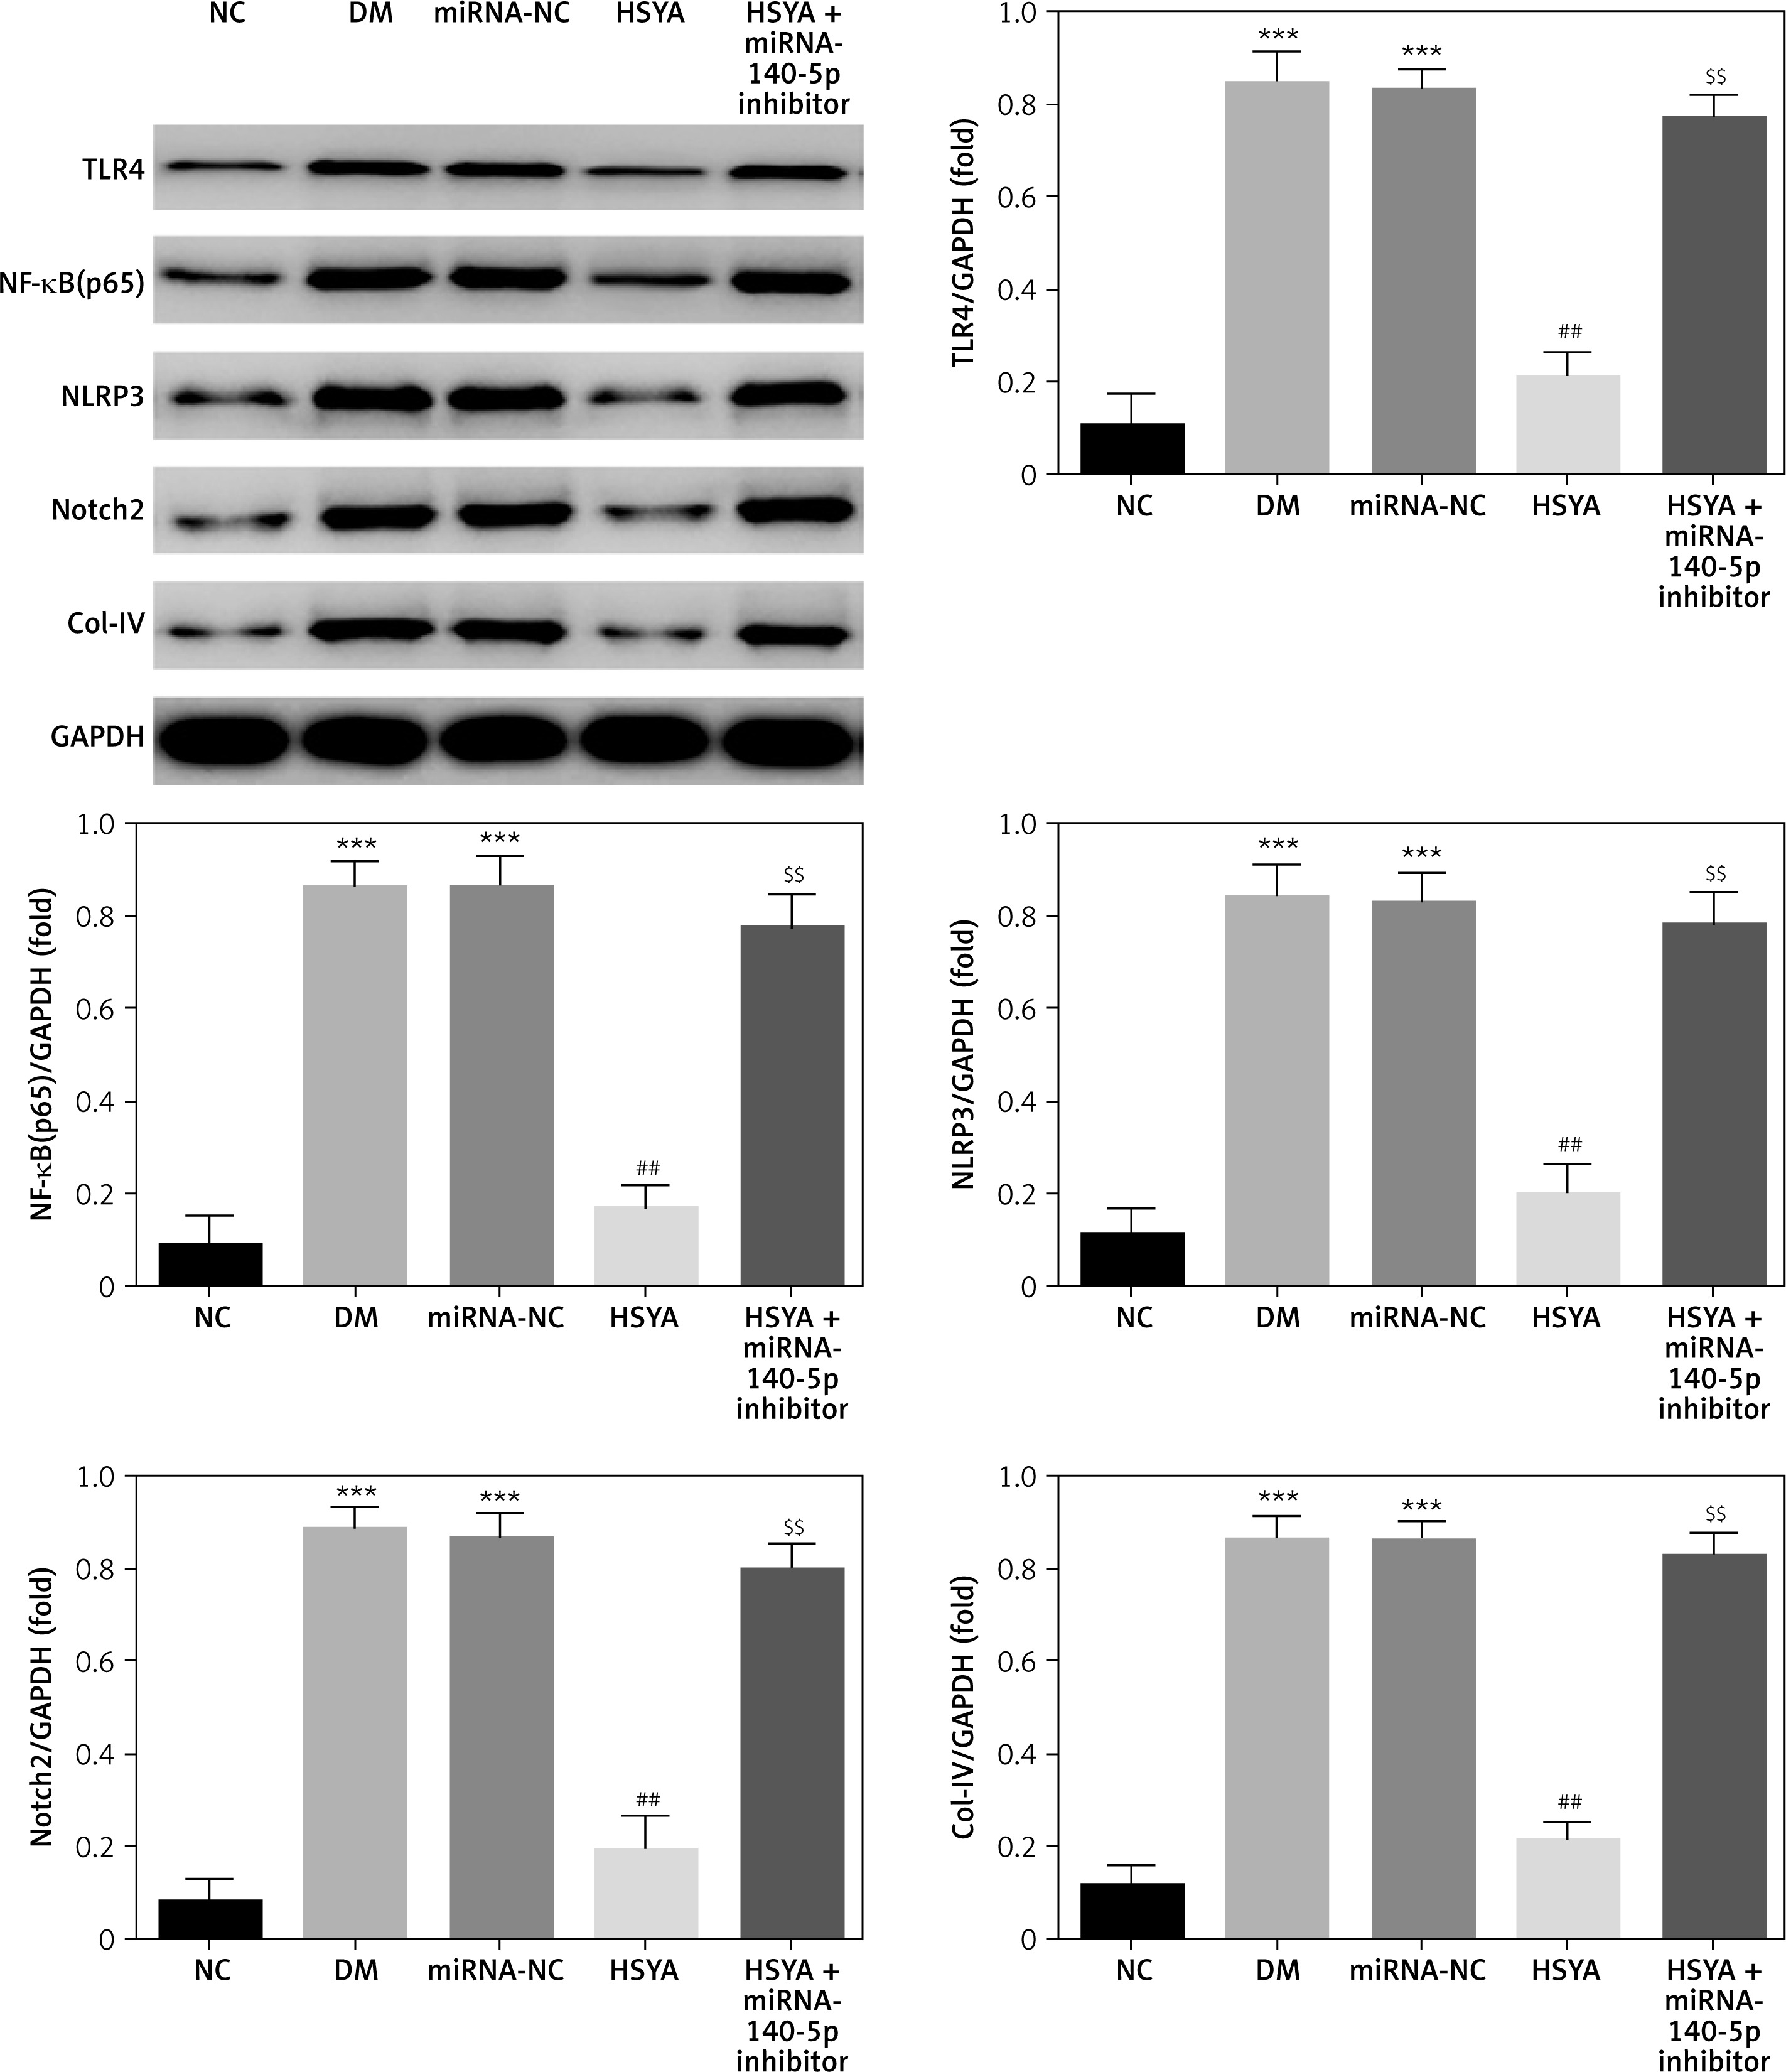
Compared with the NC group, the TLR4, NF-κB(p65), NLRP3, Notch2, and Col-IV protein expressions in the DM and miRNA-NC groups were significantly increased (p < 0.001, respectively, Figure 6). With HSYA supplementation, TLR4, NF-κB(p65), NLRP3, Notch2, and Col-IV protein expressions in the HSYA group were significantly suppressed compared with those in the DM group (p < 0.01, respectively, Figure 6). With HSYA and miRNA-140-5p inhibitor supplementation, the TLR4, NF-κB(p65), NLRP3, Notch2, and Col-IV protein expressions in the HSYA+miRNA-140-5p inhibitor group were significantly up-regulated (p < 0.01, respectively, Figure 6).
Figure 6
The relative protein expressions in different groups by WB assay. NC: The HK-2 cells were cultured by conventional medium; DM: The HK-2 cells were treated with diabetes; HSYA: The HK-2 cells were treated with HSYA (10 mg/kg) based on high glucose; HSYA + miRNA-140-5p inhibitor: HK-2 cells were transfected with miRNA-140-5p and treated with HSYA (10 mg/kg) based on high glucose
***P < 0.001, compared with NC; ##p < 0.01, compared with DM; $$$p < 0.001, compared with HSYA.
TLR4 and Notch2 location and expression by cellular immunofluorescence
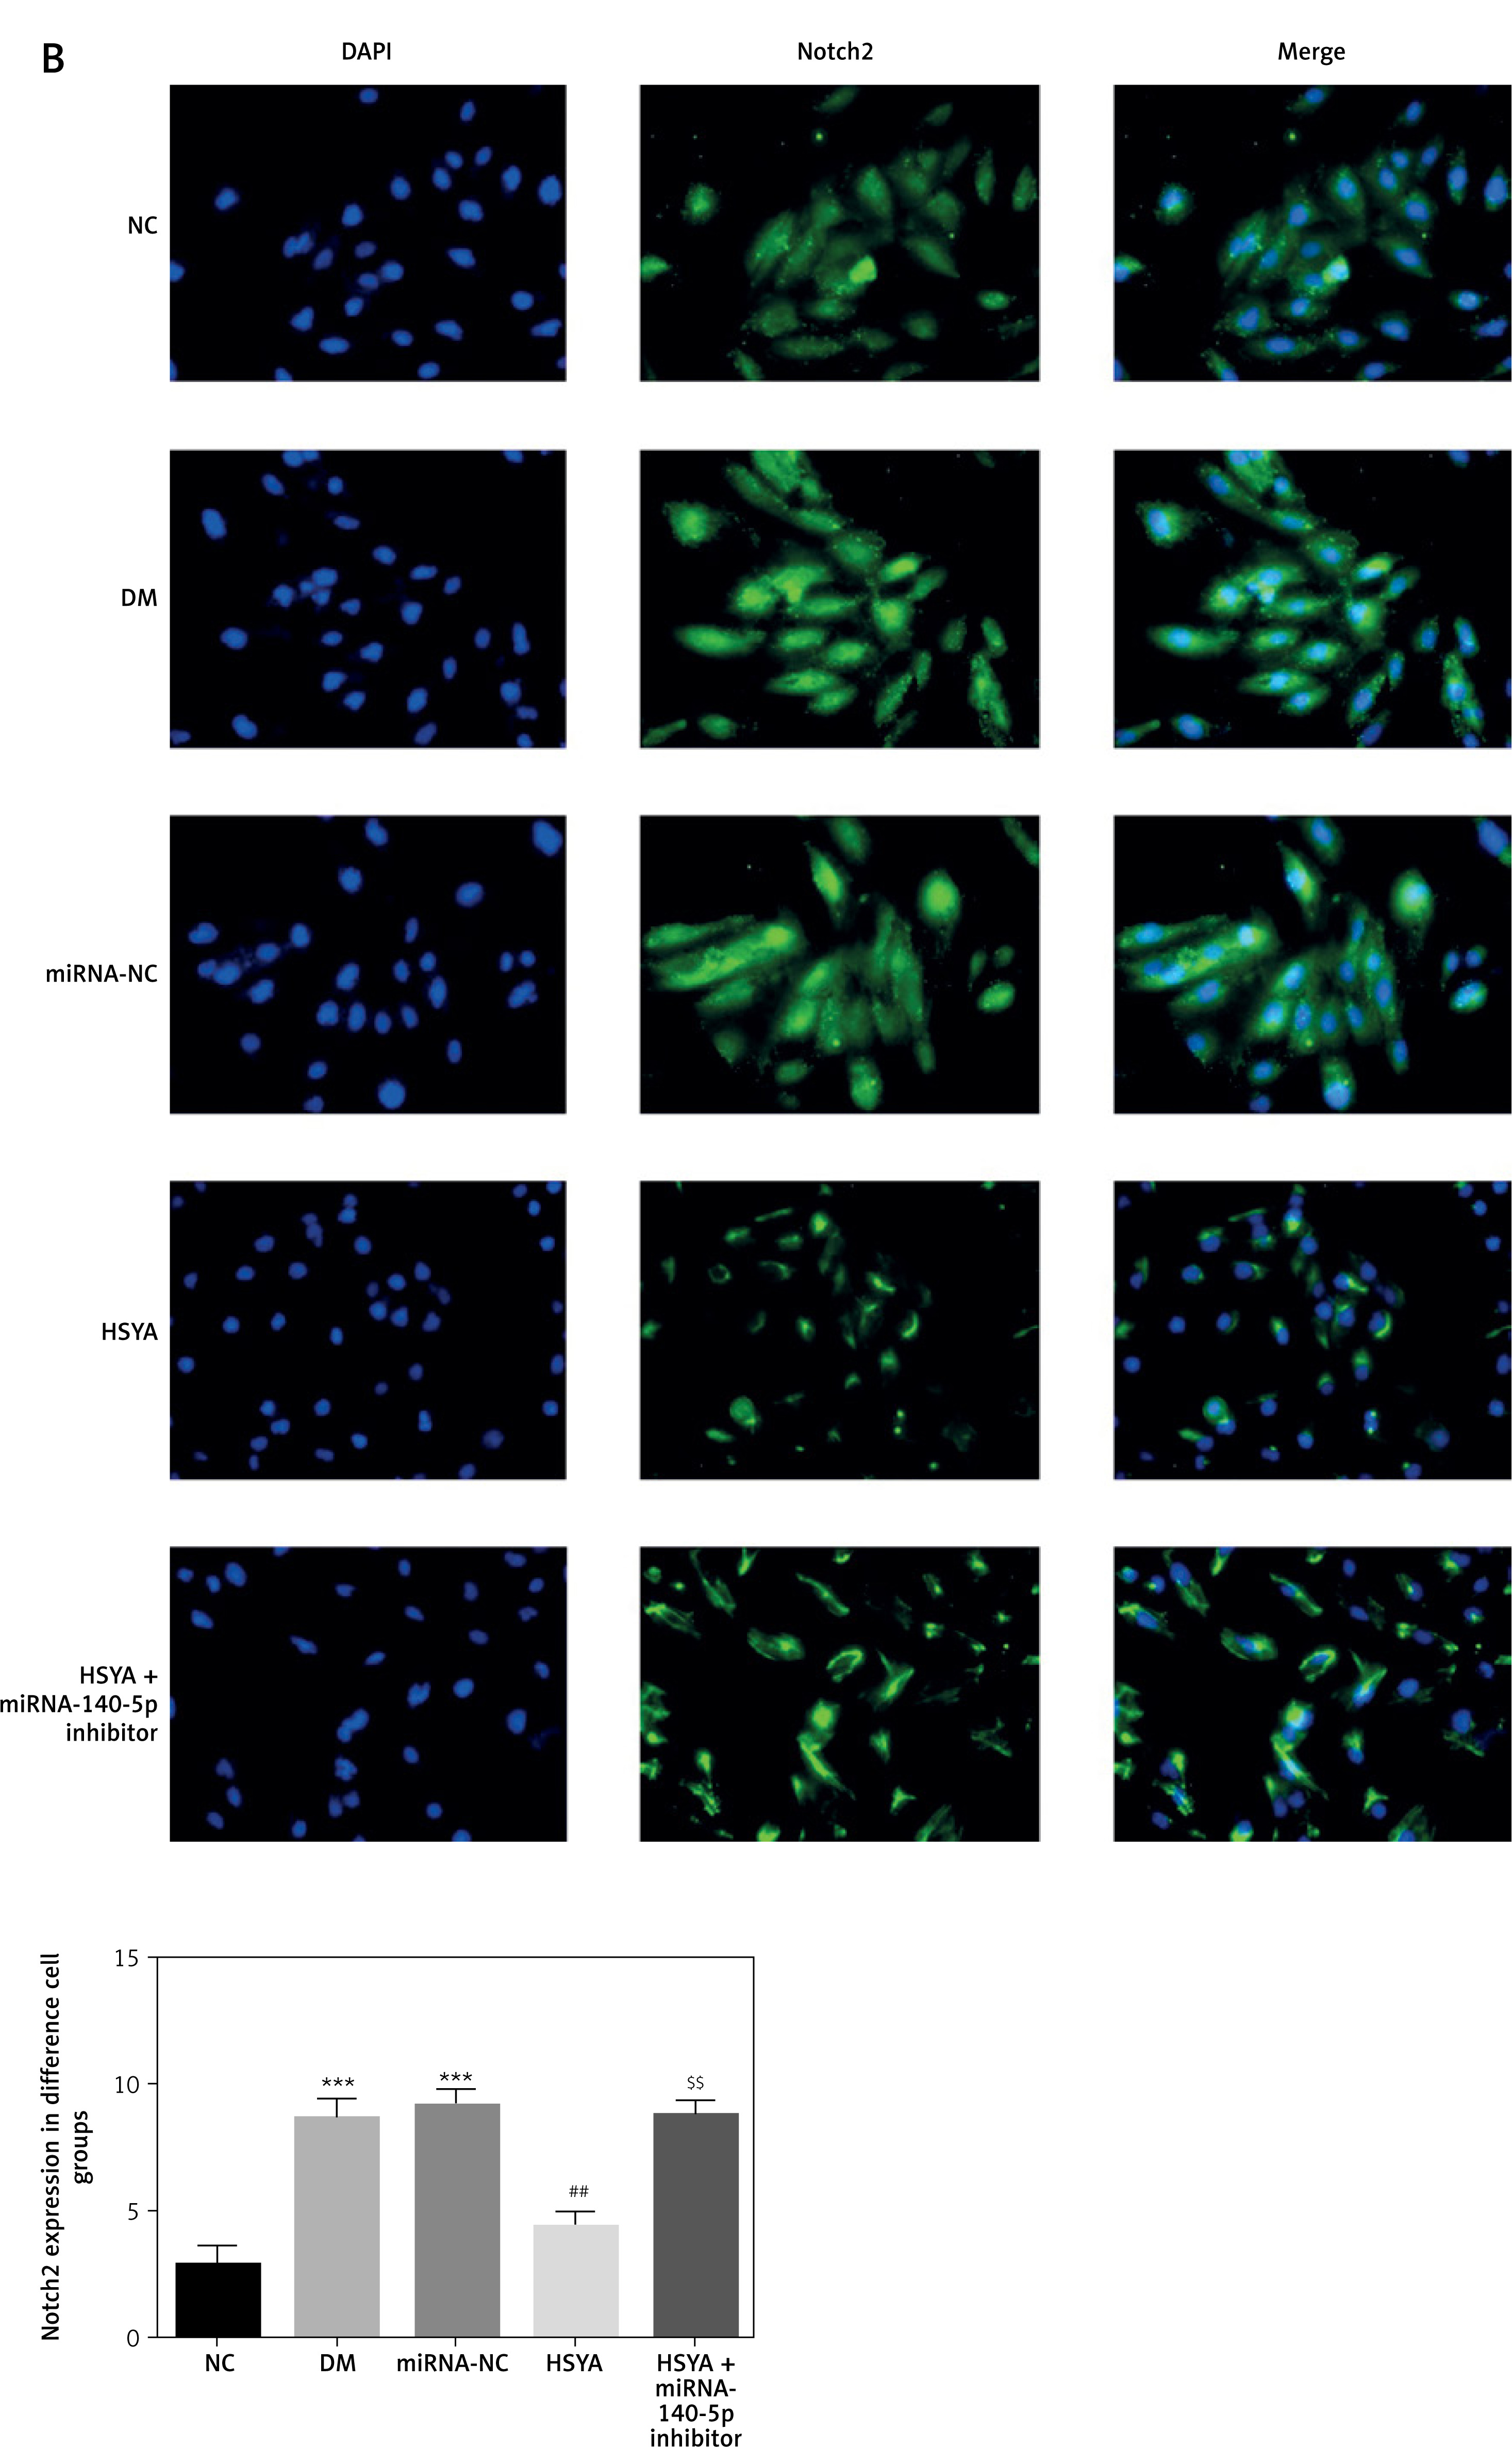
By cellular immunofluorescence, TLR4 and Notch2 were located in the cell cytoplasm. The TLR4 and Notch2 protein expressions in the DM and miRNA-NC groups were significantly up-regulated compared with those in the NC group (p < 0.001, respectively, Figure 7). With HSYA supplement, the TLR4 and Notch2 protein expressions in the HSYA group were significantly suppressed compared with those in the DM group (p < 0.01, respectively, Figure 7). Meanwhile, TLR4 and Notch2 protein expressions of the HSYA + miRNA-140-5p inhibitor groups were significantly up-regulated compared with those in the HSYA group (p < 0.01, respectively, Figure 7).
Figure 7
TLR4 and Notch2 location and protein volume in different groups by cellular immunofluorescence. A – TLR4 location in different groups by cellular immunofluorescence (200×). B – Notch2 location in different groups by cellular immunofluorescence (200×).
***P < 0.001, compared with NC; ##p < 0.01, compared with DM; $$$p < 0.001, compared with HSYA.
NLRP3 and Col-IV location and expression by cellular immunofluorescence
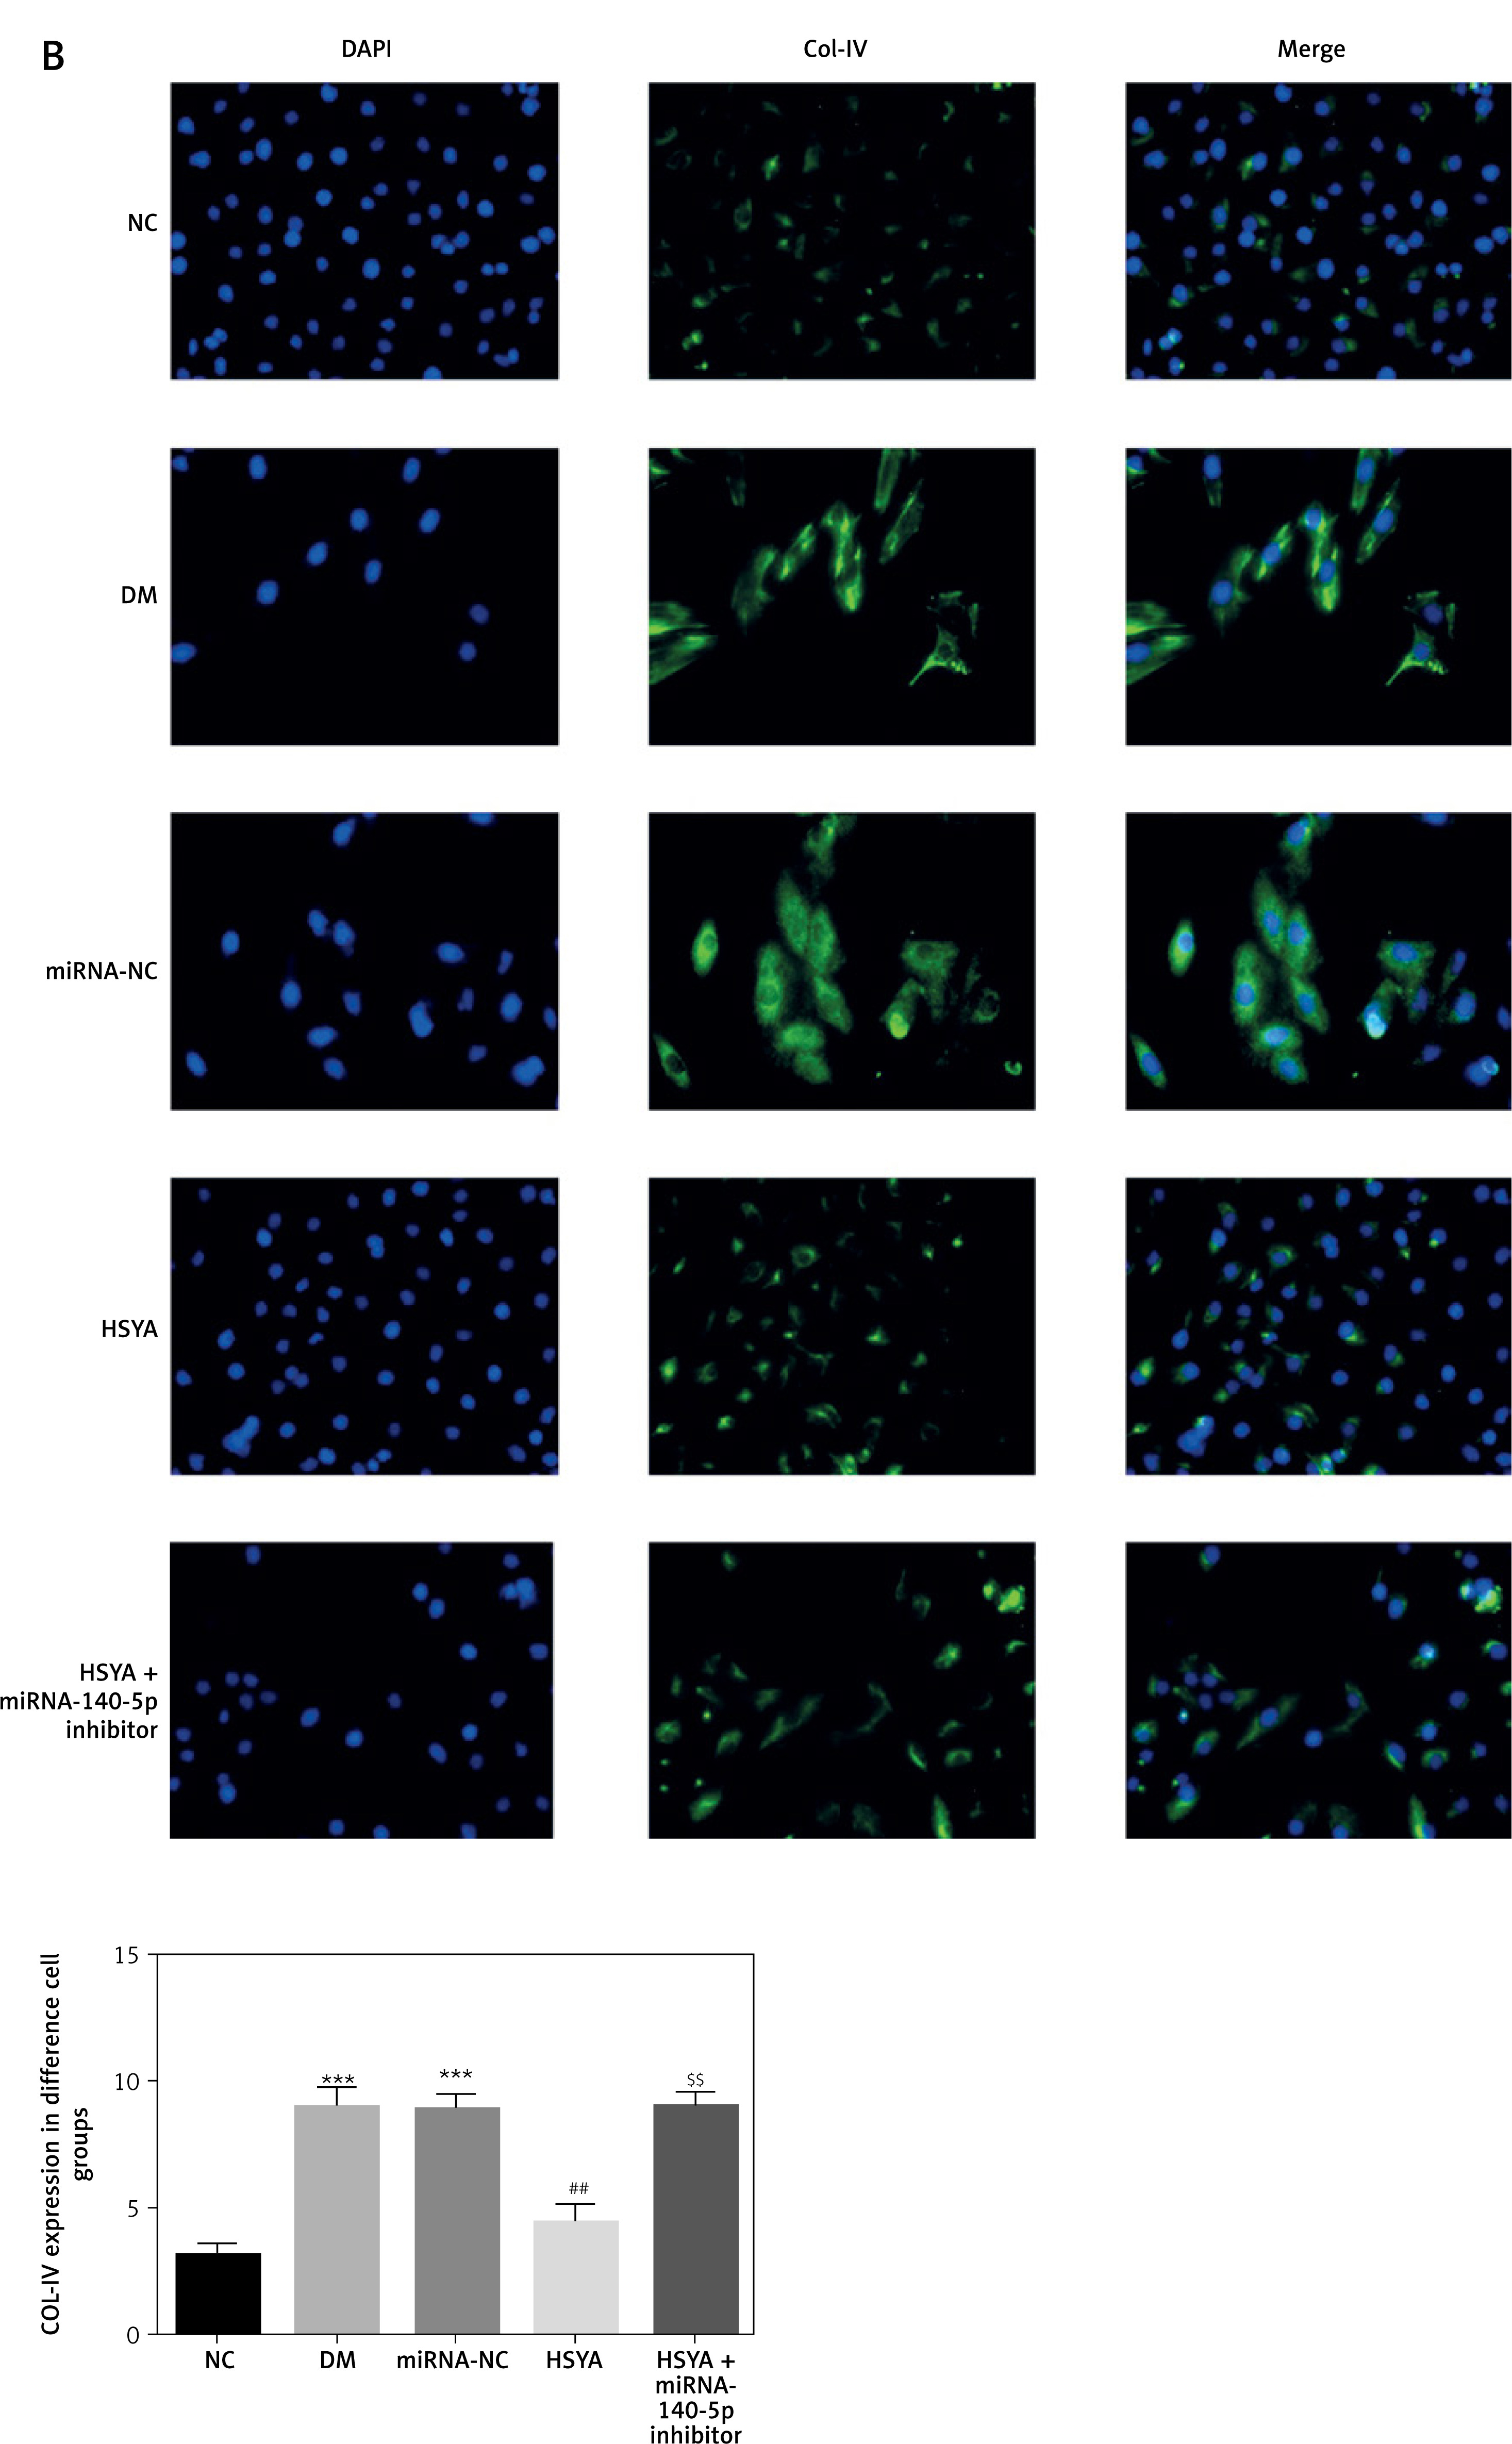
By cellular immunofluorescence, NLRP3 and Col-IV were located in the cell cytoplasm. The NLRP3 and Col-IV protein expressions in the DM and miRNA-NC groups were significantly up-regulated compared with those in the NC group (p < 0.001, respectively, Figure 8). With HSYA supplementation, the NLRP3 and Col-IV protein expressions in the HSYA group were significantly suppressed compared with those in the DM group (p < 0.01, respectively, Figure 8). Meanwhile, the NLRP3 and Col-IV protein expressions in the HSYA + miRNA-140-5p inhibitor groups were significantly up-regulated compared with those in the HSYA group (p < 0.01, respectively, Figure 8).
Figure 8
NLRP3 and Col-IV location and protein volume in different groups by cellular immunofluorescence. A – NLRP3 location in different groups by cellular immunofluorescence (200×). B – Col-IV location in different groups by cellular immunofluorescence (200×)
***P < 0.001, compared with NC; ##p < 0.01, compared with DM; $$$p < 0.001, compared with HSYA.
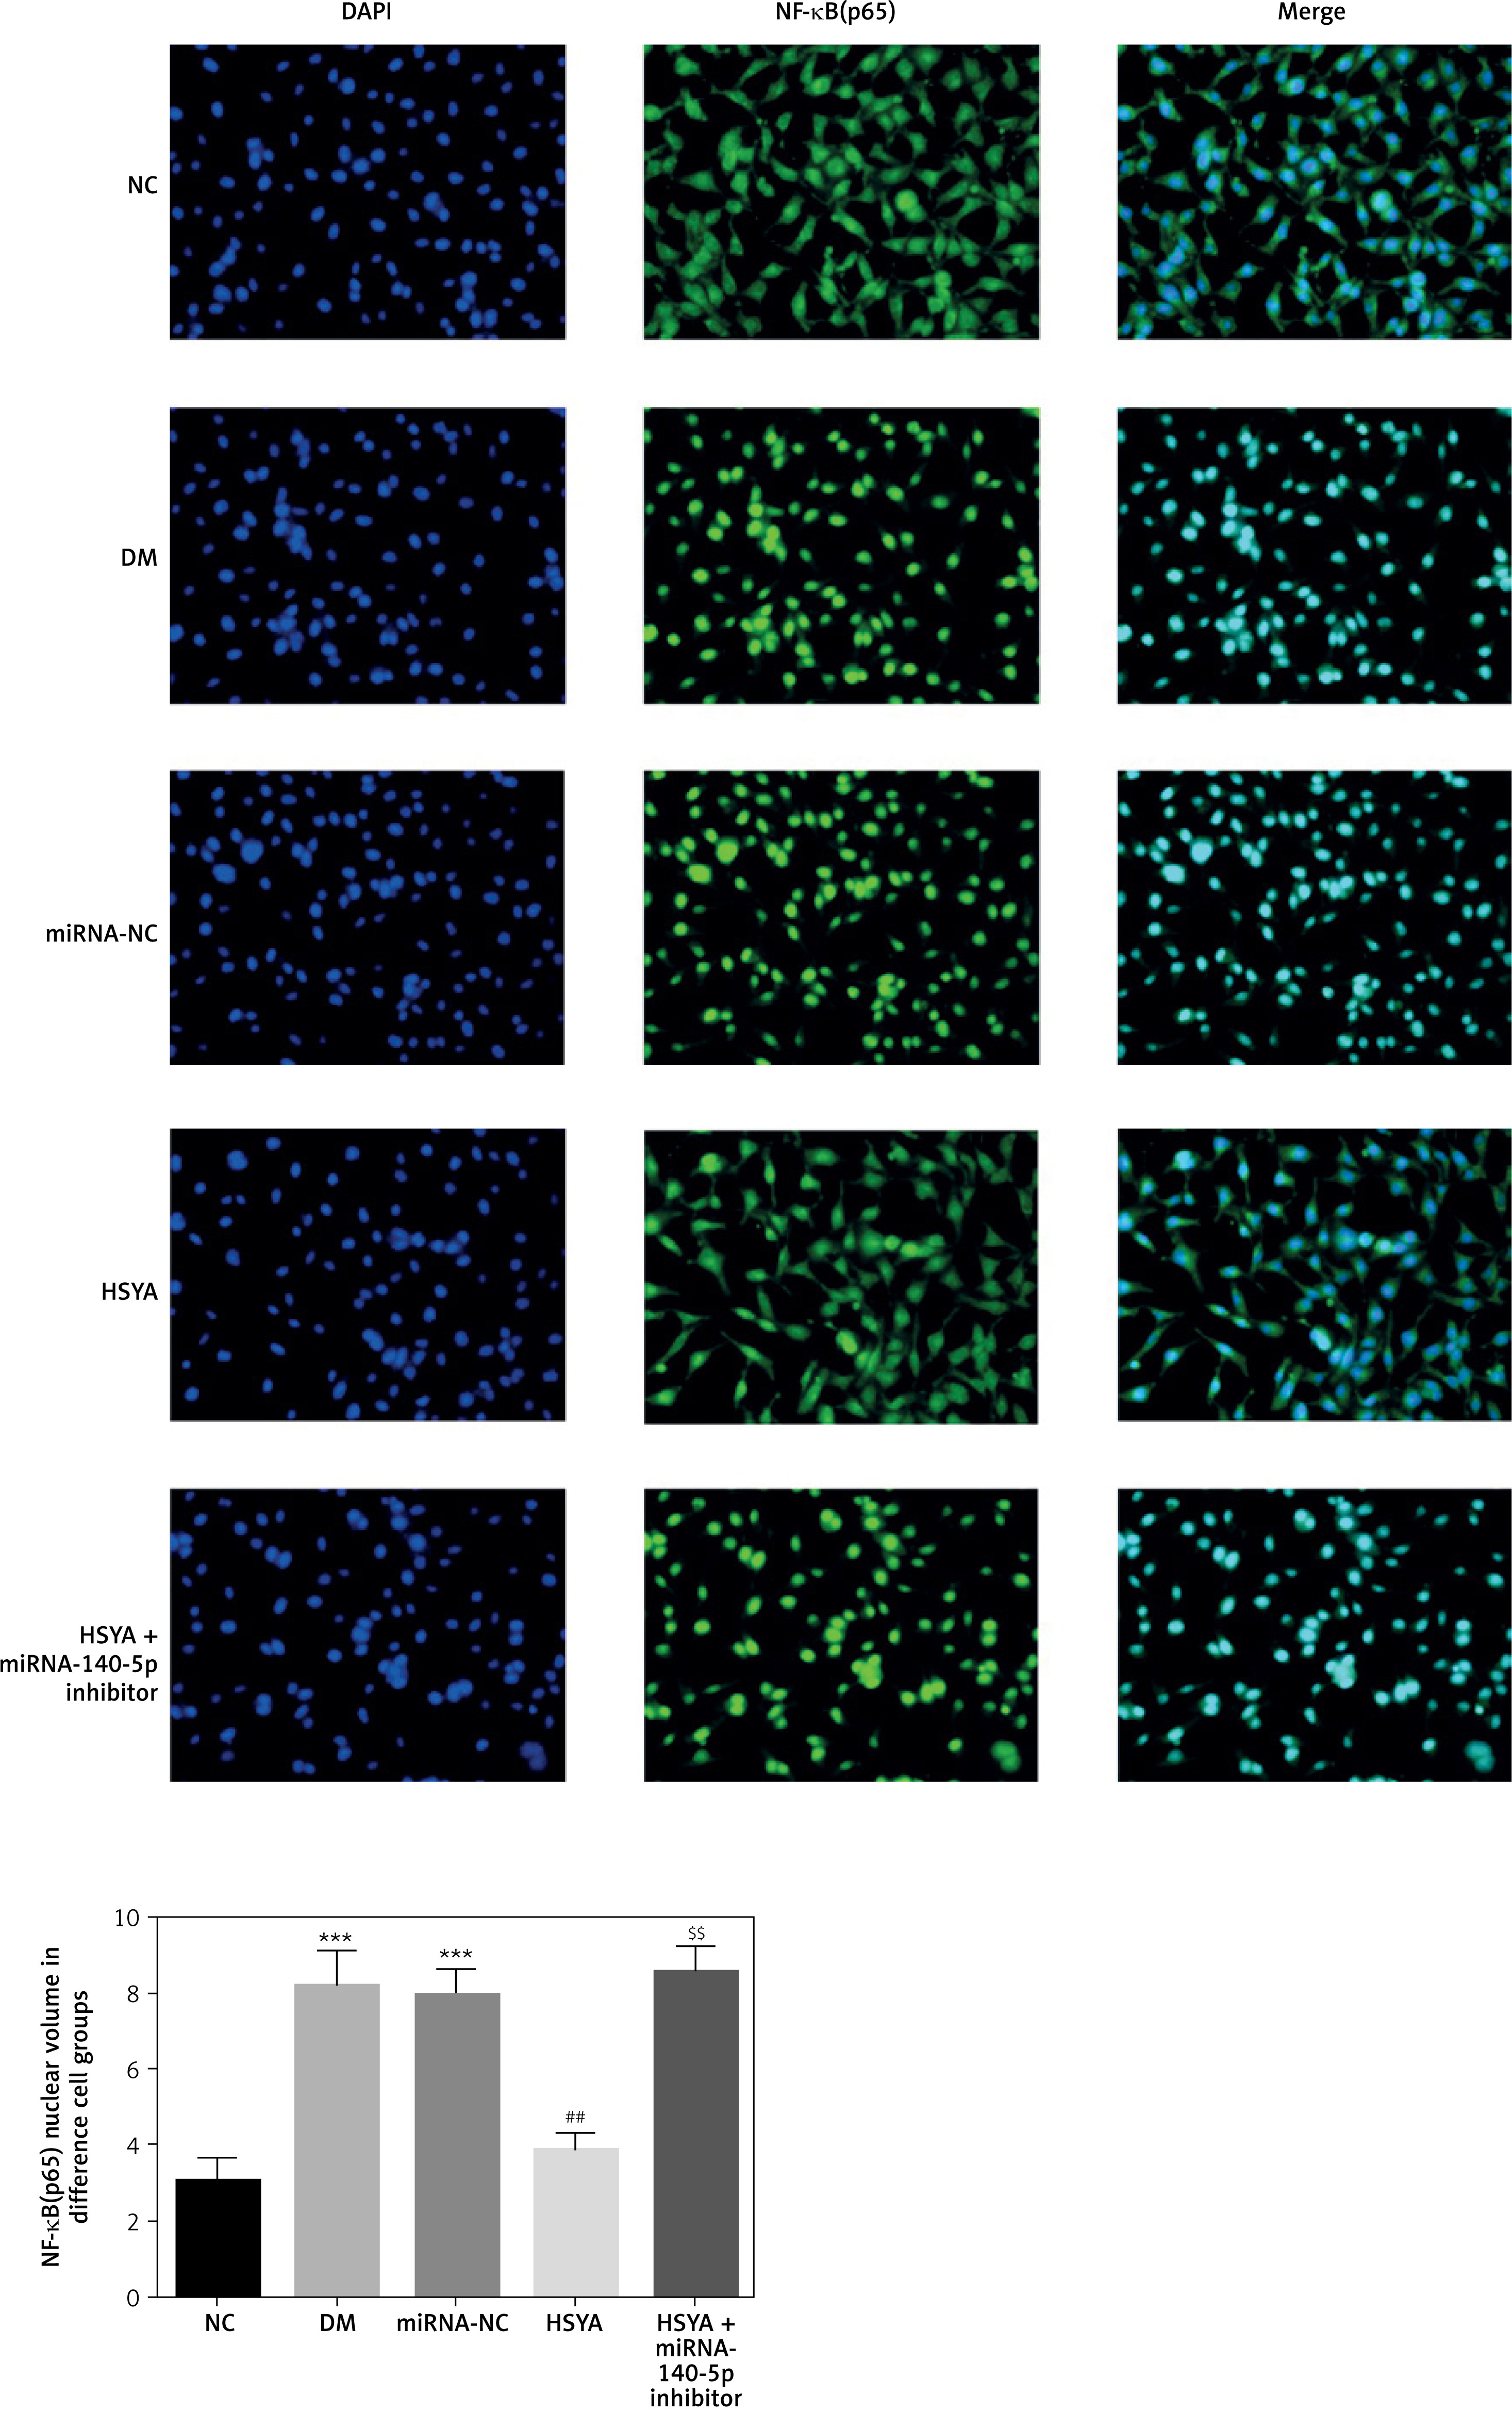
NF-κB(p65) location and nuclear volume by cellular immunofluorescence
By cellular immunofluorescence, activating NF-κB(p65) was located in the nuclear cytoplasm. The NF-κB(p65) nuclear volumes in the DM and miRNA-NC groups were significantly up-regulated compared with that in the NC group (p < 0.001, respectively, Figure 9). With HSYA supplementation, the NF-κB(p65) protein nuclear volume in the HSYA group was significantly decreased compared with that in the DM group (p < 0.01, Figure 9). Meanwhile, the NF-κB(p65) protein nuclear volumes in the HSYA + miRNA-140-5p inhibitor groups were significantly up-regulated compared with that in the HSYA group (p < 0.01, Figure 9).
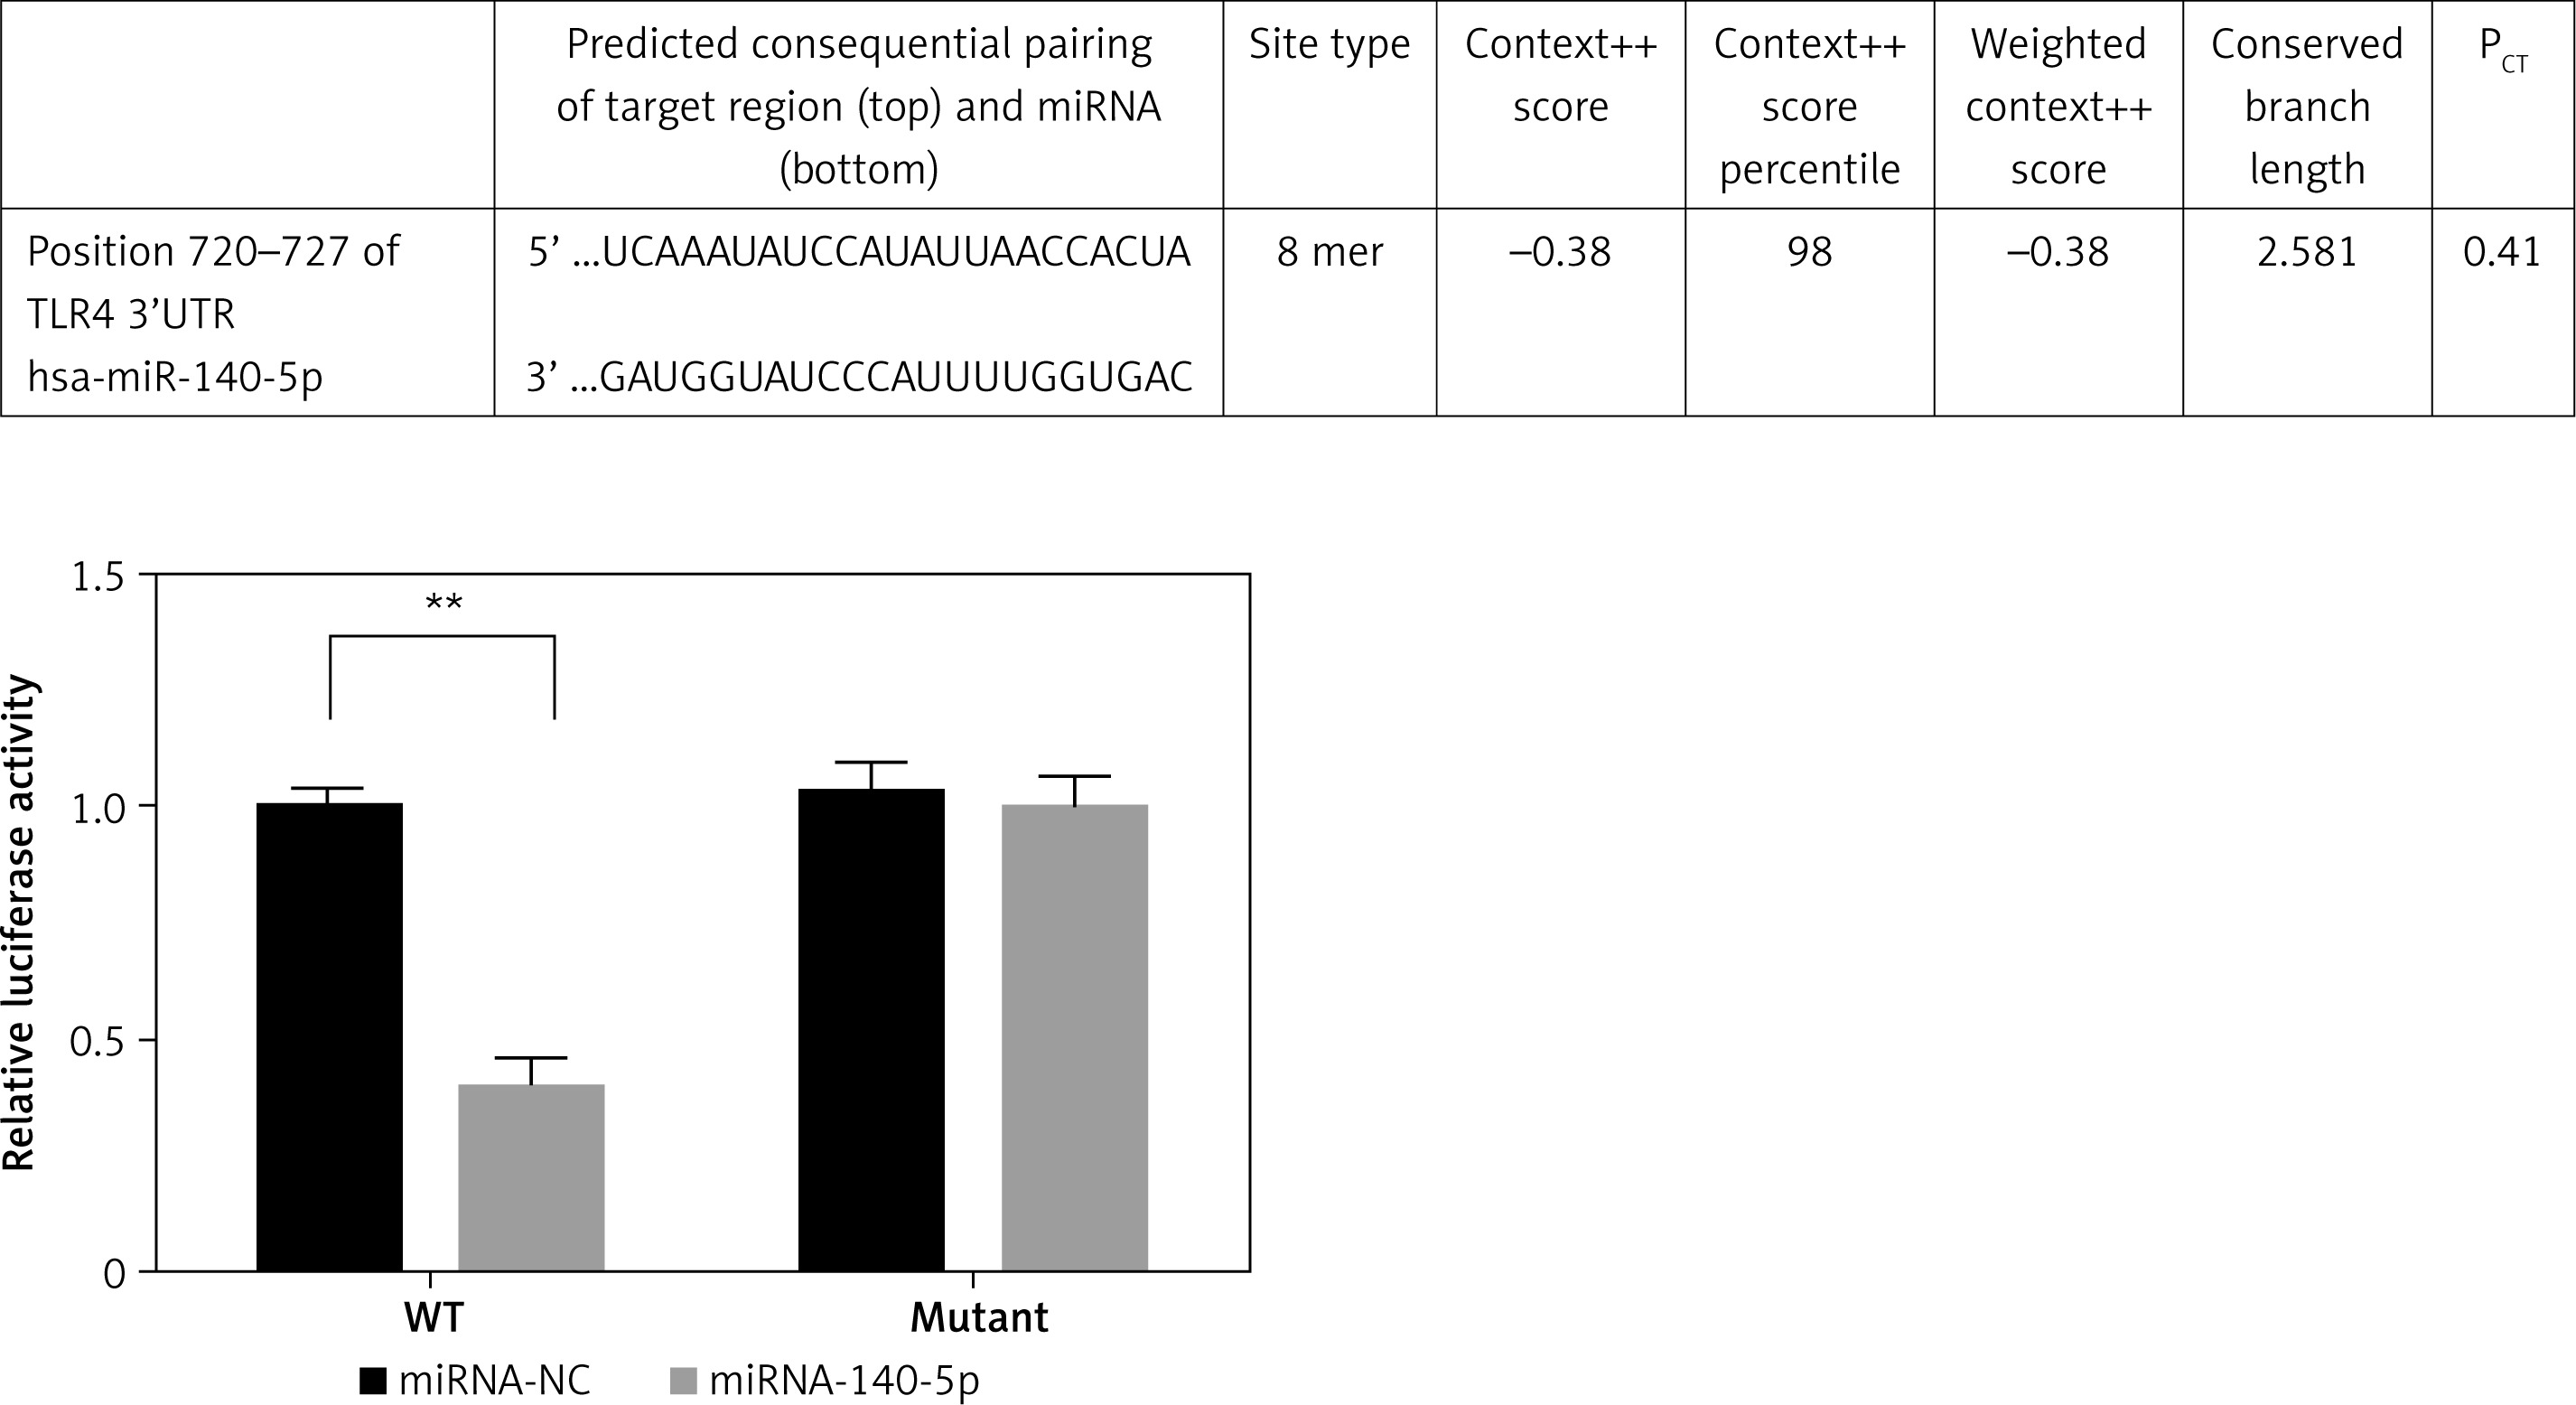
Correlation between miRNA-140-5p and TLR4 in HK-2 cells
In WT, TLR4 luciferase activity of miRNA-140-5p was significantly down-regulated compared with that of the miRNA-NC (p < 0.01); however, significant differences were observed in the luciferase activities between the miRNA-NC and miRNA-140-5p groups (Figure 10).
Discussion
Safflower yellow, a chalcone compound, is a natural yellow pigment extracted from safflower petals, with HSYA as its main component. Studies revealed that [8] HSYA can prevent renal tubular apoptosis, kidney inflammatory response, and oxidative stress in acute kidney injury. However, the present study found that as well as inhibiting the progression of macrophage infiltration and interstitial fibrosis during renal tubular epithelial–mesenchymal transition of renal interstitial fibrosis in unilateral ureteral obstruction, HSYA may also slow down the destruction rate of the tubular basement membrane by reducing the expression of matrix metalloproteinases, suggesting its beneficial effects to prevent and treat chronic kidney diseases. In our experiment, despite HSYA exhibiting no hyperglycaemic action, its hypolipidaemic effect could alleviate kidney damage caused by lipaemia, thereby reducing 24-h UP. Furthermore, under the DM state, its capacity to reduce the level of oxidative stress in the kidney tissues, inhibit inflammatory factor secretion, and lower Col-IV protein expression suggest that HSYA can exert a protective effect on the kidneys of diabetic rats through anti-inflammatory and anti-fibrosis activities.
Despite the complicated pathogenesis of different DN conditions, they are all subject to the common rule that all factors rely on the intracellular signalling pathways to transduce extracellular information to the cytoplasm and nucleus so as to induce cell behaviour changes. With the progression of research, the confirmation of the role of inflammatory response in DN leads to the notion that DN is a natural immune and chronic low-grade inflammatory disease. In this context, the mechanism of how the inflammatory response promotes DM renal fibrosis should be elucidated. However, the protective mechanism of HSYA for its anti-inflammatory and anti-fibrotic effects in DM renal fibrosis remains unclear. Our study confirmed through in vitro and in vivo experiments that the expressions of TLR4, NF-κB (p65), and NLRP3 proteins were significantly increased under the high-glucose state, and the secretion of inflammatory factors IL-6 and TNF-α was enhanced. This suggests that the inflammatory signalling pathway was activated and involved in kidney damage, which is consistent with the results of Garibotto et al. [9]. The activation of TLR4 can lead to the translocation of NF-κB (p65) to the nucleus, thereby resulting in the activation of downstream NLRP3 protein [10–13] and inducing the inflammatory response. Some specific microRNAs play a crucial role in the fibrosis process of tissues [14, 15]. miRNAs are a class of single-stranded and non-coding RNAs of approximately 20–25 nt in length, which regulate the expression of target genes at the post-transcriptional level, mainly by inhibiting their translation [16].
After treatment with HSYA, the expression of miRNA-140-5p in the kidney tissues was significantly inhibited, and the degree of fibrosis decreased. However, the transfection of miRNA-140-5p inhibitor into HK-2 cells inhibited the therapeutic effect of HSYA. Thus, HSYA may improve diabetes-induced renal fibrosis by inhibiting miRNA-140-5p.
The Notch signalling pathway plays a significant role in embryonic development, blood cell development, cell proliferation, differentiation, apoptosis, tumour development, inflammation, and other physiological and pathological processes. There are four subtypes of Notch in mammals, i.e. Notch 1–4 [17–19]. In the classical Notch signalling pathway, the extracellular domain of the Notch receptor first binds to the ligand and is then cleaved by disintegrin–metalloproteinase and secretase, leading to the release of intracellular domain, whose entry into the cells induces the transcription of Notch target genes, such as Hes1. In recent years, TLR agonists have been shown to enhance TLR immune response by modulating the expression of Notch receptors and ligands, suggesting that Notch signalling is associated with TLR-mediated inflammation [20–22]. However, neither the expression relationship between Notch2 and TLR4 nor the studies exploring the association between Notch2 and NLRP3 expression in DM kidney tissues have been reported to date. Our findings indicate that the expression levels of Notch2, TLR4, and NLRP3 in the DM group were all increased significantly in both in vivo and in vitro experiments, accompanied by increased secretion of inflammatory factors and elevated deposition of extracellular matrix. The expression of Notch2 was significantly decreased following treatment with HSYA and significantly positively correlated with the reduced expressions of TLR4 and NLRP3; the expression level of miRNA-140-5p was significantly increased while exhibiting a negative correlation. Also, the secretion of inflammatory factors and extracellular matrix was also significantly reduced, suggesting that the protective effects of HSYA may be achieved by up-regulating miRNA-140-5p to inhibit the expressions of TLR4 and Notch2 proteins, thereby alleviating the occurrence and development of DN inflammatory response and fibrotic lesions.
In conclusion, depending on our in vitro and in vivo study, the results revealed that HYSA could improve renal fibrosis induced by diabetes via regulation of the TLR4/NF-κB(p65) pathway.