Introduction
Diabetic nephropathy (DN) is the leading cause of kidney failure [1, 2] and is commonly observed as a complication of type 1 diabetes (T1D). Among the many complications of diabetes, diabetic nephropathy is a major complication affecting the quality of life, and other complications include erectile dysfunction, saliva secretion disorders, etc. [3–5]. It results in injury and damage to the renal glomeruli. It is important to note that up to 40% of patients with diabetes mellitus will eventually develop diabetic kidney diseases. The underlying mechanism for the development of DN remains unclear; however, several studies have suggested that increased blood flow and intra-capillary pressure contribute to kidney failure [6]. Some studies have shown that hyperglycemia, a characteristic feature of diabetes, promotes the production of matrix and induces apoptosis of mesangial cells [7, 8].
Lysozyme (LYZ) is an integral component of the innate immune system and is known for its antibacterial properties. It is produced by various cell types, with higher expression observed in mucus and saliva [9, 10]. The LYZ gene encodes human lysozyme. While its classical function is antibacterial [11], lysozyme has also been reported to exhibit immunosuppressive effects by suppressing the high mobility group box1 and regulating the tumor necrosis factor (TNF) pathway [12, 13]. Furthermore, lysozyme has also demonstrated a strong ability to bind with nucleic acid [14]. Saliva is the main mode of lysozyme secretion, and insufficient saliva secretion is one of the common oral complications of end-stage renal disease [15]. The role of lysozyme in diabetic nephropathy, however, remains poorly defined.
JAKs belong to the tyrosine kinase family. The STAT signaling pathway is a downstream signaling pathway activated by JAKs [16]. Elevated glucose has been reported to promote activation of the JAK/STAT3 signaling pathway. This activation contributes to the increased expression of transforming growth factor-β (TGF-β), collagen IV extracellular matrix proteins, and fibronectin induced by glucose [17–19]. Administration of the JAK2 inhibitor AG-490 in the DN model has been reported to attenuate blood pressure and reduce the level of protein in the urine [20]. Proliferation of fibroblasts and synthesis of the extracellular matrix are major contributors to the progression of interstitial fibrosis. Hyperglycemia in the environment can activate fibroblasts, leading to their proliferation and matrix production. However, the mechanism of fibroblast activation has yet to be addressed [21, 22]. In this study, we propose a novel mechanism of glucose-induced fibroblast activation and suggest a potential preventive strategy for DN.
Material and methods
Animal models
Preparation of DN mice model
A total of 15 seven-week-old C57 mice were bred under specific pathogen-free (SPF) conditions. All mice were fasted overnight and then given a single intraperitoneal injection of 60 mg/kg STZ dissolved in 10 mM citrate buffer (pH 4.5). Four weeks after STZ administration, FBG was measured in tail vein samples using a blood glucose meter (LifeScan, California, USA). Mice with FBG levels above 16.7 mM for 3 consecutive days were considered DM. DM mice were given regular food and tap water for 12 weeks. All DM mice were transferred to a metal metabolic cage and 24-h urine samples were accurately collected. A 24-hour urinary albumin excretion rate of 30 mg/24 h indicated successful construction of DN. In this study, a total of 50 mice were selected to measure blood glucose, creatinine, BUN, and urinary ACR every weeks. In addition, 3 mice were sacrificed every 4 weeks, kidney tissue was taken, LYZ-mRNA expression was measured by qPCR, and renal LYZ protein expression content was measured by immunohistochemistry.
Preparation of LYZ knockdown and overexpression mouse model
Three LYZ knockdown and three overexpressed mice were prepared by tail vein injection of siRNA of LYZ and LYZ overexpression plasmids after enrollment. The rest of the mold making methods were the same as above, and the materials were tested after 16 weeks of molding.
Bioinformatics analysis
The expression levels of LYZ were obtained from the GEO (ID: GSE30122) dataset. A t-test was used to compare the difference in LYZ expression between the DN sample (n = 10) and the healthy sample (n = 12).
Cell culture experiments
In our laboratory, we maintained NRK-49F cells, which are derived from a normal rat kidney fibroblast cell line. The cells were cultured in 10% fetal bovine serum (FBS)-supplemented Dulbecco’s modified Eagle medium (DMEM) (Gibco, USA). The renal tubular cells were isolated from embryo mice and cultured in 10% fetal bovine serum (FBS)-supplemented Roswell Park Memorial Institute (RPM) 1640 (Gibco, USA). All these cells were cultured under standard conditions.
Immunoblotting
Cells were lysed using a lysis buffer, and protein concentration was determined using the bicinchoninic acid (BCA) assay. The protein samples were subject to electrophoresis and transferred onto PVDF membranes. The PVDF was then incubated with primary antibodies against LYZ, MMP-2, TGF-β1, STAT3, and MMP9 (Abcam). As an internal control, an anti-GAPDH antibody from CST was used for normalization purposes.
Quantitative real-time PCR
Total RNA samples were extracted using the Plus iso RNA kit (Takara Bio Inc., Japan). For the detection of mRNA, 1 µg of total RNA was reverse transcribed by the Script RT Master kit of choice (Takara Bio Inc., Japan). Quantitative real-time PCR was carried out with SYBR Green using the ViiA7 System (AB Applied Biosystems, USA). The following primers were used: LYZ F: CTTGTCCTCCTTTCTGTTACGG, LYS R: CCCCTGTAGCCATCCATTCC
GAPDH F: GGAGCGAGATCCCTCCAAAAT, GAPDH R: GGCTGTTGTCATACTTCTCATGG.
CCK-8 assay
For the CCK-8 experiment, NRK-49F fibroblast cells were plated in 96-well plates in DMEM supplemented with 10% FBS. Cells were divided into a group with LYZ knockdown and a group with upregulation of LYZ. After cell plating, 200 µl of medium containing the CCK-8 reagent was added to each well, and these were treated with or without JAK inhibitor. The OD value was assessed at the indicated time point according to the instructions (0, 24, 48, and 72 h).
Western blot
To extract the protein in the cells, a strong RIPA lysing reagent (Millipore, USA) containing 1% PMSF (Millipore, USA) was utilized. Protein concentration for each sample was determined using the BCA method. Subsequently, 30 µg of protein from each sample was then electrophoresed on an SDS-PAGE gel (Mellon, Dalian, China) and transferred to PVDF membranes (Merck, USA). To minimize nonspecific binding, membranes were incubated with 5% BSA (Merck, USA) for 2 h. The primary antibodies, including LYZ (1 : 500; Cat No. 15013-1-AP, Proteintech, Wuhan, China), fibronectin (1 : 2000; Cat No. 15613-1-AP, Proteintech, Wuhan, China), collagen I (1 : 1000; Cat No. 14695-1-AP, Proteintech, Wuhan, China), collagen III (1 : 500; Cat No. 22734-1-AP, Proteintech, Wuhan, China), α-SMA (1 : 5000; Cat No. 55135-1-AP, Proteintech, Wuhan, China), PCNA (1 : 2000; Cat No. 10205-2-AP, Proteintech, Wuhan, China), MMP 9 (1 : 500; Cat No. 10375-2-AP, Proteintech, Wuhan, China), MMP 2 (1 : 500; Cat No. 10373-2-AP, Proteintech, Wuhan, China), STAT3 (1 : 1000; Cat No. 10253-2-AP, Proteintech, Wuhan, China), p-STAT3 (1 : 1000; Cat No. sc-135649, Santa Cruz Biotechnology, Shanghai, China), TGF-β1 (1 : 1000; Cat No. 21898-1-AP, Proteintech, Wuhan, China) and GAPDH (1 : 2000; Cat No. 60004-1-Ig, Proteintech, Wuhan, China) were added and incubated with the PVDF membranes at 4°C overnight. After washing with TBST three times, secondary antibodies were added and incubated for 2 h, and the protein signals on the membranes were detected using the ECL reagent (Yeasen, Shanghai, China). GAPDH was set as a loading control to calculate the expression level of the target proteins.
Enzyme-linked immunosorbent assay (ELISA)
Blood samples were collected using blood collection tubes containing anticoagulants or centrifuge tubes, and specimens were centrifuged at 4°C 1000×g for 15 min after collection. The supernatant fluid was collected for use. LYZ expression levels in plasma were measured as per the ELISA kit instructions (Invitrogen, USA).
Masson staining
Paraffin sections of embedded mouse kidney tissues were routinely dewaxed to water following the instructions provided in the kit (Leagene Biotechnology Co., Ltd., Anhui, China). The following staining steps were performed: The sections were stained with prepared Weigert iron hematoxylin for 5–10 min. Acidic ethanol fractionation solution was applied for 5–15 s. The sections were washed with water. Masson blue staining solution was applied for 3–5 min, and the sections were rinsed with distilled water for 1 min. Then the sections were treated with Lichon red magenta staining solution for 5–10 min, phosphomolybdic acid solution for 1–2 min, weak acid working solution for 1 min, stained in aniline blue staining solution for 1–2 min, washed with weak acid working solution for 1 min, dehydrated with ethanol, transparent with xylene, and sealed with neutral gum.
Statistical analysis
Data from replicate experiments are presented as the mean ± standard deviation (SD). Calculations were performed using GraphPad Prism 5 software (GraphPad, San Diego, CA, USA). A threshold for statistical significance level was established at p < 0.05, and one-way analysis of variance (ANOVA) was used to identify significant differences between the groups.
Results
LYZ was overexpressed in DN renal and serum samples
For the analysis of the most significantly differentially expressed gene within DN, we analyzed the mRNA expression levels in the GEO public database (Access ID: GSE30122) using bioinformatics, and we observed that the expression of LYZ was most differentially expressed between DN patients and healthy volunteers (4-fold, p < 0.05) (Figure 1 A). Additionally, the LYZ mRNA expression levels were significantly upregulated in DN patients compared to healthy volunteers (Figure 1 B).
Figure 1
LYZ is overexpressed in DN renal and serum samples. A – Volcano plot showing differential gene expression between the DN kidney sample and the healthy kidney sample in the dataset GSE30122. B – LYZ mRNA expression level in each sample
Data represent the mean ± SD of triplicates. P-value was calculated by a two-sided Student’s t-test. *P < 0.05, **p < 0.01, ***p < 0.001.
LYZ expression was upregulated in the model of STZ-induced DN
To study the correlation between DN and LYZ, we used the STZ-induced DN mouse model. The results showed a progressive increase in fasting blood, blood urea nitrogen, urinary albumin to creatinine ratio and serum creatinine following induction with STZ, suggesting the successful establishment of the STZ-induced DN model. The effects of the STZ-induced DN became more pronounced over time (Figure 2 A). There was a gradual up-regulation of LYZ mRNA expression levels in the kidney (Figure 2 B). LYZ protein expression levels were verified using immunohistochemistry (Figure 2 C). Western blot also showed a graded increase (Figure 2 E). We quantified the proportion of LYZ-positive RTEC (Figure 2 D), and the proportion of LYZ-positive RTEC gradually increased. Furthermore, we also observed that the expression of LYZ was positively correlated with the TIF score. This suggests that the level of LYZ expression is up-regulated in the DN model and correlates with kidney fibrosis.
Figure 2
LYZ expression was upregulated in the model of STZ-induced DN. A – Fasting glucose, serum creatinine, blood urea nitrogen (BUN) and urinary albumin to creatinine ratio (ACR) in each group. *P < 0.05 versus the control group. B – Results of PCR analysis. LYZ mRNA expression in kidney tissue derived from each of the groups. C – Representative immunostaining micrographs showing tubular LYZ expression. D – Percentage of LYZ-positive renal tubular epithelial cells (RTECs) was quantified. E – Western blot analysis of LYZ expression in each group. F – Different groups (n = 3 for each group) were used to quantify relative levels of GAPDH. We quantified the percentage of RTECs that were positive based on tubulointerstitial fibrosis (TIF) scores
Data represent the mean ± SD of triplicates. The p-value was calculated by a two-sided Student’s t-test. *P < 0.05, **p < 0.01, ***p < 0.001.
Enhanced expression of LYZ and renal fibrosis were correlated
To further investigate the relationship between LYZ and renal fibrosis, we injected the kidney with the siRNA of LYZ and the overexpression plasmid of LYZ. In the STZ-induced DN model mice, up-regulation of LYZ or knockdown of LYZ did not result in significant changes in fasting glucose (Figure 3 A). However, we observed that the upregulation of LYZ in the kidney led to significant increases in serum creatinine, urinary albumin to creatinine ratio, and urea nitrogen, whereas the knockdown of LYZ resulted in significant decreases in these parameters (Figures 3 B–D). To examine the effect of LYZ expression level on renal fibrosis, we performed Masson trichrome staining on the kidneys. The results showed that knockdown of LYZ could partially attenuate STZ-induced renal fibrosis, although increased expression of LYZ could significantly augment STZ-induced renal fibrosis (Figure 3 E). Using immunohistochemistry, we further analyzed the fibrosis markers collagen, fibronectin, and α-SMA. The results showed that the knockdown of LYZ could decrease STZ-induced fibrosis, and overexpression of LYZ could enhance STZ-induced renal fibrosis (Figure 3 F). Additionally, Western blot analysis confirmed a positive correlation between LYZ expression and DN-induced renal fibrosis, consistent with our previous observations (Figure 3 G).
Figure 3
Enhanced expression of LYZ and renal fibrosis were correlated. A – Fasting glucose, B – serum creatinine, C – blood urea nitrogen (BUN), D – urinary albumin to creatinine ratio (ACR) in each group (n = 3 for each group). E – Masson’s trichrome stain showed renal fibrosis with blue color. F – A representative immunostaining micrograph shows the expression of the fibrotic markers a-smooth muscle actin (α-SMA), collagen I, and fibronectin expression in different groups (n = 3 for each group). G – Western blot analysis of the expression of α-SMA, collagen I, and fibronectin in different groups
Data represent the mean ± SD of triplicates. P-value was calculated by a two-tailed Student’s t-test. *P < 0.05, **p < 0.01, ***p < 0.001.
Based on the above results, we can conclude that the level of LYZ expression and DN-induced renal fibrosis were positively correlated.
LYZ expression in fibroblast cells is enhanced by glucose
We treated NRK-49F kidney mesenchymal fibroblasts with glucose to examine the relationship between the expression levels of glucose and LYZ. The results of ELISA showed that glucose induced LYZ expression in a dose-dependent manner (Figure 4 A), and PCR results also demonstrated that glucose promoted LYZ mRNA expression in a dose-dependent manner. Western blot further verified that glucose could promote the expression of LYZ in NRK-49F cells (Figures 4 B, C). To further investigate the function of LYZ, we constructed LYZ stable high expression NRK-49F cells and LYZ knockdown NRK-49F cells (Figures 4 D, E). The PCR and Western blot results showed that we successfully constructed NRK-49F cells with high LYZ expression and knockdown (Figures 4 D, E). To investigate the relationship between LYZ expression level and fibroblast proliferation ability, we performed a CCK-8 assay, and the results showed that LYZ up-regulation significantly promoted glucose-induced fibroblast proliferation (p < 0.05), while LYZ knockdown significantly inhibited glucose-induced fibroblast proliferation (p < 0.05) (Figure 4 F).
Figure 4
LYZ expression in fibroblast cells is enhanced by glucose. A – Cells were cultured with several concentrations of glucose (0, 5, 10, 15, 25, and 50 mM) for 12 h, 24 h, and 48 h. LYZ expression level in NRK-49F culture supernatants was analyzed by ELISA. B – PCR analysis of LYZ expression in NRK-49F cells cultured with several concentrations of glucose (0, 5, 10, 15, 25, 50 mM) for 24 h. C – Western blot analysis of LYZ expression in NRK-49F cells cultured with several concentrations of glucose (0, 5, 10, 15, 25, 50 mM) for 24 h. D – PCR analysis of mRNA expression of LYZ. E – Western blot analysis of LYZ protein expression. F – cck8 assays were performed to evaluate high glucose-induced NRK-49F cell viability when LYZ was either knocked down (upper panel) or over-expressed, with or without AG490 treatment (lower panel)
Data represent the mean ± SD of triplicates. P-value was calculated by a two-tailed Student’s t-test. *P < 0.05, **p < 0.01, ***p < 0.001.
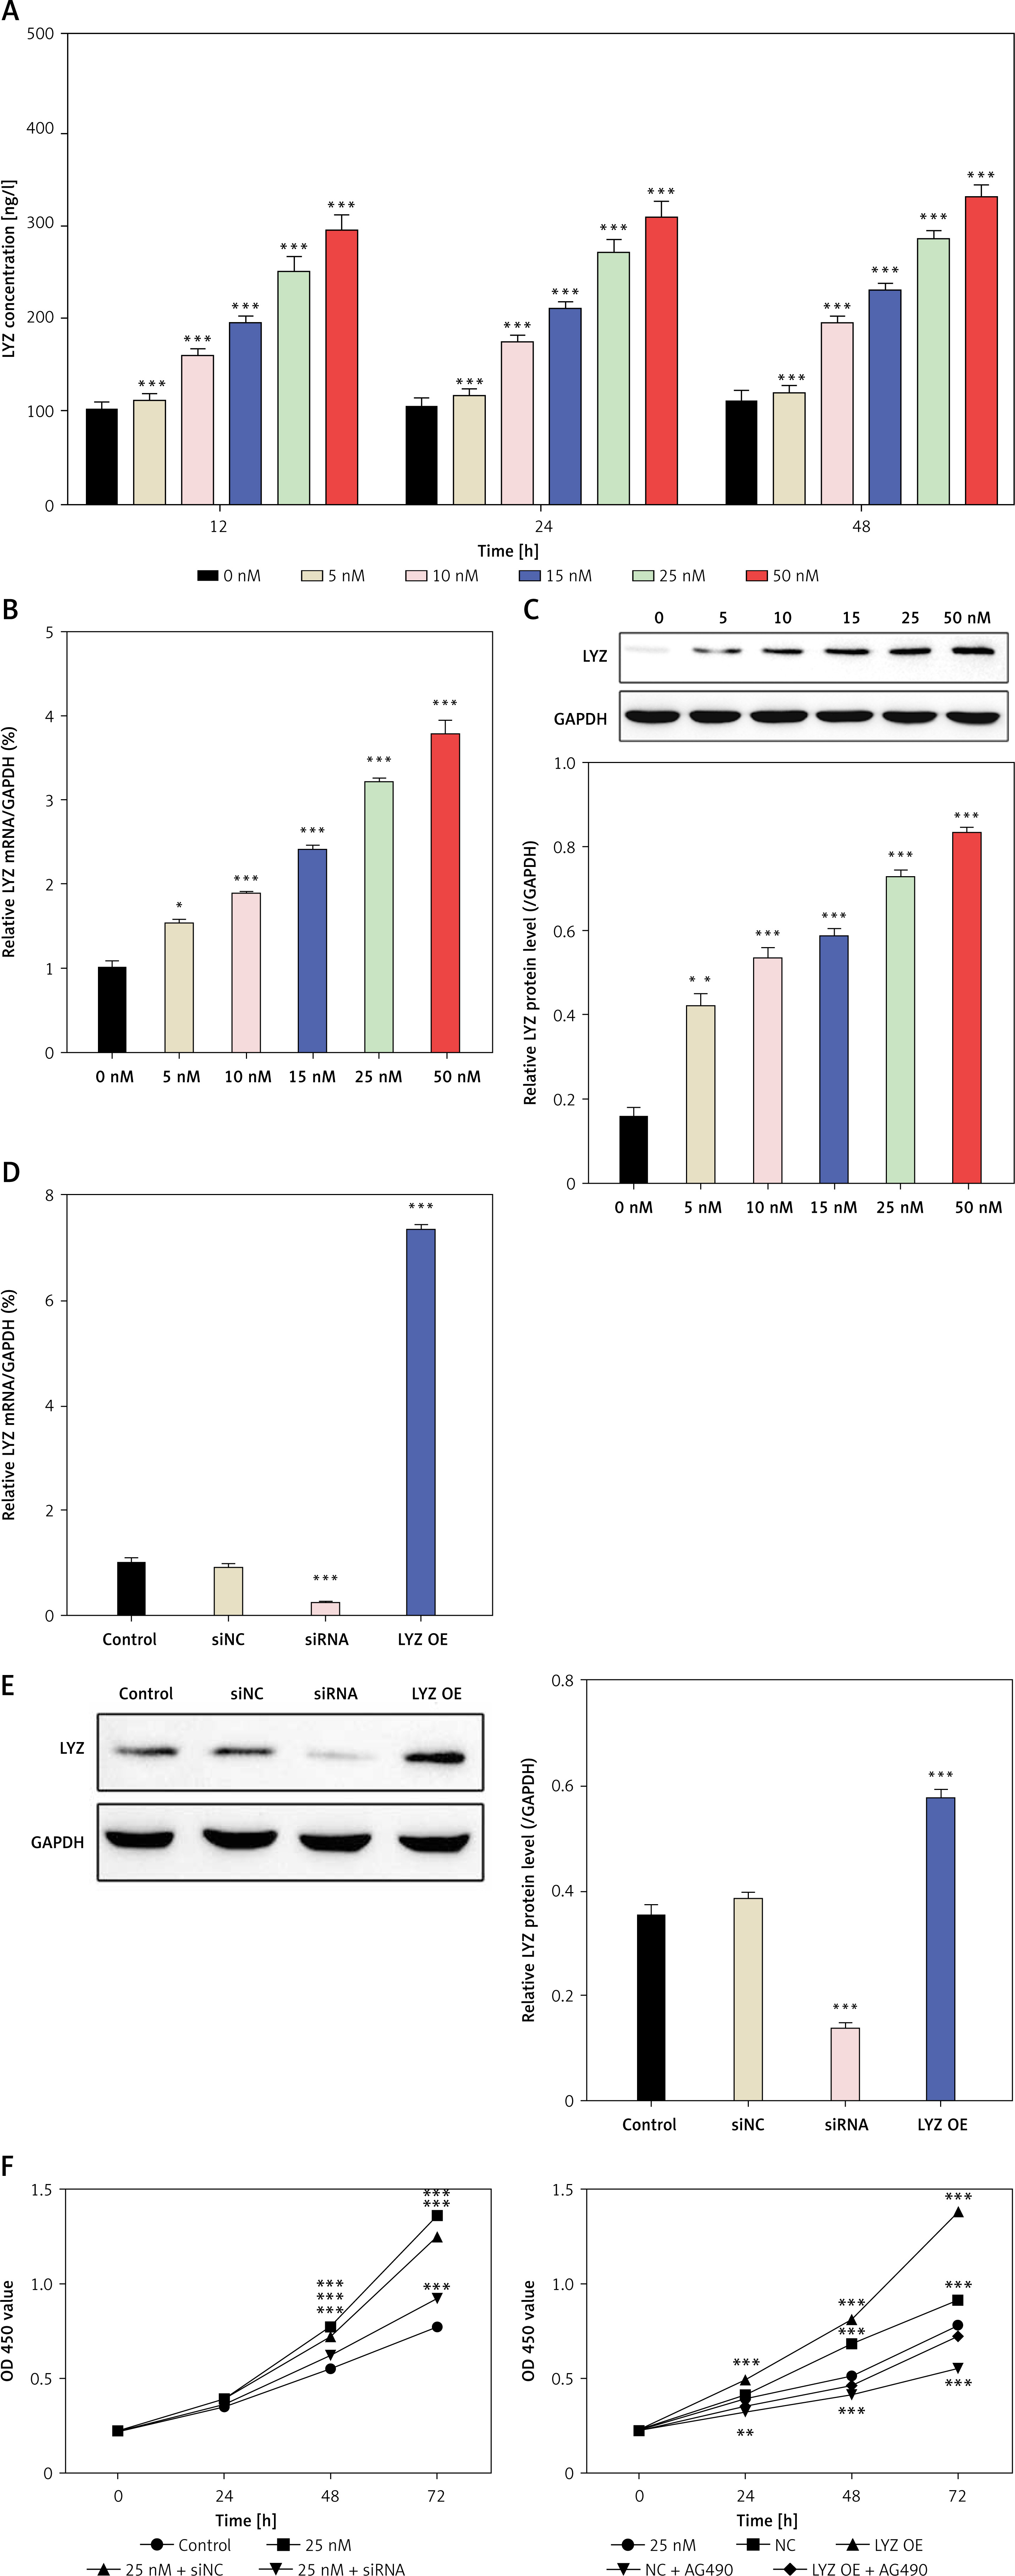
The above results showed that glucose could induce the expression of LYZ in renal fibroblasts and LYZ could promote the proliferation of renal fibroblasts.
LYZ promotes fibrosis-related cytokine expression in NRK-49F cells via the JAK/STAT3 signaling axis
To investigate the effect of LYZ on fibrosis-related cytokine, we examined the expression of fibrosis-related cytokine in cell supernatants using ELISA, as shown in Figures 5 A, B. LYZ overexpression enhanced glucose-induced fibrosis-related cytokine release, while LYZ knockdown decreased glucose-induced fibrosis-related cytokine release (Figures 5 A, B). Given that previous studies have reported that LYZ can activate the TNFα/IL1β pathway and that TNF can activate the JAK/STAT signaling pathway, we treated NRK-49F cells with the JAK inhibitor AG490 (Figure 5 B). AG490 significantly reduced LYZ-induced fibrosis-related cytokine release (Figure 5 B). The mechanism was further explored using Western blot, and the results showed that glucose promoted phosphorylation of STAT3, while knockdown of LYZ reduced the levels of glucose-induced phosphorylation (Figure 5 C), suggesting that glucose-induced activation of the JAK/STAT3 pathway may be dependent on the expression of LYZ. AG490, a JAK inhibitor, could significantly reduce LYZ-induced STAT3 activation (Figure 5 D), suggesting that the activation of STAT3 by LYZ is dependent on the activation of JAK.
Figure 5
LYZ promotes fibrosis related cytokine expression in NRK-49F cells via the JAK/STAT3 signaling axis. A, B – The levels of IL-6, TGF-α/TGF-β1, collagen I/III, and MMP2/MMP9 in LYZ knocked down (A) and LYZ overexpressed (B) NRK-49F cell culture supernatants were determined by ELISA assay. C, D – Western blot analysis of IL-6, TGF-α/TGF-β1, collagen I/III, and MMP2/MMP9 in LYZ knocked down (C) and LYZ overexpressed (D) NRK-49F cells
Data represent the mean ± SD of triplicates. The p-value was calculated by a two-tailed Student’s t-test. *P < 0.05, **p < 0.01, ***p < 0.001.
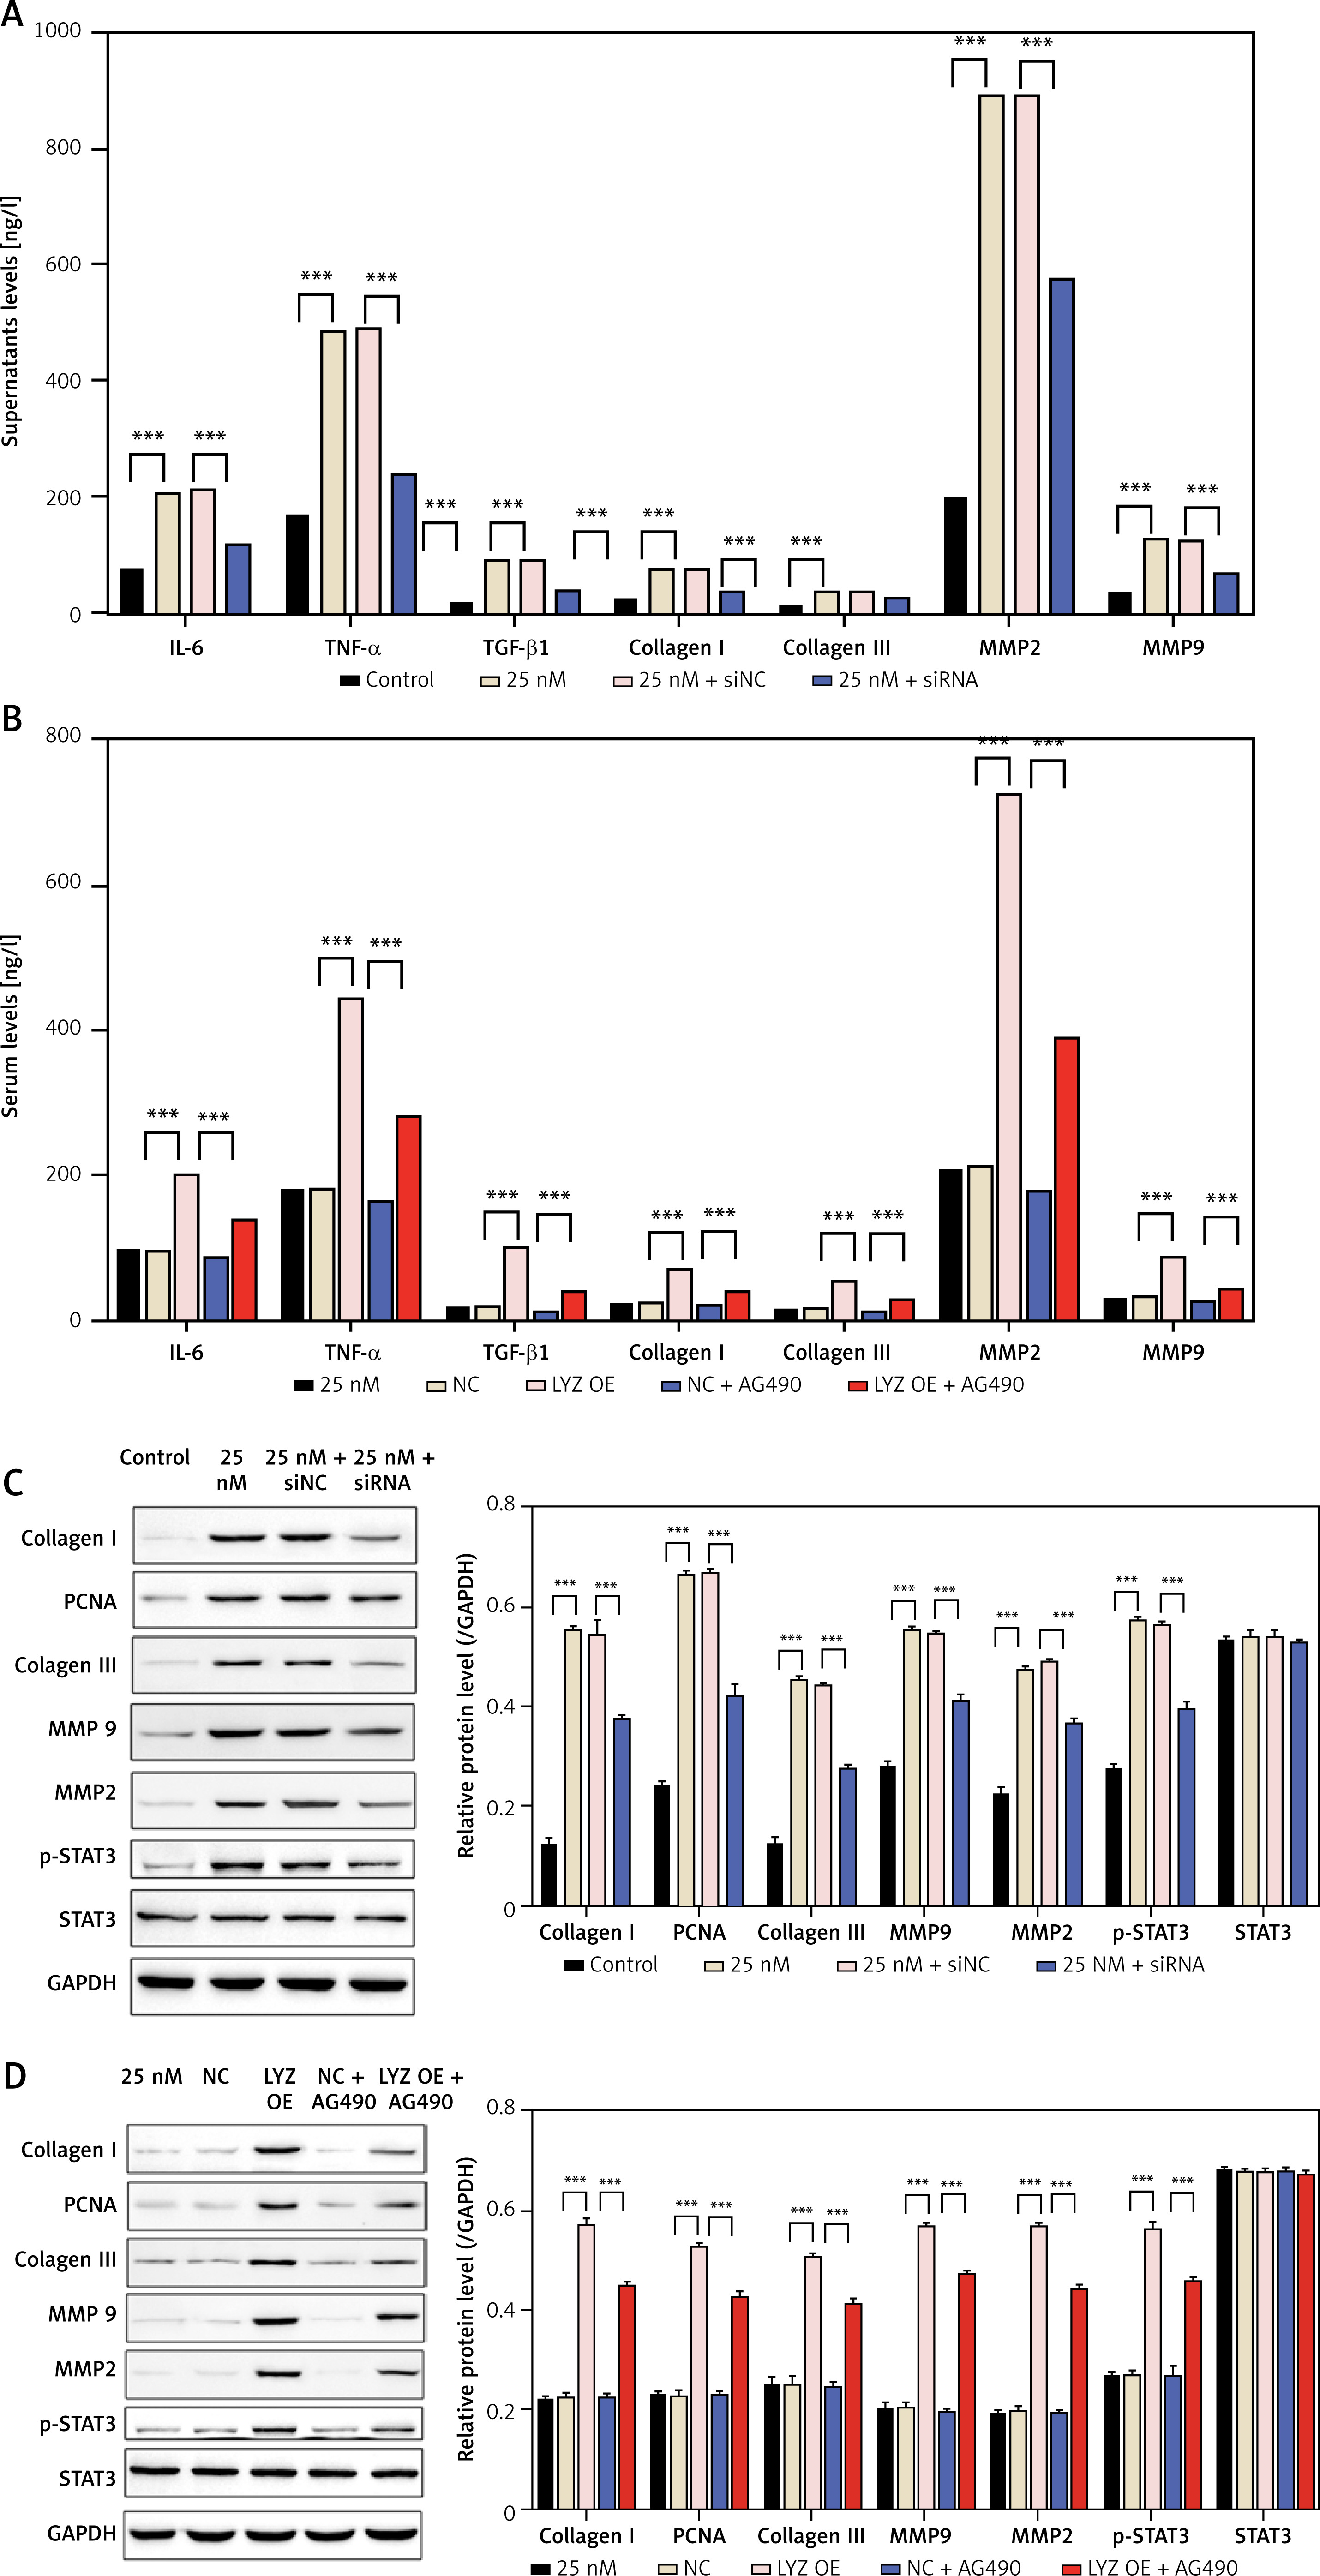
The above results show that LYZ promotes the expression of fibrosis-related cytokines in NRK-49F cells via the JAK/STAT3 signaling axis.
Overexpression of LYZ associated with senescence phenotype in RTECs
Senescence plays a crucial role in the development of DN. To investigate the relationship between LYZ and senescence, we examined the expression of the senescence-related markers IL-1β and MMP-2 in the kidneys of DN mice induced with STZ using immunohistochemistry. We found that STZ induction significantly increased the expression of IL-1β and MMP-2 in the kidney, and LYZ knockdown suppressed the expression of IL-1β and MMP-2 induced by STZ (Figure 6 A). Conversely, up-regulation of LYZ significantly increased the proportion of RTEC positive for IL-1β and MMP-2 (Figure 6 B). Furthermore, LYZ knockdown decreased IL-1β and MMP-2 positive RTEC. Western blot analysis of kidney tissue provided further support for the above findings (Figure 6 C).
Figure 6
Overexpression of LYZ was associated with the senescence phenotype in RTECs. A – Representative immunostaining micrographs showed the tubular expression of interleukin 1β (IL-1β) and matrix metalloproteinase 2 (MMP-2), B – the percentage of positive RTECs was quantified (n = 6 for each group). C – Western blotting detected the expression of MMP-2 and transforming growth factor β1 (TGF-β1)
Data represent the mean ± SD of triplicates. P-value was calculated by a two-tailed Student’s t-test. *P < 0.05, **p < 0.01, ***p < 0.001.
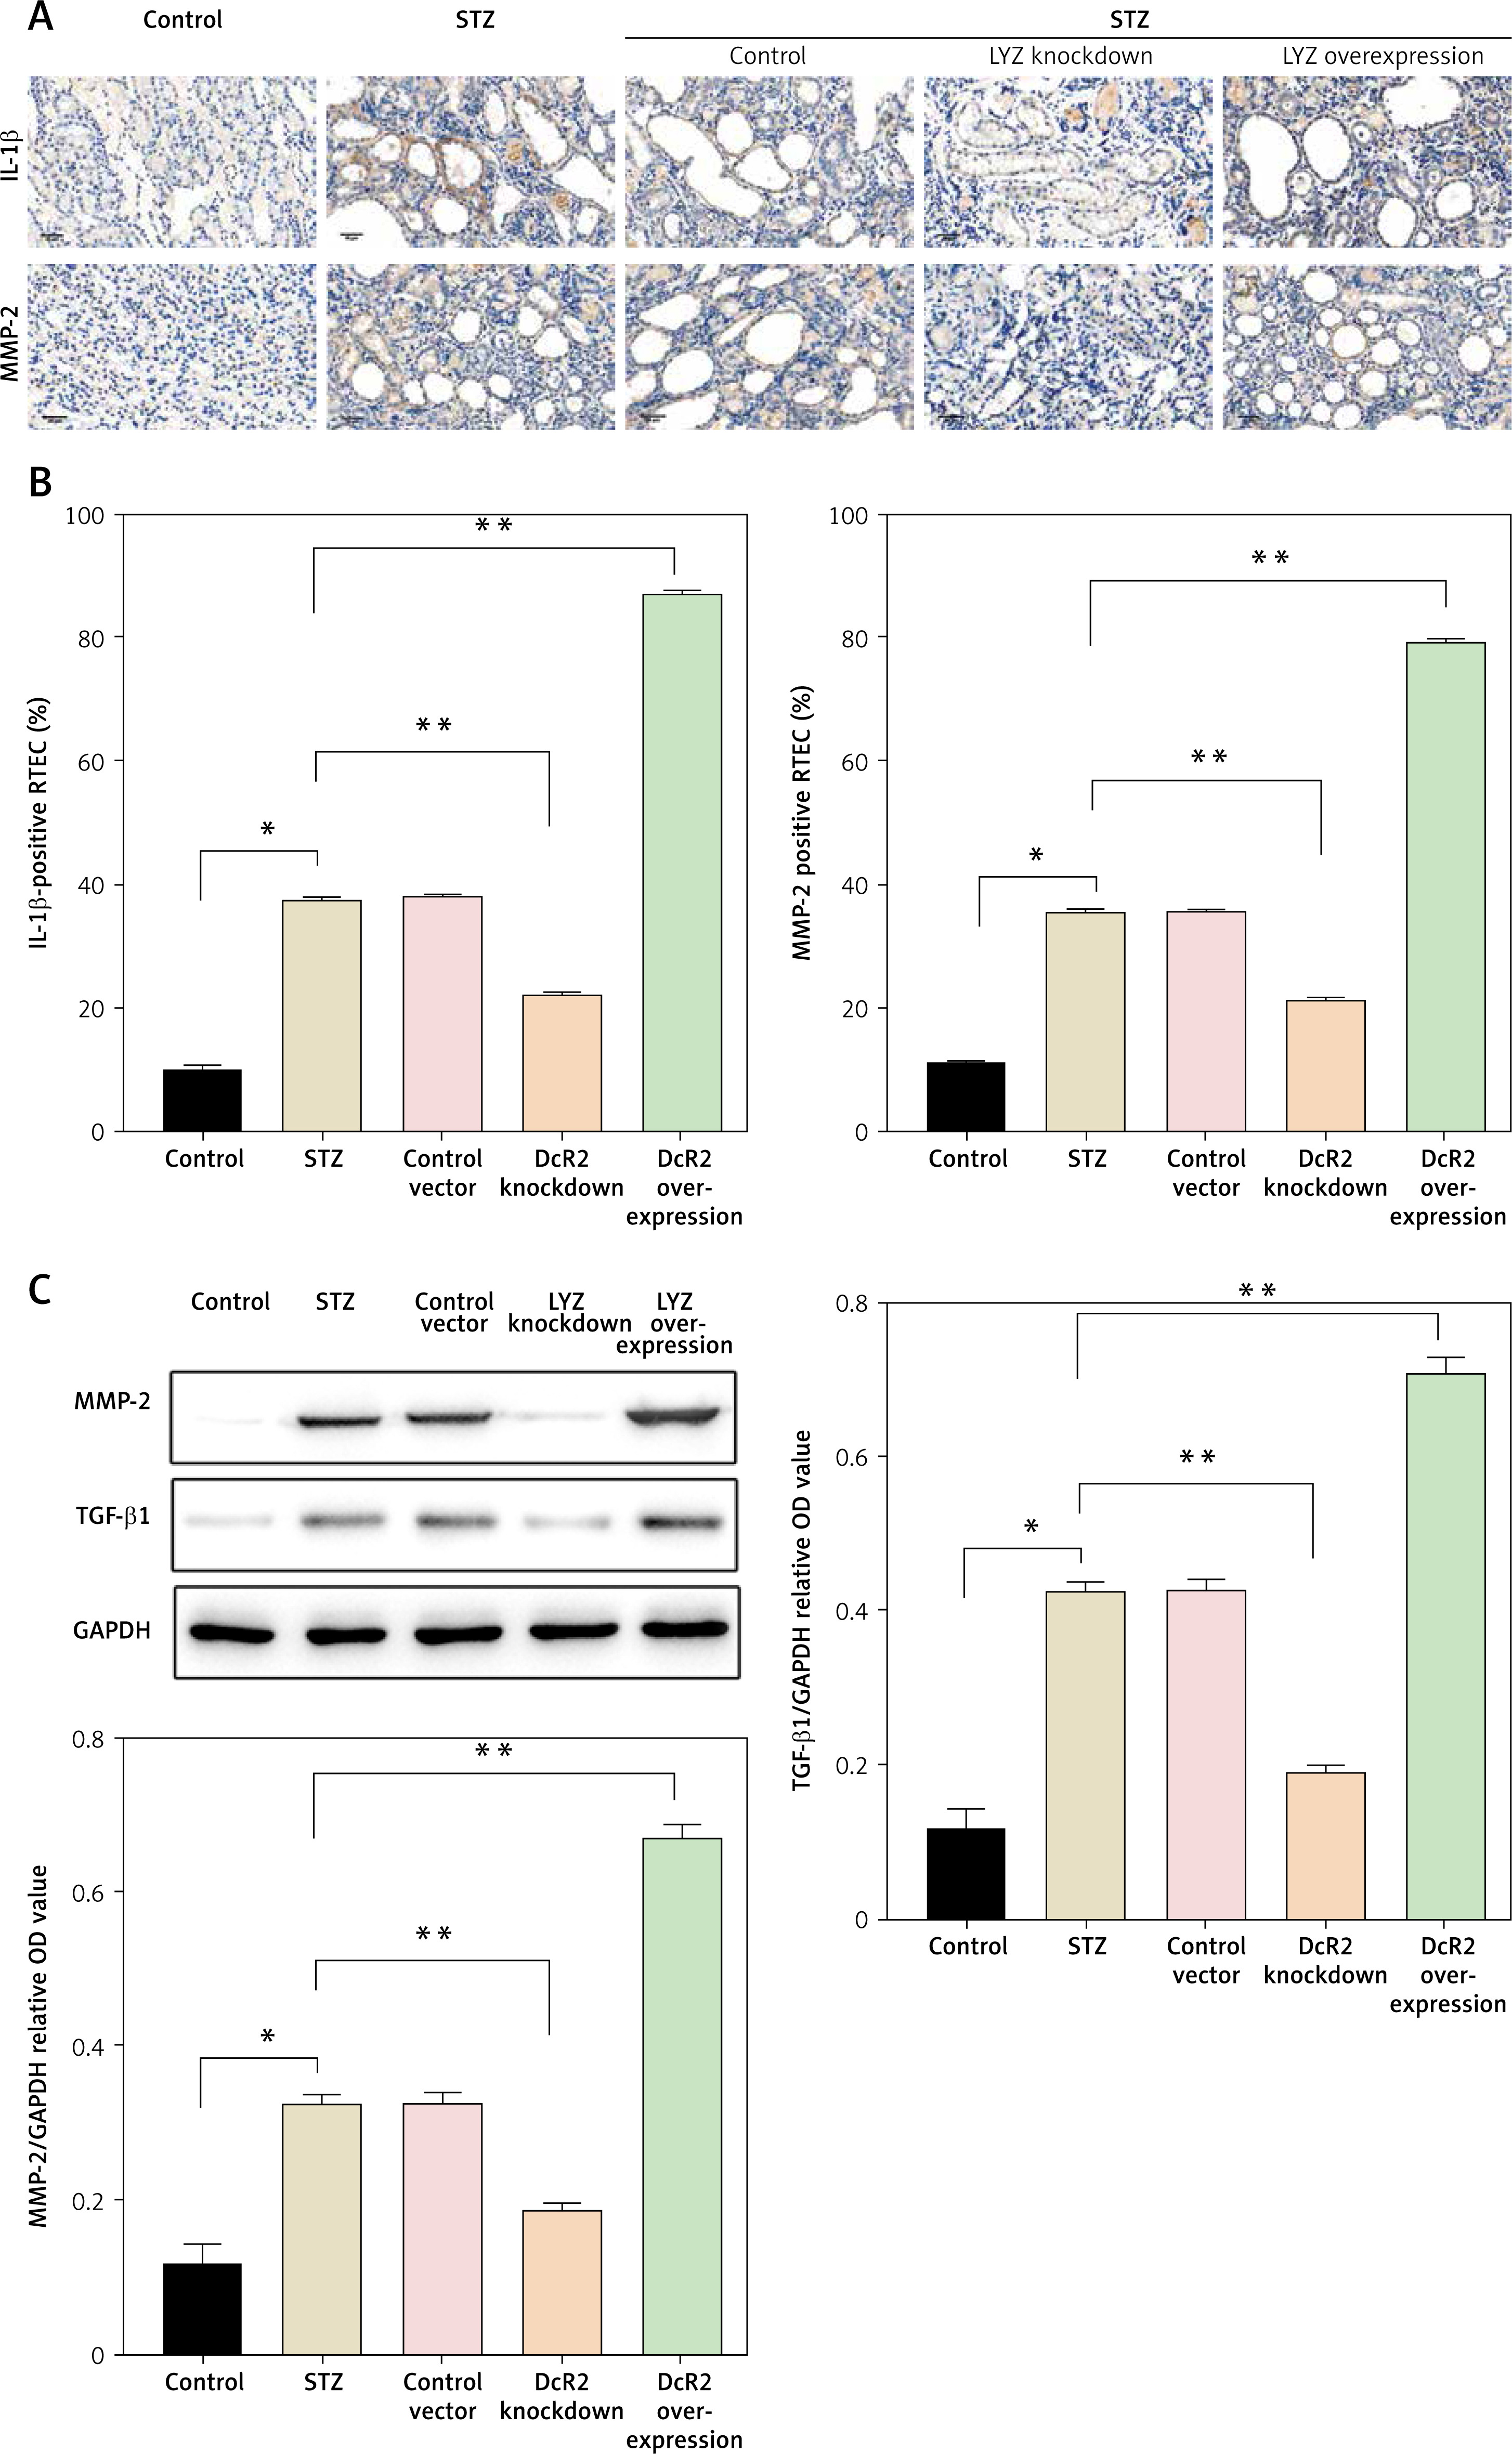
In summary, the above results demonstrate that LYZ can induce the senescence phenotype in RTECs.
Discussion
In this study, we observed a positive correlation between LYZ expression levels and interstitial fibrosis of the renal tubules. Importantly, renal function impairment was observed following LYZ overexpression. Mechanistically, we found that 25 mM glucose promoted the expression of LYZ in renal mesenchymal fibroblasts. Subsequently, LYZ overexpression was found to enhance fibrosis-related proliferation and cytokine release from these fibroblasts. Glucose caused LYZ-dependent activation of STAT3, and the JAK inhibitor AG490 was found to partially inhibit LYZ-induced activation of STAT3. In addition, we observed that overexpression of LYZ was associated with the phenotype of senescence of renal tubular epithelial cells (RTECs) in vivo. Collectively, our findings suggest that LYZ may be a key regulator of renal fibrosis that mediates diabetic nephropathy.
Diabetic nephropathy (DN) is a leading cause of renal failure [23–25]. Typically, blood urea nitrogen (BUN) or blood tests for serum creatinine and albuminuria have been used for DN screening. These diagnostic markers are important for monitoring renal function and detecting DN at an early stage. However, the biopsy remains the gold standard technique for diagnosing DN [26]. Since biopsy is an invasive technique, further investigation of DN-related markers is warranted. Given the need for additional DN-related markers, markers such as kidney injury molecule-1 and neutrophil gelatinase-associated lipocalin have shown promise in assessing renal damage and serving as monitoring markers for DN [27, 28]. In our study, we performed a bioinformatic analysis of mRNA expression levels in the GEO public database using bioinformatics, which revealed that the expression of LYZ was the most differentially expressed gene between DN patients and healthy volunteers. LYZ mRNA expression levels were significantly upregulated in DN patients compared to healthy volunteers.
Blood urea nitrogen testing is the test for confirmation of blood urea nitrogen, and higher blood urea nitrogen levels are associated with renal failure. To establish the STZ-induced DN model, we measured fasting blood glucose, blood urea nitrogen, urinary albumin-to-creatinine ratio, and serum creatinine levels over time. Our results indicated a gradual increase in these parameters following STZ induction, suggesting that the STZ-induced DN model was successfully established, and the effect of the STZ-induced DN was enhanced over time. Interestingly, in our study, LYZ mRNA expression levels in the kidney were gradually up-regulated, and there was also a gradual increase in LYZ protein expression levels verified by immunohistochemistry and Western blotting. Moreover, the proportion of LYZ positive RTEC gradually increased. These findings further supported the correlation between DN and LYZ upregulation.
Lysozymes (LYZ) are expressed by a variety of cells and tissues and are encoded by the LYZ genes. Oral ingestion of LYZ has the potential to suppress bacterial proliferation, in addition to classical antibacterial enzyme activity. LYZ can also act as an immunoregulatory agent. Lysozyme has been reported to induce transcriptional modulation of genes of the TNF-α/IL-1β pathway in monocytes, and the JAK/STAT signal has been reported to play a key role in the development of DN [29, 30]. In the present study, we observed that overexpression of LYZ enhanced glucose-induced fibrosis-related cytokine release, and knockdown of LYZ decreased glucose-induced fibrosis-related cytokine release. AG490 significantly reduced cytokine release related to LYZ-induced fibrosis. Western blot showed that glucose promoted STAT3 phosphorylation, while LYZ knockdown reduced glucose-induced phosphorylation levels. Treatment with the JAK inhibitor AG490 could significantly reduce the activation of STAT3 induced by LYZ. Collectively, our result shows that LYZ can promote the release of a fibrosis-related cytokine through activation of the JAK/STAT3 pathway.
Renal fibrosis plays a critical role in the development of DN. It has been reported that TGF-β1 was significantly up-regulated in the glomerulus of DN mice, with TGF-β1 activation being a key contributor to fibrosis [5, 31, 32]. Abnormal activation of angiotensin II (Ang II) has also been implicated in renal fibrosis associated with DN. In addition, glucose can promote the expression of angiotensin II and ultimately promote renal fibrosis of DN [33]. In our study, Masson trichrome staining showed that LYZ knockdown was able to partially attenuate STZ-induced renal fibrosis, although increased expression of LYZ could significantly increase STZ-induced renal fibrosis. Moreover, the expression of fibrosis markers including collagen, fibronectin, and α-SMA was suppressed by LYZ knockdown, while overexpression of LYZ promoted STZ-induced renal fibrosis. In vitro, the CCK8 assay showed that LYZ up-regulation significantly promoted glucose-induced fibroblast proliferation and that LYZ knockdown significantly inhibited glucose-induced fibroblast proliferation. These results indicated that LYZ expression level positively correlated with renal fibrosis and that LYZ could promote the proliferation of renal fibroblasts.
In conclusion, our study provides evidence that LYZ can serve as a potential marker for monitoring the development of DN, and that LYZ promotes renal fibrosis and is associated with the senescent phenotype in RTECs. Overall, our findings contribute to a novel understanding of the mechanism underlying glucose-induced fibroblast activation and provide insights into potential preventive strategies for DN.