Introduction
Community-acquired pneumonia (CAP) remains a major cause of death worldwide as it is associated with a hospitalization rate of 22–42% and mortality rate of 5–12%, which rises to over 50% in intensive care unit (ICU) admissions [1–3].
Early diagnosis and immediate pathogen recognition are crucial in selection of an appropriate antibiotic regimen in pneumonia given that treatment success increases as a function of the time of treatment initiation [4–6]. Accordingly, current pneumonia management guidelines emphasize rapid recognition of pathogens and early initiation of appropriate antimicrobial therapy to improve patient outcomes [7, 8]. However, the etiological diagnosis of bacterial pneumonia often remains uncertain due to delay and unreliable findings related to pathogen identification with current microbial diagnostic techniques in real-life clinical practice [5–10]. Although Gram staining is a widely accepted test with diagnostic and prognostic value and certain advantages such as being a readily available, inexpensive and rapid test without need of sophisticated equipment and no hazard to the patient [6, 9, 11], controversy exists on the reliability of sputum Gram stain to guide initial antimicrobial treatment of CAP, with substantial variance in sensitivity and specificity in different settings [6, 10, 12, 13].
Hence, assessment of biomarkers has become an increasingly used approach to identify patients at risk, to determine severity and prognosis of disease and to guide initial antibiotic therapy [14–16]. Nonetheless, it should be noted that while sputum and blood cultures were primarily recommended in patients with severe disease in the 2007 ATS/IDSA Guideline, they are now recommended not only in patients with severe disease but also in all inpatients empirically treated for MRSA or Pseudomonas aeruginosa as per the 2019 ATS/IDSA Guideline [17]. In addition to clinical judgement, use of validated clinical scoring tools such as the Pneumonia Severity Index (PSI) and the CURB-65 (tool based on confusion, urea level, respiratory rate, blood pressure, and age > 65) has also been recommended to determine the need for hospitalization in adults diagnosed with CAP [17].
The host inflammatory response in the pathogenesis of pneumonia has become the focus of recent research, and identifying inflammatory biomarkers with high sensitivity and specificity is considered likely to overcome treatment delays, to facilitate treatment decisions and to improve clinical severity assessment in patients with CAP [5, 18–21].
Alongside old markers such as white blood cell (WBC) count and C-reactive protein (CRP) level and neutrophil count [22], new inflammatory markers including the neutrophil to lymphocyte ratio (NLR) and the platelet to lymphocyte ratio (PLR) have received increasing scientific interest in the management of pneumonia [23, 24].
Both NLR and PLR are considered as novel markers predicting prognosis in several diseases including CAP [18, 20, 25, 26]. Neutrophil to lymphocyte ratio has also been suggested to be a simple and even better marker in predicting bacteremia than WBC count and CRP level [19], to predict mortality and prognosis in CAP with a better profile than CRP and to reflect a more balanced inflammatory response and thus enable more precise assessment of severity than WBC [18, 24].
However, while the relationship between NLR, PLR and clinical outcomes as well as the value of NLR in differential diagnosis of bacterial vs. viral etiology have been investigated in patients with pneumonia in a limited number of studies [19, 23], no study to date has investigated the inflammatory markers with respect to admission and discharge period in bacterial pneumonia, specifically in Gram-positive versus Gram-negative etiology.
This study was therefore designed to evaluate inflammatory markers (NLR, PLR, platelet/MPV and CRP, CRP/albumin) in hospitalized patients with bacterial CAP by comparing Gram-positive vs. Gram-negative etiology and admission vs. discharge findings.
Material and methods
Study population
A total 170 adult patients hospitalized with bacterial CAP due to Gram-positive (n = 130) and Gram-negative (n = 40) pathogens were included in this retrospective study conducted at a tertiary care center between January 2016 and October 2017. Patients aged > 18 years and hospitalized with ICD code J10–J16 were included in the study, while those with co-morbid malignancy, collagen vascular disease or hematologic diseases likely to affect NLR were excluded.
The study was conducted in full accordance with the local Good Clinical Practice (GCP) guideline and current legislation, while permission was obtained from the University of Health Sciences, Sureyyapasa Chest Diseases and Thoracic Surgery Training and Research Hospital Ethics Committee for the use of patient data for publication purposes (date of approval/protocol no: 02.05.2018/07-031).
Data collection
Data on patient demographics, Gram stain and type of bacterial pathogen, co-morbid disorders, CURB-65 scores, hospitalization and discharge dates, length of hospital stay (LOS), hospitalization unit (ICU, ward), in-hospital mortality and laboratory findings including complete blood count (CBC) and inflammatory markers including NLR, PLR, platelet/mean platelet volume (MPV) ratio and CRP were recorded. Findings on CBC and inflammatory markers were compared between Gram-positive vs. Gram-negative groups as well as at admission vs. discharge in both groups.
Microbiological diagnosis
The samples collected under sterile conditions underwent overnight incubation (35oC, 5% CO2) in 5% sheep blood agar, chocolate agar and MacCon-key agar. A few colonies were taken from the bacteria that were grown on the medium and the saline was spread by dropping the slurry and fixed in flame. Crystal violet dye solution was added to the preparation and left to stand for 1 min. After washing with distilled water, Lugol solution was added to the preparation and left for 1 min. The mixture was decolorized for 10–15 s by adding distilled water and 95% ethanol again. The last time it was washed with distilled water and coated with aqueous solution of basic fuchsine and left for 30 s. After washing the dye and drying the slide, bacteria were evaluated under the microscope at 100× for morphological differentiation as well as type identification and antibiogram analysis using the VITEK 2 device (BioMerieux, France).
Statistical analysis
Statistical analysis was performed using IBM SPSS Statistics for Windows, version 22.0 (IBM Corp., Armonk, NY). The χ2 test was used to analyze categorical data, while the Mann-Whitney U test was used for analysis of numerical data. Change in parameters from admission to discharge was assessed using the Wilcoxon test. Correlation analyses were performed via Spearman’s and Pearson’s correlation analyses depending on the normality of the distribution. Data were expressed as “mean (standard deviation; SD)”, percent (%) and median (25–75%) where appropriate. P < 0.05 was considered statistically significant.
Results
Comparison of patient characteristics in Gram-positive and Gram-negative pneumonia groups
Overall, 109 (64.1%) out of 170 patients were in the > 65 years age group and males composed 64.1% of the study population. Gram-posi-tive (Streptococcus pneumoniae in 98.5%) and Gram- negative (Enterobacteriaceae in 70.0%) pathogens were identified in 76.5% and 23.5% of isolates, respectively (Table I).
Table I
Comparison of demographic and clinical characteristics of patients in Gram-positive and Gram-negative pneumonia
Gram-negative pneumonia compared with Gram- positive pneumonia was associated with significantly higher likelihood of being hospitalized at the ICU (70.0% vs. 2.3%, p < 0.001), mortality (20.0% vs. 2.3%, p < 0.001), sepsis (27.5% vs. 0.0%, p < 0.001), co-morbid bronchiectasis and neuromuscular disease (7.5% vs. 0.0%, p = 0.002 for each), but lower likelihood of co-morbid asthma (0.0% vs. 10.0%, p = 0.037) (Table I).
No significant difference was noted between patients with Gram-positive and Gram-negative pneumonia in terms of age, gender, other comorbidities or length of hospital stay (Table I).
Admission and discharge findings on complete blood count and inflammatory markers in Gram-positive and Gram-negative pneumonia
Respiration rate (p < 0.001), pulse (p = 0.040) and body temperature (p = 0.002) values were significantly higher in the Gram-negative group as compared with the Gram-positive group (Table II).
Table II
Comparison of admission and discharge findings on hemogram and inflammatory markers in Gram-positive vs. Gram-negative pneumonia
[i] WBC – white blood cells, MCV – mean corpuscular volume, MPV – mean platelet volume, NLR – neutrophil to lymphocyte ratio, PLR – platelet to lymphocyte ratio, PLT – platelets, CRP – C-reactive protein, SBP – systolic blood pressure, DBP – diastolic blood pressure, SpO2 – peripheral oxygen saturation. Mann-Whitney U test – missing data for a23, b6, c9 and d2 patients
Gram-negative pneumonia was associated with significantly lower levels of erythrocytes (p < 0.001 for each period), hemoglobin (p < 0.001 for each period) and hematocrit (p < 0.001 for each period), but with higher levels of MCV (p = 0.048 at admission and p = 0.020 at discharge) as compared with Gram-positive pneumonia both at admission and at discharge (Table II).
Neutrophil to lymphocyte ratio, PLR and PLT/MPV (at admission or discharge) and CRP levels (at admission) showed no significant difference between Gram-positive and Gram-negative pneumonia. C-reactive protein levels (median (25–75%) 41.5 (10.8–94.3) vs. 17.1 (7.2–47.3) mg/dl, p = 0.025) and CRP/albumin ratio (median (25–75%) 14.0 (2.2–34.4) vs. 5.2 (2.1–16.2), p = 0.021) at discharge were significantly higher in the Gram-negative than in the Gram-positive group (Table II).
A significant decrease was noted in WBC (p < 0.001) from admission to discharge in Gram- positive pneumonia, and a significant decrease in NLR (p < 0.001 and p = 0.026, respectively), CRP (p < 0.001 and p = 0.013, respectively) and CRP/albumin ratio (p = 0.021 and p = 0.037, respectively) was noted from admission to discharge in both Gram-positive and negative pneumonia groups. Platelet to lymphocyte ratio and PLT/MPV showed no significant change during hospitalization in both groups (Table II).
Correlation of C-reactive protein with other inflammatory parameters
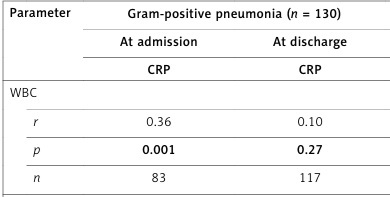
At admission, CRP levels were correlated positively with WBC (r = 0.47, p = 0.009 and r = 0.36, p = 0.001, respectively) and NLR (r = 0.49, p = 0.006 and r = 0.40, p < 0.001, respectively) in both Gram-negative and -positive groups, but with PLR (r = 0.23, p = 0.040) only in the Gram-positive pneumonia group (Table III).
Table III
Correlation of C-reactive protein with other inflammatory parameters at admission and at discharge
At discharge, CRP levels were positively correlated with NLR (r = 0.38, p = 0.018) in the Gram-negative group, but with PLR (r = 0.19, p = 0.042) in the Gram-positive group (Table III).
CURB-65 scores on admission and associated inflammatory markers
A significantly higher percentage of patients with Gram-negative vs. Gram-positive pneumonia had higher CURB-65 scores (> 4 in 50.0 vs. 0.8%, respectively, p < 0.001) (Table IV).
Table IV
CURB-65 scores on admission and associated inflammatory markers in Gram-positive vs. Gram-negative pneumonia
There was also a non-significant tendency for an increase in median NLR (from 4.1 for CURB-65 score 2 to 12.4 for CURB-65 score 5) and CRP (from 42.2 for CURB-65 score 2 to 96.7 for CURB-65 score 5) levels with increase in CURB-65 scores in the Gram-negative group (Table IV).
Discussion
This study explored inflammatory markers (NLR, PLR and PLT/MPV) in differentiation of Gram-positive and Gram-negative CAP in a hospital setting as well as the change in inflammatory markers from admission to discharge with respect to Gram stain results. Our findings revealed a preponderance of Gram-positive pneumonia and poorer clinical outcome in the case of Gram-negative pneumonia with no significant difference between Gram-positive and Gram-negative groups in terms of NLR, PLR and PLT/MPV either at admission or at discharge. C-reactive protein levels and CRP/albumin ratio were also similar at admission between Gram-positive and Gram-negative groups, whereas both were significantly higher in Gram-negative bacterial pneumonia at discharge. From admission to discharge, a significant decrease was noted in NLR, CRP and CRP/albumin ratio in both Gram-negative and Gram-positive groups. CRP levels were positively correlated with NLR (at admission in both groups and at discharge only in the Gram-negative pneumonia group) and with PLR (at admission and discharge only in the Gram-positive pneumonia group).
In our study population, Gram-positive (Streptococcus pneumoniae in 98.5%) and Gram-negative (Enterobacteriaceae in 70.0%) pathogens were identified in 76.5% and 23.5% of isolates. This seems consistent with consideration of Streptococcus pneumoniae as the most common causative microorganism of CAP, being reported to comprise 83%, 27% and 28% of outpatient, inpatients and ICU patient cases in a systematic review of 46 studies [27]. Our findings are also in line with prevalence of etiological diagnoses reported in a prospective study of 178 patients with CAP including pneumococcal pneumonia (52%) and Gram-negative bacilli pneumonia (18%) as the two most common pathogens [6].
Given that Streptococcus pneumoniae and Enterobacteriaceae were the major pathogens responsible for Gram-positive and Gram-negative pneumonia in our cohort, poorer clinical outcome with higher likelihood of ICU hospitalization, sepsis and mortality in Gram-negative than in Gram-positive pneumonia seems to be consistent with development of slower resistance of Streptococcus to penicillin [28], but increasing incidence of carbapenem-resistant Enterobacteriaceae challenging the current clinical anti-infective treatment [29] and consideration of Enterobacteriaceae among the emerging multiple drug-resistant pathogens leading to the growing global antimicrobial resistance problem [30]. Indeed, consistent with a less favorable outcome, Gram-negative pneumonia patients in our cohort were discharged with significantly higher CRP and CRP/albumin levels as compared with Gram-positive pneumonia patients, while WBC count significantly decreased from admission to discharge only in the Gram-positive group.
On the basis of lack of a significant difference in NLR, PLR and PLT/MPV both at admission and discharge between Gram-positive and Gram-nega-tive pneumonia groups, our findings indicate no additional benefit of assessing inflammatory markers (NLR, PLR, PLT/MPV, CRP) in differentiation of Gram-negative and Gram-positive pneumonia to aid Gram stain testing in selection of an appropriate therapeutic decision.
Neutrophil to lymphocyte ratio was the only inflammatory marker that showed similarity with CRP and CRP/albumin ratio in terms of significant reduction from admission to discharge alongside positive correlation with CRP levels. This seems in agreement with published data on NLR indicating that NLR at the emergency admissions has discriminatory capacity in predicting bacteremia, severity and outcome of CAP with a higher prognostic accuracy as compared with routine markers such as CRP level, neutrophil count and WBC count [18, 19]. Moreover, both NLR and CRP were reported to be higher in pneumonia patients with complications as compared with those without complications [4].
Although no significant difference was noted between Gram-positive and Gram-negative groups in terms of NLR in our cohort, the tendency for higher NLR in the Gram-positive group seems to support the data from a past study in pneumonia patients indicating the association of Streptococcus pneumoniae with the highest frequency of increased NLR values as compared with other pathogens [18]. Nonetheless, while this association was considered to be related to the severity of disease in patients with pneumococcal pneumonia as reflected in increased duration of hospitalization, ICU admittance and mortality [18], our findings revealed a less favorable outcome in terms of ICU admittance sepsis and mortality in the Gram-negative pneumonia group. CURB-65 is amongst the frequently used scoring methods for hospitalization and treatment decisions in CAP patients in Turkey [31]. Notably, having higher CURB-65 scores on admission was also more likely in patients with Gram-negative pneumonia along with a tendency for increase in NLR and CRP levels with increase in CURB-65 scores. This seems to be consistent with poor prognosis in patients with Gram-negative pneumonia in the current study.
Management of CAP remains challenging in relation to difficulties in diagnosis of the causative pathogen, and subsequent identification of prognosis and severity of disease [17]. Our study failed to show a statistically significant difference between Gram-negative and Gram-positive groups in terms of inflammatory markers at admission or discharge and thus to help differentiation between bacterial etiology. This seems in accordance with the recommendation of sputum and blood culture in these cases by the Guidelines on Community-Acquired Pneumonia 2019 [17].
Nonetheless, given that both NLR and PLR were correlated positively with CRP levels at admission in Gram-positive pneumonia, our findings seem to indicate higher likelihood of NLR and PLR having an additional benefit in evaluation of the inflammatory process and treatment response, as a CRP substitute, in Gram-positive pneumonia rather than in Gram-negative pneumonia in hospitalized patients with CAP.
Certain limitations to this study should be considered. First, due to the retrospective single-center design, establishing the temporality between cause and effect as well as generalizing our findings to the overall CAP population seems difficult. Second, lack of data on type of antibiotics prescribed and resistance profiles of causative pathogens is another limitation which otherwise would extend the knowledge achieved in the current study. Nevertheless, despite these certain limitations, given the paucity of solid information available in this area, our findings represent a valuable contribution to the literature.
In conclusion, this retrospective study of hospitalized CAP patients revealed no significant role of NLR, PLR, PLT/MPV or CRP in differential diagnosis of Gram-negative versus Gram-positive etiology and thus no additional benefit of these markers in faster implementation of appropriate treatment in accordance with the Gram stain. The significant decrease in NLR from admission to discharge alongside the positive correlation with CRP at admission seems to emphasize the potential role of NLR in evaluation of treatment response, as a substitute of CRP, particularly in those with Gram-positive CAP. Larger scale prospective studies with more comprehensive microbiological analysis are needed to determine the additional benefit of inflammatory markers in aiding microbiology-based etiological identification for earlier recognition of the responsible pathogen and prompter implementation for monitoring the treatment success and clinical outcome.