

Introduction
Myocardial infarction with non-obstructive coronary arteries (MINOCA), tako-tsubo cardiomyopathy (TTC), infective myocarditis (IM) and acute ST-segment elevation myocardial infarction (STEMI) of the anterior wall, being in fact a heterogeneous group, may occur in very similar clinical presentations. The MINOCA working diagnosis, which is made at the beginning of hospitalisation, includes a heterogeneous group of diseases, which is depleted in favour of other disease entities, identified after deeper diagnostics [1]. These include, among others, imaging tests such as cardiac echocardiography, magnetic resonance imaging, a thorough family and occasional interview, and specialised biochemical blood tests.
One of the first groups of patients who are separated from the MINOCA group after performing initial tests during primary hospitalisation, such as coronary angiography, are patients with IM and TTC. Due to the fact that the clinical and echocardiographic image of patients with anterior wall STEMI is often similar to that observed in TTC, we selected patients with this diagnosis for long-term observation within the aspect of all-cause mortality, as well as major adverse cardiac and cerebrovascular events (MACCE) [2]. It has been suggested that TCC is not such a trivial condition and patients with TTC, especially males, have poor prognosis compared to STEMI and non-ST-segment elevation myocardial infarction (NSTEMI) patients [3–5]. Also, comparisons between MINOCA and TTC patients have been reported [3–5]. In several studies, the survival of MINOCA patients has been compared to those experiencing myocardial infarction with obstructive coronary arteries (MI-CAD), showing poorer outcomes in the latter group, mainly due to repeated revascularisation [6–9].
Therefore, based on patients gathered at 2 academic centres, we focused to compare clinical outcomes expressed as all-cause mortality and MACCE between patients with MINOCA, TTC, IM and anterior wall STEMI during a 3-year follow-up period. Also, we aimed to compare the results obtained with the results of other analyses that have been published so far.
Material and methods
We conducted an observational cohort study involving patients hospitalised at 2 Polish Academic Cardiology Centres. We selected 596 consecutive patients admitted to hospital with a working diagnosis of MINOCA and STEMI of the anterior wall. Then, we separated patients with TTC and IM from the MINOCA group. The differential diagnosis was based, among others, on clinical symptoms, coronary angiography, electrocardiography, echocardiography presentation, biochemical parameters and magnetic reasons imaging when necessary. Information on demographic features, risk factors, comorbidities and medication at admission was collected in a detailed patient interview and based on previous medical documentation. Patients and follow-up data were collected between January 2014 and December 2018.
The diagnosis of acute myocardial infarction was made in accordance with the fourth universal definition of myocardial infarction and the working group position paper on MINOCA published by the European Society of Cardiology [10, 11]. Pharmacological and interventional treatment were in accordance with current European Guidelines [12, 13]. Study endpoints were all-cause mortality and MACCE. The study protocol was approved by the local Bioethics Committee and complied with the declaration of Helsinki. All participants provided their written informed consent for percutaneous coronary angiography and/or percutaneous coronary intervention (PCI), when applicable.
Study endpoints
The primary study endpoint was all-cause mortality and MACCE defined as hospitalisation for myocardial infarction, re-intervention within the coronary arteries (PCI or/and coronary artery by-pass grafting) and cerebral stroke/transient ischaemic attack. We assessed all-cause mortality as well as MACCE rates at 30-days, 12- and 36-months.
Statistical analysis
Categorical variables are presented as numbers and percentages. Continuous variables are expressed as mean standard deviation or median interquartile range, where applicable. Normality was assessed using the Shapiro-Wilk test. Equality of variance was assessed via Levene’s test. The Mann-Whitney U-test was used for non-normally distributed continuous variables. Categorical variables were compared with Pearson’s χ2 test or Fisher’s exact test if 20% of cells had an expected count of less than 5 (the Monte Carlo simulation for Fisher’s test was used for tables of a higher dimension than 2 x 2). Multiple group comparisons were performed using analysis of variance or the Kruskal-Wallis test. Survival curves were presented using Kaplan-Meier estimator and compared using log-rank test. Univariable and multivariable Cox proportional hazard models were implemented to identify predictors of MACCE and death. All statistical analyses were performed with JMP®, Version 14.2.0 (SAS Institute INC., Cary, NC, USA). All statistical tests were 2-sided (the level of p < 0.05 was considered statistically significant).
Results
In our study, we enrolled 596 patients, among them there were 318 patients with MINOCA, 31 patients with TTC, 22 patients with IM and 225 with acute STEMI of the anterior wall.
General patient characteristics
The mean age in the overall group of patients included in the current analysis was 63.3 ±13.8 years, while in the MINOCA group: 65.1 ±13.4; TTC group: 70.7 ±13.0; IM group: 43.7 ±16.2 and STEMI group: 61.6 ±12.2 (p < 0.001). Women were more prevalent in the STEMI group in comparison to other groups (p < 0.001). These and other clinical characteristics of indices are presented in Table I.
Table I
General patient characteristics in selected groups of patients at baseline
[i] COPD – chronic obstructive pulmonary disease, MI – myocardial infarction, MINOCA – myocardial infarction with non-obstructive coronary arteries, TCC – tako-tsubo cardiomyopathy, IM – infective myocarditis, PCI – percutaneous coronary intervention, STEMI – ST-segment elevation myocardial infarction, TIA – transient ischemic attack.
Biochemical indices
Considering all of the assessed groups of patients, the peak serum troponin I concentrations were highest in the STEMI group and the lowest in MINOCA group (157.1 vs. 14.0 x above upper limit of normal, p < 0.001). The mean blood haemoglobin concentration in the TTC and MINOCA groups was significantly lower when compared to other groups (p < 0.001). Biochemical analyses in the selected groups of patients are presented in Table II.
Table II
Biochemical analysis in selected groups of patients at baseline
Electrocardiography, echocardiography and procedural indices
Assessing the frequency of the type of myocardial infarction diagnosed at admission, we revealed that patients from MINOCA and TTC group were more likely to present as NSTEMI rather than STEMI (p < 0.001). Patients from TTC and STEMI group had significantly lower left ventricle ejection fraction (LVEF) compered to MINOCA and IM group (p < 0.001). These and other electrocardiographic, echocardiographic and procedural indices are presented in Table III.
Table III
Clinical echocardiographic procedure-related indices at baseline according to selected group
Study endpoints
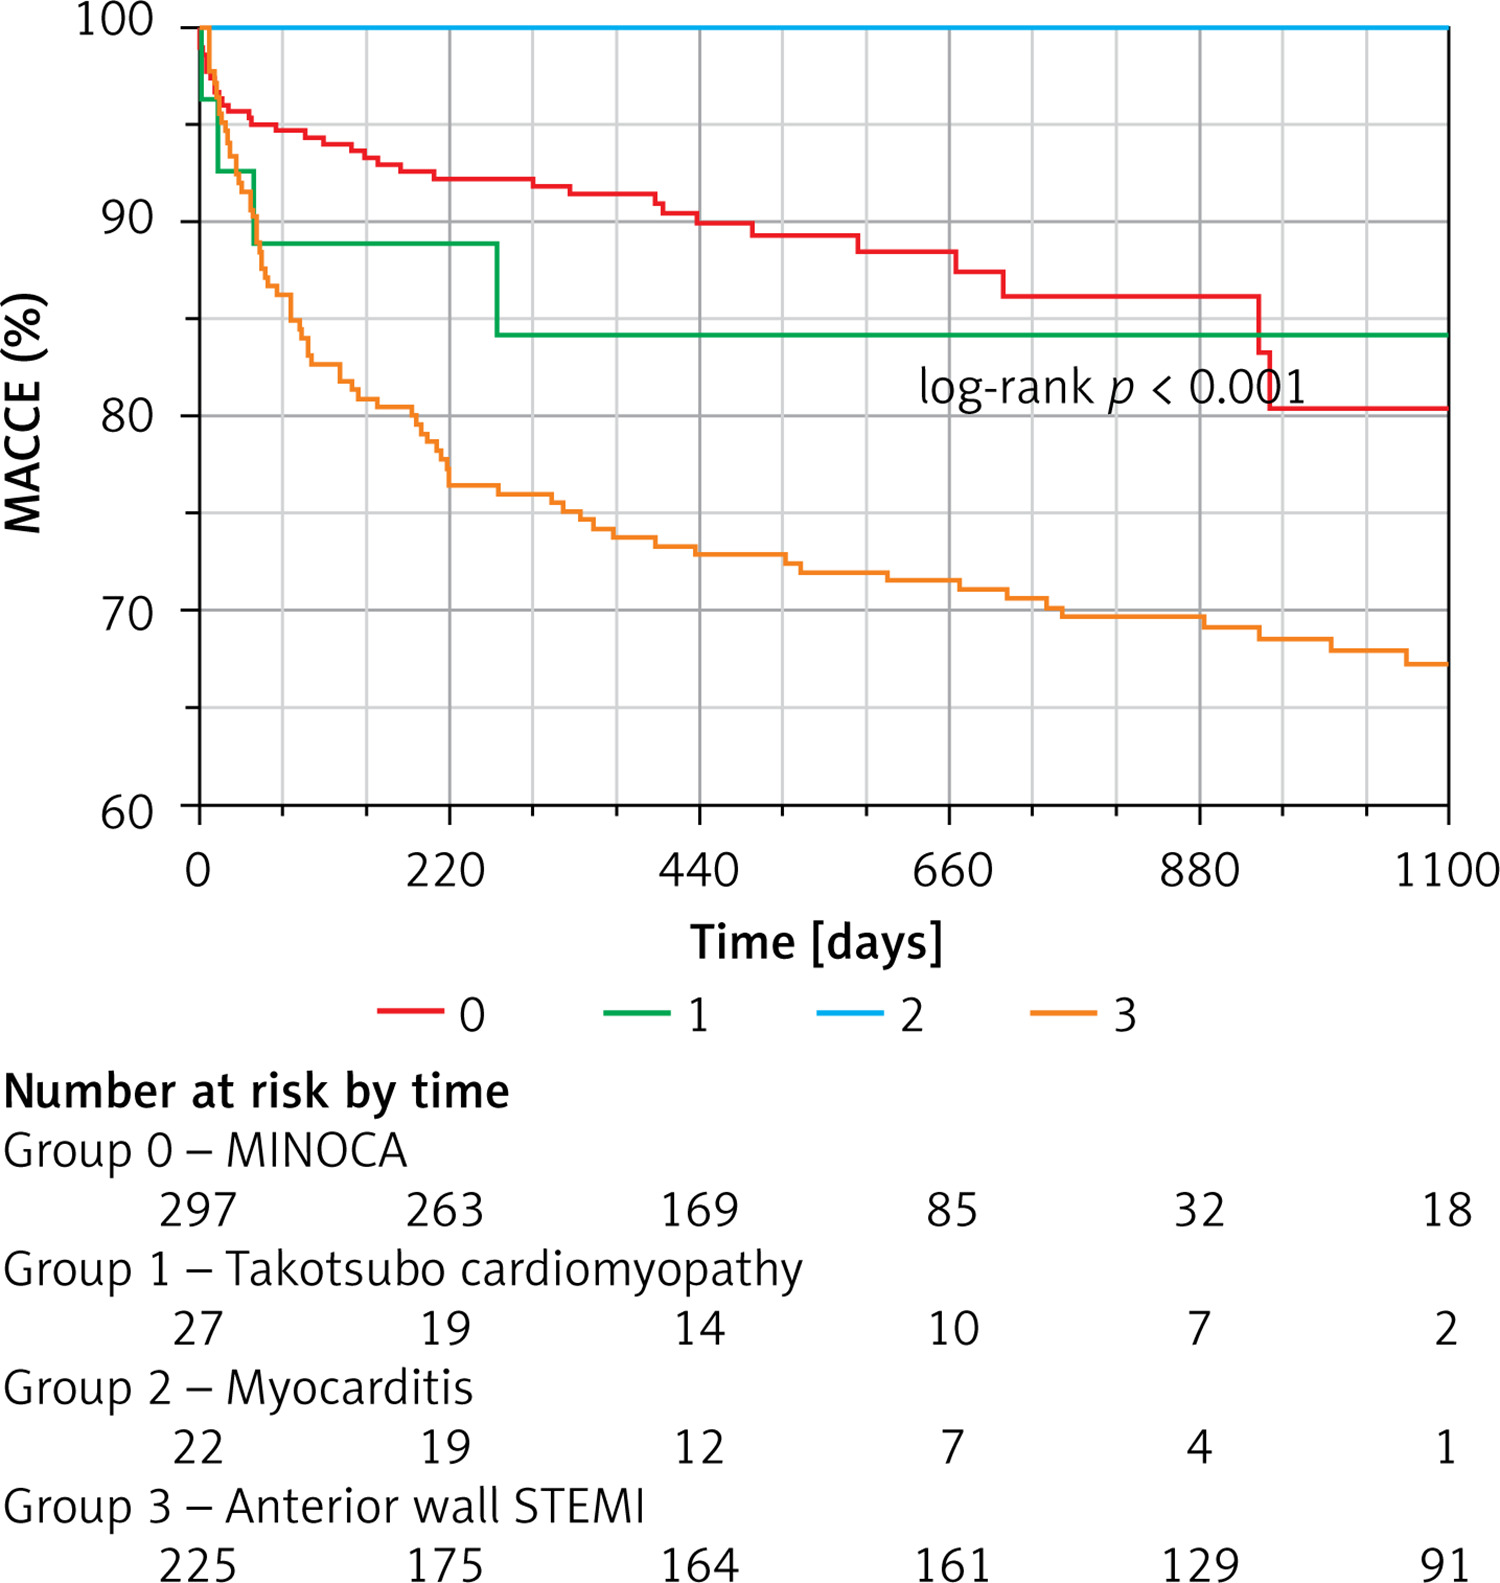
The 30-day all-cause mortality was the highest in TTC group (7.4%) and was followed by the MINOCA (3.3%) and STEMI group (2.2%), nonetheless, this difference remained without statistical significance. Also, 1-year mortality was the greatest in the TTC group (11.1%) compared to the STEMI (6.7%) and MINOCA groups (5.3%), and was also without statistical significance. At 3 years, the all-cause mortality remained the highest in the TTC group, however, it become comparable to the anterior STEMI group (11.1% vs. 9.8%), and did not differ statistically significantly between all 4 groups of patients (Table IV). Lack of significance was also confirmed by Kaplan-Meier curves analysis (Figure 1). Considering MACCE rates, at 30 days, the highest MACCE incidence was present in the TTC (7.4%) and STEMI groups (6.7%), and there were no statistically significant differences between the 4 analysed groups. At 1 year, the MACCE rate was significantly greater in the STEMI group (25.8%) in comparison to the TTC (14.8%), MINOCA (8.3%) and IM groups (0%, p < 0.001). At 3 years, the MACCE rate was the highest in the STEMI group (32%) when compared to the TTC (14.8%), MINOCA (11.3%) and IM groups (0%, p < 0.001). This is presented in Table IV. The significance of MACCE rate differences was also confirmed by Kaplan-Meier curves analysis (Figure 2). When considering particular components of MACCE after 3 years of follow-up in the STEMI group, the values reached 42% for re-PCIs, 23% regarding deaths, 27% for MIs and 8% concerning cerebral stroke. In the MINOCA group, deaths totalled 38%, 6.6% re-PCIs, 6.6% cerebral strokes and 49% MIs. In the TTC group, deaths comprised 37.5%, 12.5% re-PCIs and 50% MIs. There were no MACCEs at the time of the 3-year follow-up period in the IM group.
Table IV
Study endpoints
Figure 1
Comparison of Kaplan-Meier survival curves of all-cause mortality between selected groups of patients (myocardial infarction with non-obstructive coronary arteries, tako-tsubo cardiomyopathy, ST-segment elevation myocardial infarction and infective myocarditis) during the 3-year follow-up period
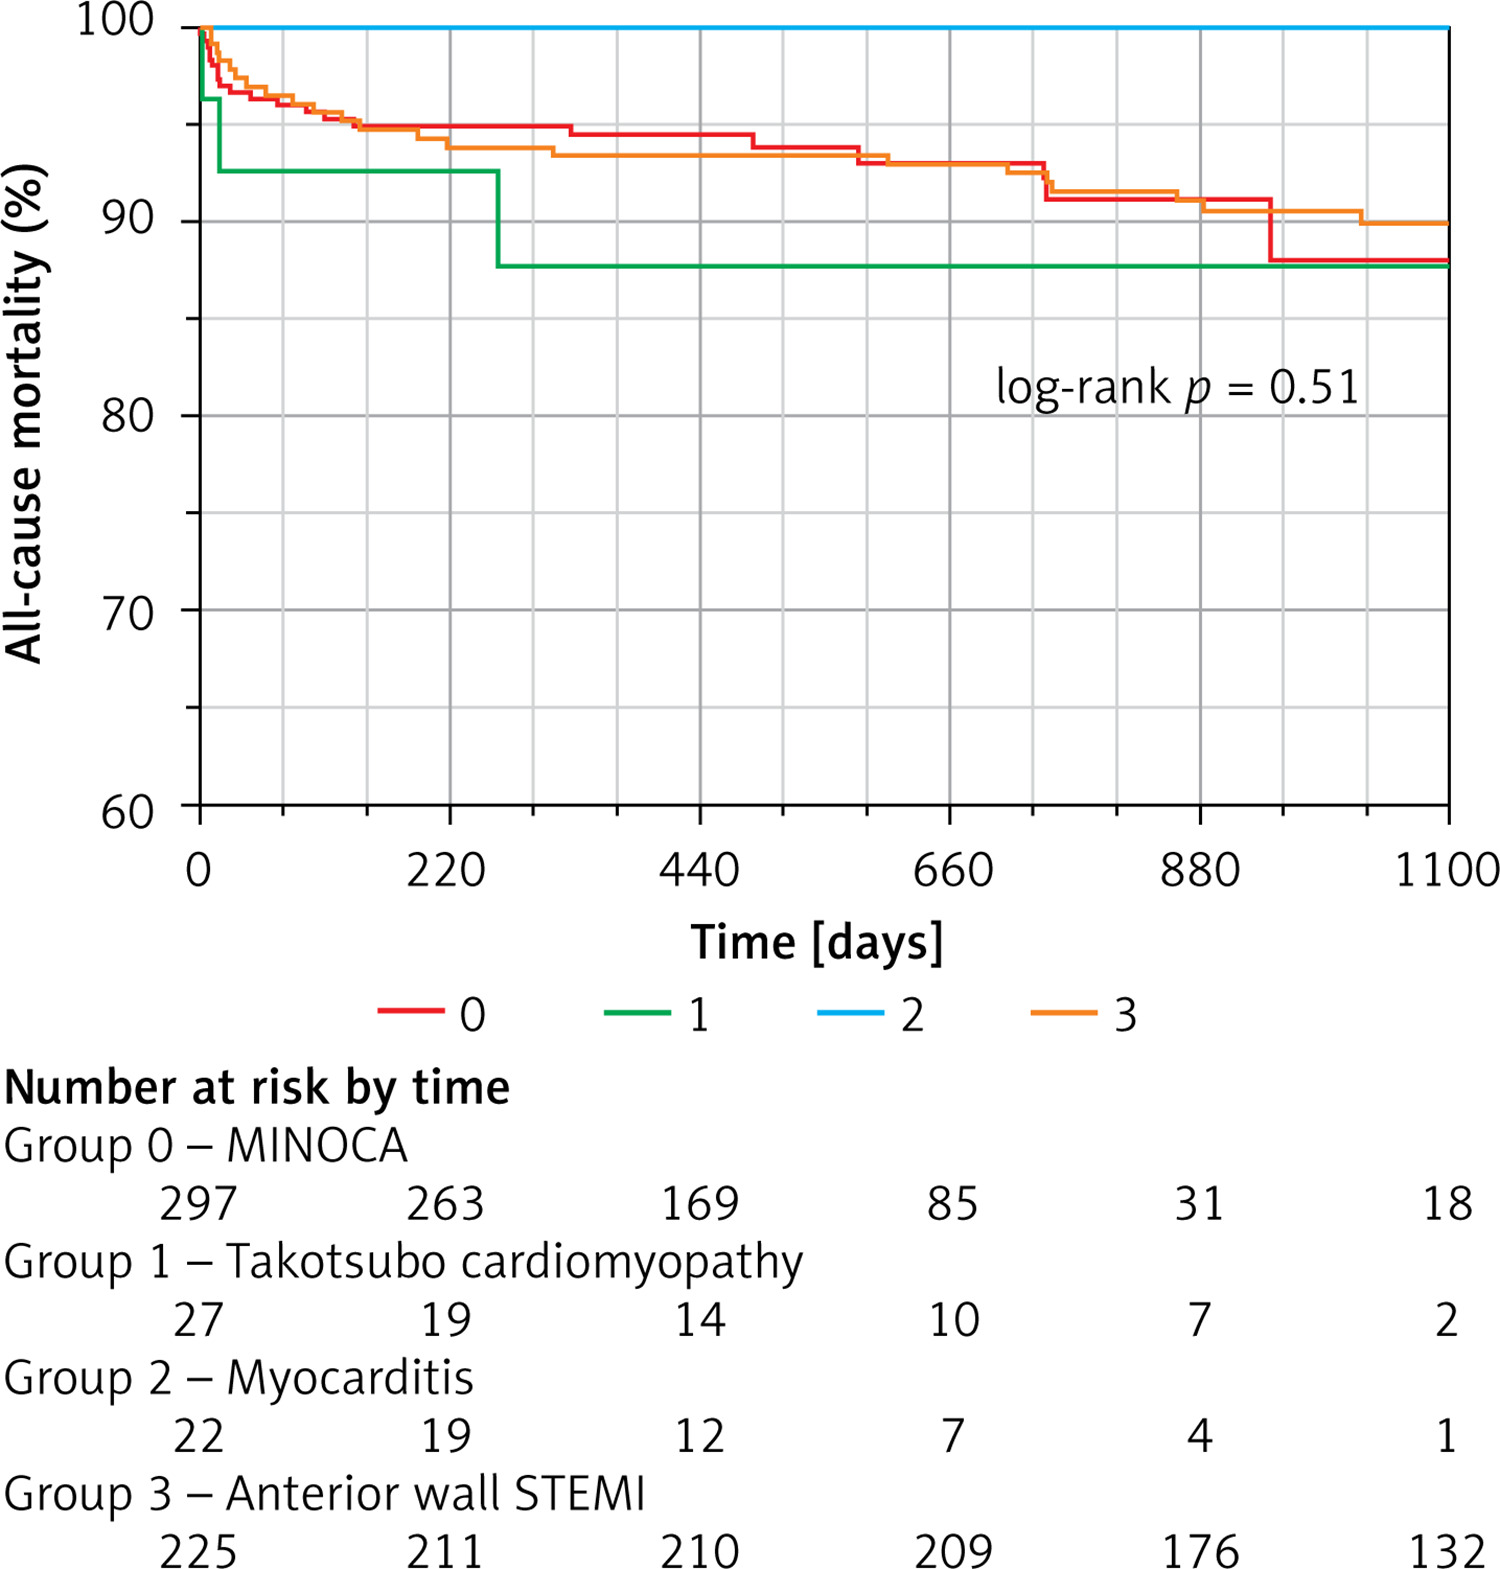
Figure 2
Comparison of Kaplan-Meier survival curves of MACCE incidence between selected groups of patients (myocardial infarction with non-obstructive coronary arteries, tako-tsubo cardiomyopathy, ST-segment elevation myocardial infarction and infective myocarditis) during the 3-year follow-up period
Predictors of all-cause mortality and major adverse cardiac and cerebrovascular events
The results of univariable and multivariable analysis used to identify variables as significant predictors of the frequency of MACCEs during the 3-year long follow-up period in the overall group of patients are presented in Table V.
Table V
Predictors of long-term mortality and major adverse cardiac and cerebrovascular events in the overall group of patients
[i] MACCE – major adverse cardiac and cerebrovascular events, LVEF – left ventricle ejection fraction, TCC – takotsubo cardiomyopathy, ULN – upper limit of normal, CK-MB – maximal creatine kinase myocardial band, hs-TnI – high-sensitivity troponin I, group 1 – hs-TnI ≤ 3 × above ULN, group 2 – hs-TnI > 3 ≤ 10 × above ULN, group 3 – > 10 × above ULN, group 4 – hs-TnI ≤ 5 × above ULN, group 5 – hs-TnI > 5 ≤ 20 × above ULN, group 6 –hs-TnI > 20 × above ULN.
While evaluating predictors of all-cause mortality, the results of univariable and multivariable analysis are presented in Table V.
Discussion
The main finding of the current analysis is that the frequency of MACCEs was significantly higher in the STEMI group at 1 and 3 years of follow-up when compared to other groups, and this was confirmed by Kaplan-Meier survival curves analysis. While all-cause mortality was the greatest in TTC group when compared to other groups at following time points of the observation period, the difference did not reach statistical significance. The main component of MACCE in the STEMI group, which outweighed the significance, were reinterventions. Prior-PCI, maximal creatine kinase myocardial band (CK-MB), haemoglobin concentration, white blood cells, platelet count, age and serum creatinine concentration were among the independent predictors of all-cause mortality and MACCE.
Although MINOCA, TTC, IM and acute anterior wall STEMI have different pathogenesis, they may be visible as very similar clinical presentations, posing some difficulties in differentiating diagnosis. In recent years, the number of STEMIs has slightly decreased, whereas the number of cases of other acute cardiovascular diseases including TTC, MINOCA or viral myocarditis have experienced an increase [14, 15]. This process is associated with the general trend of decreasing STEMI infarction rates for NSTEMI, but also the prevalence of additional diagnostic imaging tests such as cardiac magnetic resonance imaging, which is recently being more frequently used in the diagnosis of MINOCA [16]. Discussing the all-cause mortality, although there were no statistically significant differences among the 4 examined groups, surprisingly enough, the highest death rates in short- (30 days) and long-term (3 years) follow-up were visible in the TCC group.
Referring to the results of other studies, in a recent, broad systematic review and meta-regression study, the overall mortality rate was calculated during the median follow-up of 28 months at 10.2% [17]. Comparing these results to those obtained in our study, long-term, all-cause mortality among patients with TCC was at the level of 11.1% after 3 years of follow-up. While in the report from the SWEDEHEART registry published by Redfors et al., 30-day mortality among TCC patients totalled 4.1% and was comparable to the STEMI and NSTEMI groups [2]. In our study, the 30-day mortality rate in the TCC group was higher than that reported by Redfors et al,. and the rate for anterior-wall STEMI patients included in the current analysis (7.4% vs. 2.2%). Subjectivity of the results may have partially been affected by the very small group of patients with TCC in our study compared to the study published by Redfors et al. (302 patients) or Pellicia et al. (4,679 patients). Another important factor that could have influenced the results was significant over-representation of males in the group of patients with TCC in our study. Comparing men and women, Misumida et al. indicated that in-hospital mortality rate among males with TCC was slightly higher than among women (8.4 % vs. 3.6%) [18]. In yet another analysis, a higher in-hospital mortality, longer intensive care stay and higher frequency of sever heart failure was demonstrated among men with TCC compared to women [19]. According to subgroup analysis from the Tokyo Cardiovascular Care Unite network registry, patients with physically triggered TCC, which appeared more often among men, had higher non-cardiac mortality rates than patients with acute anterior myocardial infarction (7% vs. 1.1%) [1, 20].
Interestingly, in gender-based comparisons of TCC vs. myocardial infarction, the mortality of male patients with TCC was significantly higher compared to acute coronary syndrome in MI-CAD patients [21]. Inversely, in acute STEMI, women seem to have poorer outcomes than men [22]. However, in our analysis, the majority of patients for the anterior wall STEMI group were females. It may be suspected that if the gender ratio were inversed in the anterior wall STEMI group, then all-cause mortality in TCC group would became significantly greater than in the anterior wall STEMI group. But also, in case of higher frequency of females in the TCC group, which is usually observed in other studies, then this relationship would also became balanced.
In long-term observation (5 years), the all-cause death rate in STEMI patients was at the level of 20.7% [23]. In our study, it reached 9.8% among patients in the anterior wall STEMI group. This may be the result of the shorter follow-up duration (3 years) [23]. Another factor is the specifics of the group, which was burdened to anterior wall STEMI patients, and not all STEMI patients. Whereas the short- and long-term mortality rates presented in our study were lower among anterior wall STEMI than TCC patients; in long-term observation, the MACCE rate was statistically significantly higher in the anterior wall STEMI group (32% vs. 14.8%). While assessing the burden of cardiovascular risk factors in the present study, the frequency of patients with arterial hypertension was similar in all groups. There was statistically more patients with hyperlipidaemia and diabetes in the anterior wall STEMI group compared to other groups, which may be directly related to a greater number MACCEs during follow-up. This could be related to the higher rate of re-interventions in the anterior wall STEMI group when compared to other groups. This remains with agreement with other results reported in published studies [6]. Overall mortality in the MINOCA group in our study ranged from 3.3% at 30 days of observation to 6.6% in at the 3-year follow-up, which seems to be in accordance with recent publications in which the1-year follow-up mortality rate was estimated at 4.7% [24]. The group of patients with the best outcomes in which we did not observe deaths or MACCEs in the long-term, 3-year follow-up, was the group of patients with infectious myocarditis. In comparison to the results of other published studies, one of the retrospective multicentre registries reported cardiac mortality in uncomplicated cases to be at 0%, and there were no AM-related cardiac events after 5 years of follow-up among these patients [25].
Another issue worth mentioning in the current study is that higher body-mass index values and presence of hyperlipidaemia were found to be statistically significant predictors of better clinical outcomes in the overall group of assessed patients. Although it has been previously reported in MINOCA patients as the so-called “cholesterol paradox”, reports involving patients with TCC or STEMI patients are rare [26]. In one such study, no differences were demonstrated in mortality among obese or non-obese TCC patients [27]. In another study, the all-cause mortality was lower in older, overweight and obese patients with myocardial infarction in comparison to normal-weight patients [28].
Among other significant predictors of all-cause mortality, we also found increased level of creatinine, which is a well-known and sanctioned predictor of poorer clinical outcomes in this group of patients and was also confirmed in another study which revealed that GFR < 60 ml/min. was an independent predictor of 5-year mortality [19].
Similarly to the previously published study by our team, female gender was found to be an independent predictor of MACCE (p = 0.047) in univariable analysis, nonetheless, its significance was not confirmed by multivariable analysis [29]. Somehow, it has to be mentioned that the ratio of males vs. females in the current analysis is different when compared the previous one.
Among further independent predictors of all-cause mortality and MACCE rate, we found prior-PCI, maximal serum CK-MB level, blood haemoglobin concentration, white blood cell and platelet count. Lower haemoglobin concentration seems to be especially meaningful among MINOCA patients who presented significantly lower blood haemoglobin concentration in comparison to other groups. This can be mainly driven by its association with the supply/demand mismatch accountable for myocardial infarction type 2. That was also confirmed by Jesus Espinosa Pascal et al. in a vast study conducted among MINOCA patients [30]. Patients with myocarditis were younger and had fewer traditional risk factors for coronary heart disease, which undoubtedly influenced MACCE and all-cause mortality during the follow-up period.
In conclusion, during the 3-year follow-up period, anterior wall STEMI had significantly poorer prognosis in terms of MACCE when compared to the TTC, IM and MINOCA groups. TTC was related to the greatest all-cause mortality, however, this was without statistical significance. The analysis allowed to compare the results of treatment between selected groups of patients limited to 2 academic centres and to confront them with the results of other studies, as well as to identify subgroups of patients with the worst prognosis in terms of predictors. Local data often differ significantly from data obtained in multicentre studies, which allows adjusting the care of patients in selected groups of patients and thus improving treatment results in dedicated centres.

