Introduction
Coronary artery disease (CAD) is the world’s most common cause of death. Currently, coronary computed tomography angiography (CCTA) is the preferred imaging examination method to evaluate CAD noninvasively, owing to its relatively high sensitivity and negative predictive value for obstructive CAD [1–3]. However, CCTA mainly assesses the anatomic severity of vessels and is limited in functional severity assessment of coronary stenosis [4]. Fractional flow reserve (FFR) is the gold standard of dynamics of coronary artery lesions [5, 6] and has been widely used among patients who were suspected to have CAD [7–9]. However, in the process of FFR, the ratio of pressure between the two sides of the stenosis was obtained through advancing a pressure wire toward the stenosis during coronary angiography, which is an invasive procedure and is associated with additional risks of adverse events and higher examination costs [10].
A wireless non-invasive FFR method derived from computational fluid dynamics (CFD) and 3D quantitative coronary angiography (3D-QCA) was invented to assess the hemodynamic effect of coronary stenosis on the basis of their angiographic morphology [11–14]. The wireless FFR method presents high diagnostic value for coronary artery stenosis induced by myocardial ischemia without increasing radiation dosage and provides an ideal noninvasive method for evaluation of lesion dynamics. It was demonstrated that angiography-derived FFR showed good accuracy compared with invasive FFR [15]. This meta-analysis was undertaken to evaluate the diagnostic performance of wireless FFR with pressure wire FFR as a reference among patients with CAD.
Material and methods
Data sources and searches
Databases of PubMed, Cochrane Library, Embase, and Clinical Trials.gov were searched until October 2018 with the keywords “Fractional Flow Reserve”, “Computational Fluid Dynamic”, “angiography” and “Coronary Computed Tomography”. References from trials and relevant reviews were manually searched for additional trials.
Study selection
The following inclusion criteria were applied: (1) Patients were suspected or confirmed with CAD; (2) Patients were assessed by wireless FFR (FFR derived by coronary angiography (FFRangio), FFR derived by coronary CT angiography (FFRCT), quantitative flow ratio (QFR)) and measured invasive FFR; (3) The true positive, false positive, true negative and false negative results were reported; (4) 0.80 of invasive FFR was used as the threshold for lesion significance. Reviews, meta-analyses, observational studies, and small-sample trials (n < 50) were excluded. The meta-analysis follows the Standards for Reporting of Diagnostic Accuracy (STARD) [16].
Data extraction and quality assessment
Two authors extracted relevant information from the literature independently. Baseline demographic characteristics such as sample size, age, percentage of male subjects, percentage of diabetes mellitus, percentage of hypertension and study type were extracted from eligible studies. Relevant data of true positives, false positives, true negatives and false negatives were also extracted. The Quality Assessment of Diagnostic Accuracy Studies (QUADAS-2) tool was used to assess the quality of included studies. Risk of bias was evaluated based on four aspects: patient selection, index test, reference standard, flow and timing. Applicability was evaluated based on patient selection, index test and reference standard.
Date analysis
The primary outcome of sensitivity and specificity of wireless FFR in diagnosing hemodynamically significant coronary stenosis was pooled. Secondary outcomes include +LR, -LR, DOR and area under the receiver operating curve, along with the 95% confidence interval (CI) to express the diagnostic performance. Heterogeneity was detected by bivariate boxplot and publication bias was visually inspected using a funnel plot. All analyses were performed by Stata 11.0 (StataCorp, College Station, TX, USA).
Results
Literature screening and characteristics of included studies
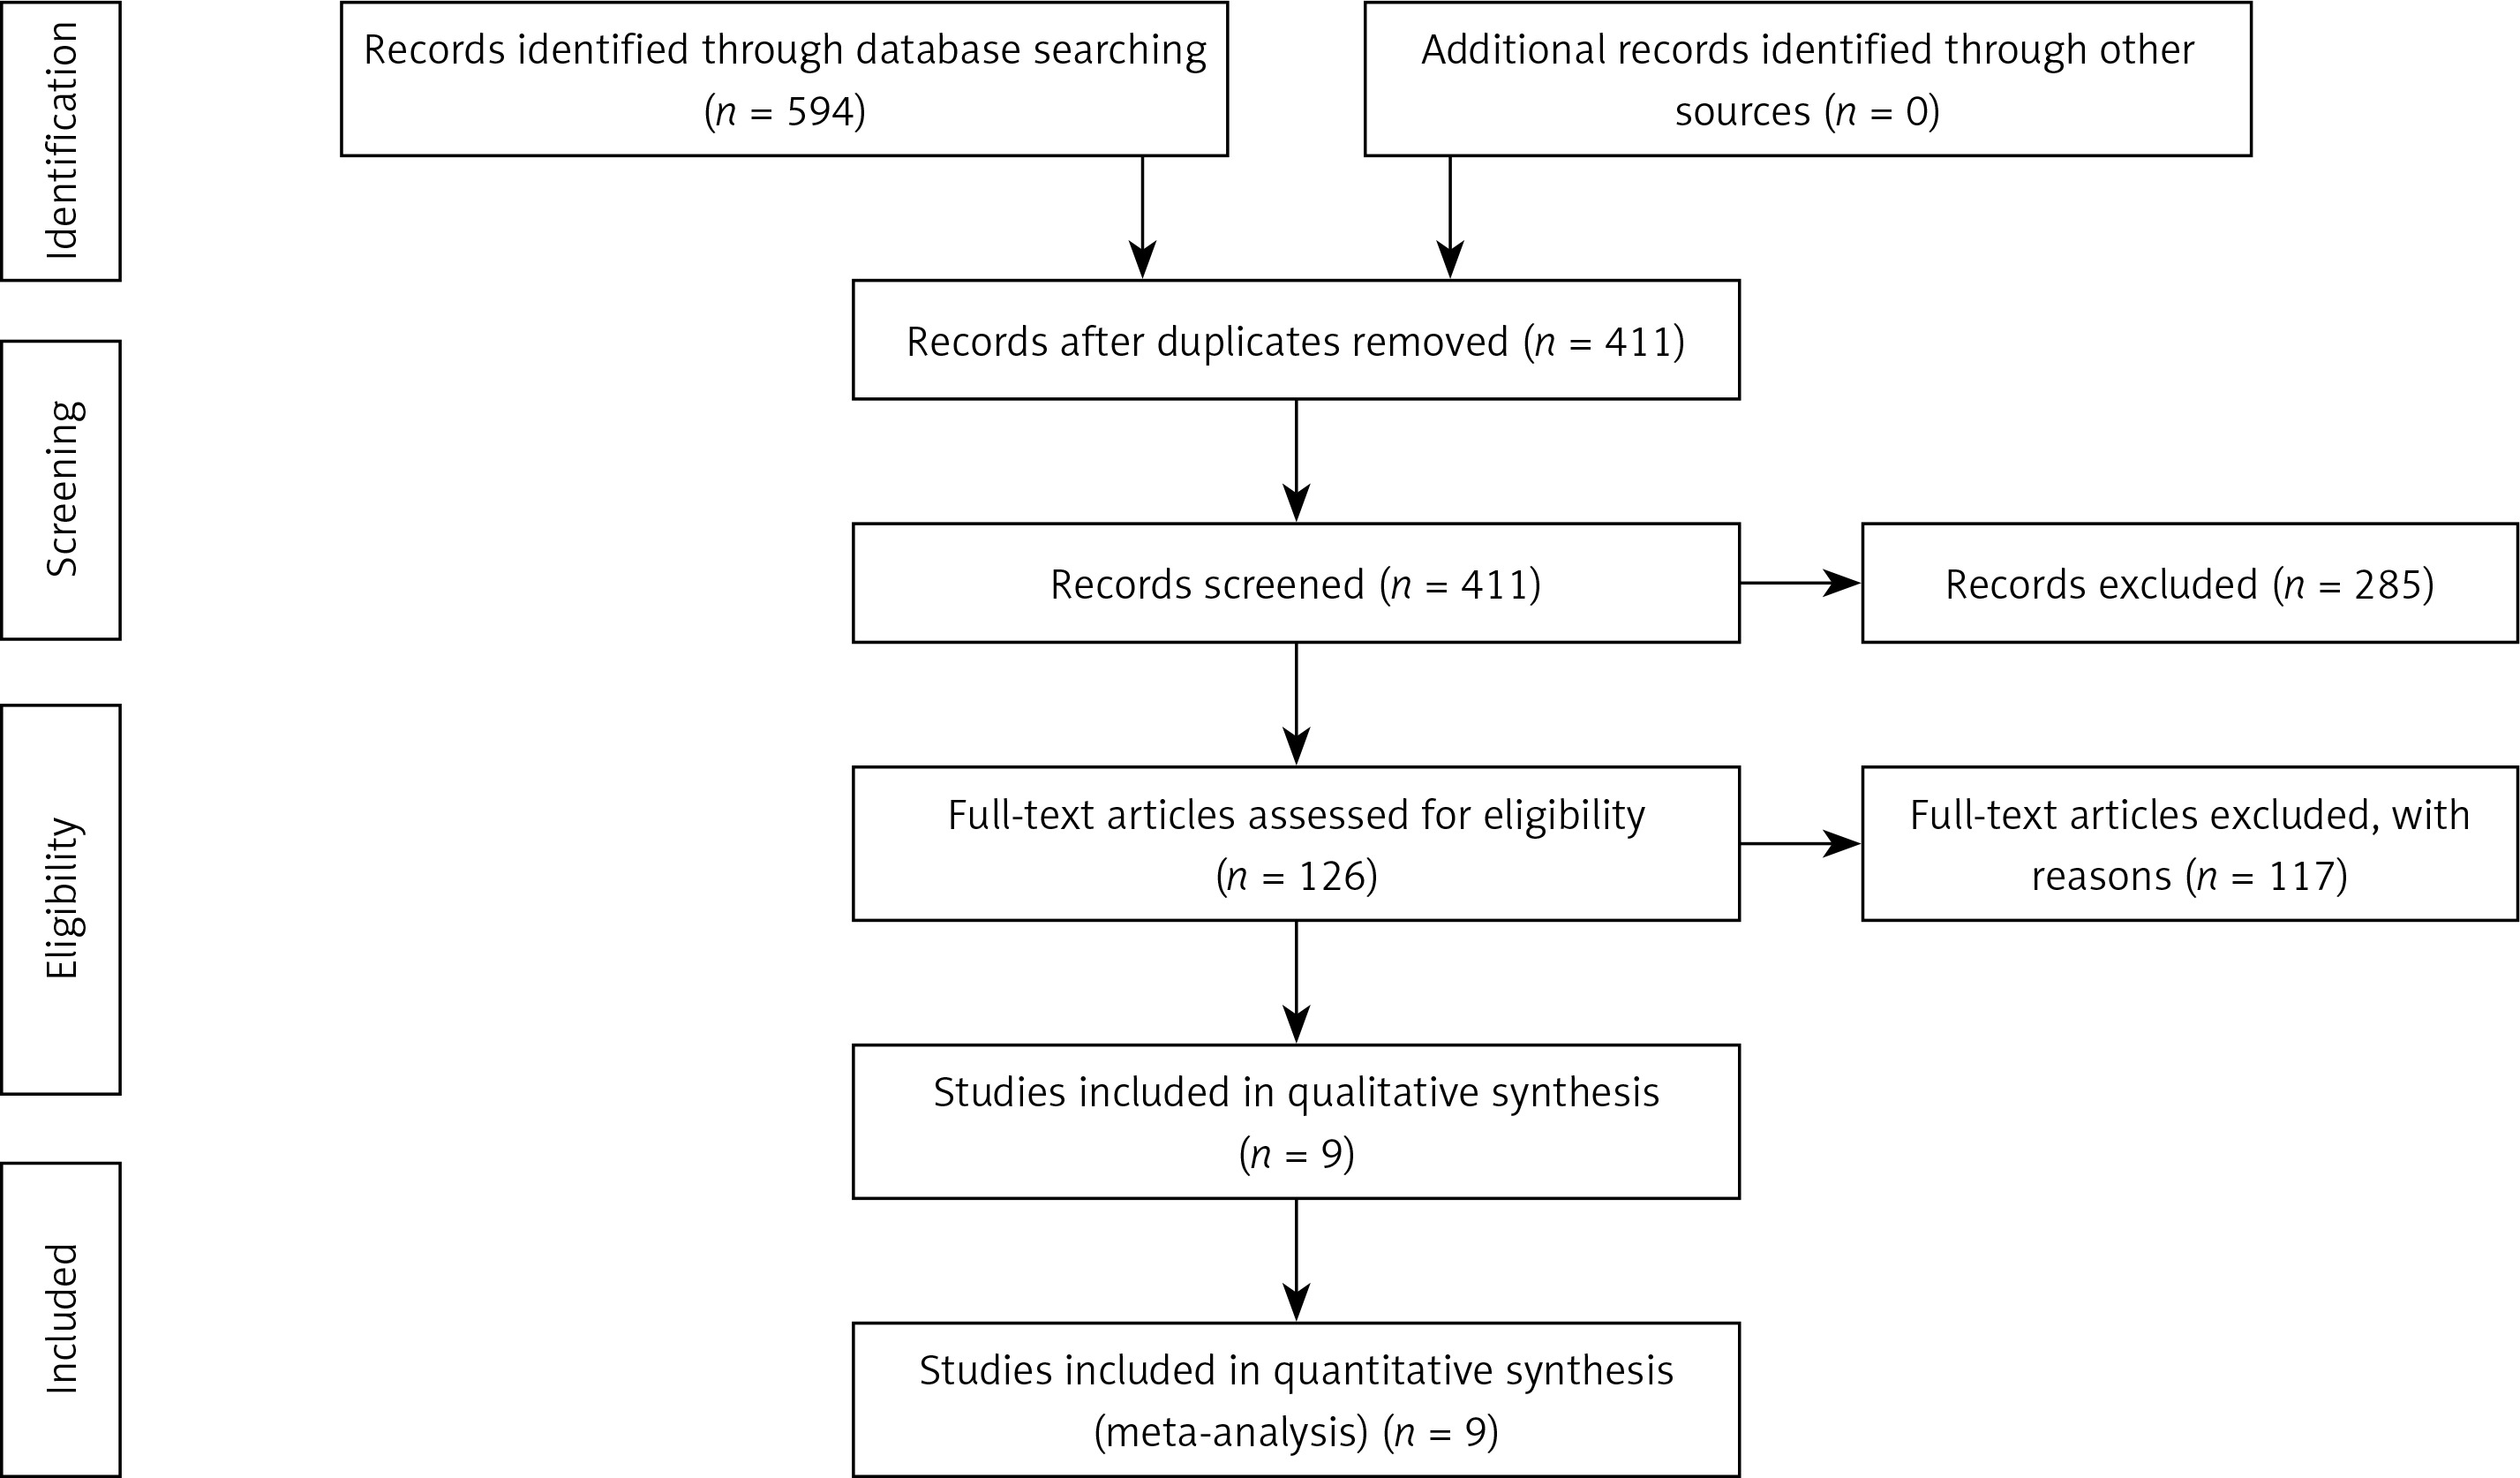
There were 594 articles in total found during the initial search. After removing duplicates and reviewing abstracts, finally 9 studies [14, 15, 17–23] comprising 2052 vessels met all inclusion criteria and were included in the analysis. The whole selection procedure was depicted in Figure 1. The baseline demographic characteristics of the included studies are detailed in Table I. Among the included 9 studies, the angiography-derived FFR calculation was performed using quantitative flow ratio (QFR) in 6 studies, FFRangio was used in 1 study, and FFRCT was used in 2 studies, in which FFR was derived from the computed tomography angiography (Table I). As the included studies were diagnostic test accuracy studies, the Quality Assessment of Diagnostic Accuracy Studies (QUADAS-2) tool was used to assess the study quality. The quality assessment results are presented in Supplementary Figures S1 and S2. There was low risk of bias regarding the index test, reference standard and flow and timing. Nevertheless, there existed unclear risk of bias with respect to patient selection due to the absence of consecutive inclusion in 44% (4/9) of the studies. In addition, low risk was observed regarding the index test, reference standard and selection of patients.
Table I
Baseline demographic characteristics of the included studies
Clinical results
Specificity and sensitivity
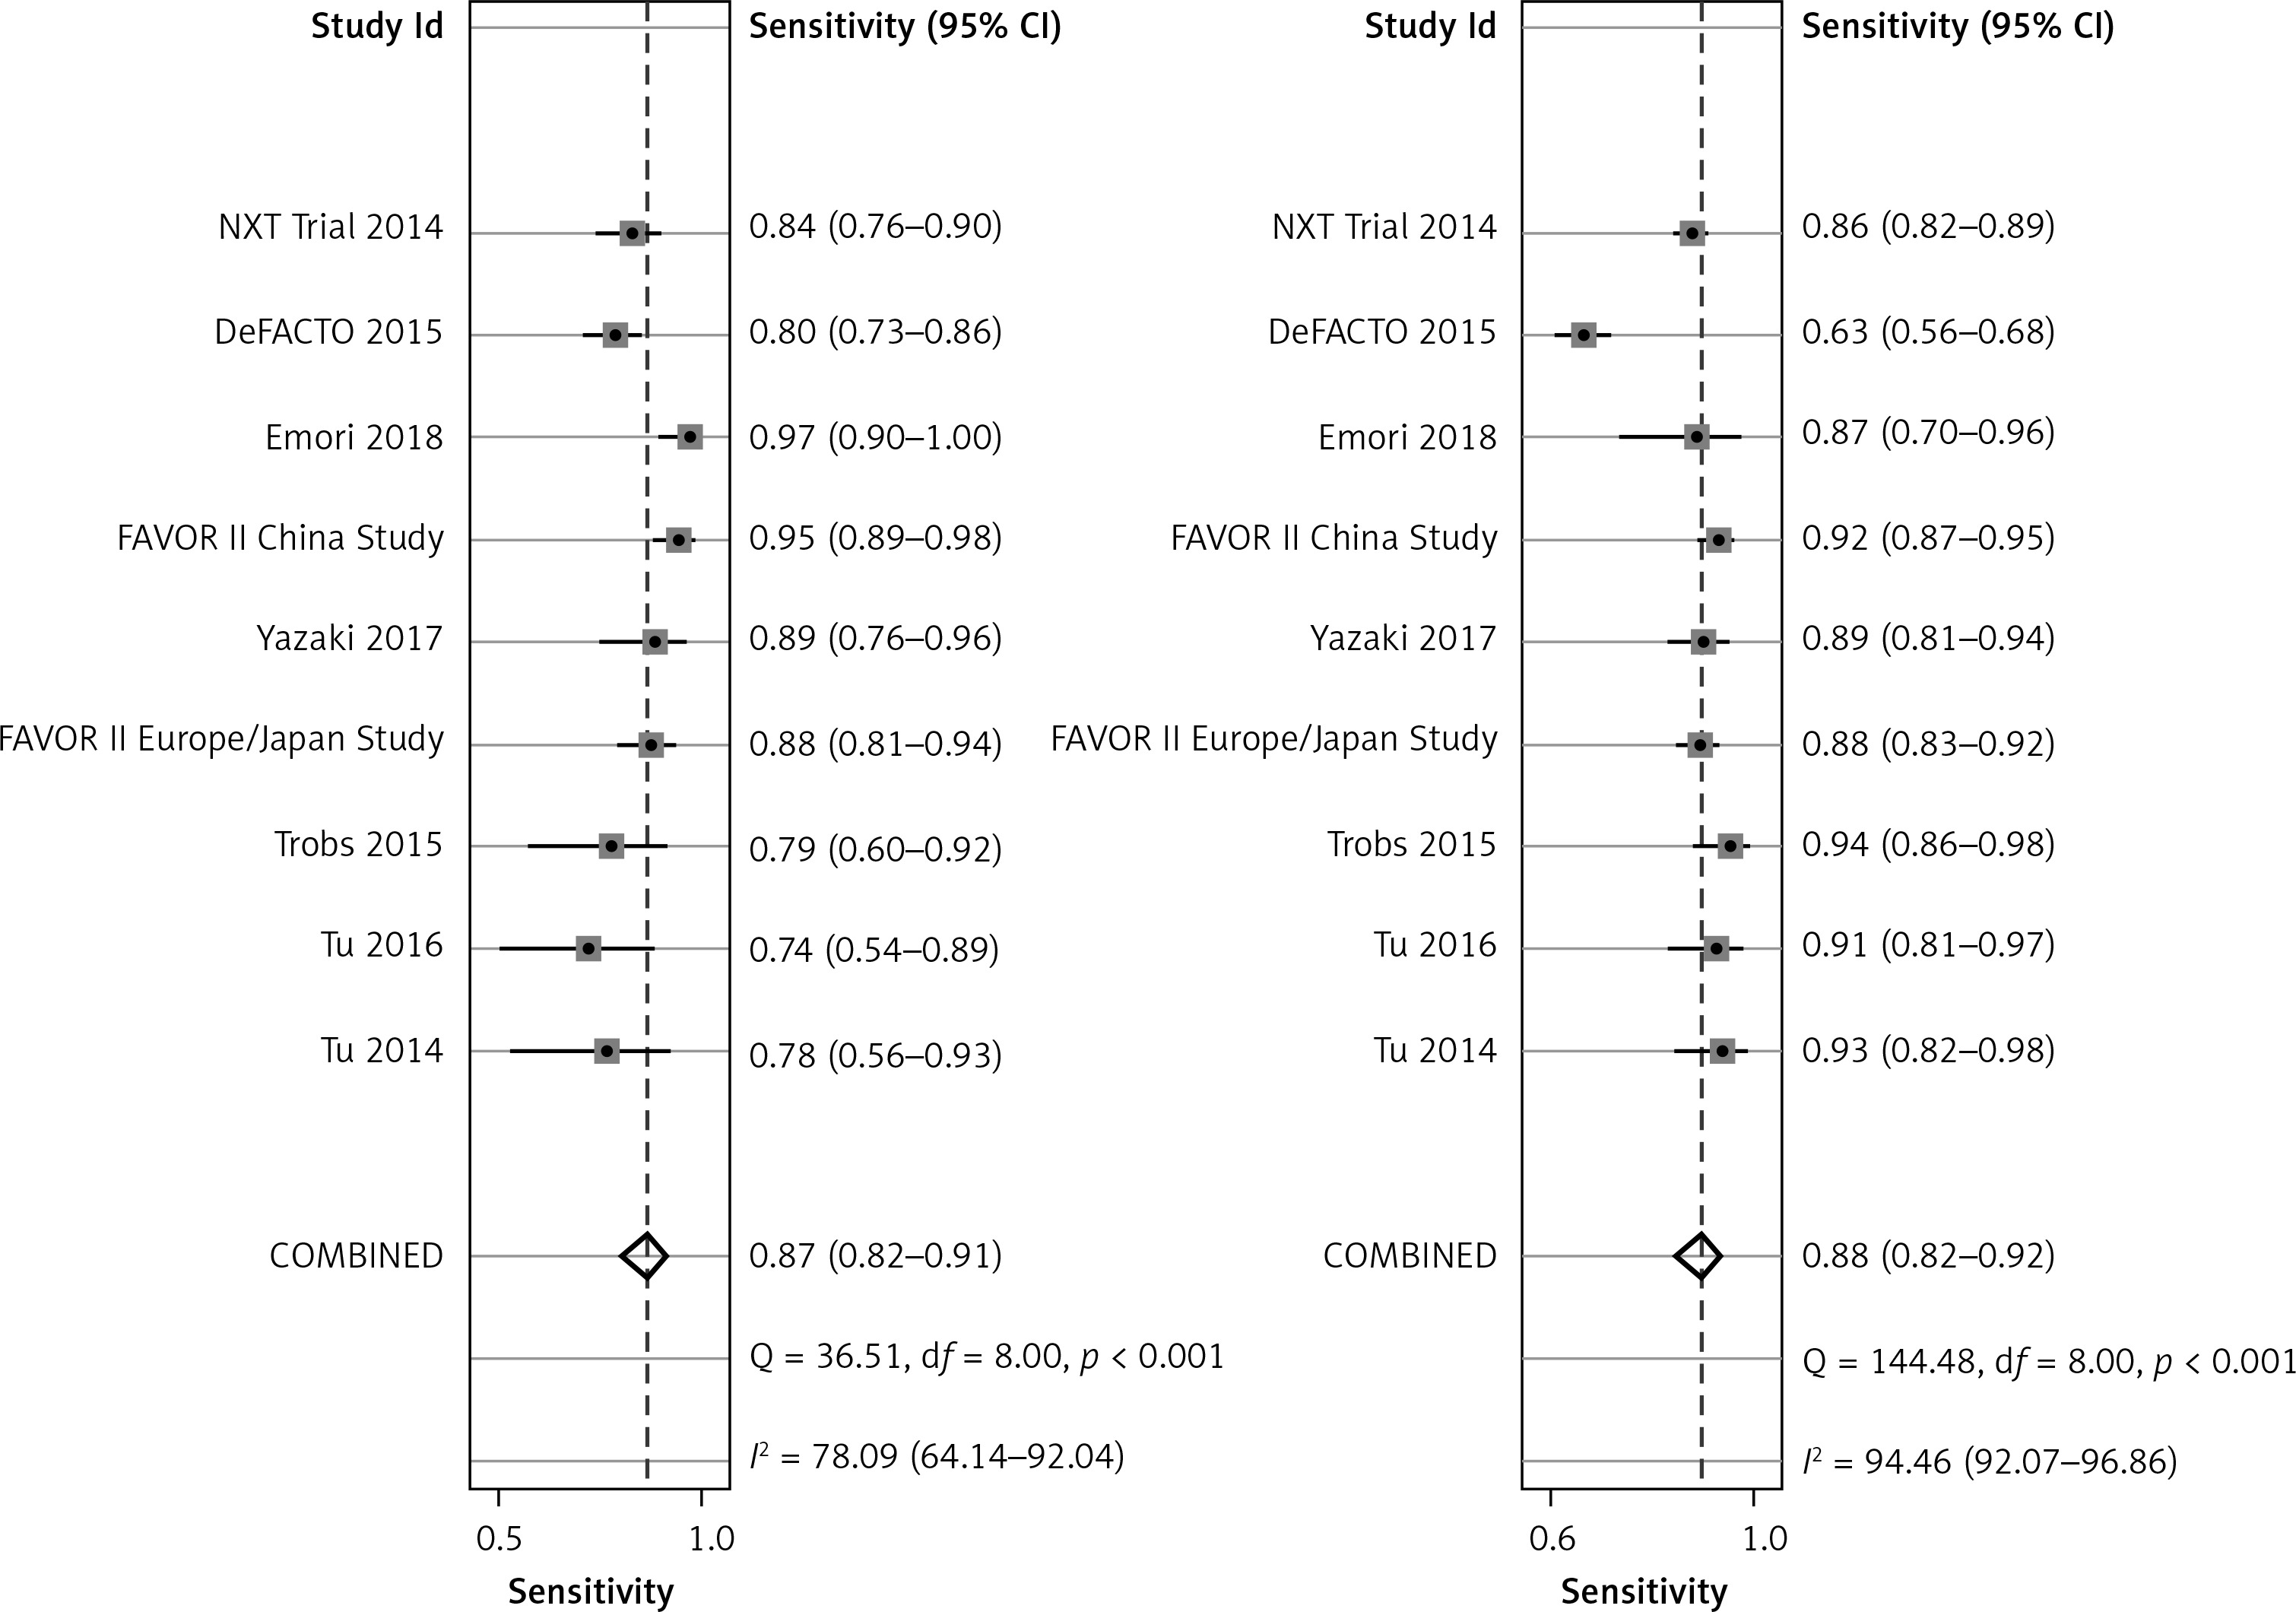
The diagnostic result of wire FFR was used as a reference in calculation of the specificity and sensitivity of wireless FFR. The pooled sensitivity of the wireless FFR in stenotic lesion detection was 87% (95% CI: 83%-94%) and pooled specificity was 88% (95% CI: 82–92%), as shown in Figure 2.
Positive and negative likelihood ratio
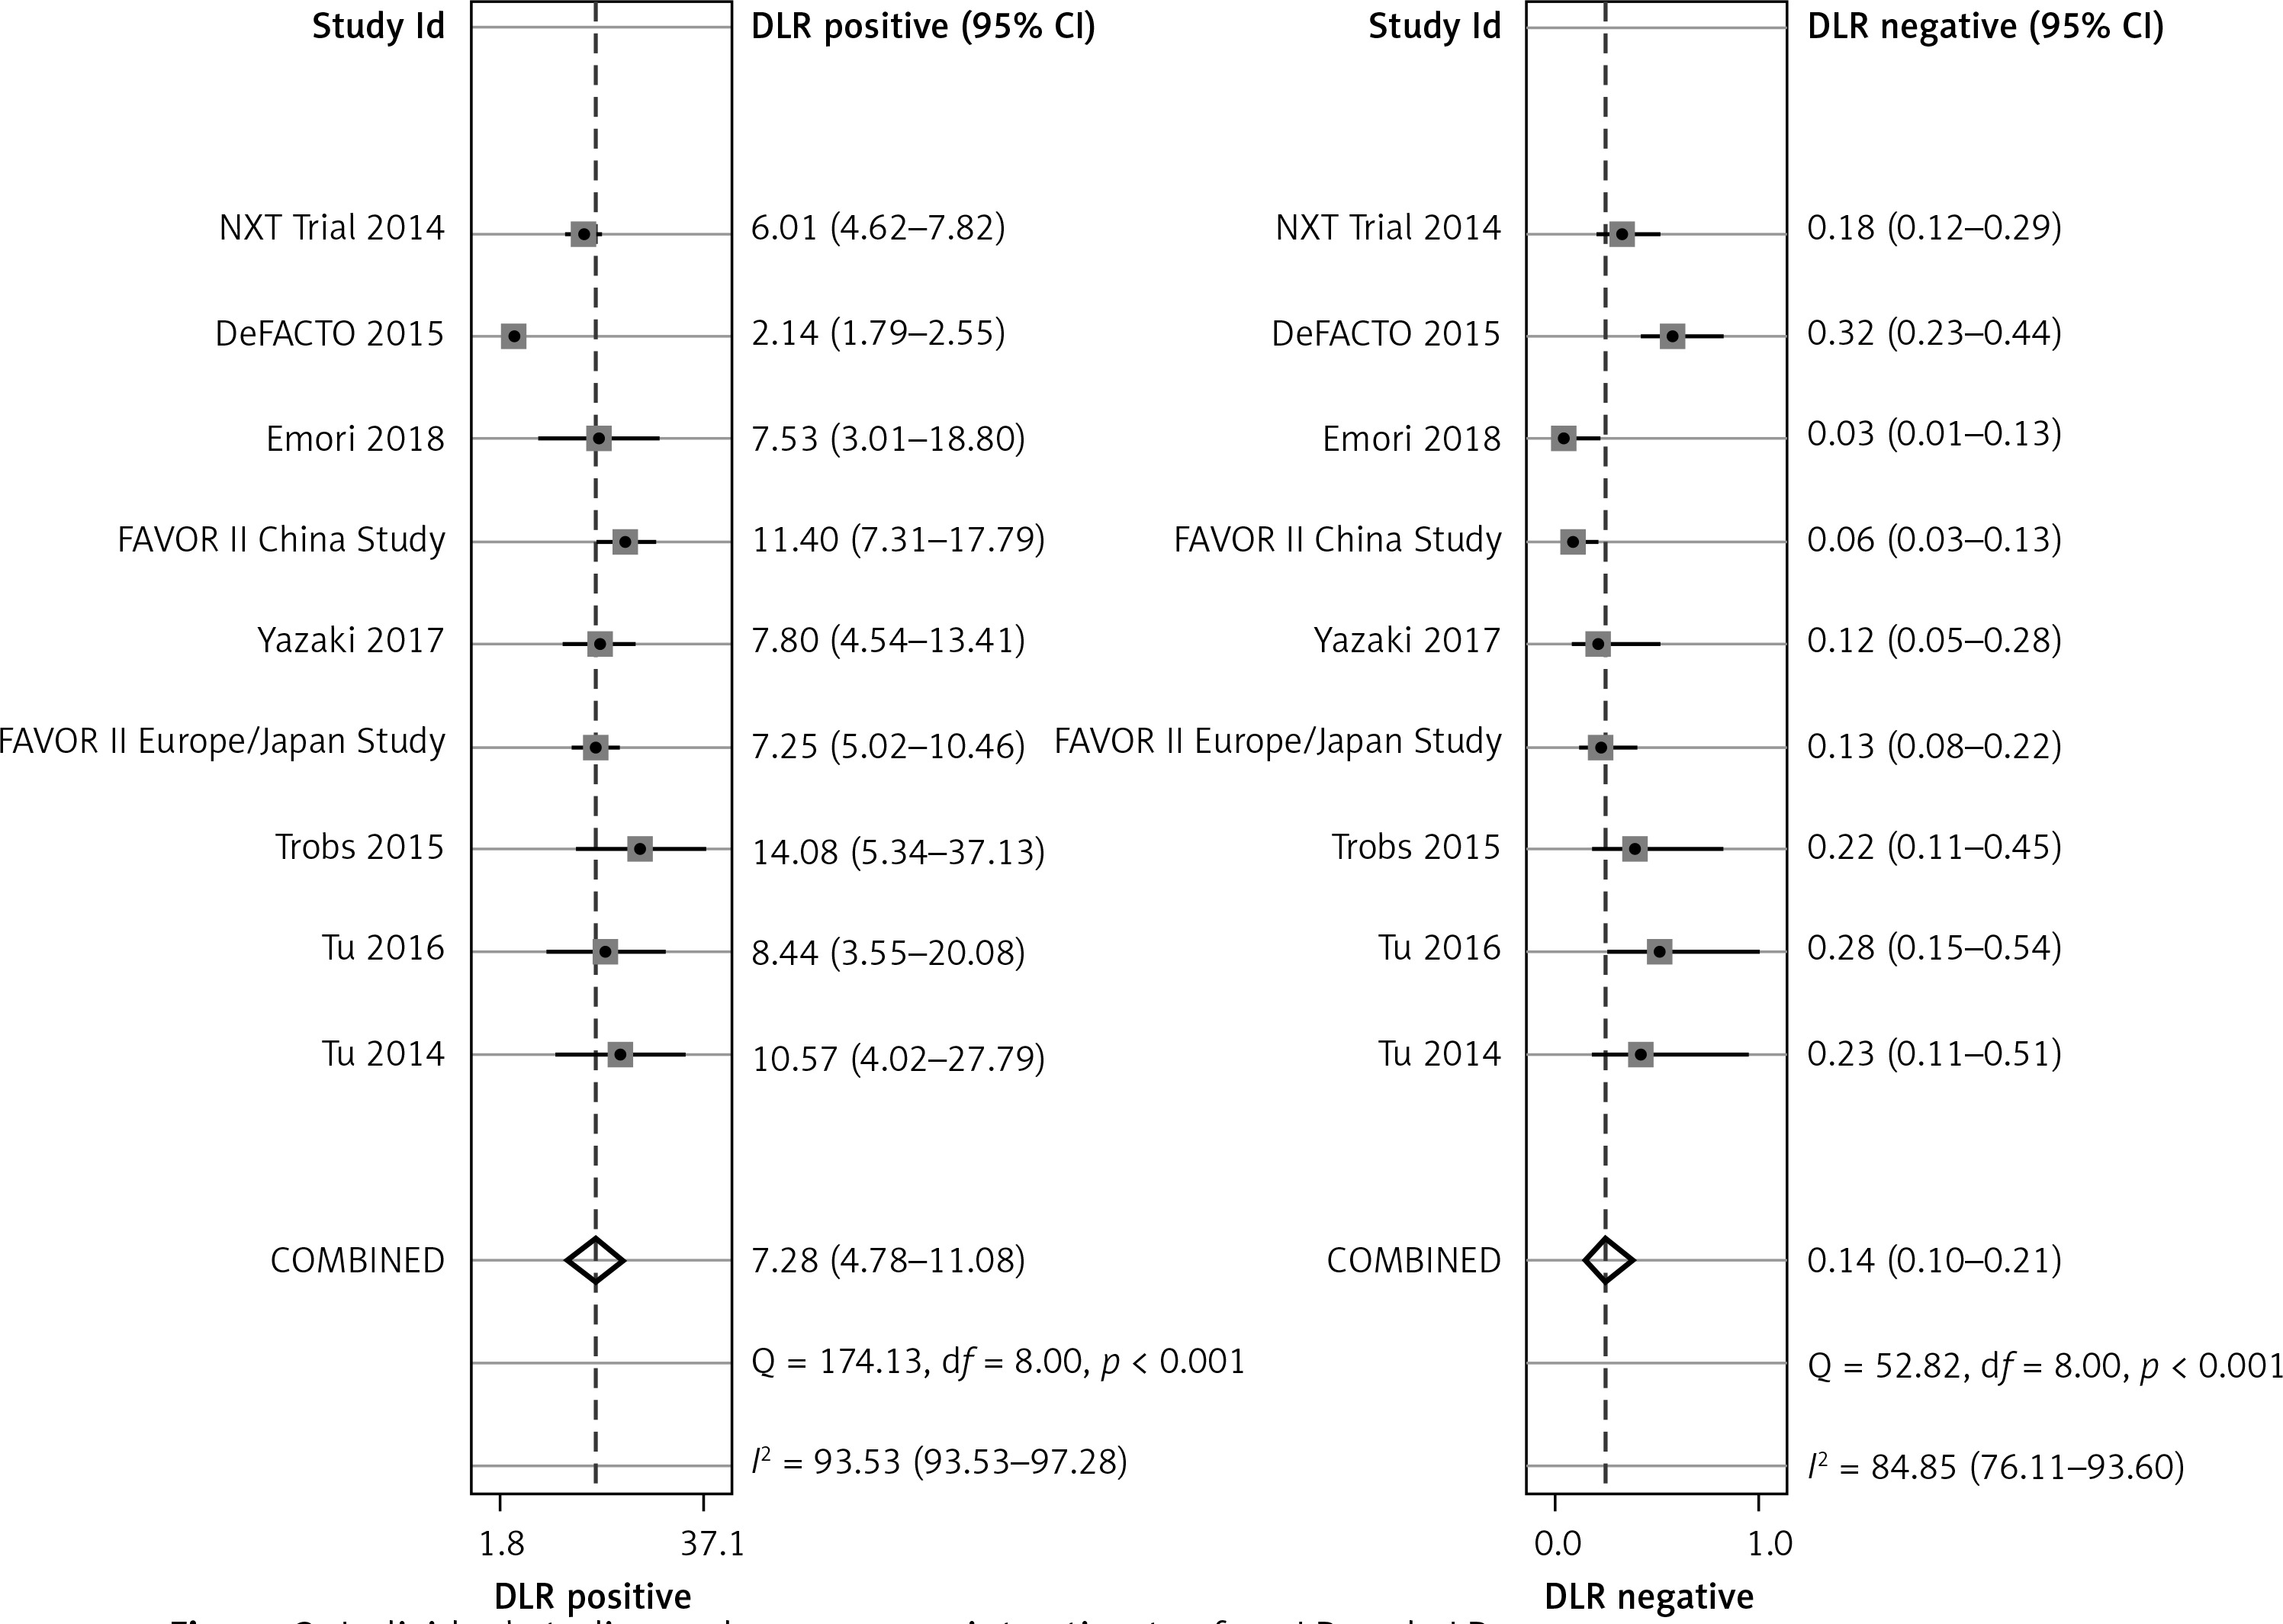
Positive likelihood refers to the ratio of the true positive rate to the false positive rate, with the gold standard as a reference. Negative likelihood ratio refers to the ratio of the false negative rate to the true negative rate, with the gold standard as a reference. The diagnostic result by pressure wire FFR was the gold standard. Pooled positive likelihood (+LR) was 7.28 (95% CI: 4.78–11.08) and negative likelihood ratio (–LR) was 0.14 (95% CI: 0.10–0.21) (Figure 3).
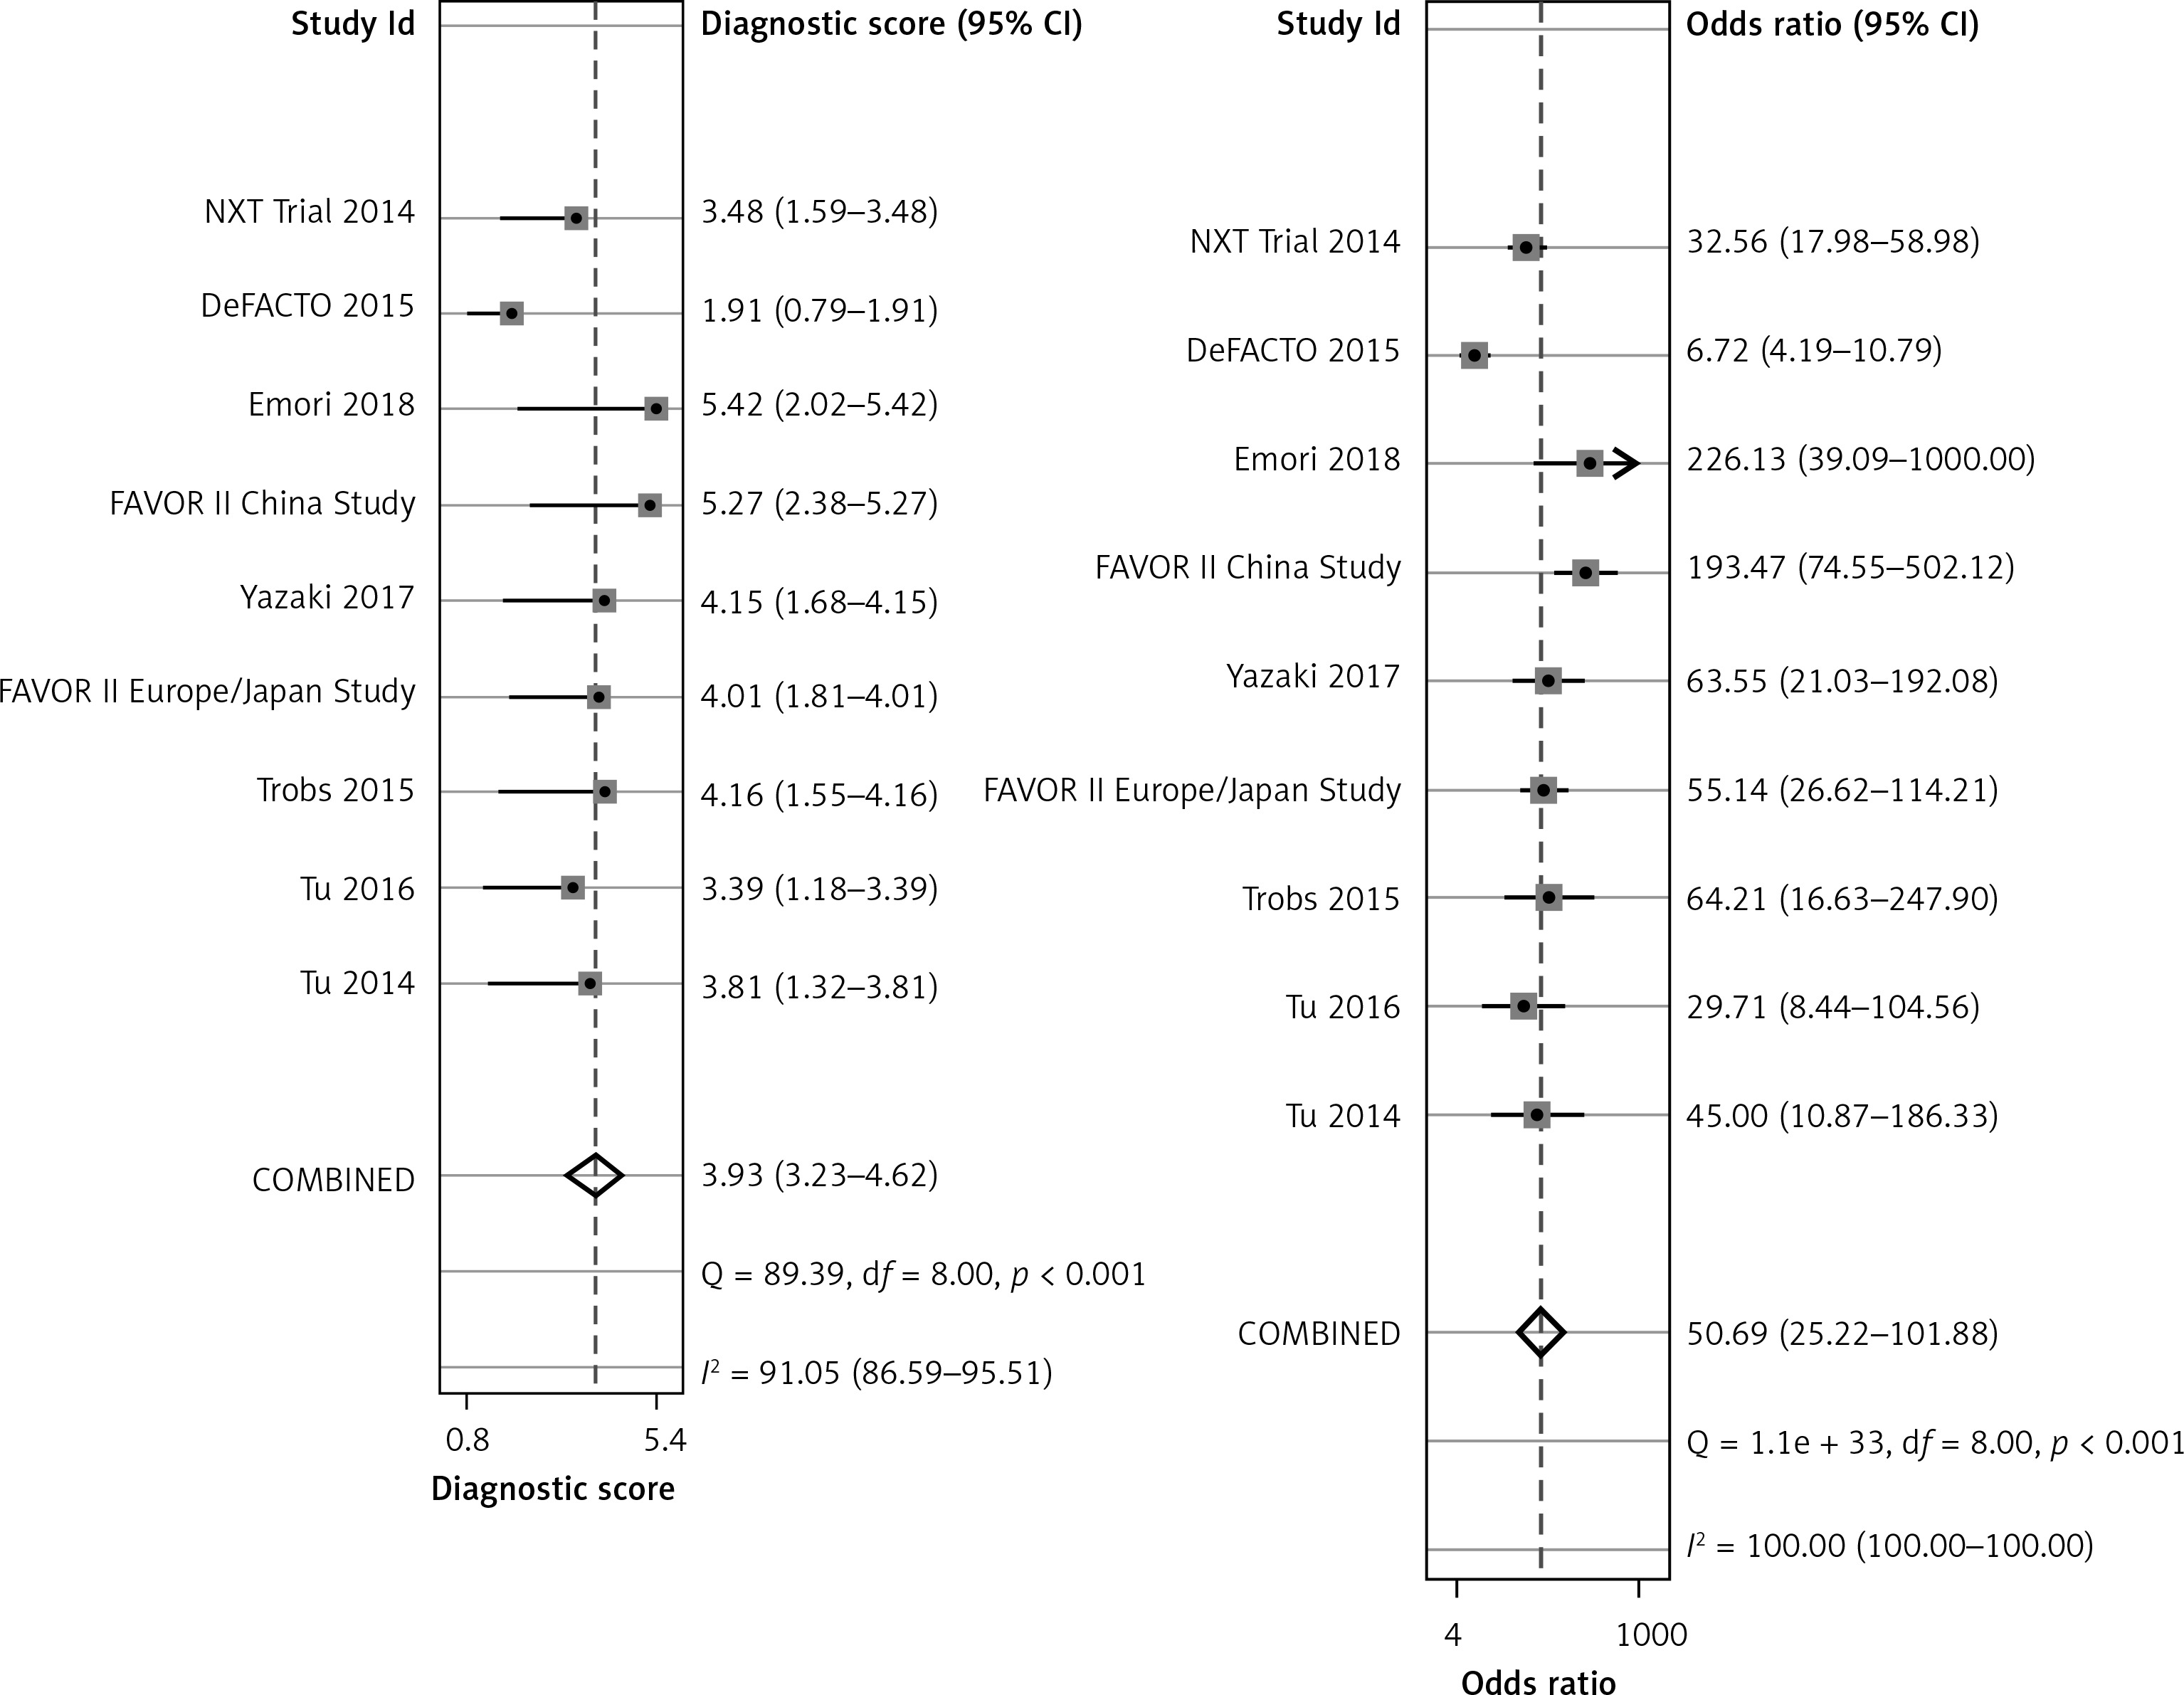
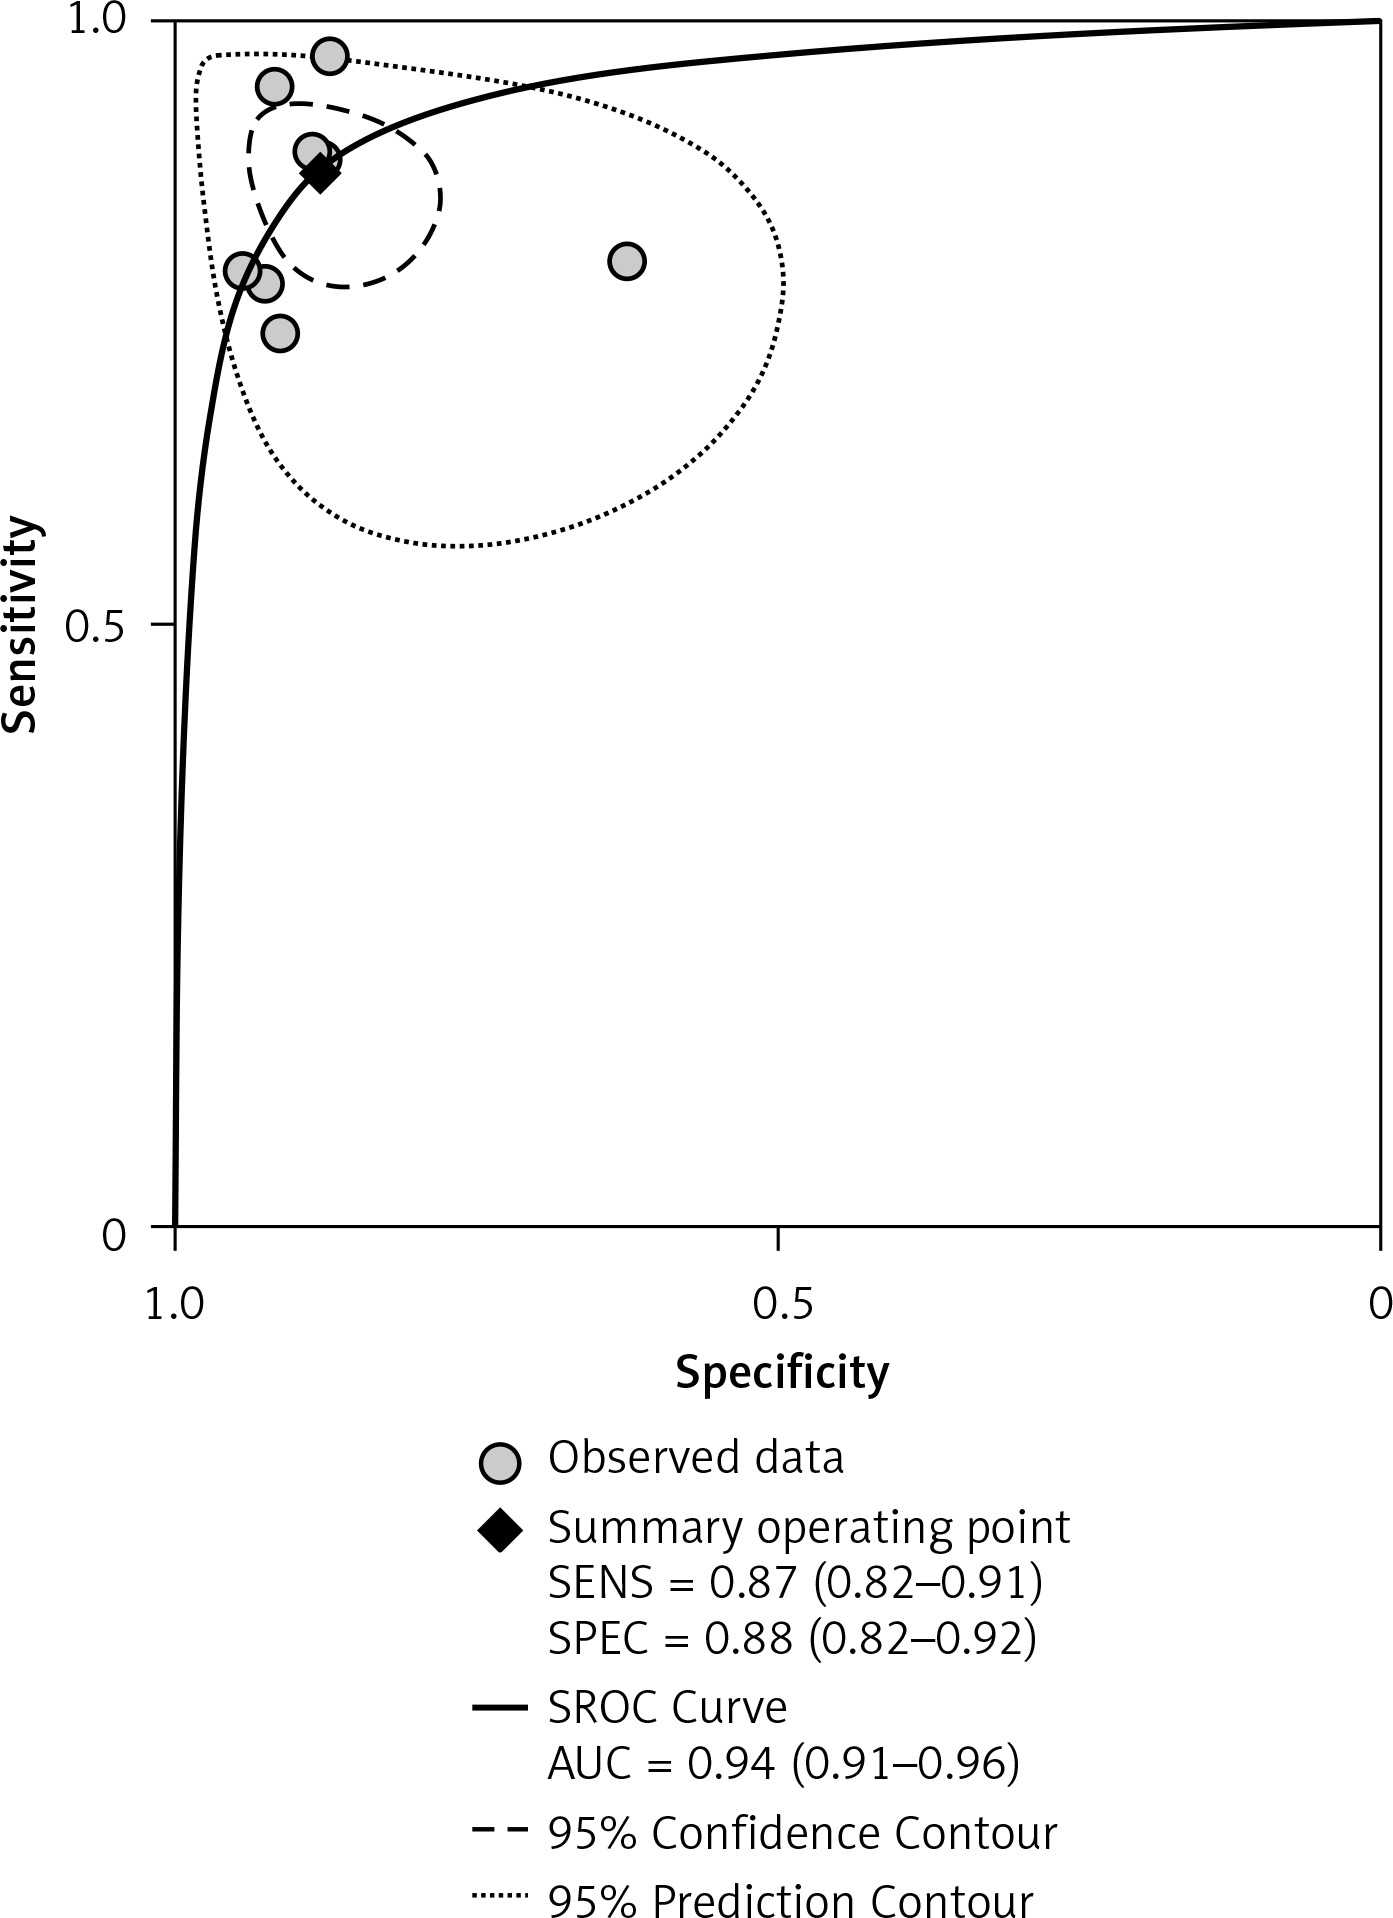
Diagnostic odds ratio and summary receiver operator curves
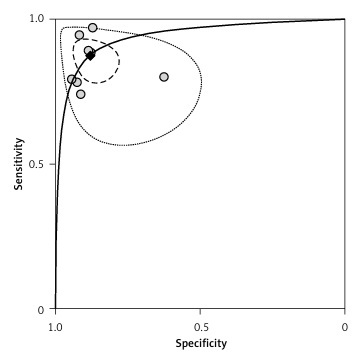
Diagnostic odds ratio (DOR) refers to the ratio of +LR to –LR, indicating the accuracy of the diagnostic test. The higher DOR is, the more accurate is the diagnostic test. The receiver operating characteristics (ROC) curve graphically presented the association between sensitivity and specificity. The closer the area under the ROC is to 1.0, the more accurate the diagnostic test will be. Summary receiver operator curve (SROC) refers to using one ROC curve to show the association between specificity and sensitivity obtained by a series of studies in a meta-analysis. The pooled DOR in our analysis was 50.69 (95% CI: 25.22–101.88), as shown in Figure 4. The SROC revealed an area under the curve (AUC) of 0.94 (95% CI: 0.91–0.96), as shown in Figure 5.
Sensitivity and publication bias analysis
Sensitivity analysis was conducted with bivariate boxplot (Supplementary Figure S3). The sensitivity analysis result showed that the study DeFACTO 2015 is a major source of heterogeneity. According to the result of publication bias analysis performed with Deeks’ funnel plot (p = 0.39), there was no significant publication bias, as shown in Supplementary Figure S4.
Discussion
In the last 20 years, FFR has gradually been recognized as standard functional assessment metrics, especially for critical lesions (diameter stenosis 30–70%) [24]. The DEFER study and FAME study confirmed that percutaneous coronary intervention guided by FFR can reduce medical costs and unnecessary re-revascularization [25, 26]. Usage of FFR for patients who have already been selected to perform PCI can reduce the number of stents needed to implant and improve the relative clinical effect [27–29]. However, its invasiveness and high cost limited its wide application. Seeking a non-invasive, economic, accurate alternative is necessary.
This meta-analysis showed that the diagnostic performance of wireless FFR has high sensitivity and specificity with pressure wire FFR as a reference in stable CAD patients. The pooled diagnostic accuracy of wireless FFR was high, with an AUC of 0.94 (95% CI: 0.66–0.94), and the high sensitivity and specificity confirm its good diagnostic performance. The high +LR (7.28 (95% CI: 4.78–11.08)), low –LR (0.14 (95% CI: 0.10–0.21)) and high DOR (50.69 (95% CI: 25.22–101.88)) provide strong evidence of the usefulness of wireless FFR in clinical practice. A recent published meta-analysis including 1842 vessels showed a pooled sensitivity of 89%, specificity of 90%, positive likelihood ratio of 9.3, negative likelihood ratio of 0.13, and summary area under ROC of 0.84 [30]. Our analysis result was consistent with this meta-analysis, suggesting that wireless FFR might be good to detect hemodynamically significant lesions.
Compared with pressure wire measured FFR, wireless FFR can reduce the risk of adverse events related to the invasive pressure wire application, such as vessel dissection and myocardial infarction [31, 32]. At the same time, wireless FFR can reduce the hospitalization costs by avoiding the use of pressure wire and the related adverse events.
The advantages of our analysis include the following: this is one of very few meta-analyses evaluating the accuracy of wireless FFR with invasive FFR as a reference; most updated clinical trials were included in our analysis; FFRCT, a new type of wireless FFR in which FFR was derived from the computed tomography angiography (CTA) was included; a threshold of 0.80 by pressure wire measurement of FFR was made.
Nevertheless, there were some limitations of our meta-analysis. Firstly, most of the included studies used wireless FFR in simple lesions; thus there is a lack of application in complex lesions such as CABG and calcified lesions. Secondly, different software of the wireless FFR used in different clinical trials may lead to heterogeneity between studies. Thirdly, we could not obtain data of individual patients to address some unresolved problems to make further analysis, such as the clinical performance in the uncertainty zone. In future, more rigorous, large-sample, high quality international trials are needed; several angiography-based methods have been developed to derive FFR [12, 15, 33, 34], so subgroup analysis based on various methods could be performed.
In conclusion, this meta-analysis indicates that the clinical performance such as accuracy, sensitivity and specificity of wireless FFR is good to detect stenotic lesions with pressure-wire measured FFR as a reference.