Introduction
Polycystic ovary syndrome (PCOS) is one of the most common endocrine disorders in women of reproductive age. Although the exact causes of PCOS are poorly understood, it is generally believed that the genetic background [1] exacerbated by lifestyle and environmental factors [2, 3] may indicate an individual’s predisposition to the development of this disorder. PCOS predominantly affects overweight/obese women and is frequently associated with metabolic syndrome and increased risk for infertility, cardiovascular disease, and endometrial cancer [4]. The exact worldwide PCOS prevalence is difficult to assess in epidemiological studies due to the clinical heterogeneity of this condition, the possible influence of age and ethnicity, the lack of a universal definition for PCOS, as well as the lack of studies comparing differences within and between ethnic groups across geographical regions. Currently, three groups have recommended the diagnostic criteria for PCOS [5–7]. Although there are certain consistencies among these criteria, some important differences exist which make the comparison of epidemiological studies on PCOS difficult [8]. Indeed, various studies have reported a worldwide prevalence of PCOS that ranges widely from 2% to 26% [9] depending on population, sample size, body mass index, and the diagnostic criteria. In the majority of European countries, the rates of PCOS are unknown. In some Western European countries the rates of PCOS determined in limited samples have ranged from 2.3% to 28% [10–14]. These data suggest possible geo-epidemiologic determinants for this condition.
The aim of the study was to provide the modeled estimates for trends in PCOS prevalence since 1990 in Europe. For this purpose, we analyzed the data from the Global Burden of Disease, Injuries and Risk Factors (GBD) Study 2016 [15] and extracted the national and regional estimates on PCOS prevalence in European females aged 15–49 years.
Material and methods
The GBD Study, funded by the Bill & Melinda Gates Foundation, is the largest systematic approach to describe the global distribution of a wide spectrum of major diseases, injuries, and health risk factors. This approach was designed to optimize the comparability of data collected by varying methods and sources or based on different case definitions as well as to find a consistent set of estimates between data for prevalence, incidence, and other measures. The GBD Study uses the health data collected from vital records, registries, censuses, health surveys, demographic surveillances, scientific research, administrative reports, and many other sources. They are then fed into algorithms that generate disease burden estimates. In the GBD Study, data for non-fatal outcomes for a disease are analyzed using the Bayesian meta-regression tool DisMod-MR 2.1 [16], which ensures consistency of epidemiological parameters for the conditions studied. Using the standard GBD results tool [17], from the GBD 2016 estimates we obtained the estimates for prevalence rates of PCOS for European females aged 15–49 years between 1990 and 2016. This tool provides access to a complete set of age and gender-specific estimates of burden across a wide range of causes. We analyzed the prevalence rates by country and three major European regions: Western (WE), Central (CE), and Eastern (EE). The WE region included Andorra, Austria, Belgium, Denmark, Finland, France, Germany, Greece, Iceland, Italy, Ireland, Luxembourg, Malta, the Netherlands, Norway, Portugal, Spain, Sweden, Switzerland, and the United Kingdom; CE included Albania, Bosnia and Herzegovina, Bulgaria, Croatia, the Czech Republic, Hungary, North Macedonia, Montenegro, Poland, Romania, Serbia, Slovakia, Slovenia, and Turkey; and EE included Belarus, Estonia, Kazakhstan, Latvia, Lithuania, Moldova, Russia, and Ukraine. The GBD Study uses the International Classification of Diseases (ICD-10 and ICD-9) in the extraction of hospital and claims data that are mapped to the 2016 GBD causes of death and non-fatal disease sequelae. PCOS was mapped to codes E28.2 (ICD-10) and 256.4 (ICD-9) [18]. Prevalence was expressed as the number of prevalent cases per 100,000 and the percent of total prevalent cases along with the 95% uncertainty interval (UI), which captures uncertainty from sampling, non-sampling error from the study designs or diagnostic methods, model parameter uncertainty, and uncertainty regarding model specification. The UIs were generated by taking 1,000 draws from the posterior distribution of each estimate, with upper and lower bounds determined by the 2.5th and 97.5th values of the draws as described elsewhere [19]. Rates of PCOS were analyzed for the following years: 1990, 1995, 2000, 2005, 2010, 2015, and 2016. The frequency distribution of PCOS rates was analyzed in the following 5-year age bands: 15–19, 20–24, 25–29, 30–34, 35–39, 40–44, and 45–49 years.
We used country-year estimates in our analyses and calculated the Socio-demographic Index (SDI) for each geography-year unit. The SDI, developed by GBD researchers [17], is a summary measure that identifies where countries or other geographic areas sit on the spectrum of development. Expressed on a scale of 0 to 1, the SDI is a composite average of the rankings of the incomes per capita, average educational attainment in the population older than 15 years, and fertility rates of all areas in the GBD Study. All GBD 2016 locations were assigned to SDI quintiles (Low SDI, Low-middle SDI, Middle SDI, High-middle SDI, and High SDI) based on their calculated SDI value in the year 2016 (Table I) [15, 17]. Spearman’s rank correlation was used to test the association between PCOS prevalence and SDI. Differences in the prevalence rates of PCOS between European countries with high, high-middle and middle SDIs were calculated using one-way ANOVA.
Table I
Socio-demographic Index quintile cutoffs
| SDI quintile | Lower bound | Upper bound |
|---|---|---|
| Low | 0 | 0.450402989 |
| Low-middle | 0.450402989 | 0.637800918 |
| Middle | 0.637800918 | 0.747342101 |
| High-middle | 0.747342101 | 0.849027407 |
| High | 0.849027407 | 1.0 |
The study utilized existing data from the GBD 2016 Study and did not require ethical approval. The GBD 2016 Study complies with the Guidelines for Accurate and Transparent Health Estimates Reporting (GATHER) recommendations [20] and additional information on modeling strategy, data sources, and visualization tools are available at www.healthdata.org.
Results
Polycystic ovary syndrome prevalence in 2016
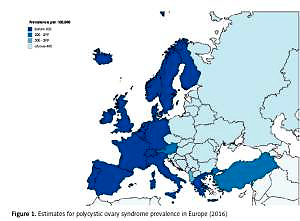
The estimates for 2016 PCOS prevalence in 42 European countries and three European regions are shown in Table II. In all Europe, the average prevalence was 276.4 cases per 100,000 (95% UI: 207.8–363.2). The prevalence varied markedly across both European countries and regions, with the highest rates in the Czech Republic (460.6 per 100,000; 95% UI: 346.2–602.1) and the lowest in Sweden (34.1 per 100,000; 95% UI: 24.59–45.77); relatively low rates were also seen in other Nordic countries (Finland, Norway, Iceland, and Denmark), Germany, and the UK. In general, the rates in CE and EE were more than three times higher than those in WE. They were relatively comparable among EE countries, ranging from 406.4 per 100,000 (0.41%) in Lithuania to 443.1 per 100,000 (0.45%) in Russia. Within CE, PCOS prevalence was lowest in Turkey and Albania (258.5 and 373.9 per 100,000, respectively), while in the majority of the remaining countries, the prevalence ranged between 420 and 440 per 100,000, except for the Czech Republic, which had the highest rates in all Europe. In WE, beside the Nordic countries, low rates of PCOS were also seen in Germany, the Netherlands and Andorra (between 115 and 120 cases per 100,000), while in Austria the prevalence was nearly two times higher (211.7 per 100,000). In the majority of WE countries (France, Ireland, Luxembourg, Malta, Portugal, and Switzerland), the rates were established at approximately 120–130 cases per 100,000 (Figure 1).
Table II
Prevalence of polycystic ovary syndrome in 2016 by European country and region for women aged 15–49 years
Trends in polycystic ovary syndrome prevalence between 1990 and 2016
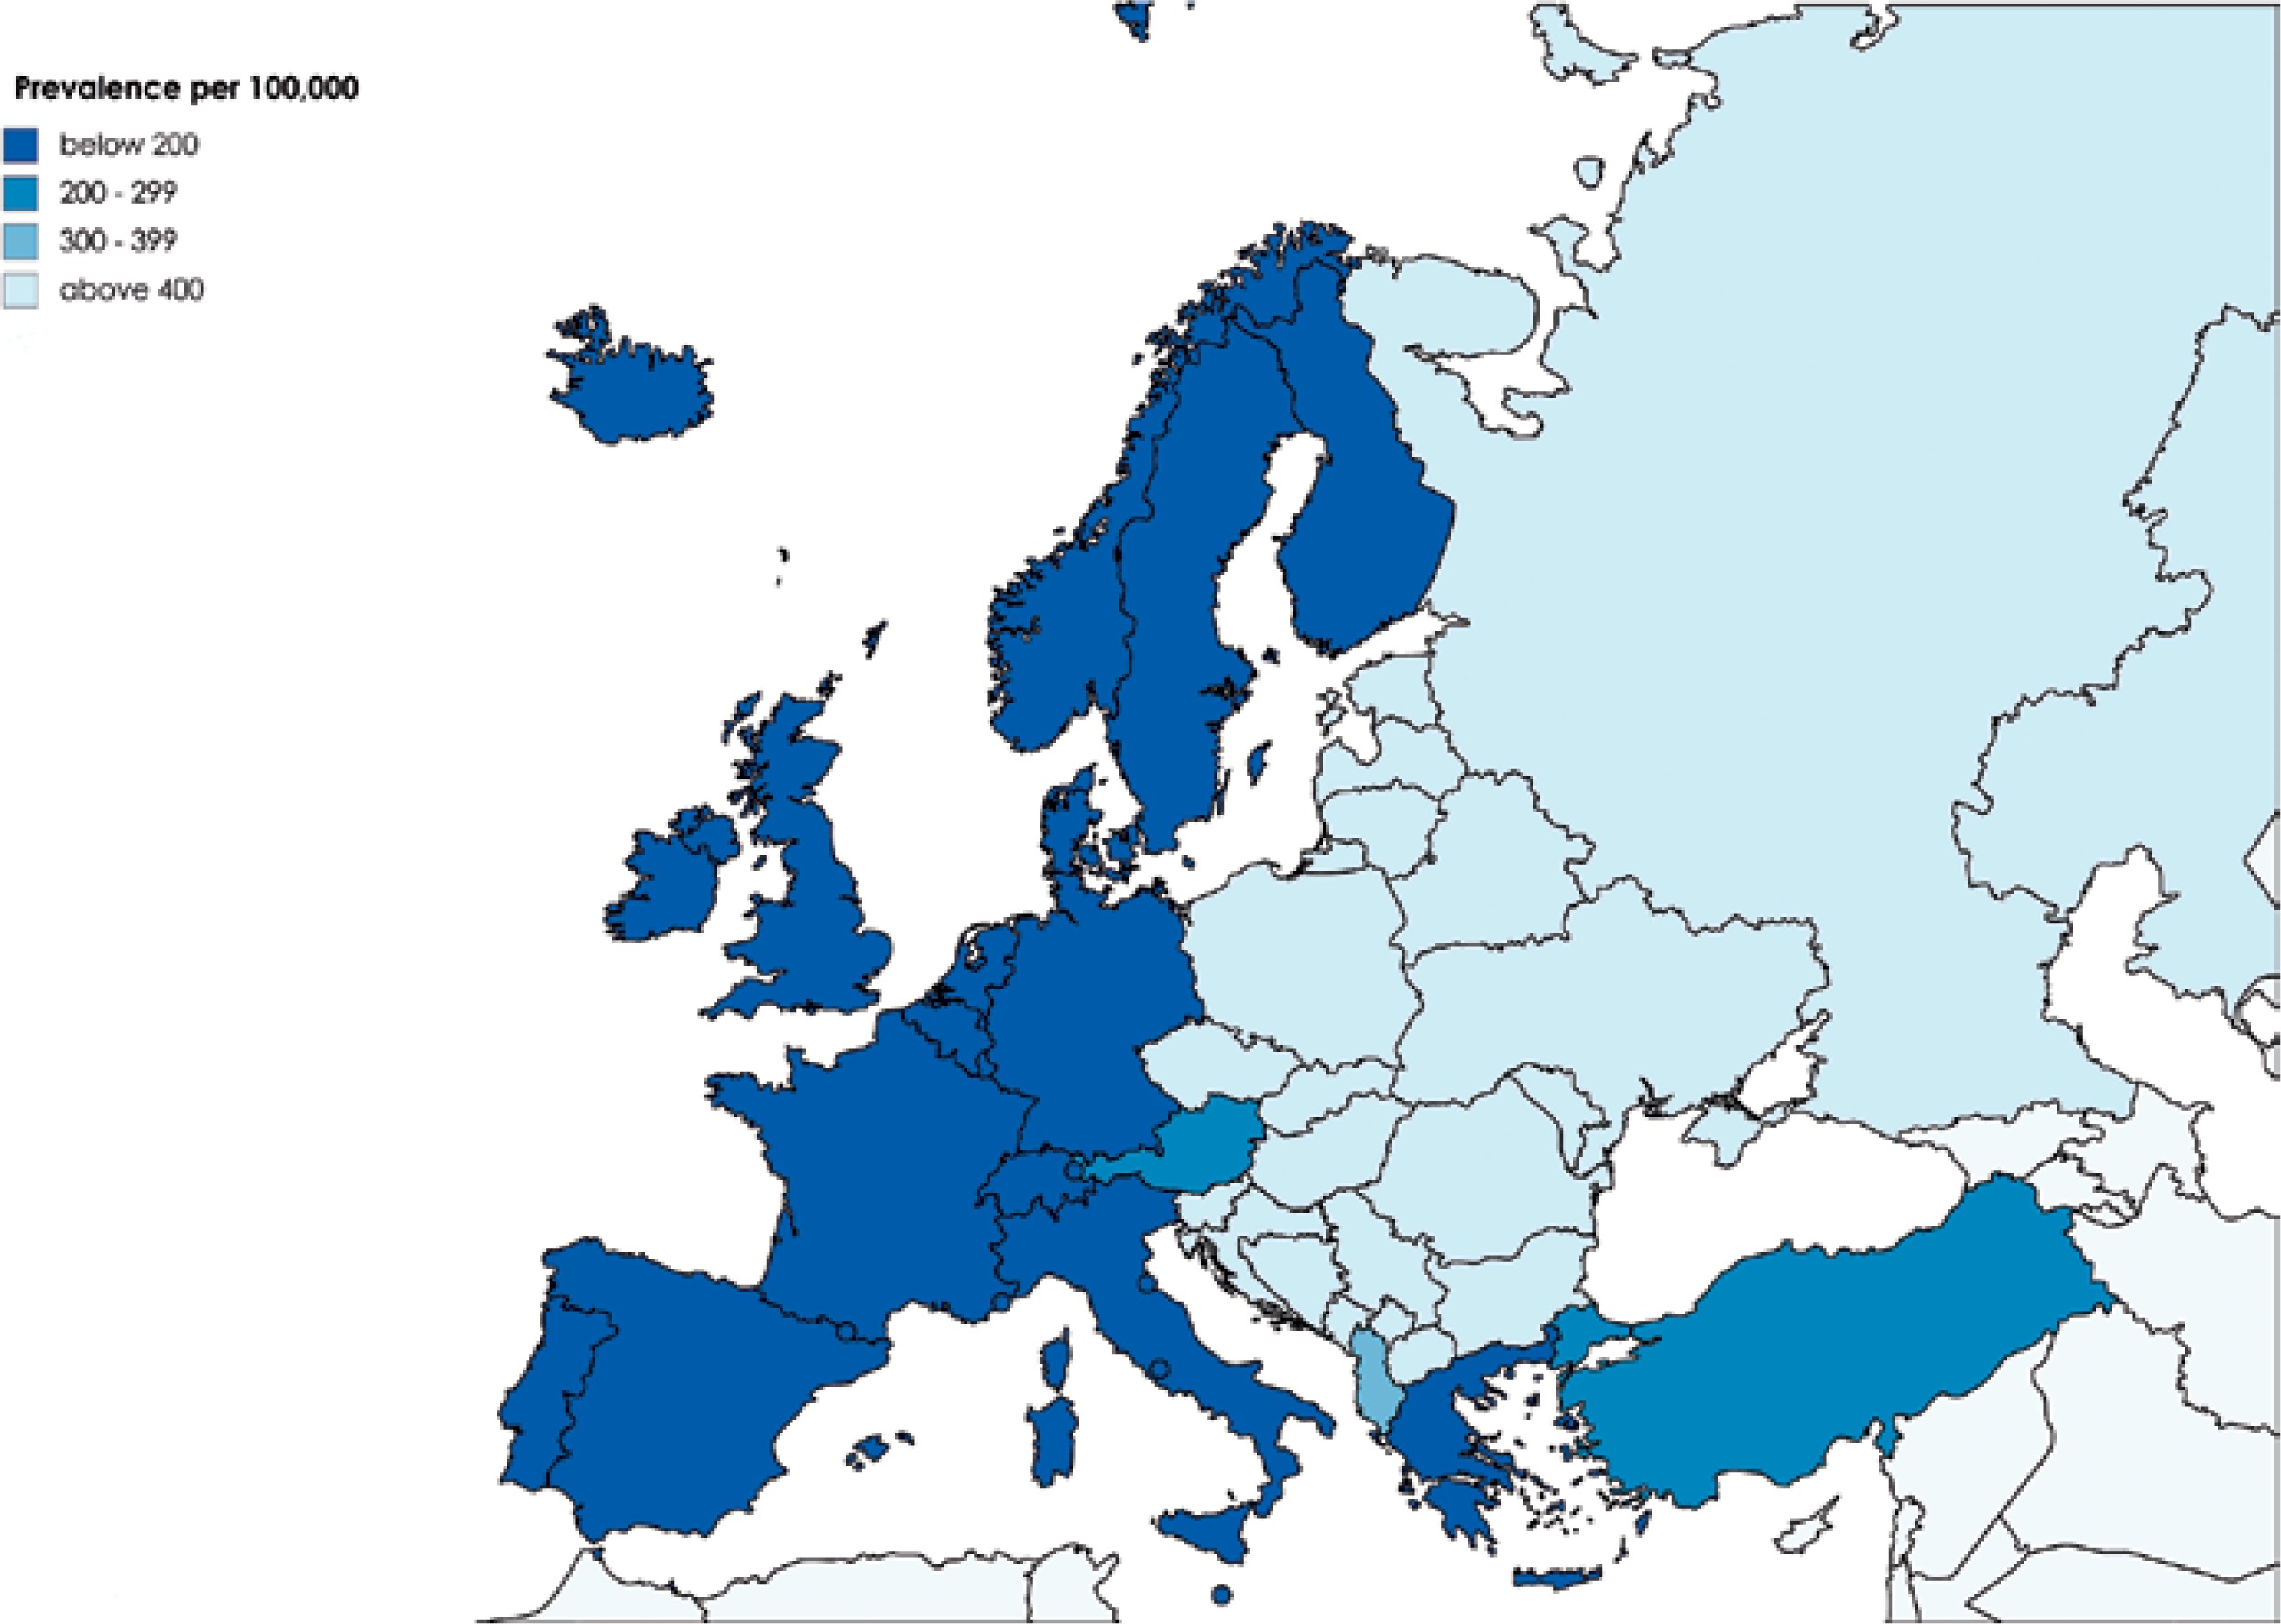
Between 1990 and 2016, the prevalence of PCOS across the whole of Europe and in three European regions was relatively stable (Figure 2). In comparison to 1990, in 2016 the mean rates in WE decreased slightly (by 3.26%; 95% UI: from –5.66 to –0.30), but in the same period they increased in CE and EE (by 3.34%; 95% UI: 1.72–5.19 and 1.6%; 95% UI: 0.5–2.81, respectively). However, among some individual countries, the rates were highly variable (Table III). Taking all European countries into consideration, the largest increases in PCOS prevalence from 1990 to 2016 were observed in Turkey (11.4%), the Czech Republic (9.6%), and Bulgaria (6.9%); in some other countries, in contrast, the rates decreased, especially in Sweden (–9.6%), the Netherlands (–6.2%), Germany (–5.8%), and Austria (–5.8%). This is illustrative of regional patterns of PCOS prevalence within Europe.
Figure 2
Trends in prevalence between 1990 and 2015 in Western (A), Eastern (B) and Central (C) Europe
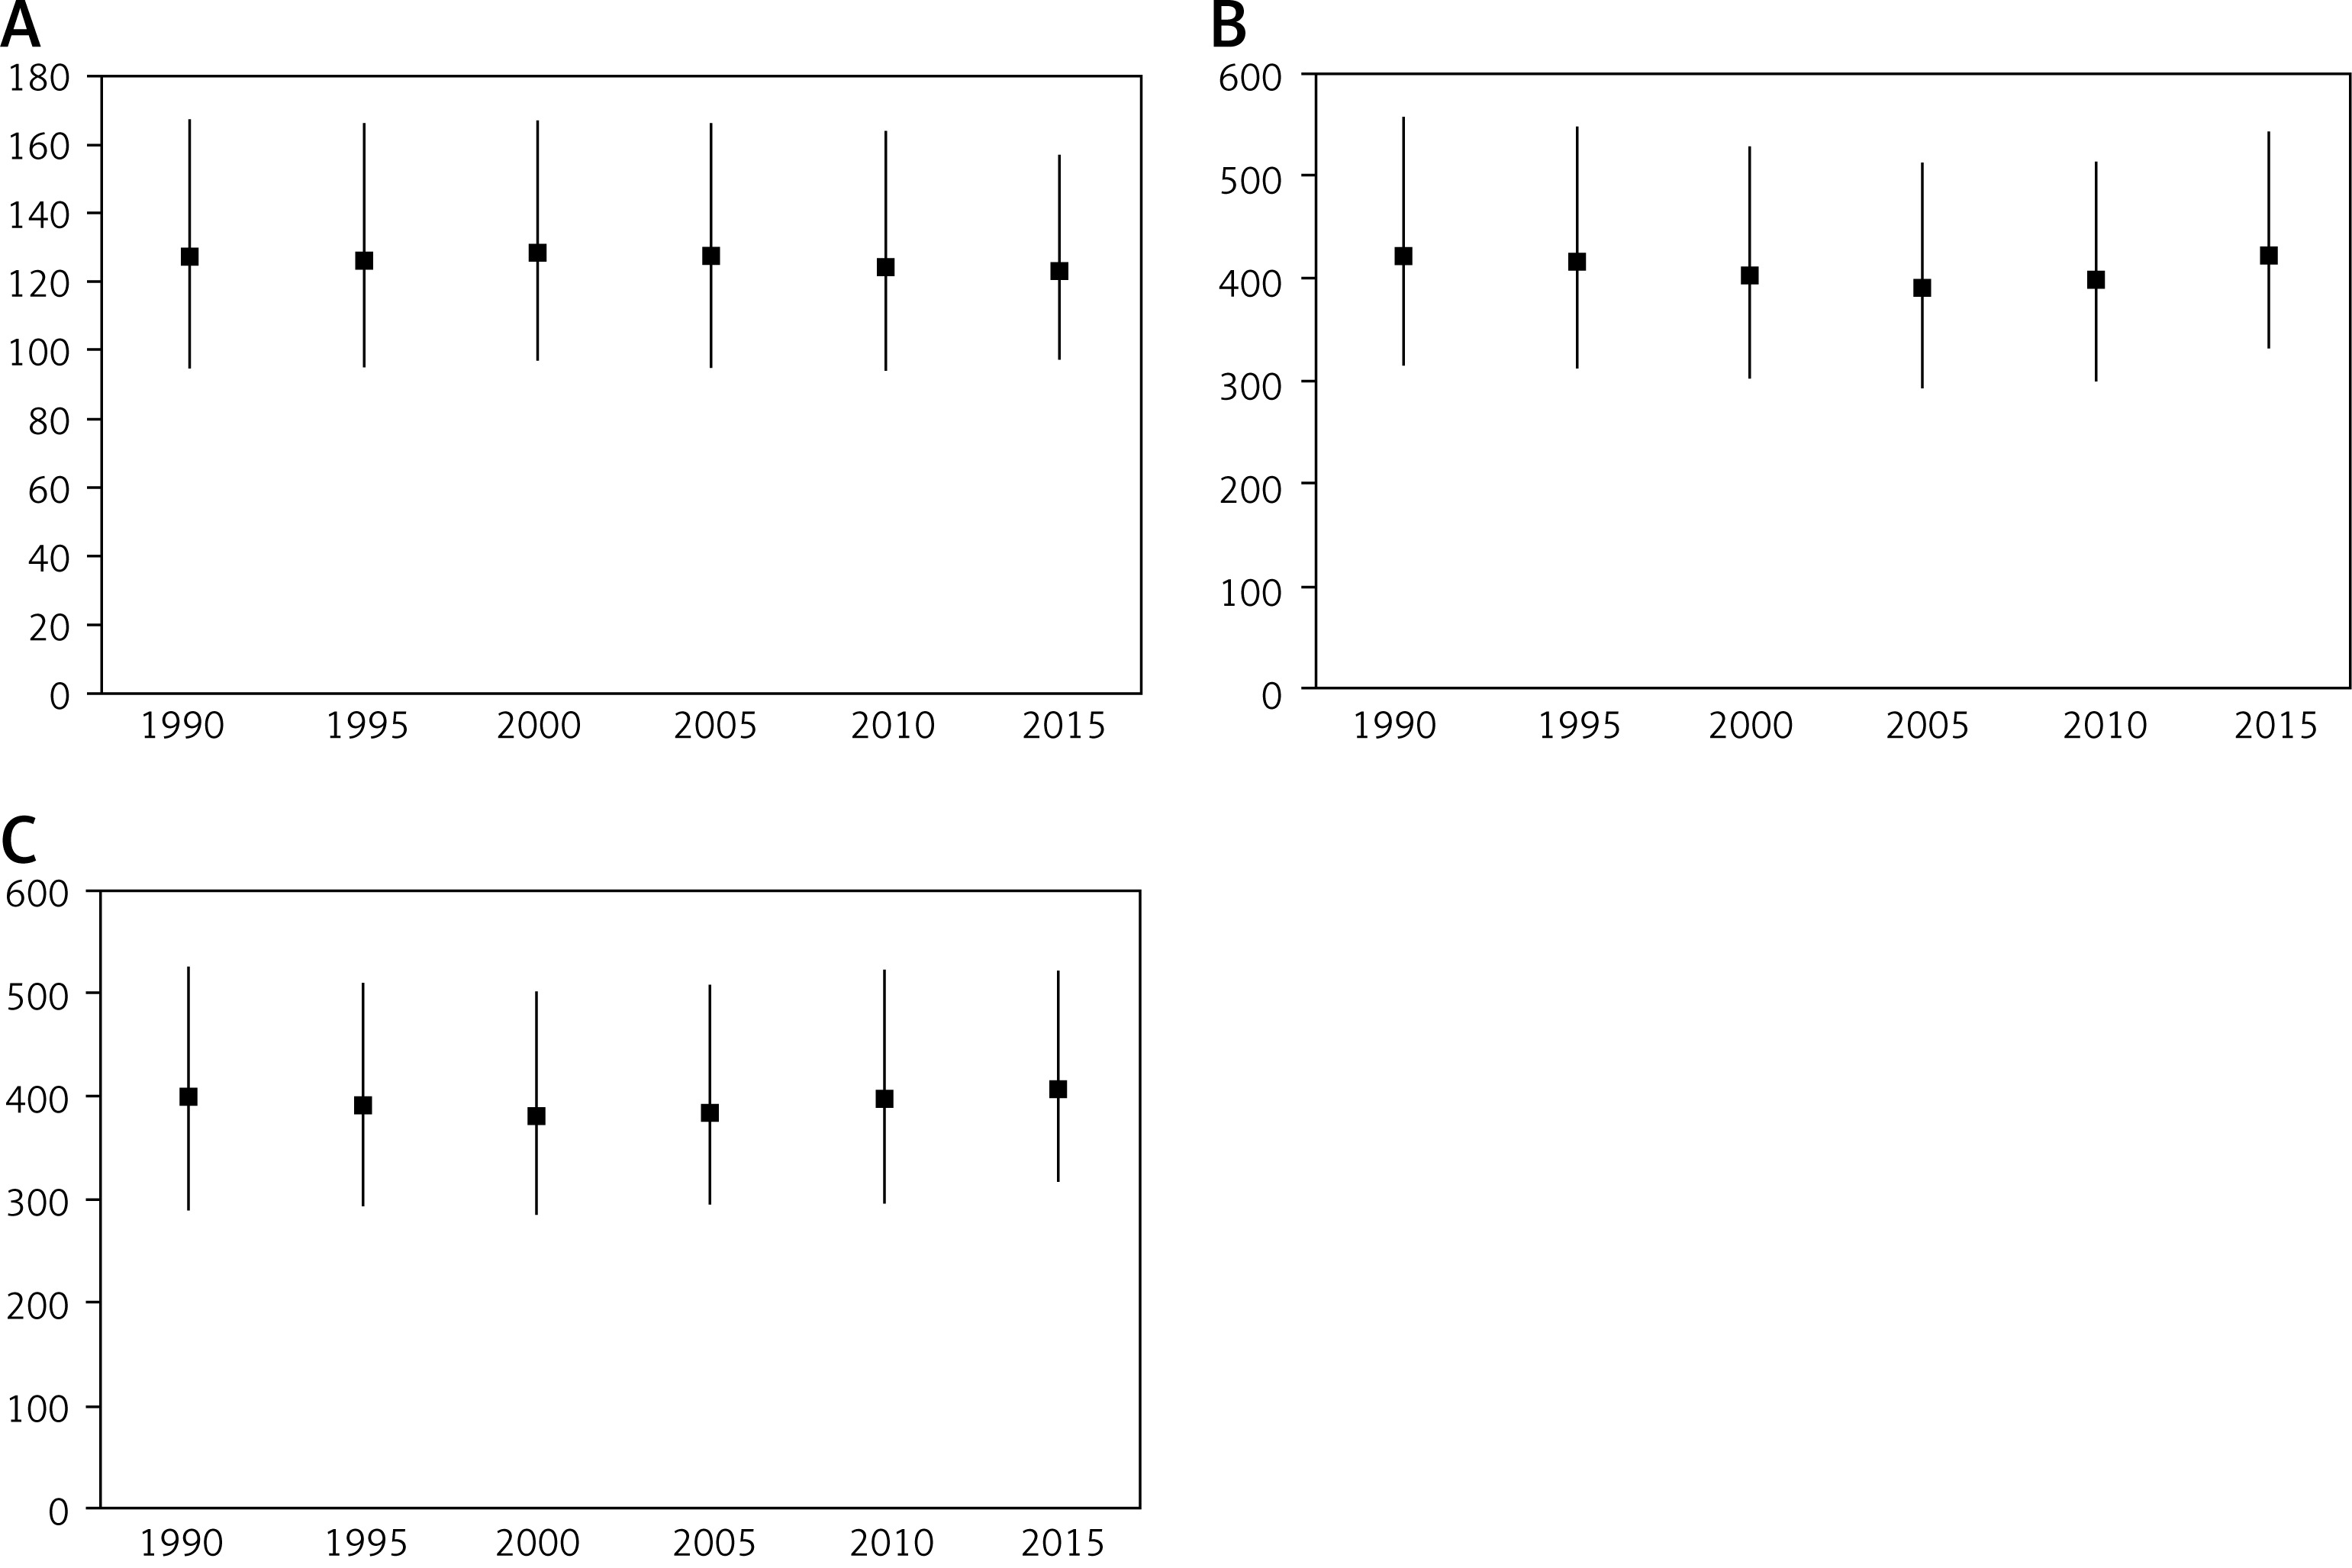
Table III
Changes in polycystic ovary syndrome prevalence in women aged 15–49 years between 1990 and 2016 by country and region
In the period 1990–2006, there were large decreases in the rates in Moldova (12.5%; 95% UI: from –15.2 to –10.1), Russia (12.3%; 95% UI: from –13.7 to –11.1), and Poland (9.3%; 95% UI: from –12.2 to –6.1). Interestingly, the same countries had the largest increases in rates in the next decade (from 2006–2016), by 15.8%, 14.9% and 14.6%, respectively. Similar changes from a decreasing to an increasing trend between 1990–2006 and 2006–2016 were also observed in Albania, Belarus, Bosnia and Herzegovina, Estonia and Ukraine. On the other hand, throughout the last decades, the rates of PCOS in the Czech Republic have increased.
Frequency distribution of polycystic ovary syndrome prevalence by age
There were large age-dependent differences in the prevalence of PCOS (Figure 3). Overall, across all three European regions, the prevalence showed a stepwise increase with age with the highest rates in women aged 35–39 and 40–44 years. The prevalence of PCOS was almost the same in EE and CE from age 20 years and above. Interestingly, in the youngest age group (15–19 years), quite a few females developed this condition (97.83 per 100,000; 95% UI: 60.78–153.6). In this age group, in the period 1990–2016 the number of PCOS prevalent cases increased in EE by 0.73% (95% UI: from –0.18 to 1.83) and CE by 1.87% (95% UI: 0.42–3.68), while it decreased in WE (by 1.30%; 95% UI: from –4.65 to 2.64).
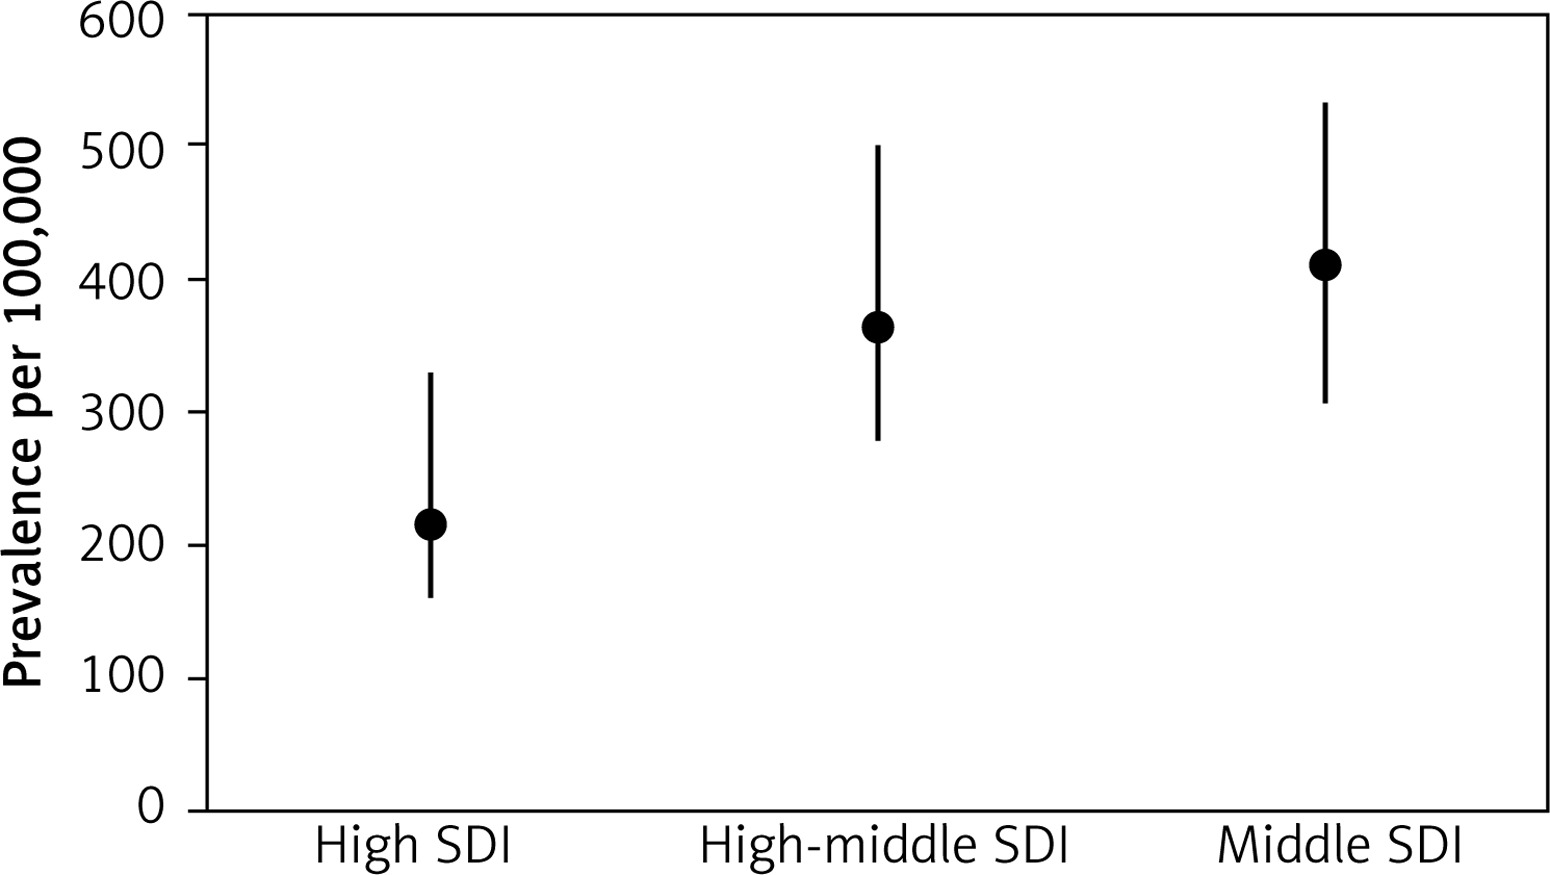
Polycystic ovary syndrome prevalence by SDI
The estimates for 2016 SDI in European countries are shown in Table IV. Within WE, all countries, except Portugal and Spain, were assigned to the highest SDI quintile. Among CE, SDIs were highly variable, ranging from a high (Croatia, Czech Republic, Poland, Slovakia, and Slovenia) to middle SDI (Albania and Bosnia and Herzegovina). Likewise, within EE, some countries were assign https://doi.org/10.5114/aoms.2019.87112 ed to a high, high- middle, or middle SDIs. For all European countries, a moderate, negative correlation (R = –0.539, p = 0.0002) between SDI and PCOS prevalence was found. There was also a significant difference (p = 0.002) in the PCOS prevalence between countries with high, high-middle, and middle SDIs (Figure 4). This is illustrative of a connection between SDI and the prevalence of PCOS across the various countries and regions of Europe reported in the GBD Study.
Table IV
Socio-demographic Index (SDI) 2016 in European countries
Discussion
In this study, we report for the first time the national and regional modeled PCOS prevalence rates in European females of reproductive age. In 2016, there were great differences in PCOS prevalence rates across Europe, with the lowest rates in Sweden and the highest in the Czech Republic (34.1 and 460.6 per 100,000, respectively). Aside from the differences between individual countries, there were also interregional differences. Although in CE and EE the rates were comparable, they were more than three times higher than in WE. In addition, within each of the three European regions, PCOS prevalence also differed. Between the years 1990 and 2016, there were similar interregional variations in prevalence, although throughout this period, the overall trends in WE, EE and CE were relatively stable, with only a slight tendency to decrease (WE) or increase (EE and CE). These differences by country and region suggest a possible influence of environmental or genetic factors. Among environmental factors, low childhood socioeconomic status (SES) has been shown to be associated with negative overall health behaviors that can lead to weight gain [20], changes in hormonal milieu, or increased genetic susceptibility to PCOS symptoms [2, 21]. Low SES may also reduce access to health care, thereby leading to decreased management and treatment of the condition [2]. Another potential pathway linking SES to the risk of PCOS may be the association between low SES-related intrauterine nutritional restriction and the tendency towards small-for-gestational age at delivery, which some researchers have proposed as one of the initiating factors for fetal programming toward the development of thrifty PCOS phenotype [2, 22–25] and PCOS-associated metabolic abnormalities in adulthood [26–28], similar to human in utero exposure to androgen access or experimental neonatal exposure to estrogen valerate [29]. However, the association of low SES with the risk of PCOS seems to be more complex, as some studies have demonstrated that low childhood SES (measured by low parental education) increased the risk of PCOS but that this risk was limited only to those who personally attained a high level of education [22]. Our study has demonstrated a moderate negative association between PCOS prevalence and SDI, suggesting that with higher income per capita, higher educational attainment and a lower total fertility rate, the rates of PCOS decrease. However, although during the period 1990–2016 there were obvious differences in income and to a lesser extent in education and occupation between WE, EE and CE, it seems unlikely that SES alone can explain the threefold difference in PCOS prevalence between WE and the two other regions, and the higher intraregional variations (for example, a six-fold difference between Austria and Sweden) observed in our study. It cannot be excluded that differences in the education of general practitioners in reimbursement of diagnosis and care expenses for this condition might also play a role. Additionally, during this period CE and EE have had more pronounced changes in education and employment as well as SES, while PCOS prevalence remained stable in both the whole of Europe and the three European regions, thus suggesting a role of genetic determinants in this disorder. The growing list of candidate genes that have been implicated in PCOS pathogenesis have revealed relatively homogeneous genetic underpinnings for this syndrome despite its heterogeneous clinical manifestation [30, 31]. In addition, genome-wide association studies (GWASs) identified and replicated several loci which contained promising candidates for PCOS risk genes [32–36], strongly suggesting shared common genetic susceptibility factors for PCOS [37–39]. However, it seems unlikely that differences in the PCOS prevalence found in our study could be explained solely by the different distribution across Europe of allelic variants associated with the odds for PCOS identified by GWASs, such as the difference in rates between Sweden and other Nordic countries, or the highly variable overall trends during the past three decades observed in some countries. Further genetic and epigenetic studies are needed to elucidate the findings from this study.
We found that PCOS prevalence in Europe steeply increased with age, with the highest rates in women aged 35–39 years and 40–44 years across all countries and regions. This finding might reflect the increase in the rates of obesity and overweight/obesity-associated insulin resistance, which have been regarded as risk factors for PCOS [2, 8, 10, 39, 40]. However, in the youngest age group, 15–19 years, quite a few adolescent females also had PCOS (97.83 per 100,000; 95% UI: 60.78–153.6). Hence, this age group is an important target for early detection and treatment of PCOS, especially in EE and CE, in which the number of cases has continuously increased.
When interpreting our results, some limitations should be considered. Aside from the GBD 2016 study overall limitations that were discussed elsewhere [15], PCOS, which is a heterogeneous disorder and is furthermore diagnosed by various criteria, was mapped to the same single ICD code. This can be a source of misclassification both for this condition and its components. Second, the term “prevalence” used in this study refers to modeled estimates for an area in the defined time, and not to measured events; hence, the cross-sectional studies performed on samples of European females may provide different rates. The GBD Study, in contrast to pooled analyses of the results from epidemiological studies, uses available data from many sources, and provides trends in measures over time based on state-of-the-art modeling methods. Such an approach may be especially useful in quantifying the sequelae of a broad spectrum of conditions, such as PCOS, the rates of which are difficult to estimate in cross-sectional studies, for example due to inconsistent definition.
In conclusion, we found highly variable national and regional prevalence rates for PCOS in Europe, which seem to be partially associated with differences in SDI across countries and regions. The negative association between SDI and PCOS prevalence indicates that socio-demographic development status has an impact on women’s health within Europe. Between 1990 and 2016, the rates in WE, EE and CE countries were relatively stable, but they showed marked differences between individual countries, thus suggesting that geographically unequal health and economic burdens are caused by this disorder in Europe. Our estimates encourage the search at the population level for new environmental and genetic determinants of PCOS, as well as a more nuanced engagement with diagnosis, treatment, and care.