Introduction
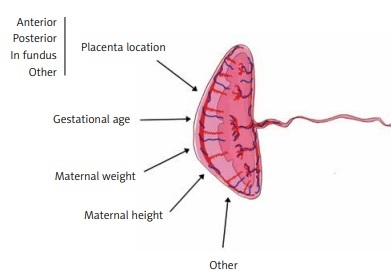
Placental features describing its wellbeing are among the crucial factors influencing pregnancy outcomes. Placental morphology, implantation site, and thickness are a few such features that may be assessed during prenatal ultrasound examination [1, 2]. Placental thickness (PTh) seems to be the easiest placental measurement, which can be taken during ultrasound examination; however, its interpretation is more complex [3]. It was previously proven that an abnormally thin or thick placenta leads to an increased prevalence of perinatal morbidity and mortality. In the year 1985, a placenta thicker than 4 cm was considered to be abnormal and was associated with worse pregnancy outcomes [4]. Various studies reported that factors like maternal body mass index (BMI) or placental implantation site significantly influence placental morphology and the cut-off value for PTh nomograms [3, 5, 6]. There are also several studies that associated PTh with neonatal outcome [1], neonatal birth weight [7], neonatal hypotrophy, risk of maternal preeclampsia, and other complications [8, 9] (Figure 1).
Aim
We aimed to determine the factors influencing PTh. Deeper insight into this topic may facilitate appropriate PTh interpretation.
Material and methods
We retrospectively analysed the results of the first foetal ECHO examinations of 2833 foetuses, performed between June 2016 and December 2019 at our unit. We enrolled 596 foetuses older than 12 weeks of gestation in the study. Only singleton healthy foetuses delivered at term (according to the last menstrual period (LMP)) in our hospital and discharged within 3–4 days were included in the study. Exclusion criteria were as follows: gestational diabetes, hydrops fetalis or any other foetal cardiac or extracardiac anomalies, difference between gestational age based on LMP and foetal biometry (FB) > 10 days, amniotic fluid index < 8 cm or > 22 cm, and premature delivery (< 37 weeks of gestation).
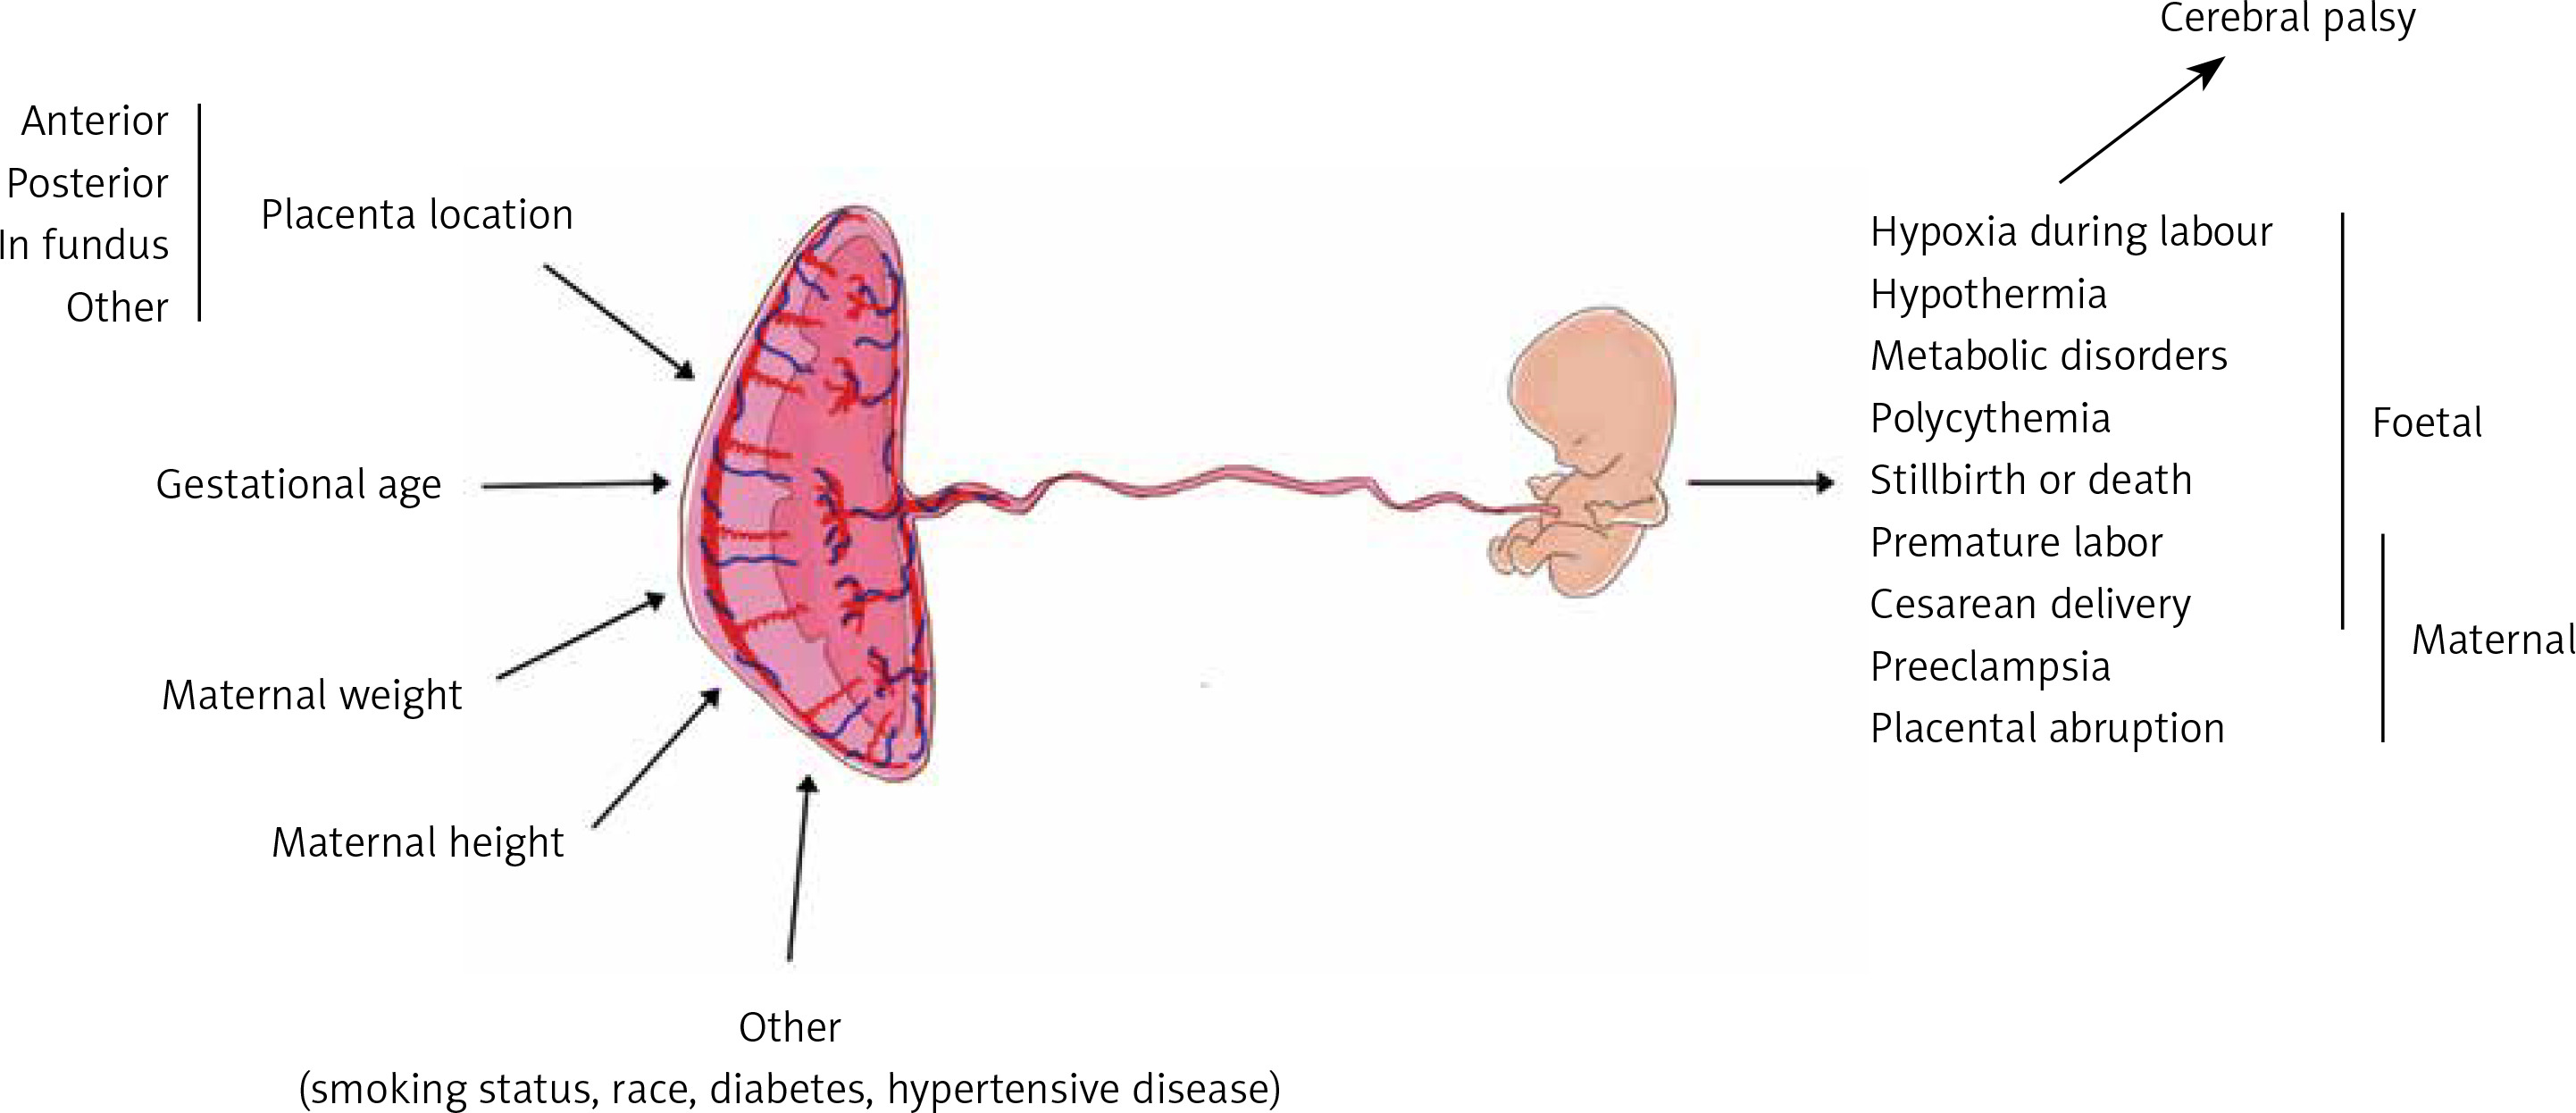
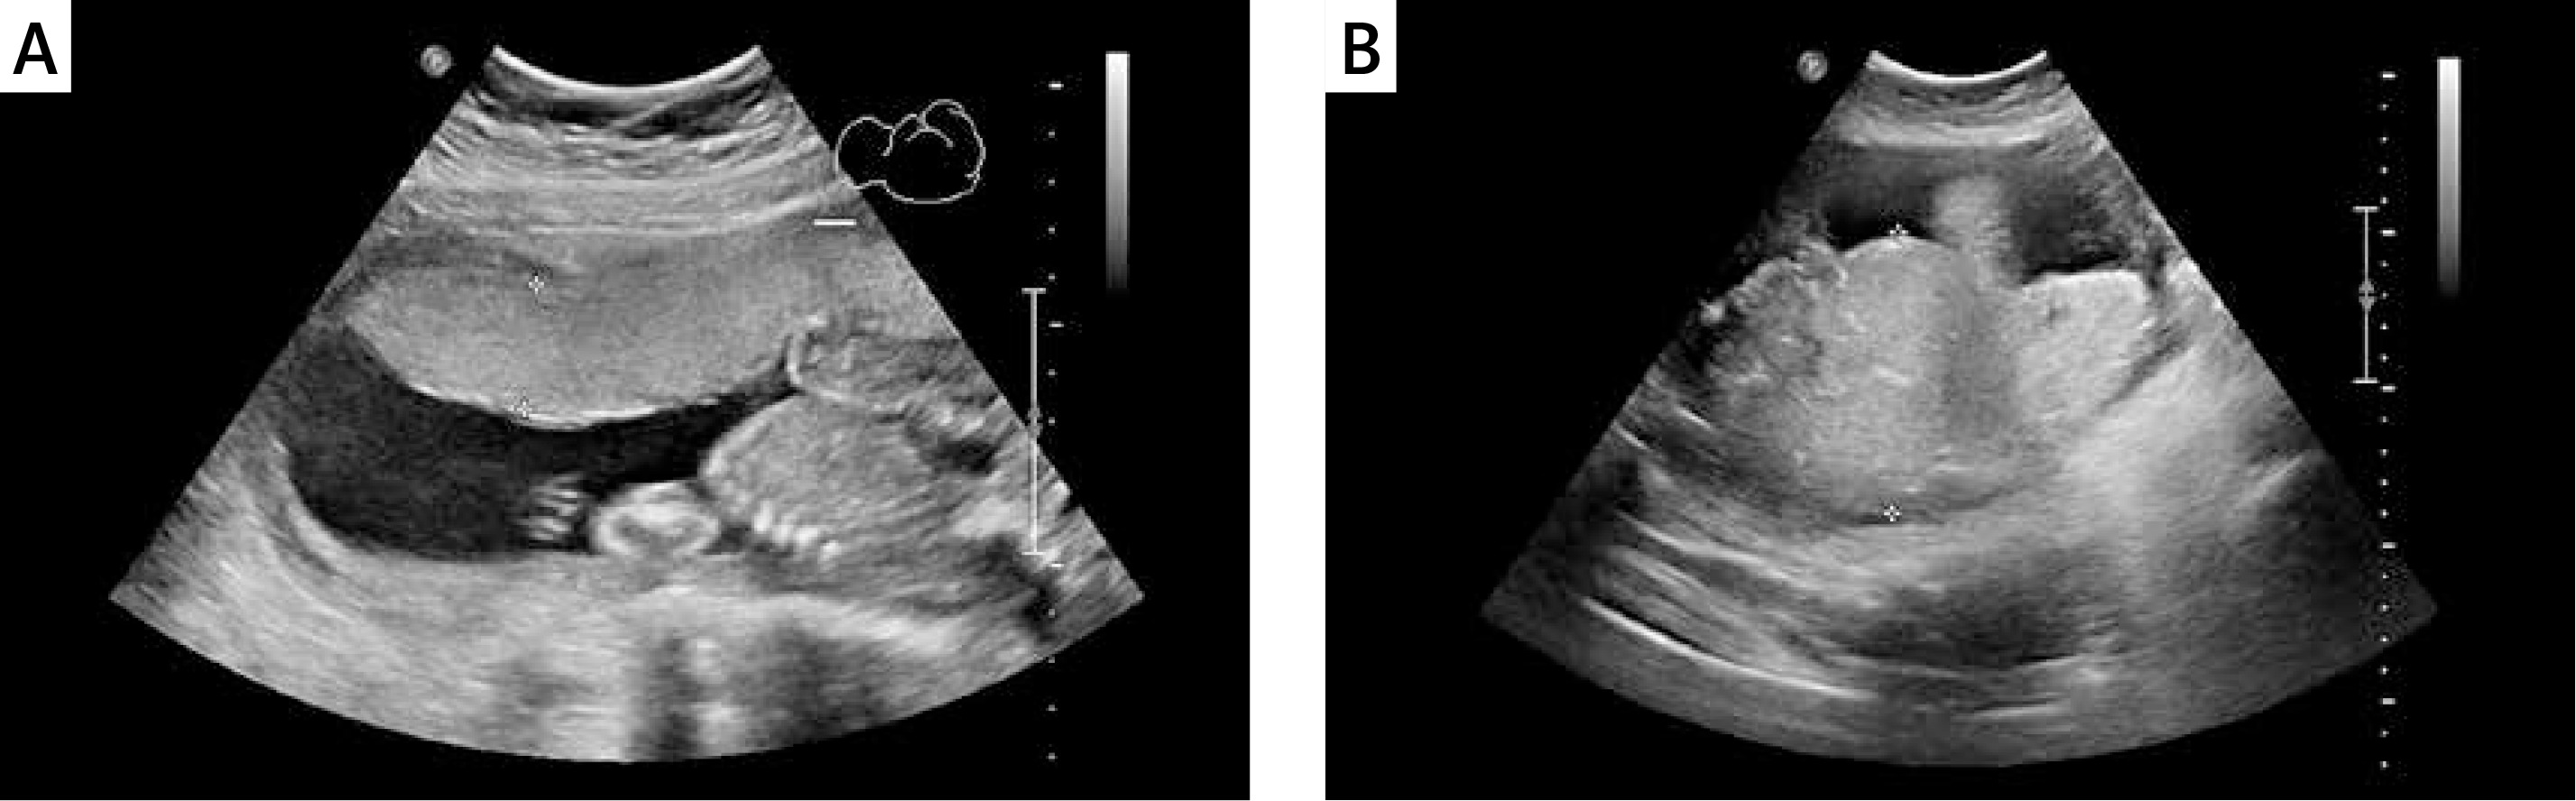
The following parameters were evaluated: placental implantation site, PTh, gestational age (GA) according to LMP and FB, and maternal weight, height, and BMI at the time of examination. PTh was measured perpendicularly to the chorionic plate in its largest dimension (Figure 2). The measurements were taken by 4 professionals, experienced in prenatal diagnostics from the same single unit. All physicians in our team performed the ultrasound examinations in a unified manner, and of each exam was stored digitally [10].
Figure 2
Placental thickness measurement technique during ultrasound examination. A – Placental thickness within normal limits, despite maternal body weight 111 kg. B – Increased placental thickness and maternal body weight of 91.5 kg (BMI 34 kg/m2). Difficult standardization of measurement due to significantly increased placental thickness
Statistical analysis
All the results were validated and accepted by the head of our Department on a daily or weekly basis. None of the aforementioned parameters had a normal distribution; therefore, we used proper nonparametric tests available in Statistica 13.1 PL (StatSoft, Tulsa, USA) and presented the data as median with interquartile range (IQR). Written consent to use and process the medical data was obtained from all included patients.
Results
Clinical group characterization
The median maternal age was 31 years (IQR: 27–35 years). The patients visited our department at a median gestational age of 25 weeks (IQR: 21.3–28.4 weeks) according to LMP. Anterior placenta was found in 328 (55%) pregnant women, whereas 250 (42%) had posterior placenta. Nine (1.5%) placentas were found in fundus of the uterus, and 9 (1.5%) had another location. All placentas had appropriate vascularity according to the ultrasound examination: normal foetal biometry and normal Doppler blood flow in umbilical arteries and vein. The median PTh was 30 mm (IQR: 25–38 mm).
Parameters affecting placental thickness
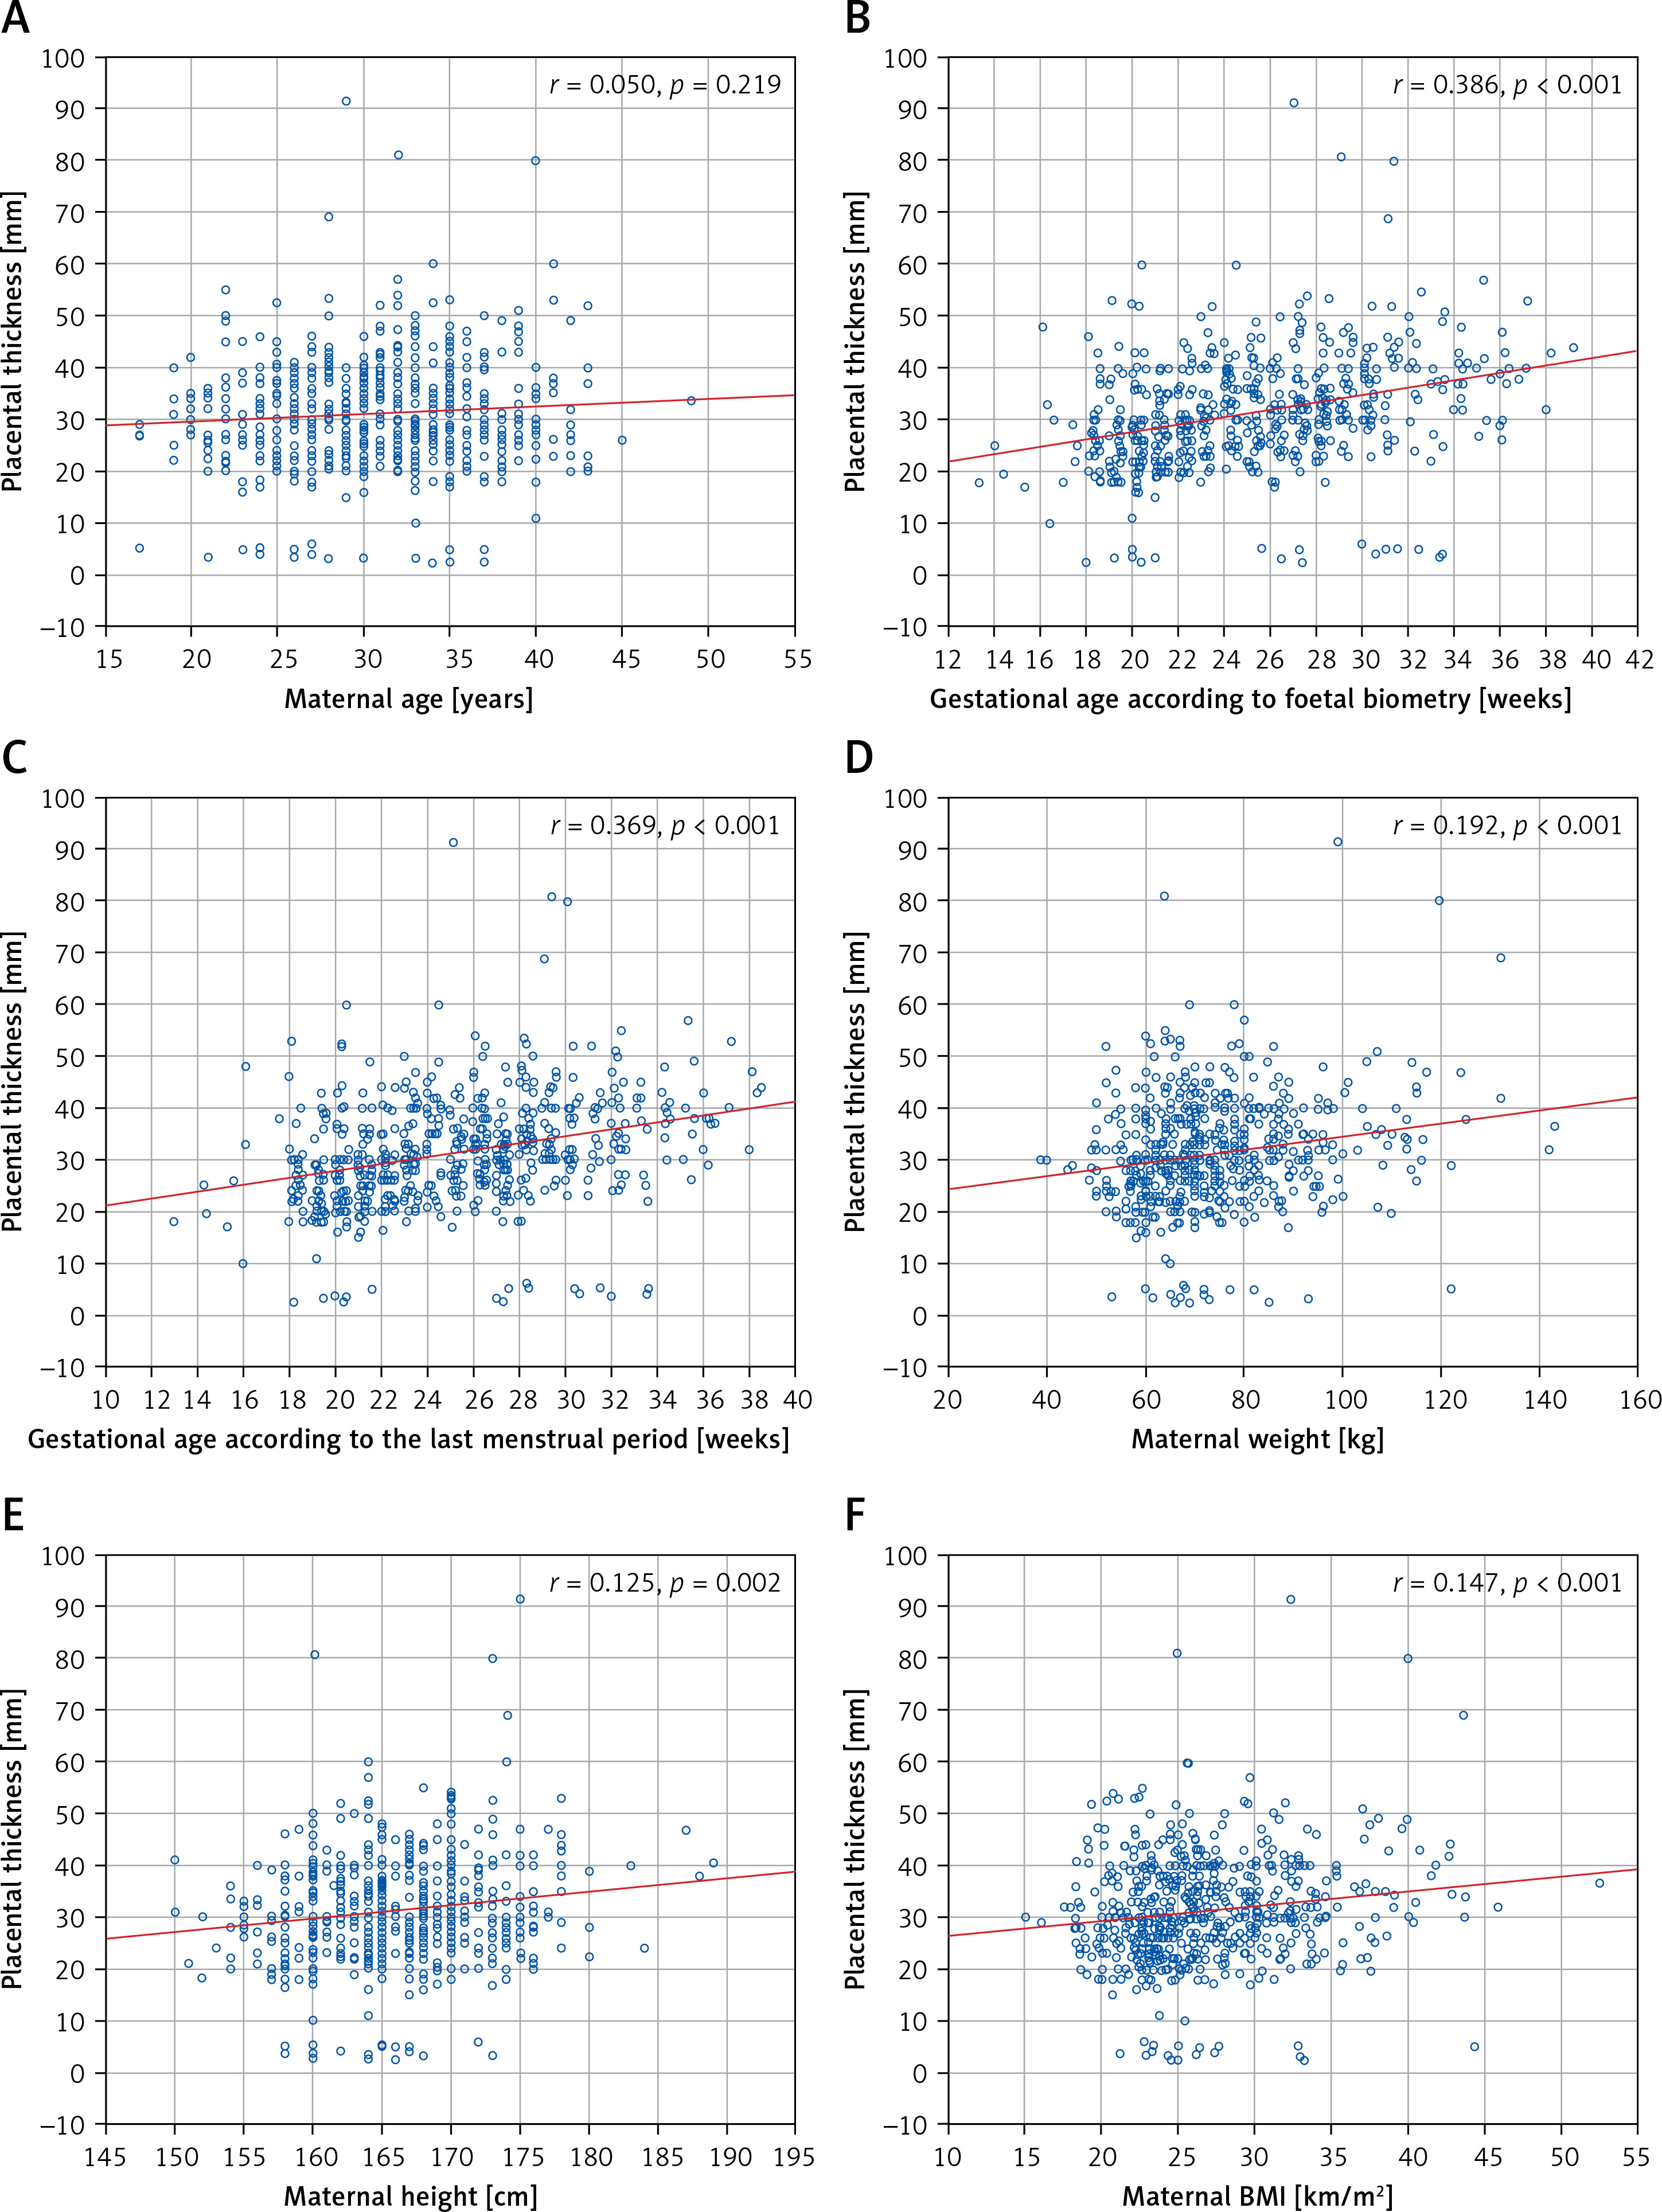
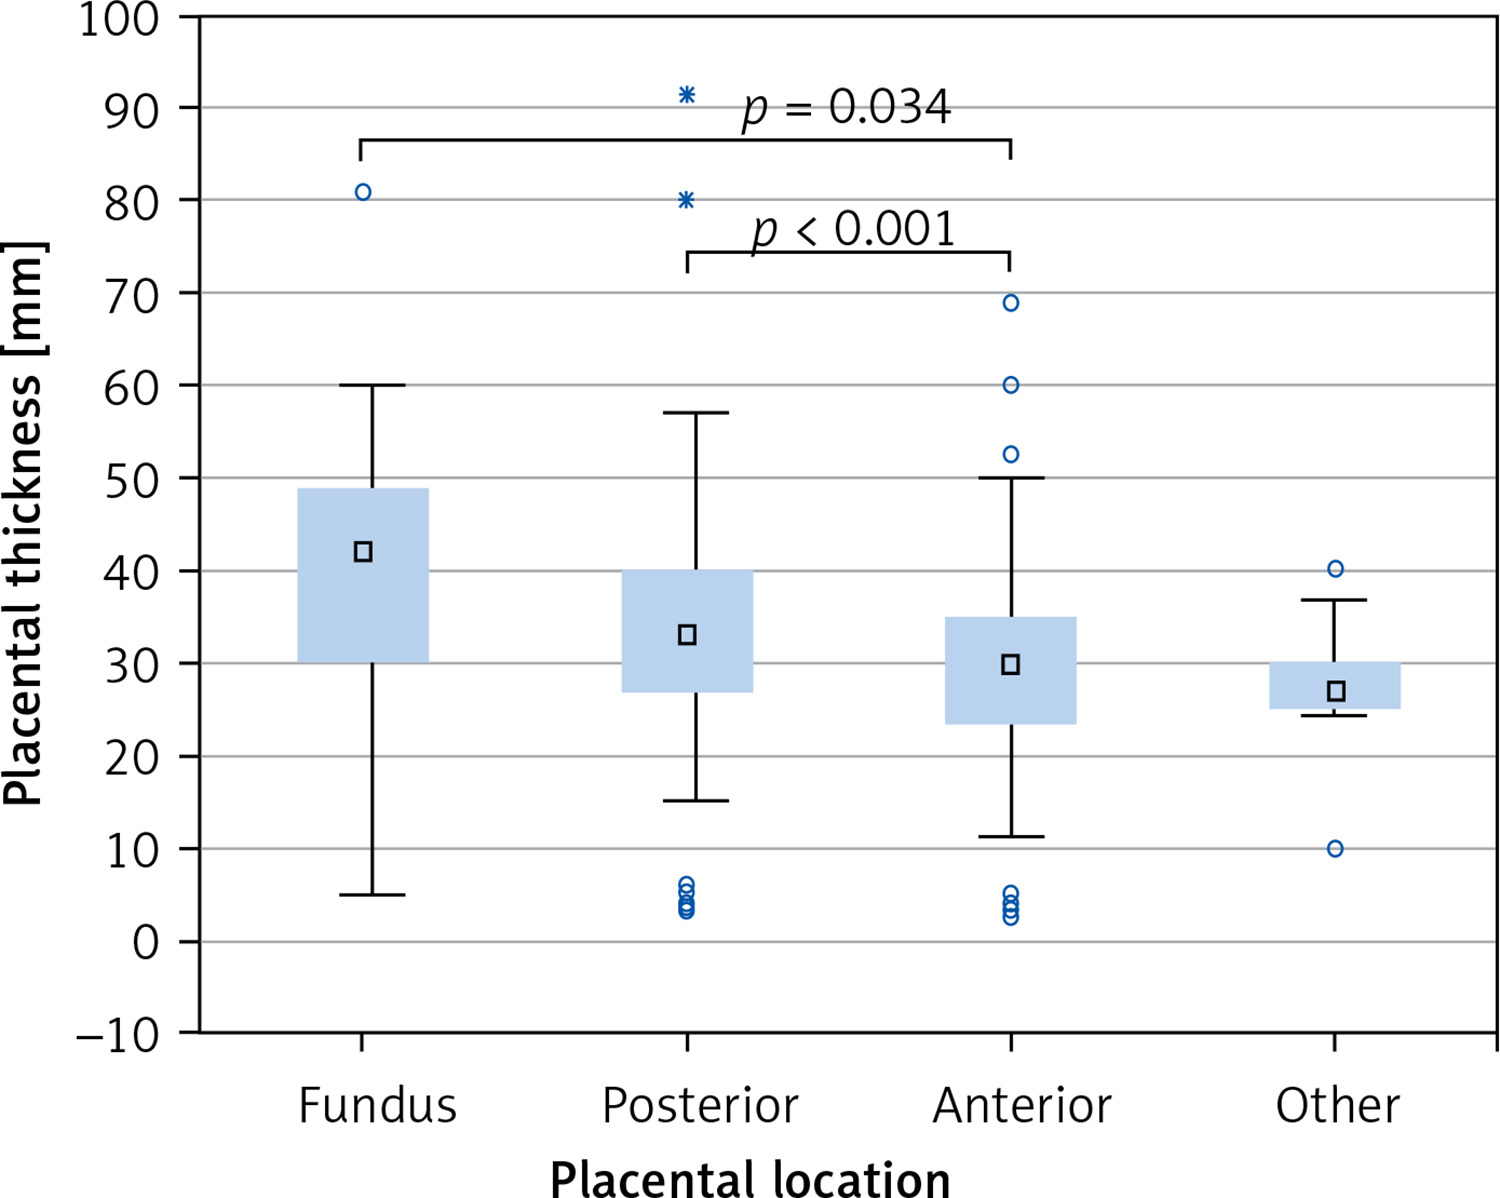
PTh significantly correlated with gestational age according to both FB (r = 0.386, p < 0.001, Figure 3 B) and LMP (r = 0.369, p < 0.001, Figure 3 C); maternal weight (r = 0.192, p < 0.001, Figure 3 D), height (r = 0.125, p = 0.002, Figure 3 E), and BMI (r = 0.147, p < 0.001, Figure 3 F), but not with maternal age (r = 0.050, p = 0.219, Figure 3 A). Placental location significantly affected its thickness (p < 0.001, Kruskal-Wallis test) (Figure 4). The median PTh was 42 mm (IQR: 30–49 mm) for placentas located in the fundus of the uterus, 33 mm (IQR: 26.8–40 mm) for posterior placentas, 30 mm (IQR: 23.7–35 mm) for anterior placentas, and 27 mm (IQR: 25–30 mm) for placentas placed in other locations. Significant dependencies were observed between posterior and anterior placentas (p < 0.001, UMW) as well as between anterior placentas and those localized in the fundus (p = 0.034).
Discussion
During routine ultrasound examination it is possible to assess various information about foetal and placental parameters. Obstetricians and sonographers are aware of the importance of analysing the placental location, especially its lower segment [11], and about the possibilities of placenta accreta spectrum – placenta creta, increta, and percreta [12]. As well as the placental location, PTh is another feature that can be assessed almost effortlessly during ultrasound examination. PTh measurement is a simple and widely used technique that may provide specialists with substantial knowledge. Despite the fact that placentas and PTh are being broadly investigated, specific maternal factors affecting this parameter have not yet been assessed in numerous groups of pregnant women [13–16].
In our study, we focused only on PTh because it is a very simple method and does not extend the time of examination. Moreover, PTh measurement did not require sophisticated software like, for instance, in the case of 3D reconstruction. We tried to analyse how particular parameters (FB, MA, LMP, mother’s BMI, mother’s body weight, and mother’s height) affect the PTh value, in order to assess which factors have a significant influence on PTh and how they affect PTh interpretation. Due to the retrospective character of the study, not all the possible factors influencing foetal homeostasis, such as genetic factors, were taken into consideration [1, 7, 17, 18].
As early as in 1985 it was indicated that PTh increases with advancing GA [4]. Depending on the study, the correlation between PTh and GA is significantly different. The study of Azagidi et al. reported the most significant strong positive correlation in the 2nd trimester (r = 0.794). Results suggest that PTh has a linear relationship with GA, sonographically estimated foetal weight, and foetal growth parameters. Therefore, PTh can be used along with other foetal growth parameters to predict GA more accurately, which may be especially useful when a pregnant woman is not sure or does not know her LMP [19] or there was no 1st trimester scan. Agwuna et al. reported almost the same correlation value for the 2nd trimester; r = 0.791, p = 0.01 [20]. In a cross-sectional prospective study performed on a group of 211 pregnant women by Karthikeyan et al. similar findings where determined. The statistical analysis revealed r = 0.609, r = 0.812, and r = 0.814 for the 1st, 2nd, and the 3rd trimesters, respectively, and the p-value was < 0.001 [21]. In the paper published by Keshavarz et al., in which placental thickness was measured among 400 healthy pregnant women, the authors found even stronger positive linear correlation between GA and PTh (p < 0.001; r = 0.93) [22]. Our study confirmed the presence of positive correlation between PTh and GA, however, the described correlation was substantially weaker according to both FB and LMP (r = 0.386 and r = 0.369, respectively). There are several reports that also indicate that the described correlation is not that strong. In the study performed on 3183 pregnant women between the 16th and 40th week of gestation the slope of the curve was smaller than in the studies described before and more similar to the results from our study [9]. Similar curves were found on the figures presenting the data obtained from 114 prenatal ultrasounds from the study of Lee et al. [3]. In the study of Verma et al. the correlation between PTh and GA in the 33rd to 40th week was established at the level of r = 0.386 (p < 0.001); however, between the 19th and 32nd week of gestation this figure was r = 0.792, and the observed correlation was similar to those reported by Azagidi et al. and Agwuna et al. [23].
There are parameters that indicate a much clearer correlation between themselves and GA comparing with PTh – for example: abdominal circumference, transversal diameter of the foetal heart, or thymus circumference [24–26]. Papers regarding the correlation between PTh and GA in the ultrasound examination present varied data, but they all agree that there is a positive correlation. This knowledge can be used to predict GA and progress in foetal growth.
The relation between increased mother’s BMI and the foetal overgrowth is described in various papers. In the meta-analysis by Gaudet et al. maternal obesity played a significant role in the development of macrosomic newborns (OR = 2.17, 95% CI: 1.92–2.45) [27]. The correlation between BMI and PTh has not been so broadly investigated. Baptiste-Roberts et al. found that with increased pre-pregnancy BMI and pregnancy weight gain, the likelihood of placental hypertrophy increases [28]. Kiliopa et al. described the positive correlation between maternal BMI and PTh (r = 0.42; p < 0.001) [5]. In our research the correlation between BMI and PTh was more than 2 times lower r = 0.147, p < 0.001. Additionally, we found that maternal weight correlates better (r = 0.192, p < 0.001) with the PTh than maternal BMI.
In our study we have also analysed how placental implantation site affects PTh value. It turned out, as other studies also confirm, that PTh varies depending on the placental location [3, 29]. We have demonstrated that the thickest placentas are usually found in the fundus of the uterus (median PTh was 42 mm). Placentas with posterior location were thinner by 9 mm than the placentas located in the fundus. Placentas with anterior location presented the lowest PTh values (30 mm) and were thinner by 3 mm compared with placentas located at the posterior wall of the uterus. In the study of Lee et al. the anteriorly located placentas were also thinner than the ones implanted to the posterior wall or fundus; however, the difference was 7 mm [3]. Our findings also agree with the study by Durnwald et al., in which placentas located in the fundus were the thickest and those located at the anterior wall were the thinnest [29]. In the study of Menon et al. the association between placental location and PTh was found to be not significant [30].
Although many authors underlined the benefits which may result from the measurement of the PTh, there are no recommendations in ISUOG guidelines to report this parameter during standard prenatal ultrasound examination [31]. We anticipate that PTh measuring should be routinely included in every prenatal ultrasound examination because it is easy to perform and may help to confirm foetal wellbeing. Our research could be of special value in difficult cases for interpretation, for example, when the PTh is above or below the reference value or in the case of underweight or overweight pregnant women.
Strengh and limitation
The strengths of this study are as follows:
– validation of one of the most simple approaches to assess the placental size,
– sufficient study group size (n = 596),
– small number of publications regarding the factors that influence PTh.
The limitations of this study are as follows:
– subjective character of ultrasound PTh examination,
– retrospective character of the study,
– other established parameters affecting placenta size, e.g. gravidity, parity, genetic factors, maternal health status, and habits, were not taken into consideration in this study.
In conclusion, our observations suggest that maternal weight correlates more strongly with PTh than maternal BMI. In PTh evaluation it is important to pay attention to the placental implantation site – posterior placenta was thicker than the anterior placenta. Moreover, PTh variability remains largely unknown; therefore, further research in this field is needed.