Introduction
The number of acquired immunodeficiency syndrome (AIDS)-related deaths is the lowest this century, with fewer than 1 million people dying each year from AIDS-related illnesses, thanks to sustained access to anti-retroviral therapy. The number of new human immunodeficiency virus (HIV) infections globally continued to decline in 2017. Modeled estimates show that new infections (all ages) declined from a peak of 3.4 million (2.6–4.4 million) in 1996 to 1.8 million (1.4–2.4 million) in 2017. The annual number of deaths in the world caused by AIDS, also regardless of age, dropped from 1.9 million in 2004 to 940,000 in 2017. Nonetheless, it is reported that HIV prevention services are not being provided on an adequate scale and with sufficient intensity and are not reaching the people who need them the most [1].
Constant expansion of knowledge about the human immunodeficiency virus has made it possible to improve the treatment methods of infected patients. The use of highly active antiretroviral therapy (HAART) resulted in both a decrease in mortality among seropositive patients and a decrease in the incidence of opportunistic infections and HIV/AIDS related cancers. The risk for the development of cancer in HIV-infected patients decreased after the introduction of HAART: Kaposi’s sarcoma (RR = 0.30, 95% CI: 0.28–0.33) and non-Hodgkin’s lymphoma (RR = 0.52, 95% CI: 0.48–0.56), in contrast to invasive cervical cancer (RR = 1.46, 95% CI: 1.09–1.94) [2].
Additionally, recent years have led to the development of uniform guidelines on antiretroviral therapy, the aim of which is to reduce viral load in peripheral blood and maintain this state for the longest possible time. According to 2018 recommendations, a reduction of viral load below 50 RNA copies of HIV/ml is the goal of effective treatment [3].
However, the use of antiretroviral drugs for many years does not remain neutral to the patients. Among other things, an increase in cases of chronic kidney disease (CKD) in HIV-infected patients is observed [4, 5]. The development of CKD is affected by both renal cell damage by HIV virus and co-infections with other viruses, as well as adverse and toxic effects of used drugs [6, 7].
Kidney impairments in HIV-infected patients are a major cause of morbidity and mortality. In some studies, kidney diseases were reported to double the risk of death in HIV-infected patients. On a worldwide scale, the prevalence of chronic kidney disease (CKD) among people living with HIV is estimated at 6.4%. This prevalence varies across regions, being 7.9% in Africa, 7.1% in North America, 5.7% in Asia and 3.7% in Europe. In the African continent, West Africa has the highest rate, with a prevalence of 14.6%, and Southern Africa is the least affected, with a prevalence of 3.2%. The prevalence of HIV-associated nephropathy (HIVAN) decreased with the use of combined antiretroviral therapy (cART), but there remains a nearly 4-fold increased risk of kidney disease, including CKD, in people living with HIV compared with the general population [8].
This is an important problem in the care of HIV-positive patients. Therefore there is a need for constant diagnosis of renal function to monitor the development of CKD, prevention of the occurrence of end stage renal disease (ESRD), and optimization of therapy. For this reason searching for parameters which will allow diagnosis of kidney failure even at the level of subclinical changes is important. This would allow the implementation of appropriate nephroprotection or changing the treatment regimen. The world scientific data indicate a great interest in the subject of CKD development in HIV-infected patients; therefore undertaking research to determine the optimal and proper diagnosis of kidney dysfunction is appropriate and justified [5, 9].
Various biomarkers of renal function, measured in urine and serum, are in increasing use in order to estimate the severity and nature of kidney injury. Serum creatinine and the glomerular filtration rate (GFR), expressed as estimated GFR (eGFR), are still the most frequently used biomarkers of renal function despite their known limitations (such as in patients with low muscle mass or with fluid overload). Monitoring renal function in CKD requires biomarkers that provide rapid, non-invasive and specific measurements that correlate well with kidney tissue pathology. The possibility of performing the least invasive tests is particularly important, and therefore the use of urine for its measurement, as easily accessible biological material, is especially valuable. Promising parameters in the assessment of subclinical kidney damage may be low molecular weight proteins (LMWP), which appear in the urine relatively early, that is, before clinical changes manifested by renal structure disorders, or values of routine biochemical parameters such as serum creatinine [10].
The urinary concentrations of the following parameters were determined: kidney injury molecule-1 (KIM-1), neutrophil gelatinase associated lipocalin (NGAL), glutathione S-transferase α (GST-α) and π (GST-π) isoenzymes and neopterin (NPT).
KIM-1 and NGAL are proteins reflecting ischemic kidney damage, the GST-α isoenzyme located in the proximal tubules and GST-π isoenzyme found in the cells of distal tubules and Henle’s loop provide information about renal tubular dysfunction, and NPT is an indicator of cellular immunity.
The aim of this study was to evaluate the changes in the levels of five selected low molecular weight proteins in the urine of HIV-infected patients reflecting the functions of the kidneys, which underlines the non-invasive nature of this study.
Material and methods
The study group consisted of HIV-infected patients consulted in the HIV/AIDS Outpatient Clinic in Wroclaw in the period from 2011 to 2012. The control group included healthy volunteers, HIV negative individuals with eGFR (≥ 90 ml/min) and any chronic or inflammatory diseases, such as hypertension, diabetes mellitus. There was no statistically significant difference between mean age of control group and HIV patients or between mean age of control group and all subgroups of HIV patients (p > 0.05).
In the group of patients, inclusion criteria were the patient’s consent for tests, confirmation of the presence of HIV infection, and taking cART drugs. Exclusion criteria were diseases such as diabetes, cancer, hypertension and especially urinary tract diseases as well as concomitant use of drugs other than cART. The levels of these examined parameters were evaluated in three aspects. In the first analysis, the level of LMWP was assessed in relation to the CD4+ T lymphocyte (LT CD4+) count (with the CD4+ count < 500 cells/μl and ≥ 500 cells/μl), allowing the intensity of HIV infection to be assessed. The second analysis took into account the value of eGFR, an indicator routinely used in the evaluation of renal function. The third analysis concerned the influence of cART on the value of LMWP, reflecting the effect of treatment as well as the action of the virus itself on the kidneys.
HIV-infected patients were divided according to the current LT CD4+ count into subgroups: HIV-infected patients with the LT CD4+ count < 500 cells/μl and HIV-infected patients with the LT CD4+ count ≥ 500 cells/μl and depending on the value of eGFR into normal (≥ 90 ml/min, and decreased eGFR (< 90 ml/min). Additionally, HIV-infected patients were divided into four subgroups (I–IV) depending on the type of the cART: subgroup I – patients with cART including tenofovir (TDF) with eGFR< 90 ml/min; subgroup II – patients on cART including TDF with eGFR ≥ 90 ml/min; subgroup III – patients on cART without TDF with eGFR ≥ 90 ml/min; and subgroup IV – cART-naïve patients with eGFR ≥ 90 ml/min.
All participants were informed of the aim of the study and gave written consent to participate. The study was approved by the Ethics Committee of Wroclaw Medical University no. KB-658/2012.
The morning urine samples were collected in polystyrene containers (Aptaca, Italy), then centrifuged by an MPW-350 laboratory centrifuge (MPW Instruments, Poland) for 10 min (1500 × g), and then the obtained supernatant was removed and placed in Eppendorf tubes and stored at –80°C for further investigation.
Low molecular weight protein concentrations were measured in urine by the immunoenzymatic method (ELISA) with Enzyme-Linked Immunosorbent Assay Kits: KIM-1 (BioAssay Works, USA, Cat. No. H-RENA-E-001), NGAL (BIOPORTO Diagnostics, Denmark, Cat. No. 036CE), GST-α (Nephkit Alpha, Argutus Medical Ltd, Ireland, Cat. No. BIO66NEPHA), GST-π (Pi GST EIA, Argutus Medical Ltd, Ireland, Cat. No. BIO85), and NPT (IBL, Germany, Cat. No. RE59321) according to the manufacturer’s instructions in a listed test.
Levels of LMWP were calculated in relation to the urine creatinine concentration estimated by Jaffe’s routine method based on the reaction of picric acid (Picric Acid, USA, SIGMA, Cat. No. 319287) and creatinine under acidic conditions. This allowed the values of examined parameters to be expressed in the unit of level of mg of urine creatinine.
The study was conducted in the Department of Toxicology, Faculty of Pharmacy, Wroclaw Medical University.
Additionally, clinical parameters derived from medical records of HIV-infected patients (i.e. LT CD4+ count, eGFR value, antiretroviral treatment and serum creatinine concentration) were also used to interpret the results.
Statistical analysis
Statistical analysis was conducted with Statistica PL software (version 13.3). The normality of distribution was checked with Lilliefors and Kolmogorov-Smirnov tests. The nonparametric Kruskal-Wallis test was used for the comparison of the variables between groups and the post hoc analysis (Bonferroni test) for nonparametric data was used. The diagnostic value of each parameter was assessed using receiver operating characteristic curve (ROC) analysis. The values of diagnostic indicators (sensitivity, specificity; positive predictive (PPV), negative predictive (NPV), likelihood ratio (LR+/–) and their confidence interval CI 95% were calculated. The associations between continuous variables were analyzed by the Spearman test. The values of p < 0.05 were considered as statistically significant.
Results
The patient group consisted of 86 HIV-infected patients including 48 men (77%) and 20 women (23%), with a mean age of 42 years. The control group included 34 healthy volunteers, HIV negative individuals: 25 men (74%) and 9 women (26%) with a mean age 39 years. The demographic and clinical characteristics of examined groups are shown in Table I. No statistically significant differences in characteristics between HIV-infected patients and the control group were observed.
Table I
Demographic and clinical data of HIV patients and the control group
[i] eGFR – estimated glomerular filtration rate, LT CD4+ – lymphocytes T CD4+, subgroup I – patients on cART including tenofovir (TDF) with eGFR < 90 ml/min, subgroup II – patients on cART including TDF with eGFR ≥ 90 ml/min, subgroup III – patients on cART without TDF with eGFR ≥ 90 ml/min, subgroup IV – cART-naïve patients with eGFR ≥ 90 ml/min.
In HIV-infected patients divided into subgroups according to the LT CD4+ count < 500 cells/μl and HIV-infected patients with the LT CD4+ count ≥ 500 cells/μl, and the control group, the median levels and interquartile ranges with statistical analysis of examined low molecular weight proteins (KIM-1, NGAL, GST-α, GST-π, NPT) are presented in Table II and Figure 1.
Table II
Median levels and interquartile ranges of low molecular weight proteins in the urine of HIV patients in the subgroups separated on the basis of the number of LT CD4+ with statistical analysis
| Subgroups | CD4+ < 500 cells/μl (A) | CD4+ ≥ 500 cells/μl (B) | Control group (C) | P-value* | Post hoc analysis | |||
|---|---|---|---|---|---|---|---|---|
| LMWP | Me | IQR | Me | IQR | Me | IQR | ||
| KIM-1 [ng/mg cr.] | 0.11 | 0.07–0.22 | 0.09 | 0.03–0.15 | 0.03 | 0.02–0.08 | < 0.001 | A:C < 0.001 B:C = 0.045 A:B = NS |
| NGAL [ng/mg cr.] | 23.08 | 10.54–44.64 | 19.52 | 12.11–35.93 | 7.57 | 3.65–14.57 | < 0.001 | A:C < 0.001 B:C < 0.001 A:B = NS |
| GST-α [ng/mg cr.] | 2.72 | 1.84–5.39 | 2.44 | 1.77–3.66 | 1.72 | 1.06–2.80 | 0.012 | A:C = 0.025 B:C = 0.026 A:B = NS |
| GST-π [ng/mg cr.] | 4.67 | 2.55–7.43 | 3.07 | 1.99–6.91 | 3.24 | 2.18–4.14 | 0.049 | A:C = 0.044 B:C = NS A:B = NS |
| NPT [ng/mg cr.] | 177.26 | 28.27–384.07 | 74.89 | 37.14–263.07 | 59.76 | 30.95–115.15 | NS | A:C = NS B:C = NS A:B = NS |
Figure 1
Median levels and interquartile ranges of low molecular weight proteins in the urine of HIV infected patients in the subgroups separated on the basis of the number of LT CD4+, the glomerular filtration rate (eGFR) value and the applied cART
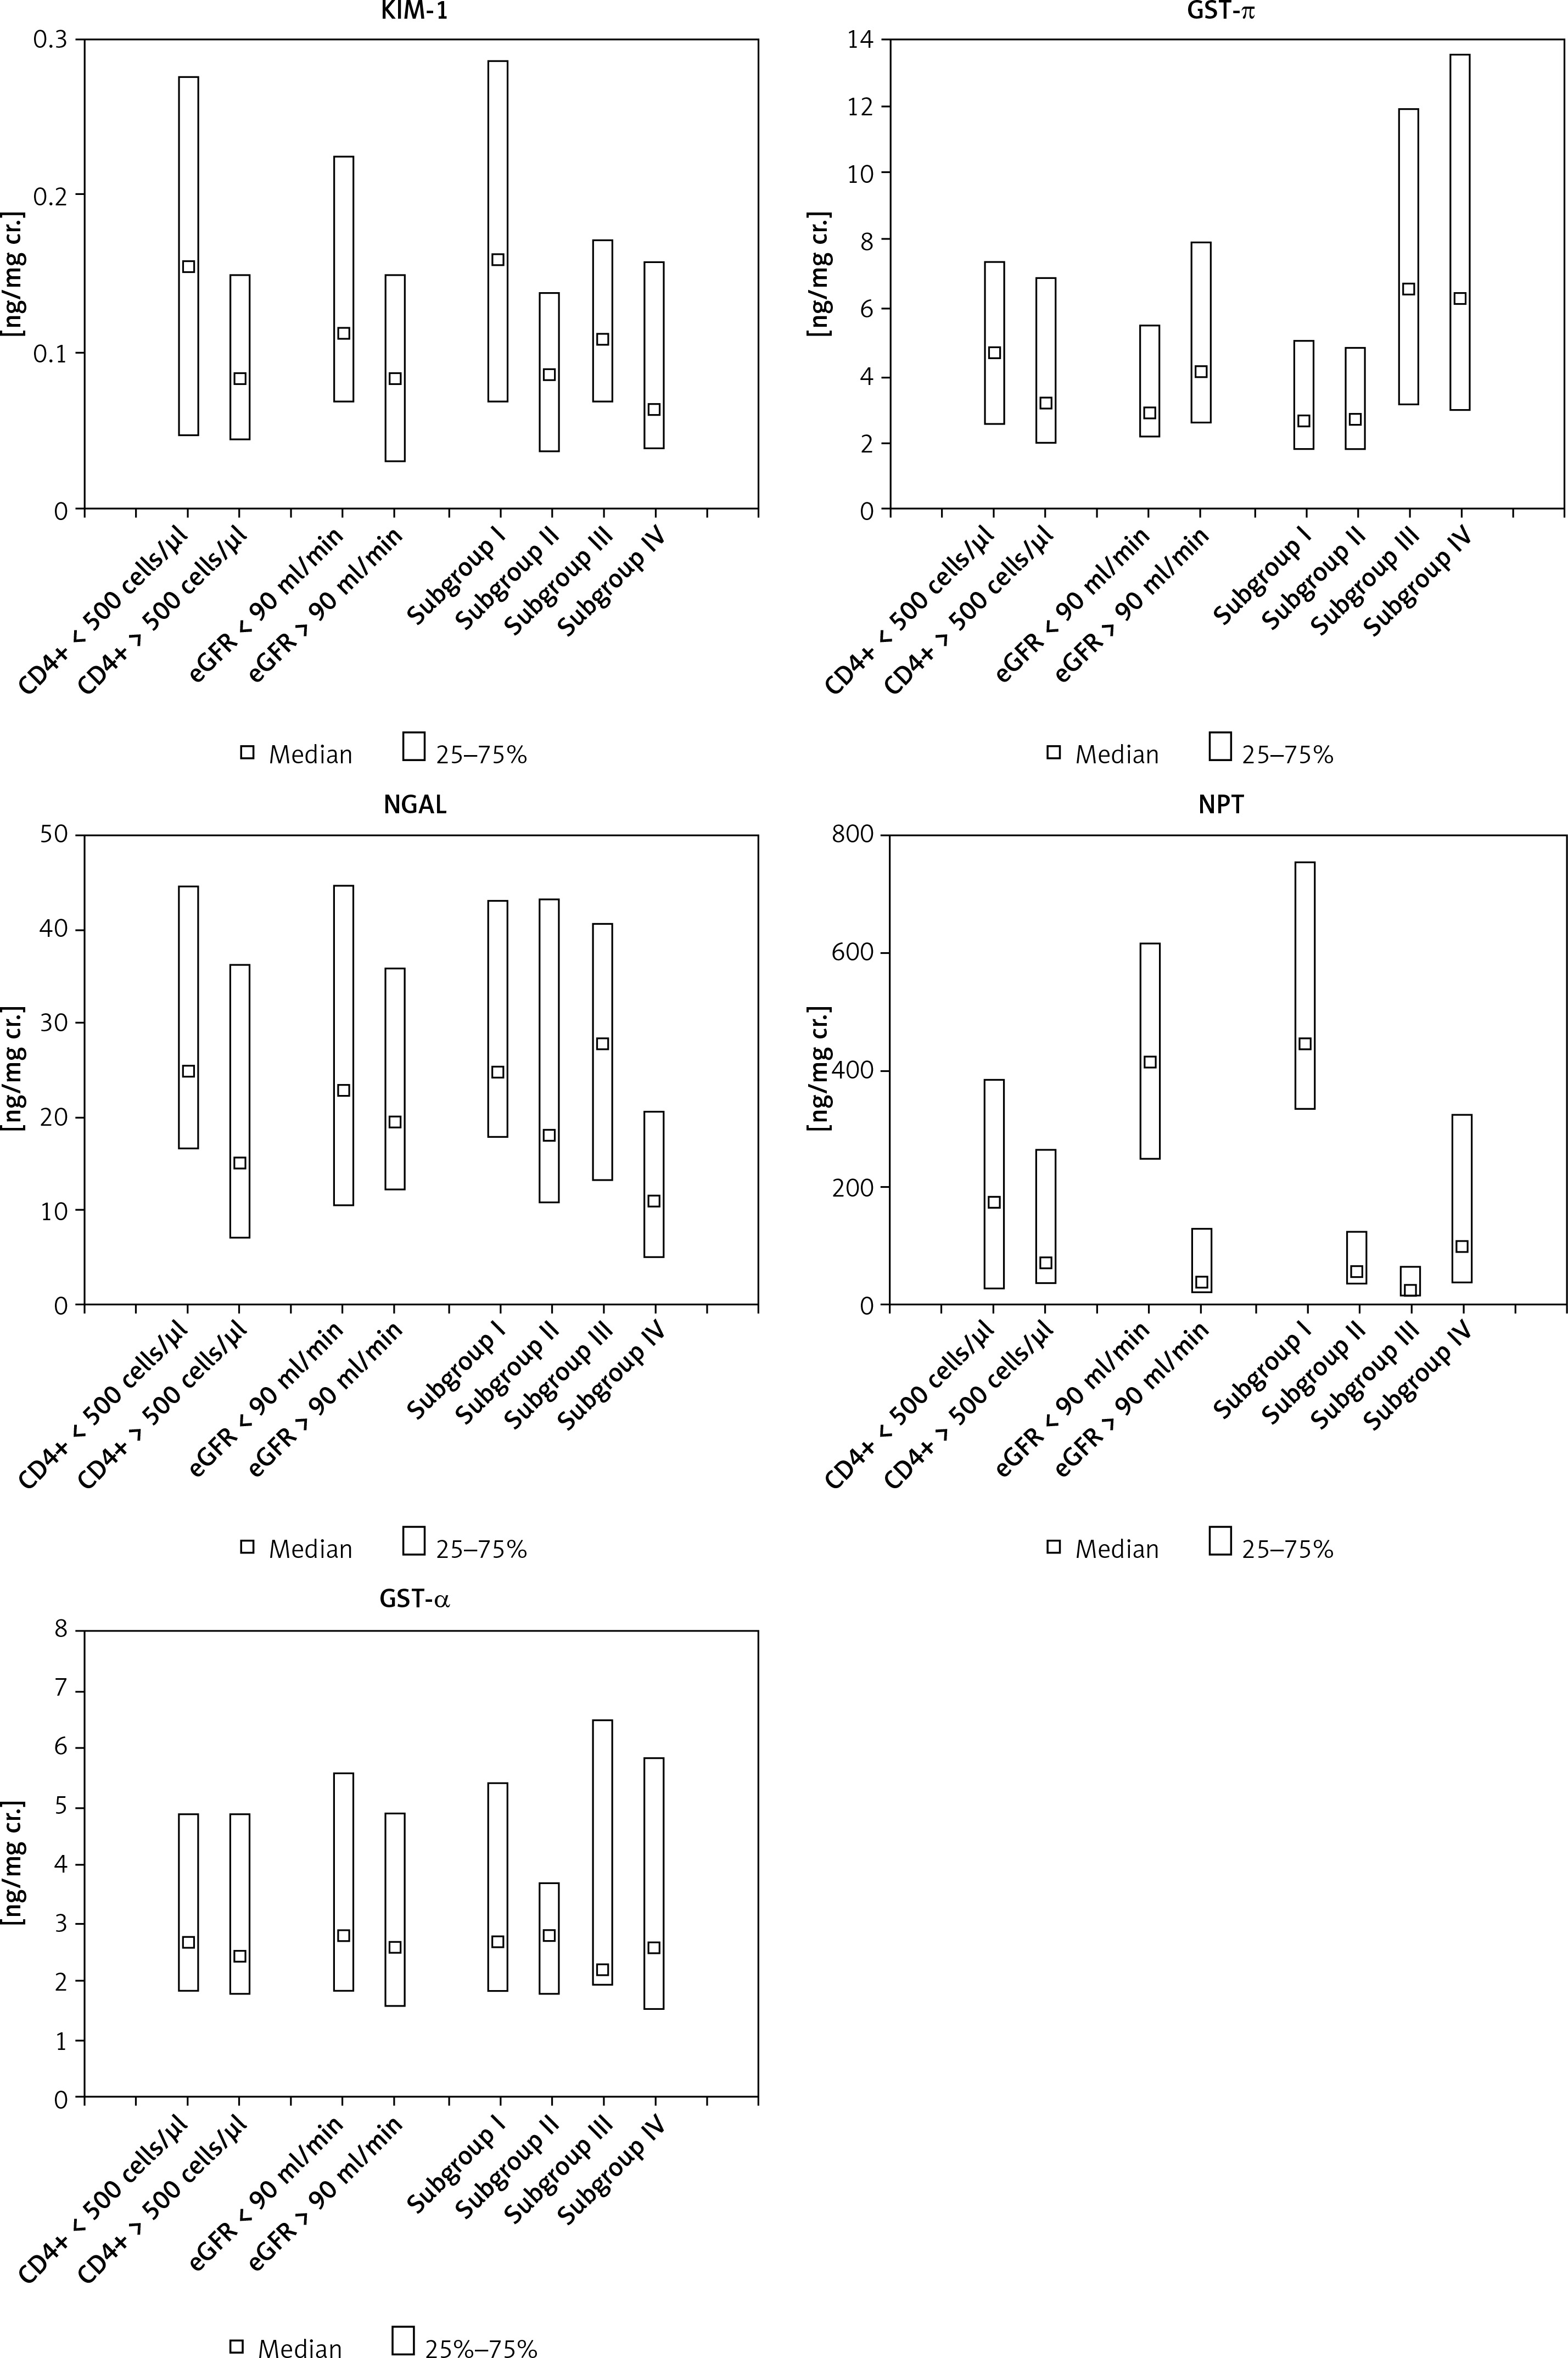
As shown in Table II, median levels of KIM-1, NGAL, GST-α and NPT were 3.7-fold, 3-fold, 1.6-fold and 2.9-fold higher, respectively, in the subgroup of HIV-infected patients with LT CD4+ < 500 cells/μl compared with the control group. Median levels of KIM-1, NGAL, GST-α and NPT were increased 3-fold, 2.6-fold, 1.5-fold and 1.2-fold, respectively, in the HIV-infected patients with the LT CD4+ count ≥ 500 cells/μl compared with the control group. Similar median levels in both subgroups and the control group were observed only for GST-π. There were no statistically significant differences between the levels of KIM-1, NGAL, GST-α, GST-π and NPT in the subgroup of HIV-infected patients with LT CD4+ < 500 cells/μl and in the HIV-infected patients with the LT CD4+ count ≥ 500 cells/μl (Table II).
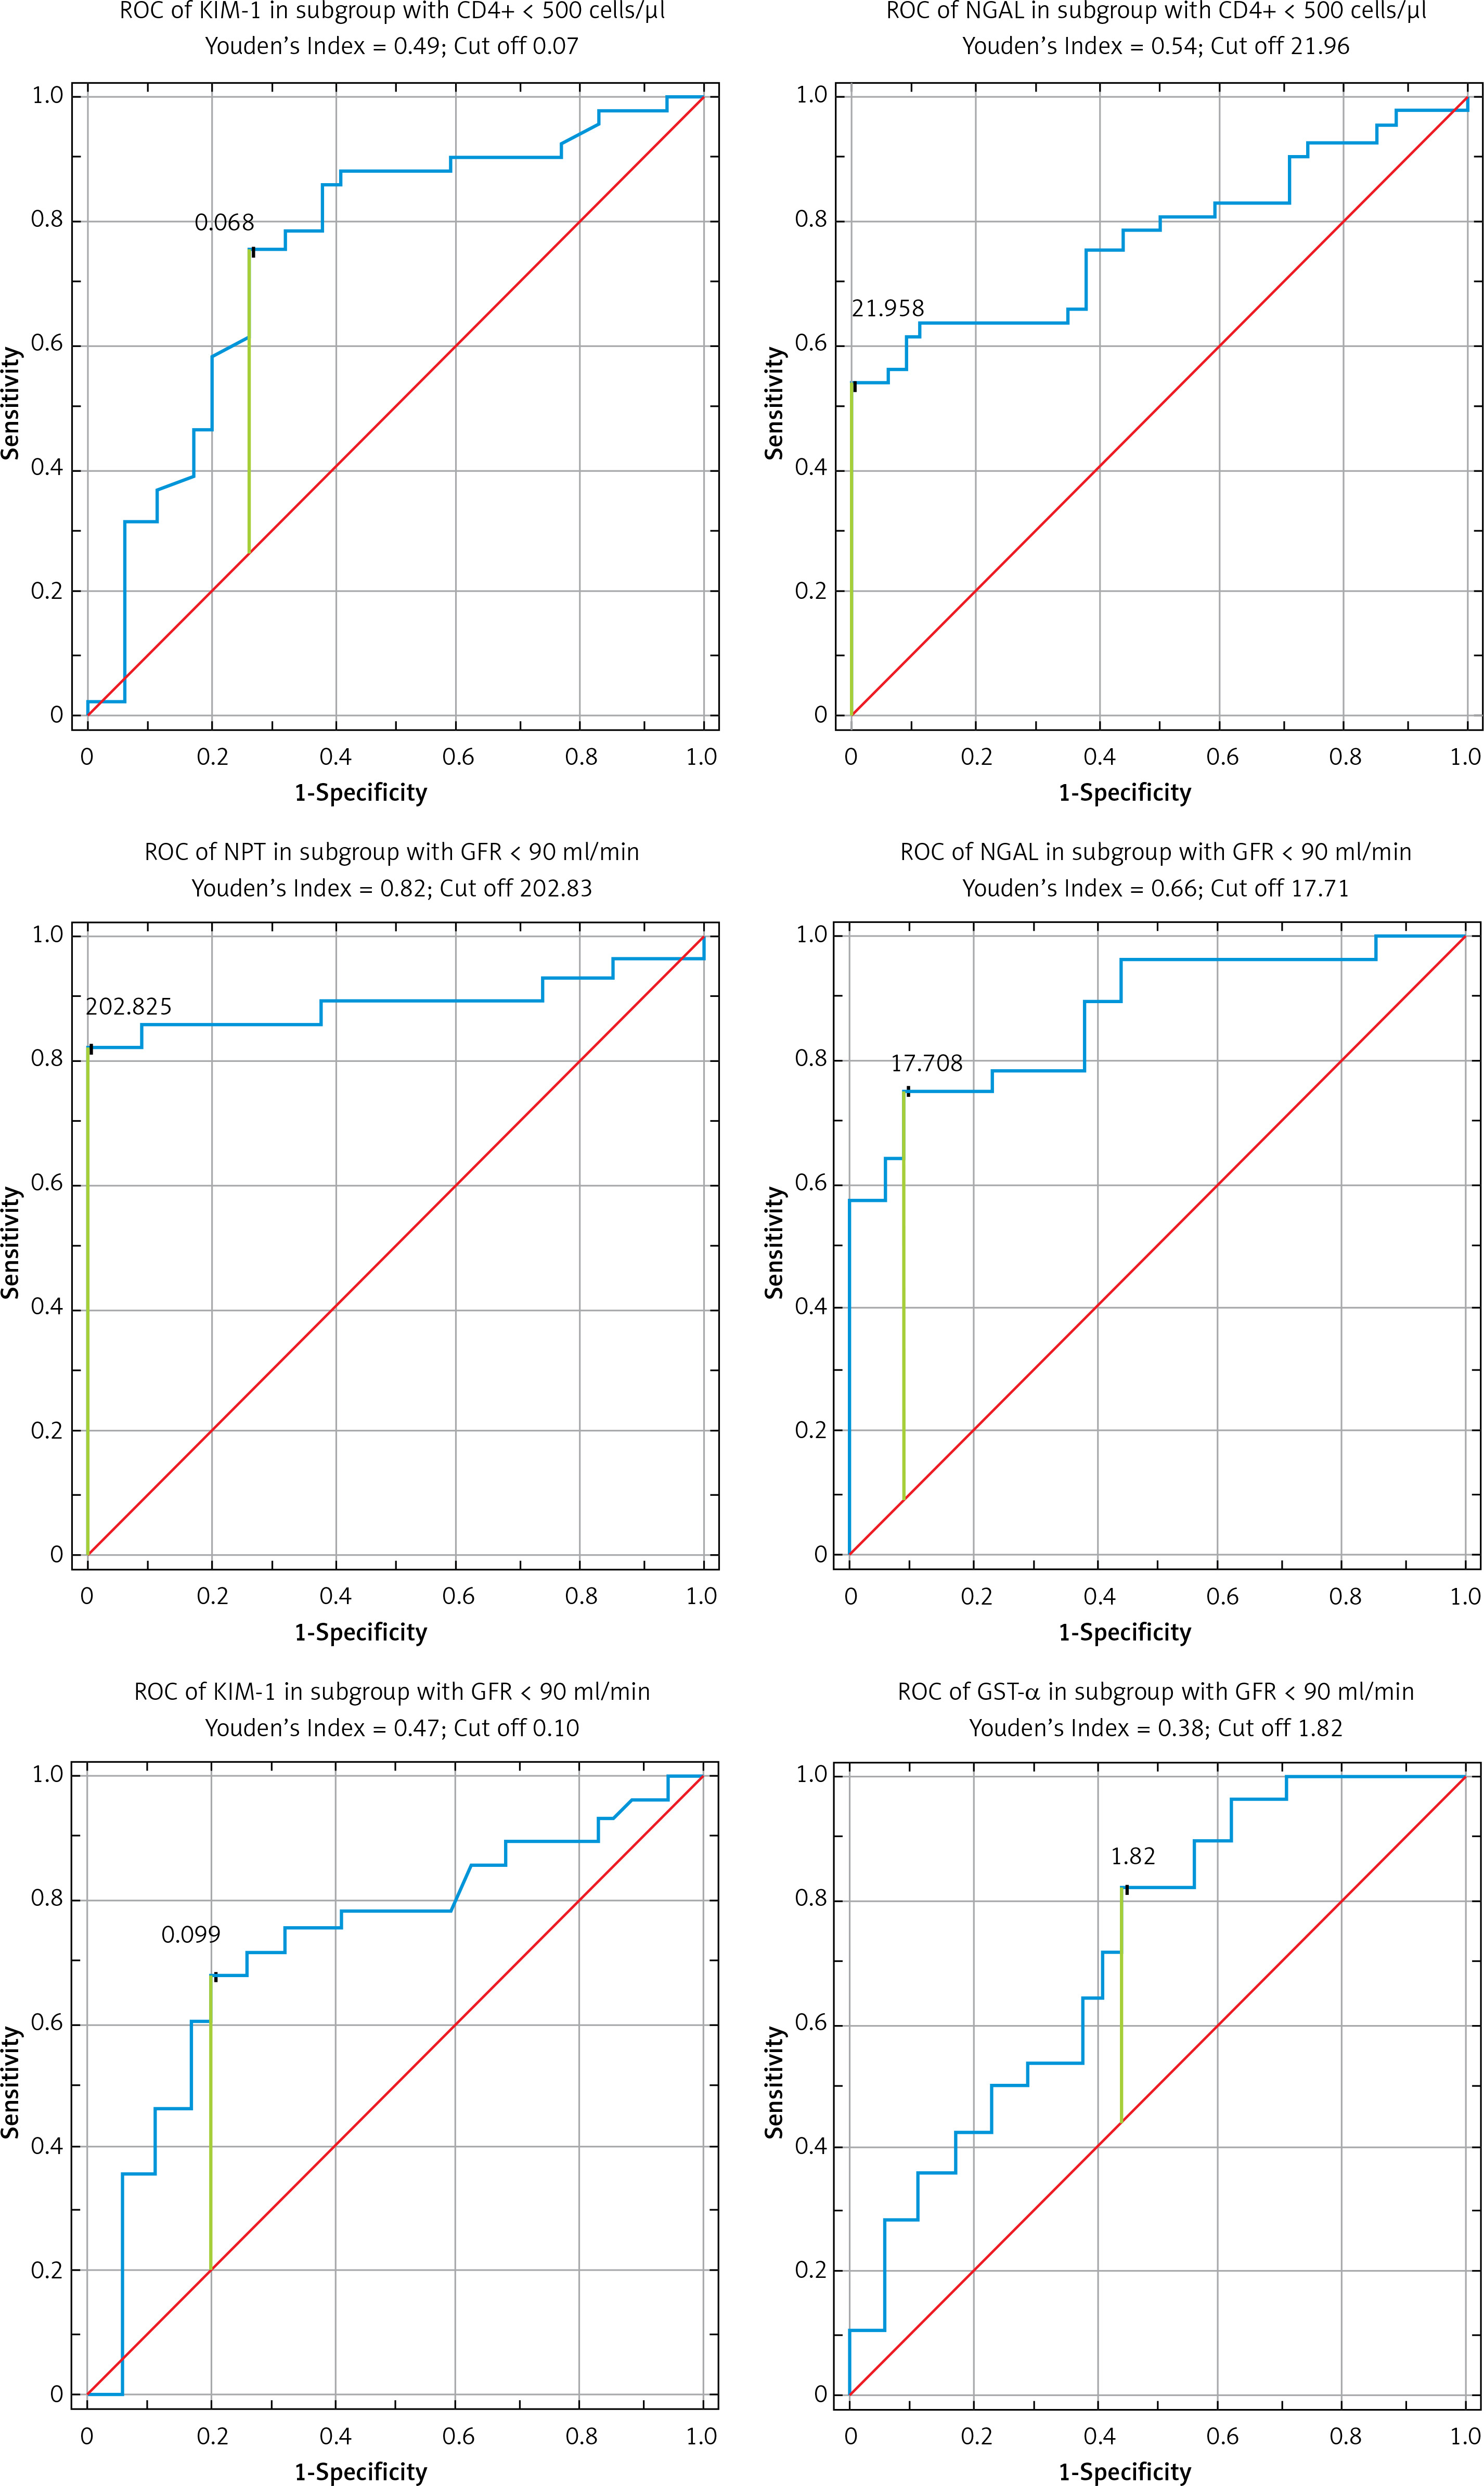
Based on ROC analysis, the best diagnostic value in the subgroup of HIV-infected patients with LT CD4+ < 500 cells/μl was observed for NGAL [area under the curve (AUC) of 0.77 (95% confidence interval (CI) 0.67–0.87, p < 0.001)) and KIM-1 (AUC of 0.75 (95% CI: 0.67–0.87, p < 0.001)) (Figure 2). By contrast, in the subgroup of HIV-infected patients with LT CD4+ ≥ 500 cells/μl the best diagnostic value was observed for NGAL (AUC of 0.78 (95% CI: 0.68–0.88, p < 0.001)) (Figure 2, Table III).
Table III
Diagnostic value of parameters in selected subgroups
Figure 2
ROC curves of selected parameters in the group with LT CD4+ count < 500 cells/μl and in the group with GFR < 90 ml/min
In both subgroups of patients in terms of LT CD4+ count, significant positive correlations between GST-α and GST-π (R = 0.564, p < 0.001; R = 0.740, p < 0.001, respectively) and between NPT and serum creatinine (R = 0.342, p = 0.029; R = 0.573, p < 0.001, respectively) were revealed. Negative significant correlations between KIM-1 and NGAL (R = –3.714, p = 0.017) in the group of HIV-infected patients with LT CD4+ count ≤ 500 cells/μl were found.
The median levels of KIM-1, NGAL and NPT were 5.3-fold, 3.3-fold and 7-fold higher, respectively, in HIV-infected patients with eGFR < 90 ml/min compared to the control group. Median levels of KIM-1 and NGAL were 2.6-fold and 2-fold higher, respectively, in HIV-infected patients with eGFR ≥ 90 m/min compared to the control group. Similar median levels in both subgroups and the control group were observed for GST-α and GST-π. Statistically significant differences between NPT level in HIV-infected patients with eGFR < 90 ml/min and in HIV-infected patients with eGFR ≥ 90 ml/min were found. The post hoc analysis showed no significant differences between KIM-1, NGAL, GST-α, and GST-π levels in HIV-infected patients with eGFR < 90 ml/min and in HIV-infected patients with eGFR ≥ 90 ml/min (Table IV, Figure 1).
Table IV
Median levels and interquartile ranges of HIV patients in the subgroups separated depending on eGFR with statistical analysis
| Subgroups | EGFR < 90 ml/min (A) | EGFR ≥ 90 ml/min (B) | Control group (C) | P-value* | Post hoc analysis | |||
|---|---|---|---|---|---|---|---|---|
| LMWP | Me | IQR | Me | IQR | Me | IQR | ||
| KIM-1 [ng/mg cr.] | 0.16 | 0.05–0.28 | 0.08 | 0.04–0.15 | 0.03 | 0.02–0.08 | < 0.001 | A:C < 0.001 B:C = 0.023 A:B = NS |
| NGAL [ng/mg cr.] | 24.91 | 16.57–44.66 | 15.14 | 7.15–36.22 | 7.57 | 3.65–14.57 | < 0.001 | A:C < 0.001 B:C < 0.001 A:B = NS |
| GST-α [ng/mg cr.] | 2.81 | 1.94–6.49 | 2.62 | 1.55–5.85 | 1.72 | 1.06–2.80 | 0.008 | A:C = 0.012 B:C = NS A:B = NS |
| GST-π [ng/mg cr.] | 2.97 | 2.19–5.46 | 4.19 | 2.55–7.99 | 3.24 | 2.18–4.14 | NS | A:C = NS B:C = NS A:B = NS |
| NPT [ng/mg cr.] | 415.39 | 251.38–615.34 | 43.79 | 20.18–129.32 | 59.76 | 30.95–115.15 | < 0.001 | A:C < 0.001 B:C = NS A:B < 0.001 |
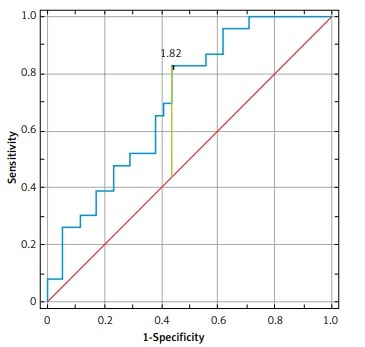
The parameters with the highest diagnostic value in HIV-infected patients with eGFR < 90 ml/min included: NPT (AUC of 0.89 (95% CI: 0.79–0.99, p < 0.001)), NGAL (AUC of 0.88 (95% CI: 0.78–0.96, p < 0.001)), KIM-1 (AUC of 0.73 (95% CI: 0.59–0.86, p < 0.001)) and GST-α (AUC of 0.71 (95% CI: 0.59–0.84, p < 0.001)) (Figure 2, Table III).
In subgroups with HIV-infected patients with eGFR < 90 ml/min and HIV-infected patients with eGFR ≥ 90 ml/min a significant positive correlation was demonstrated between GST-α and GST-π (R = 0.876, p < 0.001; R = 0.689, p < 0.001, respectively) but a correlation for NPT and serum creatinine (R = 0.376, p = 0.049) was revealed only in HIV-infected patients with the eGFR < 90 ml/min. Neopterin also showed a negative correlation with eGFR (R = –0.603, p = 0.001) in the whole group of HIV-infected patients. The mean value of serum creatinine in HIV-infected patients was 0.89 (median = 0.88) mg/dl and was significantly higher compared to the control group, 0.78 (median = 0.77) mg/dl (p < 0.001).
A comparative analysis of LMWP subgroups with LT CD4+ count < 500 cells/μl and the eGFR < 90 ml/min vs. LT CD4+ count ≥ 500 cells/μl and the eGFR ≥ 90 ml/min was performed. In the last above-mentioned subgroup, only NGAL showed a statistically significant difference compared to the control group (Table V).
Table V
Median levels and interquartile ranges of low molecular weight proteins in the urine of HIV patients in the subgroups: LT CD4+ count < 500 cells/μl and the eGFR < 90 ml/min vs. LT CD4+ count ≥ 500 cells/μl and the eGFR ≥ 90 ml/min with statistical analysis
| Subgroup | EGFR < 90 ml/min CD4+ < 500 cells/μl (A) n = 14 | EGFR ≥ 90 ml/min CD4+ ≥ 500 cells/μl (B) n = 23 | Control group (C) | P-value* | Post hoc analysis | |||
|---|---|---|---|---|---|---|---|---|
| LMWP | Me | IQR | Me | IQR | Me | IQR | ||
| KIM-1 [ng/mg cr.] | 0.25 | 0.07–0.31 | 0.07 | 0.03–0.15 | 0.03 | 0.02–0.08 | < 0.001 | A:C < 0.001 B:C = NS A:B = NS |
| NGAL [ng/mg cr.] | 33.59 | 18.19–47.46 | 18.06 | 7.27–36.28 | 7.57 | 3.65–14.57 | < 0.001 | A:C < 0.001 B:C = 0.01 A:B = NS |
| GST-α [ng/mg cr.] | 2.42 | 1.86–5.73 | 2.13 | 1.69–5.57 | 1.72 | 1.06–2.80 | 0.012 | A:C = 0.03 B:C = NS A:B = NS |
| GST-π [ng/mg cr.] | 3.36 | 2.47–5.81 | 2.93 | 1.98–6.96 | 3.24 | 2.18–4.14 | NS | A:C = NS B:C = NS A:B = NS |
| NPT [ng/mg cr.] | 415.39 | 177.26–571.27 | 43.37 | 29.92–80.62 | 59.76 | 30.95–115.15 | < 0.001 | A:C = 0.002 B:C = NS A:B < 0.001 |
Additionally, median levels and interquartile ranges of the LMWP for four subgroups (I–IV) of HIV-infected patients divided depending on the type of antiretroviral treatment with statistical analysis were estimated and the results are presented in Table VI and Figure 1.
Table VI
Median levels and interquartile ranges of low molecular weight proteins in the urine of HIV patients in the subgroups I-IV, separated on the basis of treatment with statistical analysis
| Patient subgroup | Median | IQR | P-value* | Post hoc analysis |
|---|---|---|---|---|
| KIM-1 [ng/mg cr.]: | ||||
| I | 0.16 | 0.07–0.29 | 0.003 | I:C = 0.002; I:II = NS; II:IV = NS II:C = NS; I:III = NS; III:IV = NS III:C = NS; I:IV = NS; II:III = NS IV:C = NS |
| II | 0.09 | 0.04–0.14 | ||
| III | 0.11 | 0.07–0.17 | ||
| IV | 0.07 | 0.04–0.16 | ||
| Control group (C) | 0.03 | 0.02–0.08 | ||
| NGAL [ng/mg cr.]: | ||||
| I | 25.17 | 17.88–42.82 | < 0.001 | I:C < 0.001; I:II = NS; II:IV = NS II:C < 0.001; I:III = NS; III:IV = NS III:C < 0.001; I:IV = NS; II:III = NS IV:C < 0.001 |
| II | 18.36 | 10.96–43.26 | ||
| III | 28.09 | 13.23–40.62 | ||
| IV | 11.21 | 5.09–20.54 | ||
| Control group (C) | 7.57 | 3.65–14.57 | ||
| GST-α [ng/mg cr.]: | ||||
| I | 2.72 | 1.84–5.39 | NS | I:C = NS; I:II = NS; II:IV = NS II:C = NS; I:III = NS; III:IV = NS III:C = NS; I:IV = NS; II:III = NS IV:C = NS |
| II | 2.81 | 1.77–3.66 | ||
| III | 2.21 | 1.94–6.49 | ||
| IV | 2.62 | 1.55–5.85 | ||
| Control group (C) | 1.72 | 1.06–2.80 | ||
| GST-π [ng/mg cr.]: | ||||
| I | 2.67 | 1.78–5.06 | < 0.001 | I:C = NS; I:II = NS; II:IV = 0.03 II:C = NS; I:III = NS; III:IV = NS III:C = 0.03; I:IV = NS; II:III = NS IV:C = 0.02 |
| II | 2.71 | 1.78–4.82 | ||
| III | 6.65 | 3.10–11.92 | ||
| IV | 6.33 | 2.98–13.53 | ||
| Control group (C) | 3.24 | 2.18–4.14 | ||
| NPT [ng/mg cr.]: | ||||
| I | 448.41 | 334.25–756.28 | < 0.001 | I:C < 0.001; I:II < 0.001; II:IV = NS II:C = NS; I:III < 0.001; III:IV = NS III:C = NS; I:IV < 0.001; II:III = NS IV:C = NS |
| II | 59.43 | 40.49–125.54 | ||
| III | 28.27 | 17.77–66.57 | ||
| IV | 101.42 | 37.28–322.49 | ||
| Control group (C) | 59.76 | 30.95–115.15 |
IQR – interquartile ranges, I–IV – patient subgroups, I – patients on cART including TDF with eGFR < 90 ml/min, II – patients on cART including TDF with eGFR ≥ 90 ml/min, III – patients on cART without TDF with eGFR ≥ 90 ml/min, IV – cART-naïve patients with eGFR ≥ 90 ml/min, NS – not statistically significant.
The highest median levels of KIM-1 and NGAL were observed in patients on cART including TDF with decreased eGFR (I subgroup) and in patients on cART without TDF treatment (subgroup III).
The median levels of KIM-1 and NGAL were 5.3-fold and 3.3-fold higher, respectively, in subgroup I compared with the control group. The median levels of KIM-1 and NGAL were 3.7-fold and 3.7-fold higher, respectively, in subgroup III than the control group.
A statistically significant difference in examined LMWP level between group I and the control group was found only for KIM-1. However, statistically significant differences in NGAL level were detected between all subgroups (I–IV) and the control group.
The median levels of GST-α in all subgroups (I–IV) were similar and no statistically significant differences in GST-α level between any of the four groups compared to the control group or between these subgroups were found.
The highest median levels of GST-π were observed in patients on cART without TDF treatment (subgroup III) and in cART-naïve patients (subgroup IV). The median levels of GST-π were 2.1-fold and 1.9-fold higher, respectively, in subgroups III and IV compared with the control group, and the difference between these subgroups and the control group was statistically significant.
The highest median levels of NPT were observed in patients on cART including TDF with decreased eGFR (subgroup I) and in cART-naïve patients (subgroup IV). The median levels of NPT were 7.5-fold and 1.7-fold higher, respectively, in subgroups III and IV compared with the control group. There were statistically significant differences in the NPT level when comparing subgroup I to subgroups II, III, IV and the control group (Table V, Figure 1).
The parameters with the highest diagnostic value in subgroup I were: NPT (AUC of 0.99 (95% CI: 0.88–1, p < 0.001)), NGAL (AUC of 0.91 (95% CI: 0.59–0.89, p < 0.001)), KIM-1 (AUC of 0.74 (95% CI: 0.59–0.88, p = 0.001)) and GST-α (AUC of 0.71 (95% CI: 0.57–0.84, p = 0.003)) (Figure 3, Table III).
Figure 3
ROC curves of selected parameters in the subgroups separated on the basis of treatment (I and III)
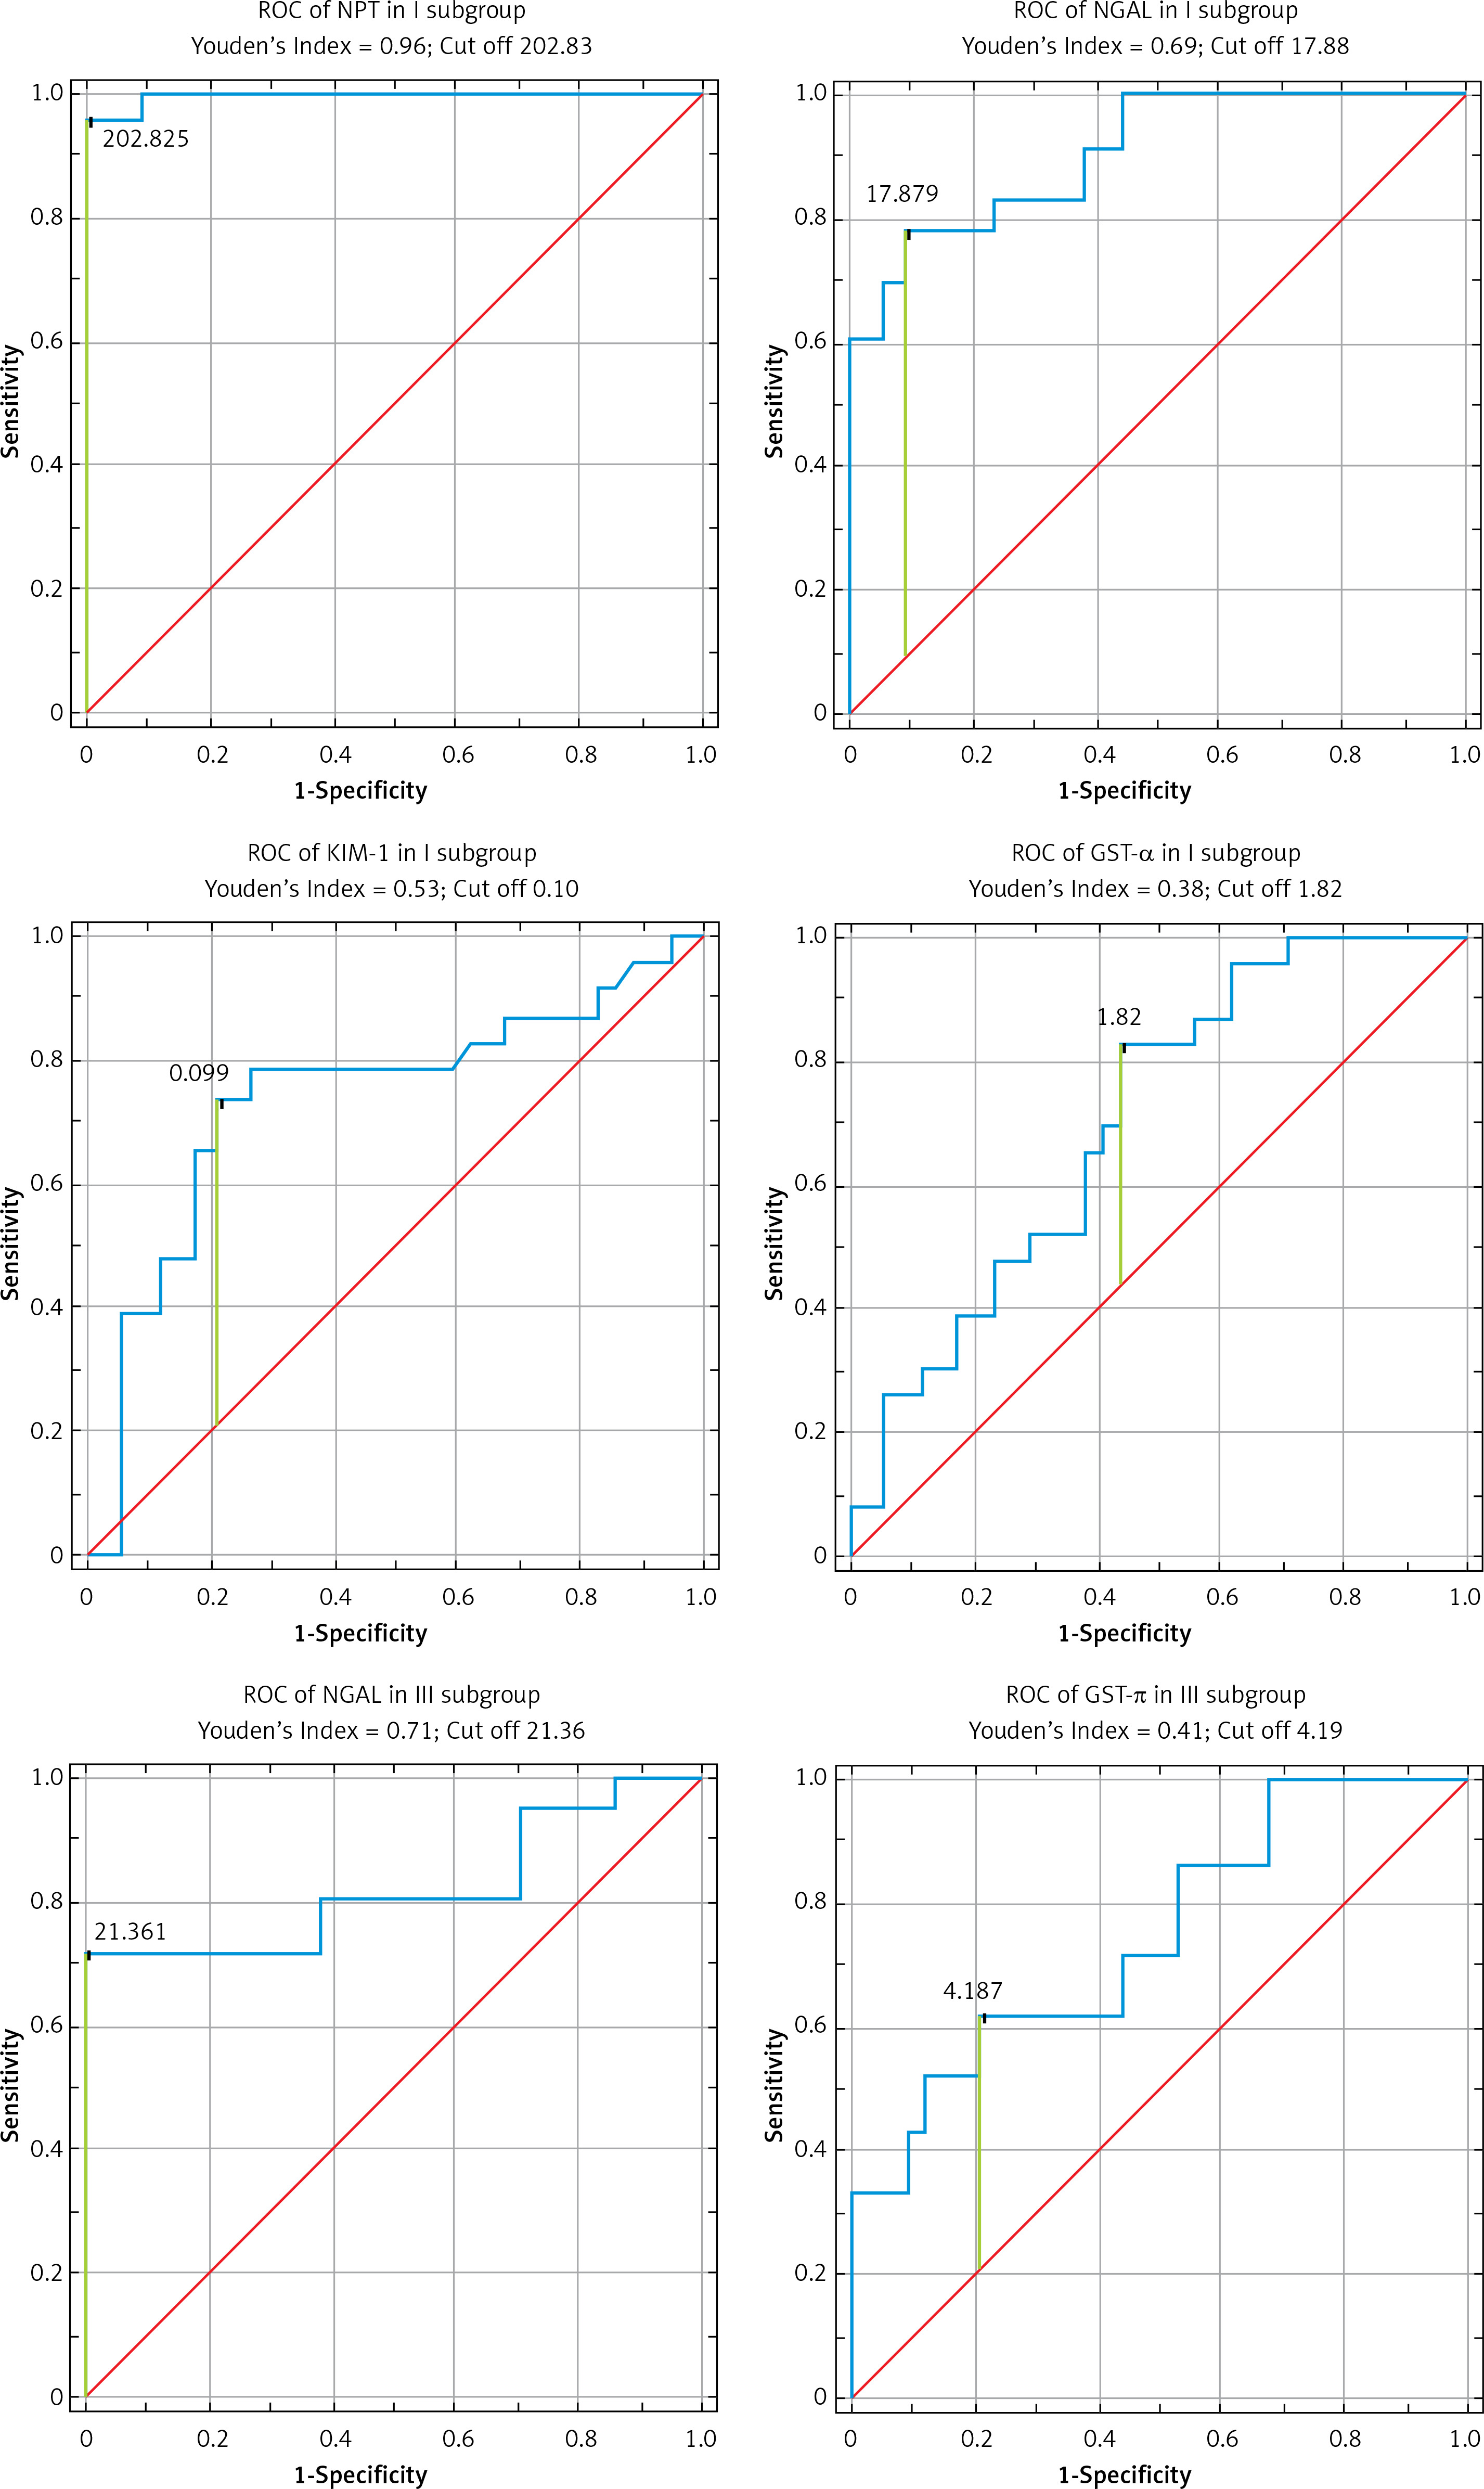
Neutrophil gelatinase associated lipocalin had the best diagnostic value in subgroup III: sensitivity 71%, specificity 100%, AUC of 0.82 (95% CI: 0.69–0.95, p < 0.001), while GST-π had the best diagnostic value in subgroup IV: sensitivity 65%, specificity 80%, AUC of 0.75 (95% CI: 0.61–0.89, p < 0.001).
Discussion
The present study evaluated changes in levels of five selected low molecular weight proteins – KIM-1, NGAL, GST-α, GST-π and NPT – as potential parameters useful for the assessment of renal injury in HIV-infected patients depending on the LT CD4+ count, eGFR values and applied cART.
Our results revealed a statistically significant increase of KIM-1, NGAL and GST-α levels in patient subgroups regardless of lymphocyte count compared to the control group. The levels of these parameters were higher in HIV-infected patients with an LT CD4+ count < 500 cells/μl than in HIV-infected patients with LT CD4+ ≥ 500 cells/μl but not statistically significant. This suggests that these parameters (KIM-1, NGAL and GST-α) more strongly reflect the intensity of HIV infection related to the reduced count of LT CD4+ and kidney dysfunction than the other examined LMWP.
The cells of the immune system, primarily LT CD4+, are the sites of HIV replication, leading to progressive degradation of the host’s immune system. The LT CD4+ count reflects the condition of the immune system in these patients and is constantly monitored during cART. The increase of LT CD4+ count testifies to the effectiveness of therapy, while a decline indicates the progression of infection, which is not only related to the patient’s clinical condition but also affects the kidney function [11]. Di Biagio et al. [12] observed a relationship between low LT CD4+ count and the occurrence of renal abnormalities in HIV-infected patients, which demonstrates the negative effect of the intensity of HIV infection on renal function.
From our present results, it can be seen that the parameters most reflecting renal function impairment, based on the eGFR value, were KIM-1, NGAL, and especially NPT. The levels of these parameters were higher in HIV-infected patients with eGFR < 90 ml/min than in HIV-infected patients with eGFR ≥ 90 ml/min but not significantly statistically for KIM-1 and NGAL. The level of NPT was statistically significantly higher, by 7 times, in HIV-infected patients with decreased eGFR, below < 90 ml/min, compared to the control group, and was statistically significantly higher than in HIV-infected patients with eGFR ≥ 90 ml/min. In our study, NPT showed a strong negative correlation with the eGFR value, which indicates that its increase is associated with renal dysfunction in HIV-infected patients.
In the present study we also investigated the levels of LMWP in HIV-infected patients divided into subgroups depending upon the cART and in relation to the eGFR value. The analysis was carried out in four subgroups (I–IV), as described in detail in the Material and methods section. Nephrotoxicity is reported with almost all drugs used in cART; however, renal diseases are more often associated with TDF application than with other antiretroviral drugs used to date [13]. Tenofovir is excreted unchanged by the kidneys by glomerular filtration and active tubular secretion. In most reported cases of TDF-associated nephropathy, Fanconi syndrome was found, i.e. a generalized proximal nephropathy [14]. Previous evidence from case report and cohort studies points to the association of prolonged TDF use with renal damage [15]. Despite this fact, according to recommendations of the EACS tenofovir is used in imitation therapy either as tenofovir disoproxil fumarate (TDF) or the subsequent pro-drug formulation tenofovir alafenamide (TAF). Both versions can be nephrotoxic, TDF more so, but other side effects can exclude the use of TAF in a certain patient [16, 17].
There are currently various strategies to reduce long-term exposure to antiretrovirals. To reduce exposure to antiretroviral drugs, dual therapy can be introduced. The two-drug regimen (2DR) is a simplified treatment scheme for HIV infection, which is limited to administering to the patient only two antiretrovirals. The European Commission issued a marketing authorization in 2018 for the world’s first dual drug therapy used to treat HIV infection (the drug Juluca) [18, 19].
Juluca can be used as a complete treatment regimen for HIV infection to replace the current antiretroviral regimen in adults who have been virologically inhibited for at least 6 months. Clinical studies of this preparation show that the drug is well tolerated, is metabolizable and offers additional benefits, such as improving the lipid profile, improving bone mineral density and reducing bone resorption. Undoubtedly, longer observation of the effects of this drug therapy is needed, but this dual scheme seems to be a promising strategy for patients infected with HIV [20].
In terms of applied cART, the best parameters in the assessment of kidney injury in HIV-infected patients were NGAL, GST-π and NPT. The high levels of NGAL observed in HIV-infected patients reflect kidney damage independently of the cART therapy.
Our study also showed that the highest level of NPT was in subgroup I with patients on cART including TDF with a reduced eGFR value.
Different results were observed in the case of GST-π, whose median levels were highest in subgroup III and IV. The high level in cART-naïve patients suggests that this parameter may reflect the state of renal function resulting from direct action of the virus. Further channels that are the location of GST-π are made of a thick epithelial layer with high electrical resistance, which makes them less susceptible to toxic damage than proximal tubules [21]. The differences in the concentration of GST-π isoenzyme among treated and untreated patients found in our study suggest that the determination of this isoenzyme could be a clue in deciding whether to start cART. This is especially important in cases where the viral load is not yet an indication of the need to implement therapy, especially in the case of HIVAN patients with undetectable levels of HIV-RNA in the blood [22].
Kidney injury molecule-1 is undetectable in the tissues of a healthy kidney. However, it exhibits intensified expression and increased synthesis in response to renal tubule damage. It has been shown that there is a specific increase of KIM-1 in the case of ischemic and toxic kidney damage. The increase in the concentration of this glycoprotein may imply parenchymal dysfunction. On the other hand, KIM-1 may, as a result of interaction with other molecules, form a protective film on the surface of the proximal tubule cells and thereby modulate the course of kidney damage [13–25].
Jotwani et al. [26] showed that the urine level of KIM-1 was 12% higher in HIV-infected patients as compared with HIV-uninfected participants. HIV infection was associated with a 16% higher urine KIM-1/creatinine ratio, demonstrating the usefulness of urinary KIM-1 as a marker for screening and quantifying kidney injury in HIV-infected individuals.
A higher concentration of KIM-1/creatinine was also observed in HIV-infected patients receiving antiretroviral therapy as compared to healthy individuals, although the difference was not statistically significant [27].
Neutrophil gelatinase associated lipocalin present in the plasma undergoes glomerular filtration, and then is mostly reabsorbed in the proximal tubules by endocytosis. So the presence of NGAL in the urine is caused by the impairment of reabsorption resulting from damage to the proximal tubules. Additionally, the reason for its possible detection in urine may also be increased de novo synthesis of NGAL in the subsequent sections of the nephron, especially in Henle’s loop and distal tubules [28].
The use of NGAL measurements in monitoring of CKD is proposed, where NGAL levels in urine of these patients increase significantly. In studies conducted by Sola-Del Valle et al. [29, 30] significantly elevated values of urinary NGAL concentration were observed in HIV-associated nephropathy (HIVAN) patients in comparison with other types of chronic kidney disease. The present authors support the usefulness of this parameter in identifying HIV-related nephropathy.
In the study by Silva Junior et al. [31] HIV patients were assigned to 3 groups: without cART, cART with TDF, and cART with zidovudine. In the biological samples (serum and urine) syndecan-1, NGAL, monocyte chemoattractant protein-1 (MCP-1) and KIM-1 were measured. The authors found higher levels of KIM-1 in the TDF group, similar to the results obtained by us. NGAL was higher in HIV patients.
Hall [13] observed that HIV-infected patients had higher median urine levels of NGAL than uninfected patients, and HIV infection was associated with a mean 19% (4–36%) higher NGAL/creatinine ratio, which suggests that HIV-infected patients had more extensive kidney injury than uninfected patients [13]. In HIV-positive outpatients, an elevated urinary NGAL/creatinine ratio was found in 67% of patients [32]. Additionally, urinary NGAL is elevated even before the eGFR is reduced, is reflective of injury in parts of the nephron other than the glomerulus, and has independent associations with faster kidney function decline and mortality risk in HIV-infected patients [33].
In the study of Amirayan-Chevillard et al. [34] the effects of dual reverse transcriptase inhibitor (RT) therapy and highly active antiretroviral therapy (HAART) on NPT levels in patients with HIV infection were compared to HIV uninfected controls. Significantly higher plasma circulating levels of NPT were found in HIV-positive patients compared to HIV-negative controls. In patients with a high viral load (> 100,000 copies/ml) the NPT levels were significantly higher than in patients with a low viral load (< 20,000 copies/ml).
Neopterin is a nonspecific marker of a cell-mediated immune response and macrophage activation. Neopterin secretion is closely related to the ability of monocytes/macrophages to release reactive oxygen species (ROS). Therefore, not only the extent of the cellular response, but also the severity of the oxidative stress can be estimated based on NPT measurements [35, 36]. Measurements of NPT concentration in body fluids (serum, urine) are considered a sensitive parameter in monitoring the cellular immune response. Thus, the determination of its concentration is not only conducive to rapid diagnosis, but it is also useful in predicting disease progression [37].
A study by Nübling et al. [38] was conducted to assess the diagnostic sensitivity of NPT screening of blood donors with regard to the detection of HIV, hepatitis C virus (HCV), and hepatitis B virus (HBV) infection. A significant association between elevated NPT level and the very early phase of HIV-1 infection was found. No significant correlation could be observed between NPT levels and the early phase of HCV or HBV infection. The authors concluded that NPT screening of blood donors may identify cases of HIV, but not of HCV or HBV infection.
In the study of Pecoits-Filho et al. [39] the relationship between inflammation and glomerular filtration rate (GFR) in patients was analyzed by measurement of the levels of high-sensitivity C-reactive protein (hsCRP), tumor necrosis factor-α (TNF-α), interleukin-6 (IL-6), hyaluronan, and NPT in serum and urine. Patients were subdivided into two groups according to median GFR (6.5 ml/min). Marker levels including NPT (serum/urine) were significantly greater in the subgroup with lower GFR values, and a significant negative correlation was noted between GFR and NPT. These results show that a low GFR value is associated with an inflammatory state, suggesting impaired renal elimination of proinflammatory markers including NPT.
In HIV infection, the concentration of NPT increases as the disease progresses, reaching the maximum in full-blown AIDS. A negative correlation was observed between its concentration and the LT CD4+ count in this disease. Already in the early stages of infection NPT reaches high values [18]. Uysal et al. [40] found a negative correlation between NPT, measured both in urine and in serum, and the LT CD4+ count in HIV-infected patients.
Glutathione transferases play an important role in the metabolism and detoxification of various endogenous substances and xenobiotics [41, 42]. They catalyze the coupling reactions of glutathione with, among others, drugs and environmental carcinogens. The diverse location of α- and π-GST in kidney cells makes it possible to use the determination of these isoenzymes in the assessment of renal function. It has been proven that GST-π is present in the distal tubules and Henle’s loop. The presence of GST-α is limited to the proximal tubules [43]. Changes in the levels of both isoenzymes GST-α and GST-π located in different fragments of nephrons allow the site of damage to be assessed indirectly.
Only one study concerning GST-π examination in HIV patients has been found in the available scientific literature. In the light of the fact that HIV-associated nephropathy (HIVAN) in sub-Saharan Africa remains a significant cause of morbidity and mortality in children, Nandlal et al. [44] determined the urinary concentrations of KIM-1 and GST-π in children with idiopathic focal segmental glomerulosclerosis (FSGS) and HIVAN. A significant increase in urinary KIM-1 levels was observed in the HIVAN group compared with the HIV-positive patients, but no statistically significant differences were noted in urinary GST-π levels in study groups. This indicates lower usefulness of GST-π measurement to assess kidney injury in such patients.
Table III shows the indicators (sensitivity; specificity; PPV, NPV LR+/– with 95% CI) of the parameters tested with the best diagnostic value.
Based on the assessment of indicators determining the diagnostic value of the parameters tested, NPT, NGAL and GSTα should be distinguished as potential parameters in screening tests of HIV-infected patients with GFR < 90 ml/min and of HIV-patients with reduced GFR (GFR < 90 ml/min) co-treated with TDF.
The value of the area under the ROC curve (AUC) in the range 0.7–0.8 is a fair diagnostic value.
Studies conducted on patients with HIV have some limitations. First of all, HIV-infected patients are reluctant to participate in scientific research. Many patients should be eliminated from the study due to accompanying diseases or abuse of various medications or systematic use of cART. Finding clinical parameters that are non-invasive to assess early kidney dysfunction in these patients is important. Therefore, we believe that our research may be useful in monitoring the safe use of cART therapy in patients with HIV. The advantages of the research are the relatively low cost and short waiting time for the result. However, the research should be extended to more HIV-infected patients and for longer follow-up to confirm its diagnostic and clinical usefulness.
In conclusion, our study shows that the analyzed parameters are useful in the assessment of kidney dysfunction in HIV-infected patients. The NPT reflects the disease progression associated with HIV infection and may be useful for assessing the effectiveness of cART therapy. NPT, NGAL and GST-α should be distinguished as potential parameters in screening tests of HIV-infected patients. Future studies should be conducted on larger groups of HIV patients for better estimation of diagnostic usefulness of the examined LMWP.