

Introduction
Characterized by severe and sudden hepatic damage that may be induced by exposure to toxins, alcohol, viruses, bacteria, or chemicals, acute liver failure (ALF) can lead to severe infection, hepatic encephalopathy, as well as multiple organ failure [1]. Currently, artificial livers and orthotopic liver transplantation (OLT) are used as the two major modalities of treatment for clinical intervention of ALF. Nevertheless, the lack of liver donors as well as the tendency for the onset of complications after liver transplantation operations have significantly limited the clinical applications of OLT [2]. As a naphthoquinone compound derived from the roots of Lithospermum erythrorhizon, a herbal medicine frequently used in treatments with traditional Chinese medicine, shikonin, whose chemical formula is C16H1605, shows significant efficacy in the treatment of skin diseases, sore throat, as well as burns [3, 4]. In addition, growing evidence demonstrates that shikonin (SKN) can be used as an anti-cancer agent to induce the programmed death of a wide range of tumor cells [5, 6].
As a type of small non-coding RNA transcripts, microRNAs (miRNAs) have been shown to affect post-transcriptional regulation of target genes [7, 8]. In addition, it is suspected that miRNAs can regulate the expression of up to 70% of genes in the human genome [9]. Furthermore, miRNA dysfunction has been discovered in a wide range of diseases and disorders such as type 2 diabetes, malignant tumor, as well as cardiovascular disorders [10–12]. Specifically speaking, miR-106b can promote the occurrence of tumor metastasis in liver cancer as well as in colorectal cancer [13, 14]. The altered expression of miR-106b induced migration, invasion and proliferation in breast cancer [13]. Also miR-106b was correlated with higher tumor grade and was reported to promote cell migration, stress fiber formation and HCC metastasis [14]. MiR-106b has also been implicated in the regulation of tumor cell invasion as well as in the migration of different types of tumor cells [15, 16]. Moreover, it was proved that miR-106 could inhibit the lipopolysaccharide (LPS)-induced increase in TNF-α secretion by targeting IL-1 receptor-associated kinase 4 (IRAK4) in LPS-treated mice, indicating that miR-106 signaling is involved in the pathogenesis of ALF [17]. Meanwhile, miR-34a, which is located on human chromosome 1p36.23, frequently shows aberrant expression in a wide range of cellular activities including the induction of apoptosis, cell cycle arrest, and differentiation, or reduces migration [18]. A previous report also showed that the miR-34 family members are direct p53 targets, and their up-regulation induces apoptosis and cell cycle arrest [18]. Ectopic miR-34a induces apoptosis when reintroduced into neuroblastoma cell lines [18]. Furthermore, quite a few genes, such as MET, CDK6, CDK4, CCNE2, CCND1, NMYC, as well as SIRT1, have been identified as targets of miR-34a [19].
As an important anti-apoptotic factor in the BCL-2 family, MCL1 is inhibited by S63845, a molecule with significant effects on the treatment of blood cancers but limited effects on the treatment of solid tumors [20, 21]. Although MCL1 can be stabilized by USP9X as well as USP13, the expression of USP9X is primarily limited in the immune system and the brain, although it can act as a tumor suppressor [22–25].
Mutations in the TP53 gene can be found in many human malignancies and usually lead to a poorer prognosis [26, 27]. By encoding a transcription factor whose expression is normally low in normal tissues, TP53 can be activated upon DNA damage or in the presence of other types of intracellular stress, so as to stabilize the activity of p53 as well as to promote cell apoptosis and senescence by inducing arrest of cell cycle progression [28–31]. In fact, most mutations in the TP53 gene can be found in its DNA binding domain to disrupt the transcriptional activity of TP53, thus inducing abnormal proliferation as well as uncontrolled growth of mutant cells [32].
Treatment with SKN suppresses the expression of miR-34a. SKN was reported to inhibit adipogenic differentiation by regulating the expression of miR-34a [33], while miR-34a could in turn enhance the anti-tumor activity of SKN [34]. Also, SIRT1, a regulator of TP53, is demonstrated to be a target of miR-106 [35]. Meanwhile, SIRT1 is a target gene of miR-34a [36, 37]. In this study, we treated an animal model of ALF with high and low doses of SKN to investigate the effect of SKN on liver functions and the SKN/miR-106/MCL1 and SKN/miR-34a/SIRT1/TP53 signaling pathways.
Material and methods
Animal model
In this study, C57BL/6J mice aged 5 to 6 weeks old were used as research objects. These mice were randomly divided into four groups: a SHAM group (injected with a negative control using PBS as vehicle); an ALF group (used as the positive control); a group of ALF + low dose of SKN (ALF mice treated with a low dose of SKN); and a group of ALF + high dose of SKN (ALF mice treated with a high dose of SKN). SKN was extracted from boraginaceous plants and the purity was 99.3%. To establish the ALF mouse model, the mice were given intraperitoneal injections of 10 μg/kg of LPS (Sigma-Aldrich, St Louis, MO) and 400 mg/kg of D-GalN (Sigma-Aldrich, St Louis, MO). In addition, the mice in the SKN groups were administered 1.0 mg/kg (high dose group of SKN) and 0.5 mg/kg (low dose group of SKN) SKN via tail vein injection immediately after stimulation with LPS and GalN. During the experiment, LPS intraperitoneal injections were given for 3 days once a day, followed by another 7 consecutive days of SKN injection for the ALF + low/high dose of SKN, as described previously with slight modification [38]. At the end of the 10-day drug administration, the animals were euthanized via cervical dislocation and their serum and liver tissue samples were harvested to evaluate the status of liver damage as well as the expression of various target genes to be analyzed in this study.
RNA isolation and real-time PCR
In this study, a miRNeasy Mini assay kit (Qiagen, Germantown, MD) was used to isolate miRNA content from collected serum, tissue and cell samples (< 200 nt) in accordance with the instructions of the kit manufacturer. In addition, total RNA content in all samples was isolated using a Trizol reagent (Invitrogen, Carlsbad, CA). In the next step, isolated miRNA or total RNA samples were reverse transcribed into cDNA using a SuperScript III reverse transcription assay kit (Invitrogen, Carlsbad, CA) in conjunction with random primers based on the protocol suggested by the manufacturer. Subsequently, real-time PCR was carried out using a SYBR Green Master Mix (Toyobo, Osaka, Japan) to determine the relative expression of miR-106, miR-34a, MCL1, SIRT1 as well as TP53 in various samples. During the calculation of relative expression of target genes using the ∆Ct method, the expression of U6 (for miRNAs) and GAPDH (for mRNAs) served as the internal control.
Cell culture and treatment
LO2 cells were acquired from the Cell Bank of the Chinese Academy of Sciences (Shanghai, China) and maintained in an environment of 37°C, 5% CO2, 95% air, and saturated humidity. The culture medium was ordinary DMEM (Gibco, Thermo Fisher Scientific, Waltham, MA) supplemented with 10% fetal bovine serum and appropriate antibiotics. When the cells reached more than 60% confluency, they were divided into three groups, i.e., a negative control group, a 1 mM SKN group and a 5 mM SKN group. The cells in the negative control group were treated with PBS, while the cells in the SKN groups were treated with the corresponding concentrations of SKN. The cells were treated for 48 h in the presence of PBS or SKN, and were then harvested to assay their expression of different target genes.
Vector construction, mutagenesis and luciferase assay
Since miR-34a and miR-106 were shown previously to regulate the expression of SIRT1 and MCL1, respectively, a luciferase assay was carried out in this study to determine the regulatory relationship between miR-34a and SIRT1 as well as the regulatory relationship between miR-106 and MCL1. In brief, the promoters of MCL1 and SIRT1 containing binding sites for miR-106 and miR-34a, respectively, were amplified and cloned into pcDNA vectors (Promega, Madison, WI) to generate wild type vectors of MCL1 and SIRT1, respectively. Then, site-directed mutagenesis was carried out using a Quick Change II mutagenesis assay kit (Stratagene, San Diego, CA) following the standard protocol in the kit manual. LO2 cells were then cultured to reach logarithmic growth before they were co-transfected with vectors carrying miR-34a and SIRT1, or with vectors carrying miR-106 and MCL1. Transfection was carried out using Lipofectamine 3000. Forty-eight hours after the start of transfection, the luciferase activity of transfected cells was measured with a Light Switch luciferase assay kit (Switchgear Genomics, Menlo Park, CA) following the kit instructions.
TUNEL staining
The apoptotic status of hepatocytes in collected liver tissue samples was evaluated using a terminal deoxynucleotidyl transferase dUTP nick end labeling (TUNEL) staining kit (Thermo Fisher Scientific, Waltham, MA) in accordance with the instructions provided by the manufacturer.
Western blot analysis
Western blot was carried out to determine the protein expression of MCL1, SIRT1 as well as TP53 in collected samples. In brief, the samples were lysed in a RIPA buffer (Beyotime, Wuhan, China) and centrifuged to collect the supernatant, which was used as the protein sample and loaded onto the 10% SDS-PAGE gel. After being resolved by the 10% SDS-PAGE gel, the resolved proteins were blotted onto a PVDF membrane (Millipore, Burlington, MA), washed with PBS, blocked with 5% skim milk, and incubated consecutively with primary anti-MCL1 (dilution 1 : 1000, Abcam, Cambridge, MA), anti-SIRT1 (dilution 1 : 1000, Abcam, Cambridge, MA) and anti-TP53 antibodies (dilution 1 : 1000, Abcam, Cambridge, MA) and secondary HRP-conjugated antibodies (dilution 1 : 2000, Abcam, Cambridge, MA). Finally, after colorization with an enhanced chemiluminescence reagent, the protein bands of MCL1, SIRT1 and TP53 were analyzed under a Bio-Rad imager (Bio-Rad Laboratories, Hercules, CA). The protein expression of β-actin was used as the internal control to calculate the relative expression of MCL1, SIRT1 and TP53 in various samples.
Statistical analysis
The analysis of experimental results was carried out using SPSS software version 17.0 (SPSS Inc., Chicago, IL) in conjunction with Prism software version 8.0 (GraphPad Software, La Jolla, CA). Student’s t-test was applied to compare the data between two groups with normal distribution, while the non-parametric Mann-Whitney U-test was applied to compare the data between two groups with non-normal distribution. Spearman’s correlation coefficient was utilized to evaluate the regulatory correlation between a miRNA and its target mRNA. A p-value of 0.05 indicated statistical significance.
Results
Shikonin reduced liver inflammation in a dose-dependent manner
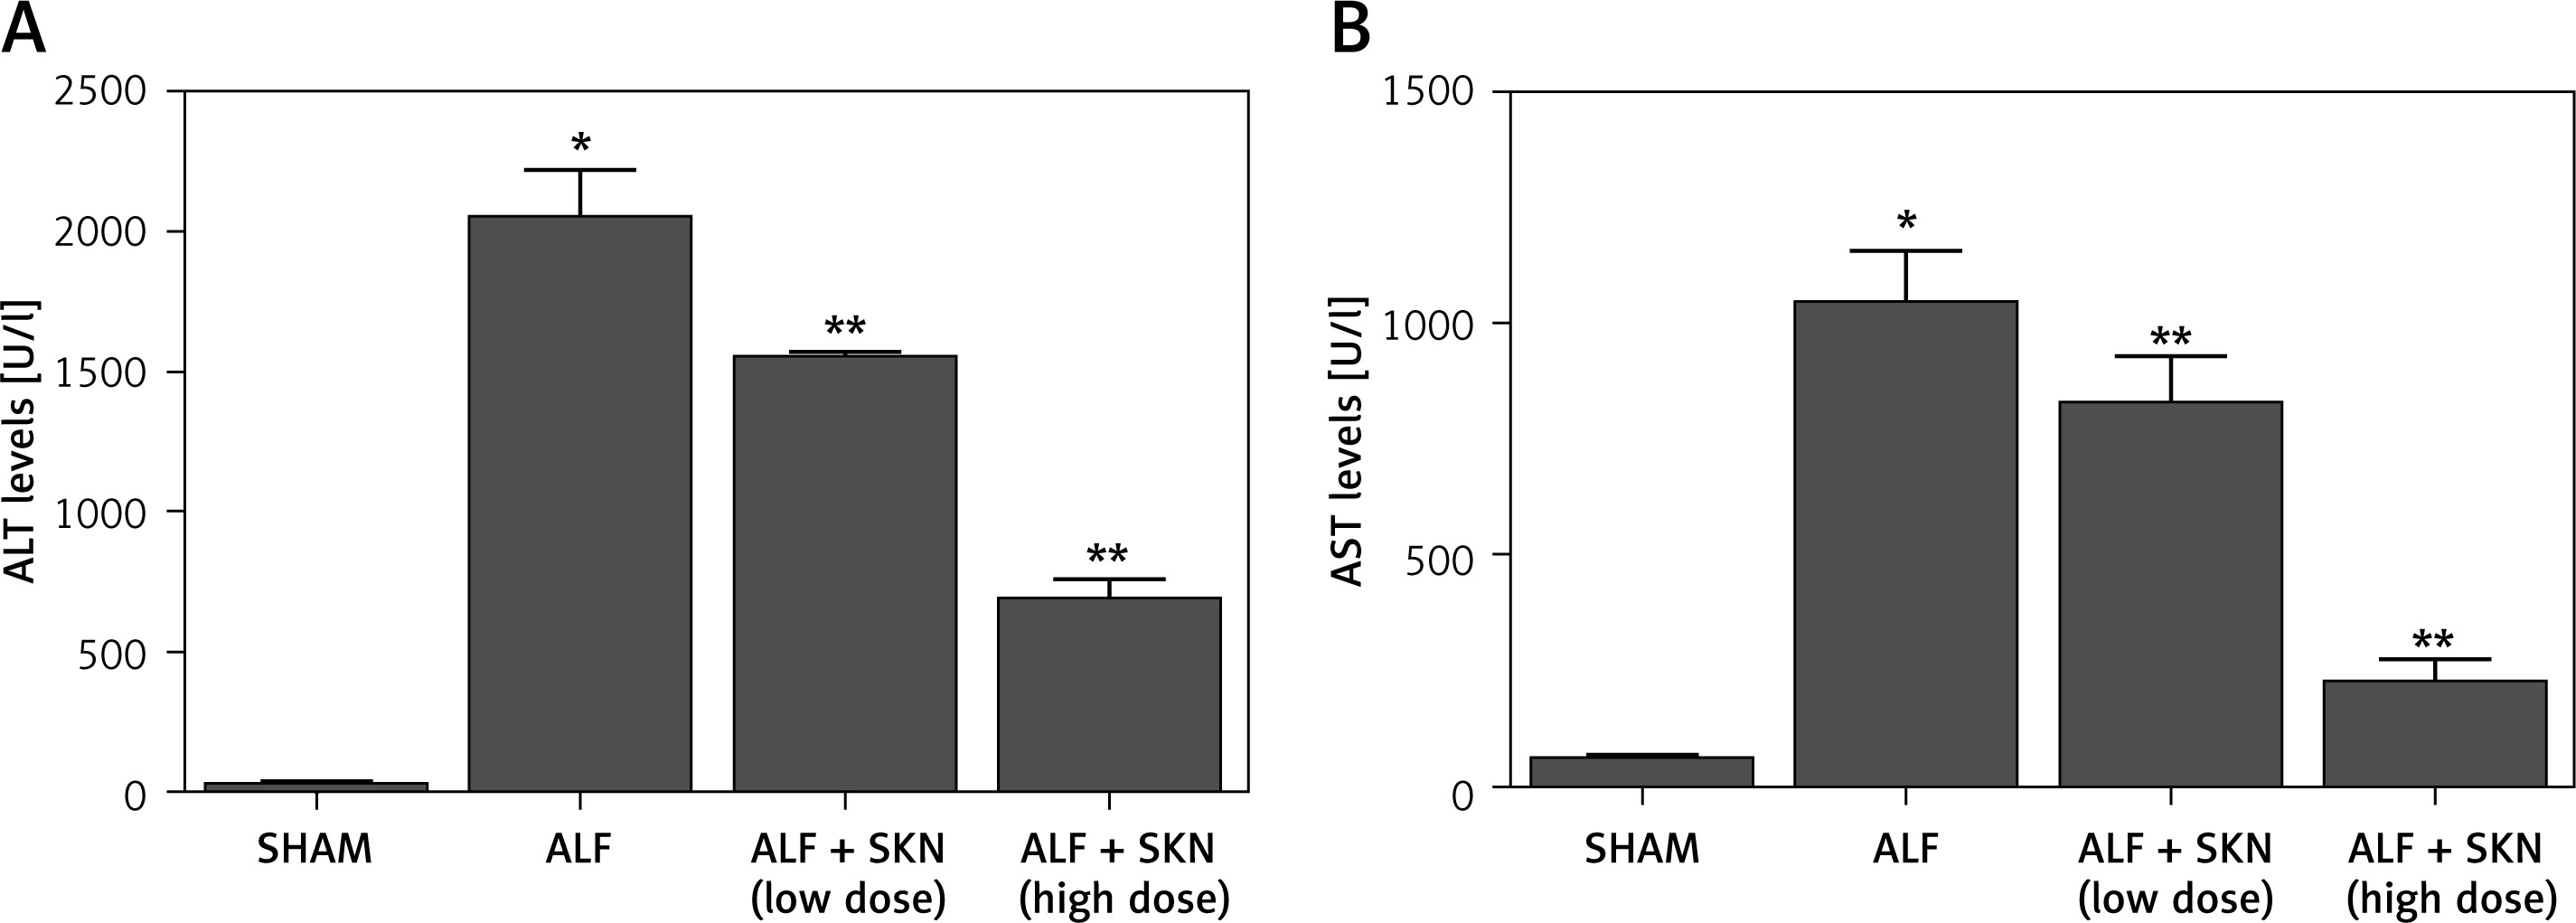
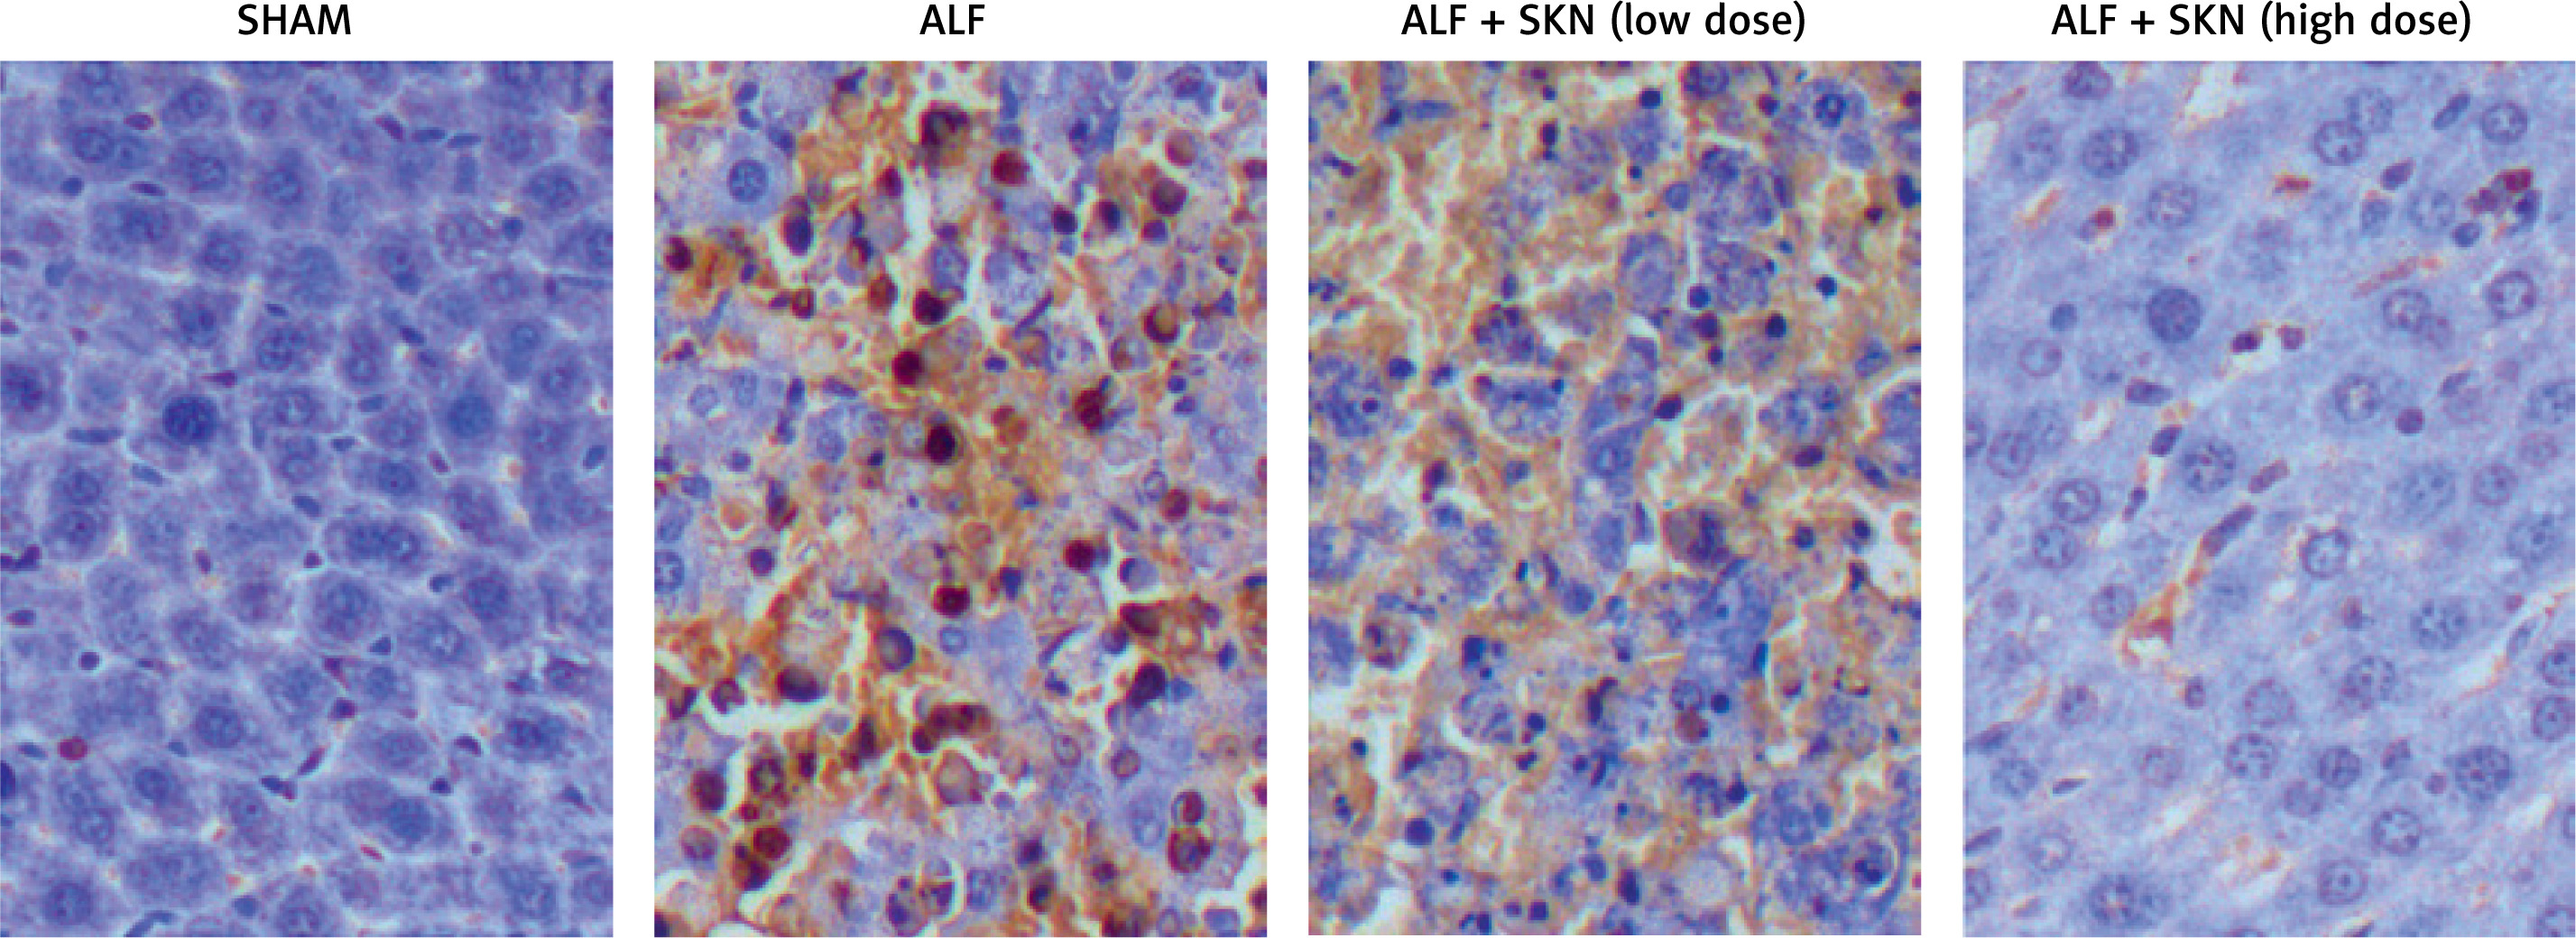
In this study, an ALF mouse model was established with C57BL/6J mice. As shown in Figure 1, the serum levels of alanine aminotransferase (ALT) and aspartate aminotransferase (AST) were the lowest in the control group and the highest in the ALF group. Treatment with SKN decreased the levels of ALT and AST to a certain extent, while the effect of SKN increased as its dose increased. Moreover, to quantify the status of hepatocyte apoptosis of the animal groups, TUNEL staining results showed that the treatment with SKN could significantly decrease the number of apoptotic hepatocytes in a dose-dependent manner (Figure 2). These results suggested that SKN may protect the liver during ALF via reducing the level of inflammation.
Figure 1
Shikonin decreased serum levels of ALT and AST in a dose-dependent manner. A – serum levels of ALT in SHAM, ALF, ALF + SKN (low dose group) and ALF + SKN (high dose group) groups. B – serum levels of AST in SHAM, ALF, ALF + SKN (low dose group) and ALF + SKN (high dose group) groups
*p-value < 0.05 vs. SHAM group; **p value < 0.05 vs. ALF group, ALF – acute liver failure, ALT – alanine aminotransferase, AST – aspartate aminotransferase, SKN – shikonin.
Expression level of miR-106 and miR-34a in liver tissues among various groups of the mouse model
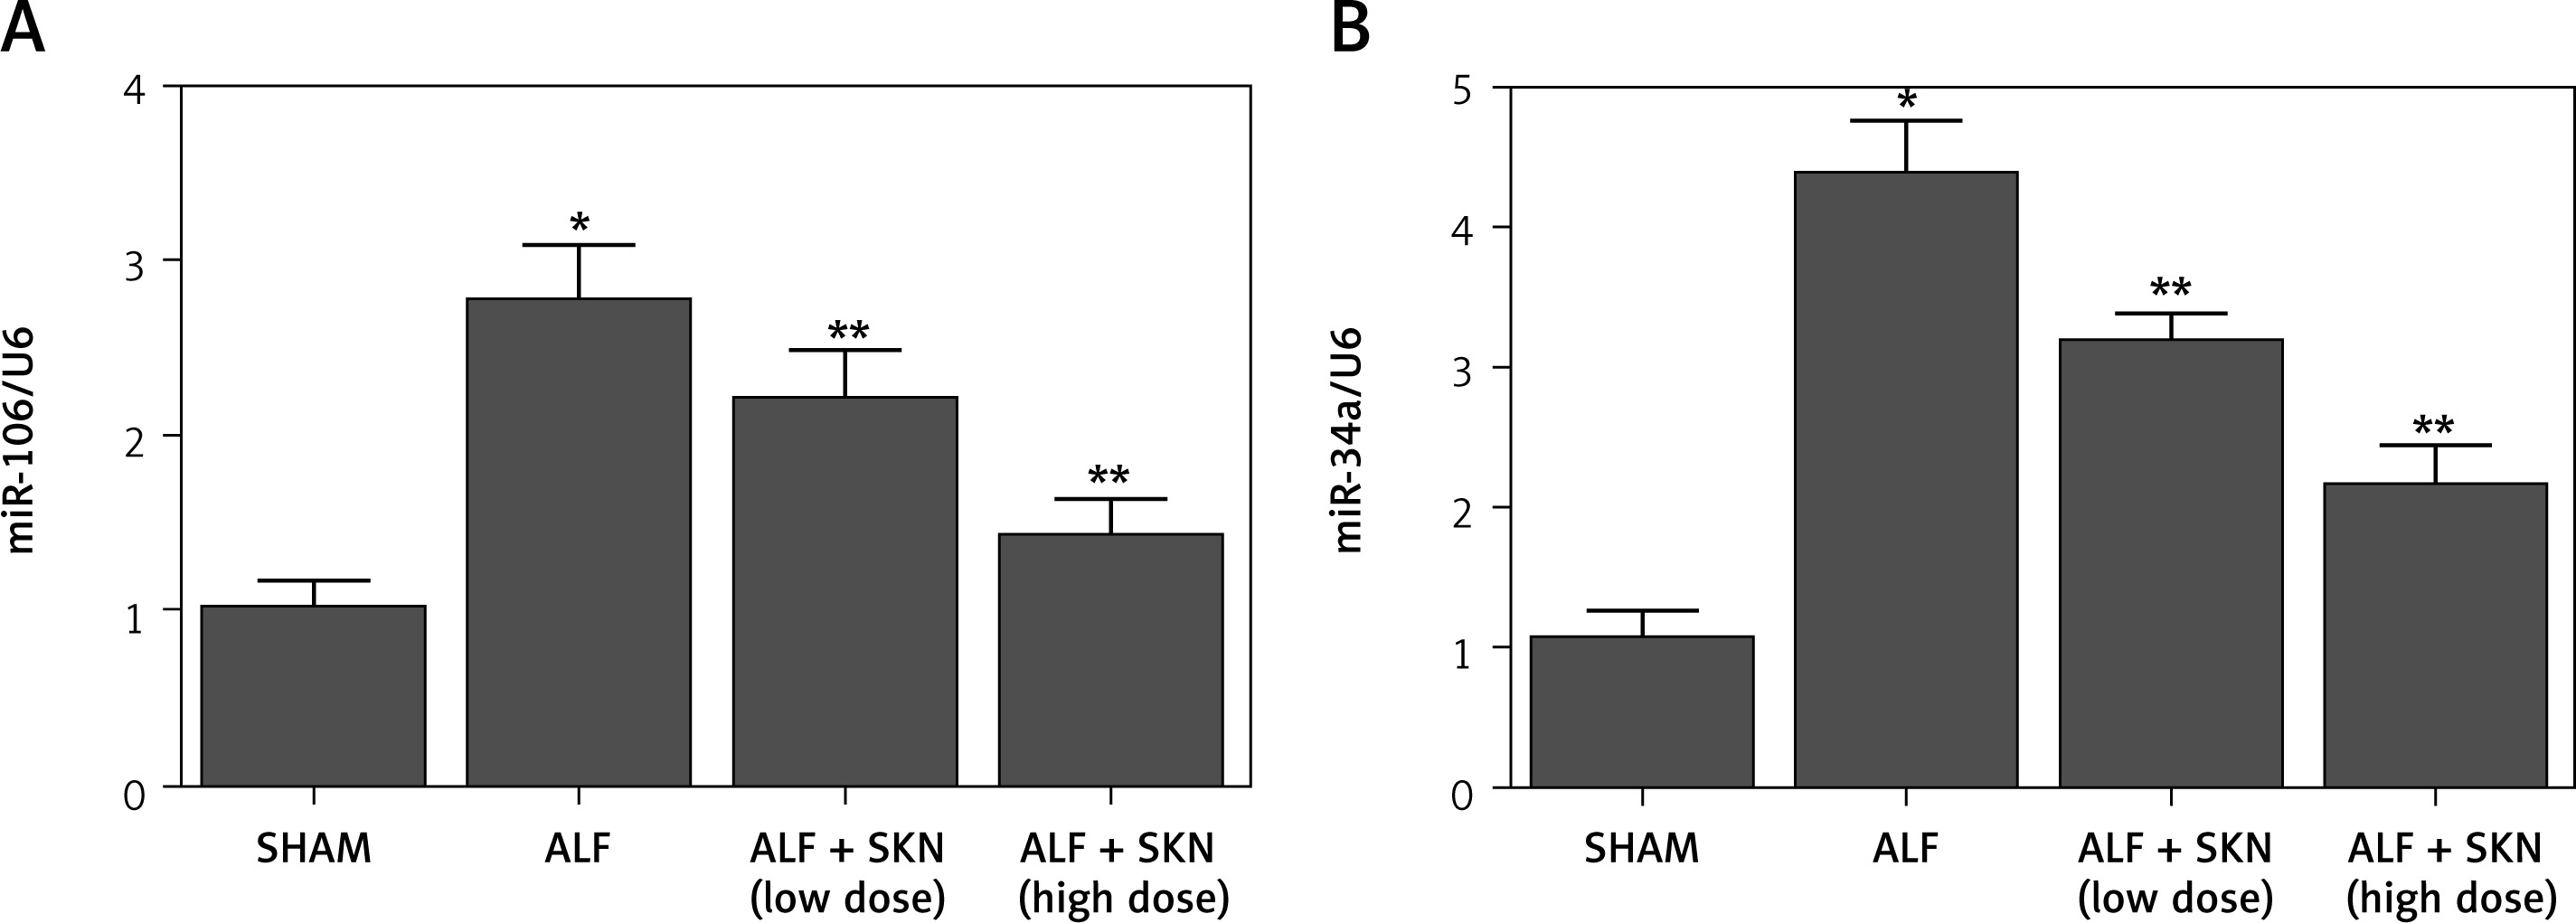
It was observed that the treatment with SKN suppressed the expression of miR-106 and miR-34a. Subsequently, the liver tissues of mice in various groups were collected for RT-qPCR to test the expression levels of miR-106 and miR-34a. As shown in Figure 3, miR-106 and miR-34a expression was reduced by SKN in a dose-dependent manner.
Figure 3
Expression levels of miR-106 and miR-34a among mouse liver tissues of SHAM, ALF, ALF + SKN (low dose group) and ALF + SKN (high dose group) groups. A – Expression levels of miR-106 in mouse liver tissues among SHAM, ALF, ALF + SKN (low dose group) and ALF + SKN (high dose group) groups. B – Expression levels of miR-34a in mouse liver tissues among SHAM, ALF, ALF + SKN (low dose group) and ALF + SKN (high dose group) groups
ALF – acute liver failure, SKN – shikonin.
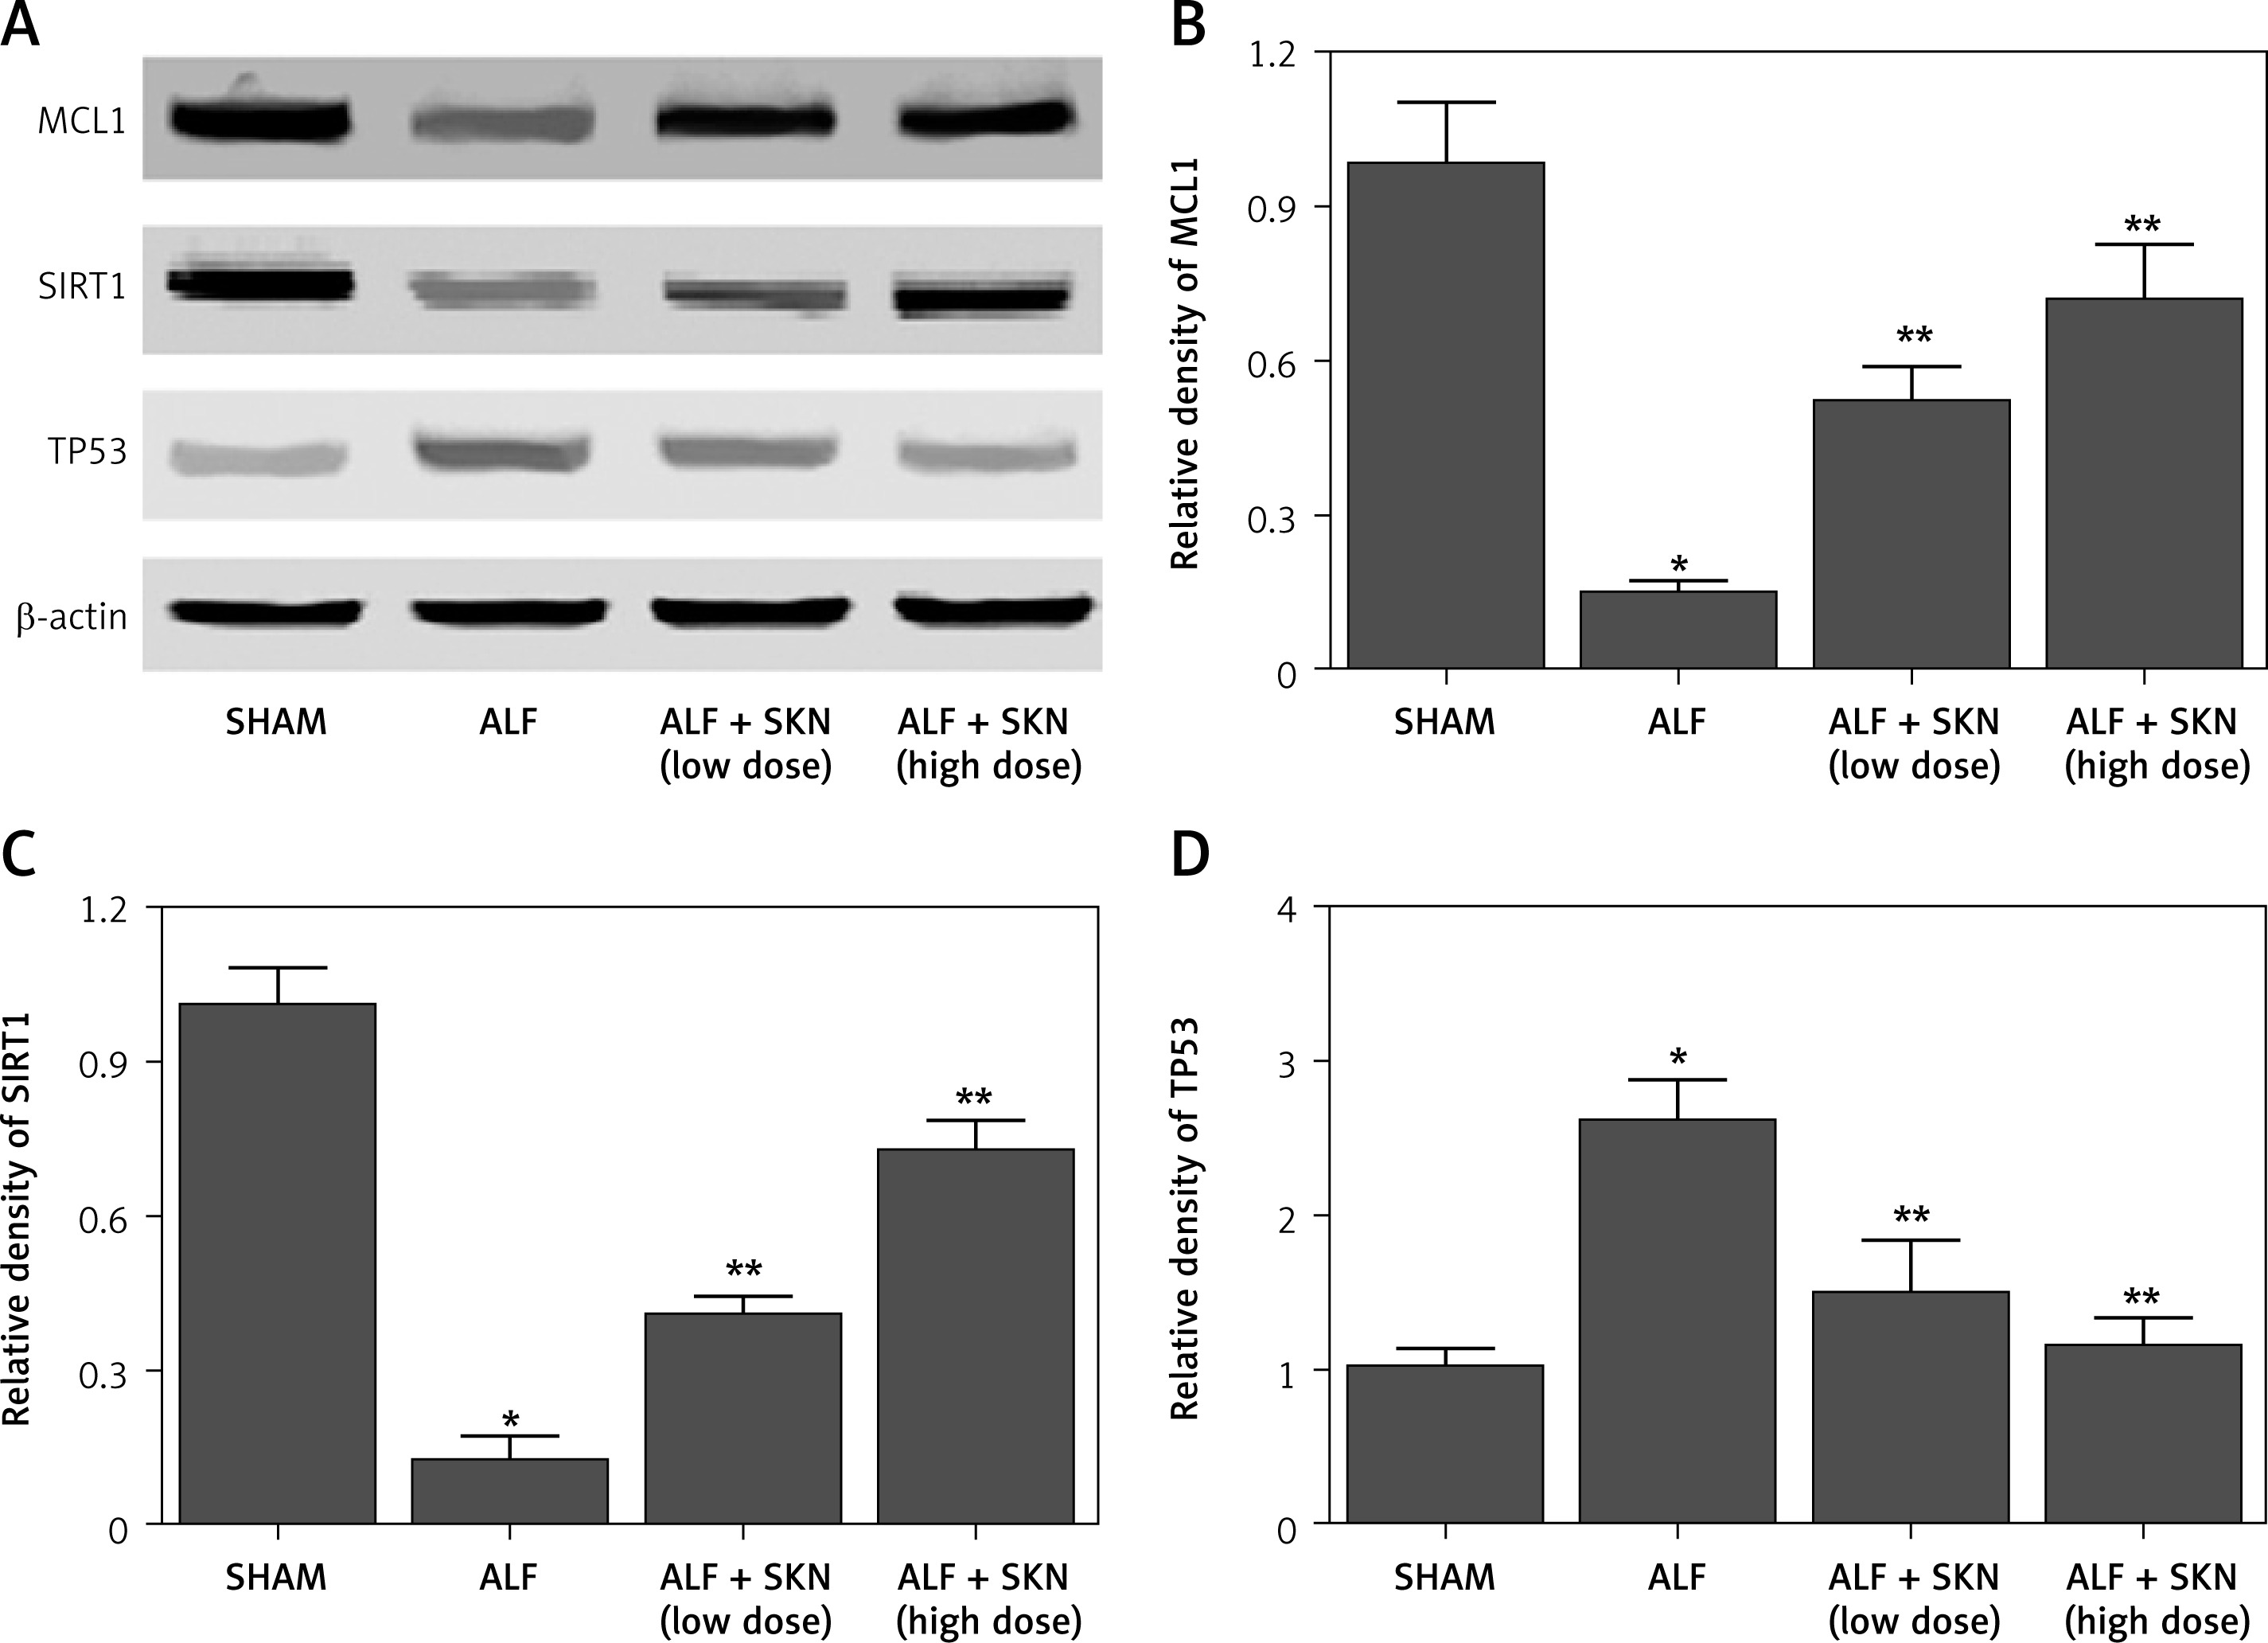
Furthermore, MCL1 and SIRT1 have been identified as targets of miR-106 and miR-34a, respectively, while SIRT1 acts as a regulator of TP53. Thus, we conducted RT-qPCR and Western blot analyses to compare the mRNA/protein levels of MCL1, SIRT1 and TP53 among the four groups. The mRNA and protein levels of MCL1 (Figures 4 A, 5 A, B) decreased in the ALF mouse model, while the treatment with SKN reversed the effects of ALF in a dose-dependent manner. The same tendency was observed in the mRNA/protein levels of SIRT1 and TP53 (Figures 4 B, C, 5 A, C, D).
Figure 4
mRNA levels of MCL1, SIRT1 and TP53 in mouse liver tissues among SHAM, ALF, ALF + SKN (low dose group) and ALF + SKN (high dose group) groups. A – mRNA levels of MCL1 in mouse liver tissues among SHAM, ALF, ALF + SKN (low dose group) and ALF + SKN (high dose group) groups. B – mRNA levels of SIRT1 in mouse liver tissues among SHAM, ALF, ALF + SKN (low dose group) and ALF + SKN (high dose group) groups. C – mRNA levels of TP53 in mouse liver tissues among SHAM, ALF, ALF + SKN (low dose group) and ALF + SKN (high dose group) groups
*p-value < 0.05 vs. SHAM group; **p-value < 0.05 vs. ALF group, ALF – acute liver failure, SKN – shikonin.
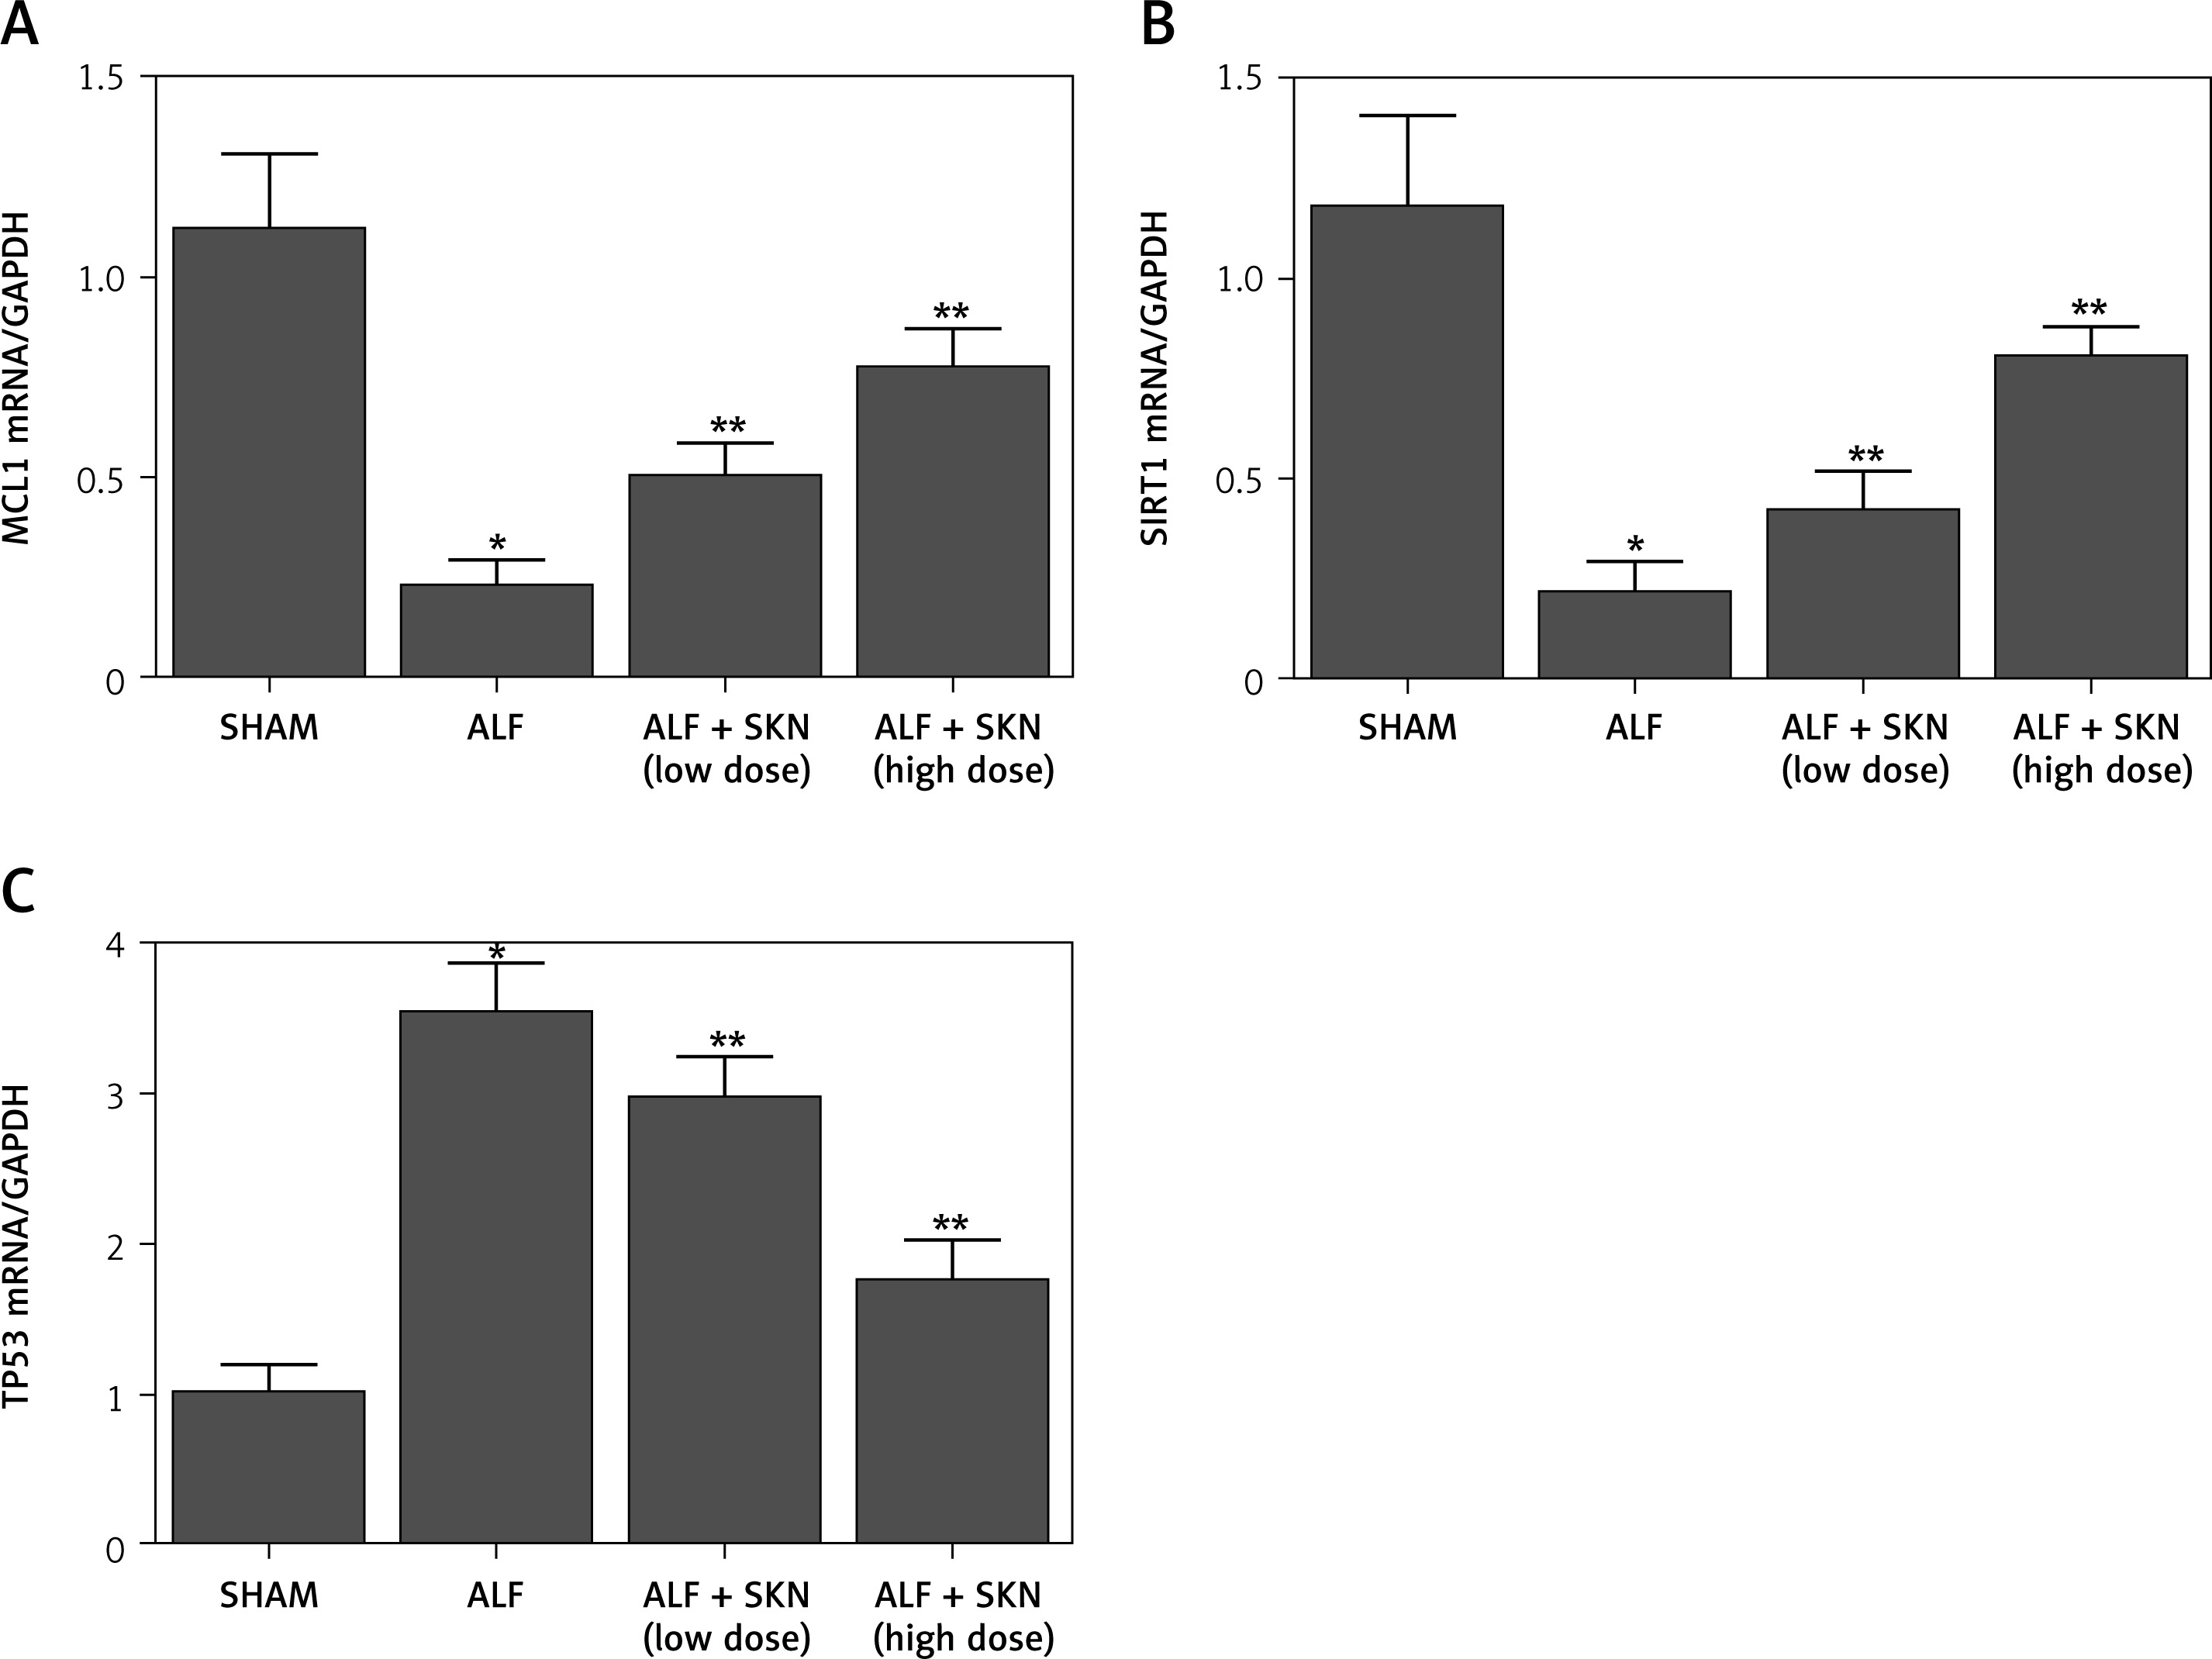
Figure 5
Protein levels of MCL1, SIRT1and TP53 in mouse liver tissues among SHAM, ALF, ALF + SKN (low dose group) and ALF + SKN (high dose group) groups. A – Protein levels of MCL1, SIRT1 and TP53 in mouse liver tissues among SHAM, ALF, ALF + SKN (low dose group) and ALF + SKN (high dose group) groups. B – Relative density of MCL1 proteins in mouse liver tissues among SHAM, ALF, ALF + SKN (low dose group) and ALF + SKN (high dose group) groups. C – Relative density of SIRT1 proteins in mouse liver tissues among SHAM, ALF, ALF + SKN (low dose group) and ALF + SKN (high dose group) groups. D – Relative density of TP53 proteins in mouse liver tissues among SHAM, ALF, ALF + SKN (low dose group) and ALF+SKN (high dose group) groups
*p-value < 0.05 vs. SHAM group, **p-value < 0.05 vs. ALF group, ALF – acute liver failure, SKN – shikonin.
Verification of the miR-106/MCL1 and miR-34a/SIRT1 signaling pathways
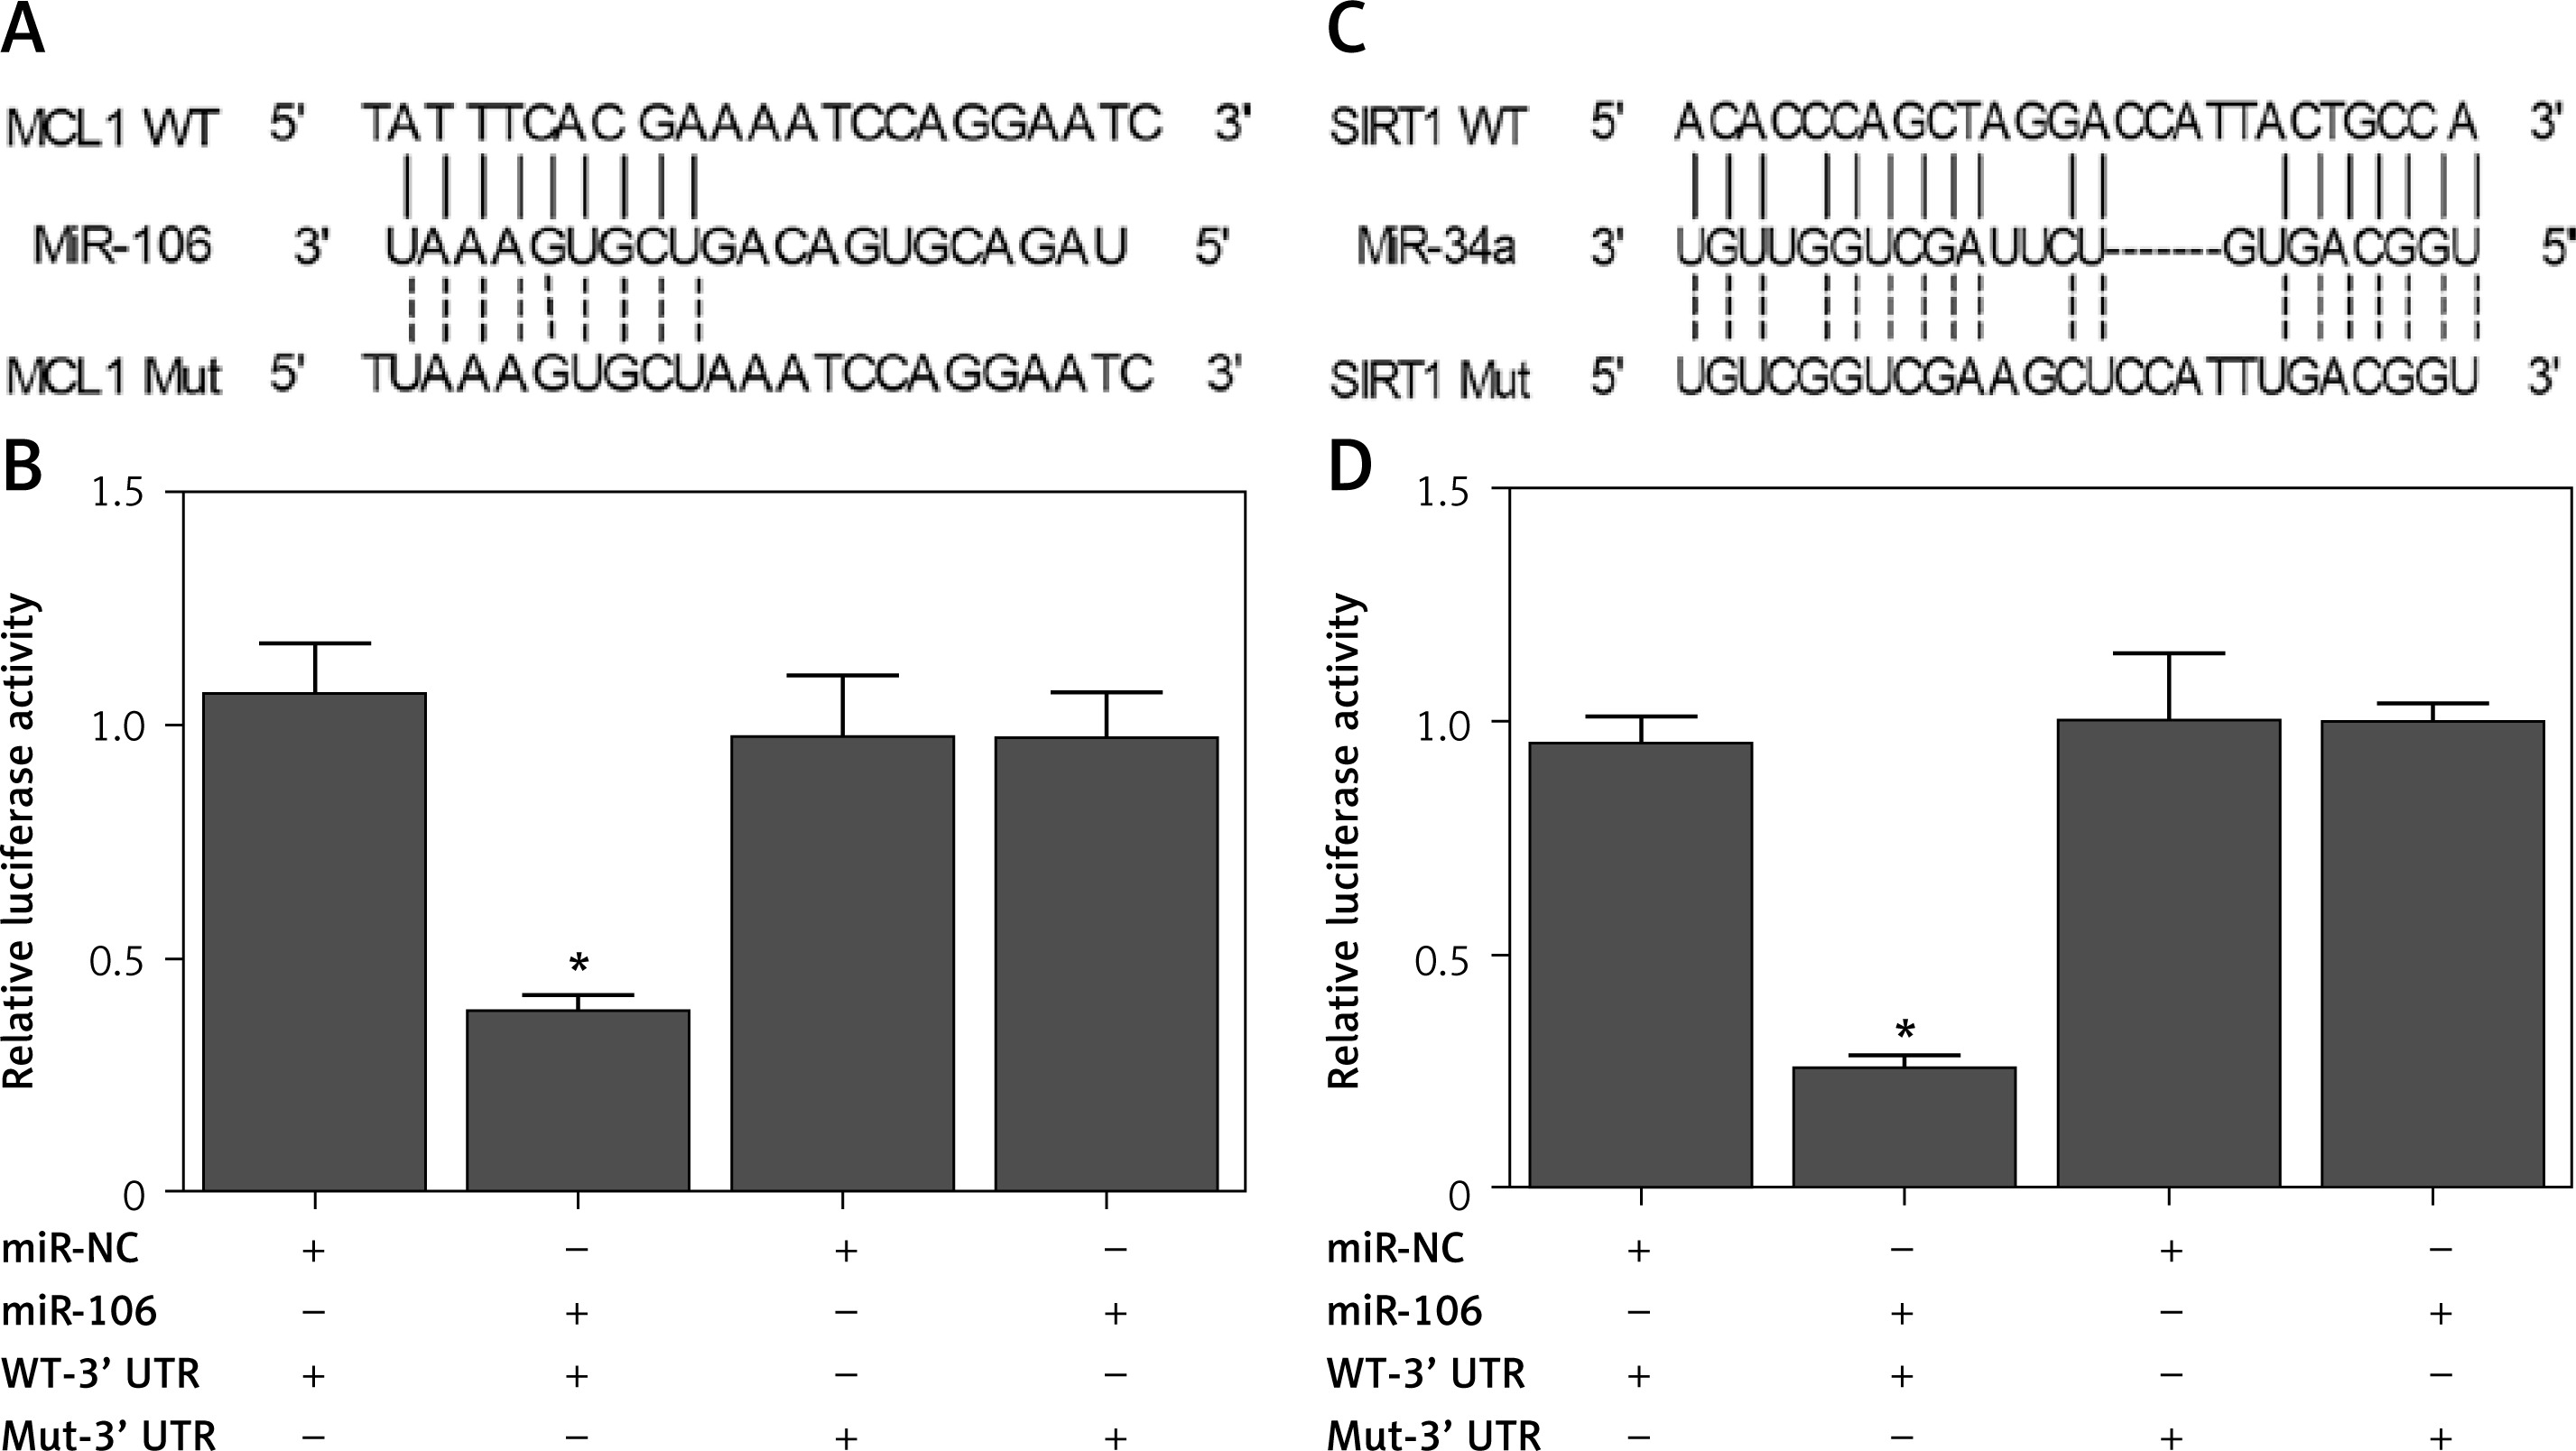
TargetScan, Pictar-Vert, and Microrna.Org were employed to predict the potential targets of miR-106 and miR-34a. MiR-106 contains a binding site for MCL1 (Figure 6 A), while miR-34a contains a binding site for SIRT1 (Figure 6 C). To confirm the prediction, we constructed vectors containing wild-type or mutant MCL1/SIRT1 and co-transfected them into LO2 cells with miR-106/miR-34a or miR-106/miR-34a NC. As shown in Figures 6 B, D, co-transfection of wild type MCL1 and miR-106, or co-transfection of wild-type SIRT1 and miR-34a, significantly decreased the relative luciferase activity in LO2 cells, confirming the binding of miR-106 and miR-34a to MCL1 and SIRT1, respectively.
Figure 6
Luciferase assay carried out to verify the targets of MCL1, miR-106, miR-34a and SIRT1. A – Predicted binding sites between MCL1 and miR-106. B – Luciferase activity of miR-106 in LO2 cells co-transfected with wild-type/mutant MCL1 and miR-106 or miR-106 NC. C – Predicted binding sites between SIRT1 and miR-34a. D – Luciferase activity of miR-34a in LO2 cells co-transfected with wild-type/mutant SIRT1 and miR-34a or miR-34a NC
*p-value < 0.05 vs. miR-NC group.
The effect of SKN is dose-dependent
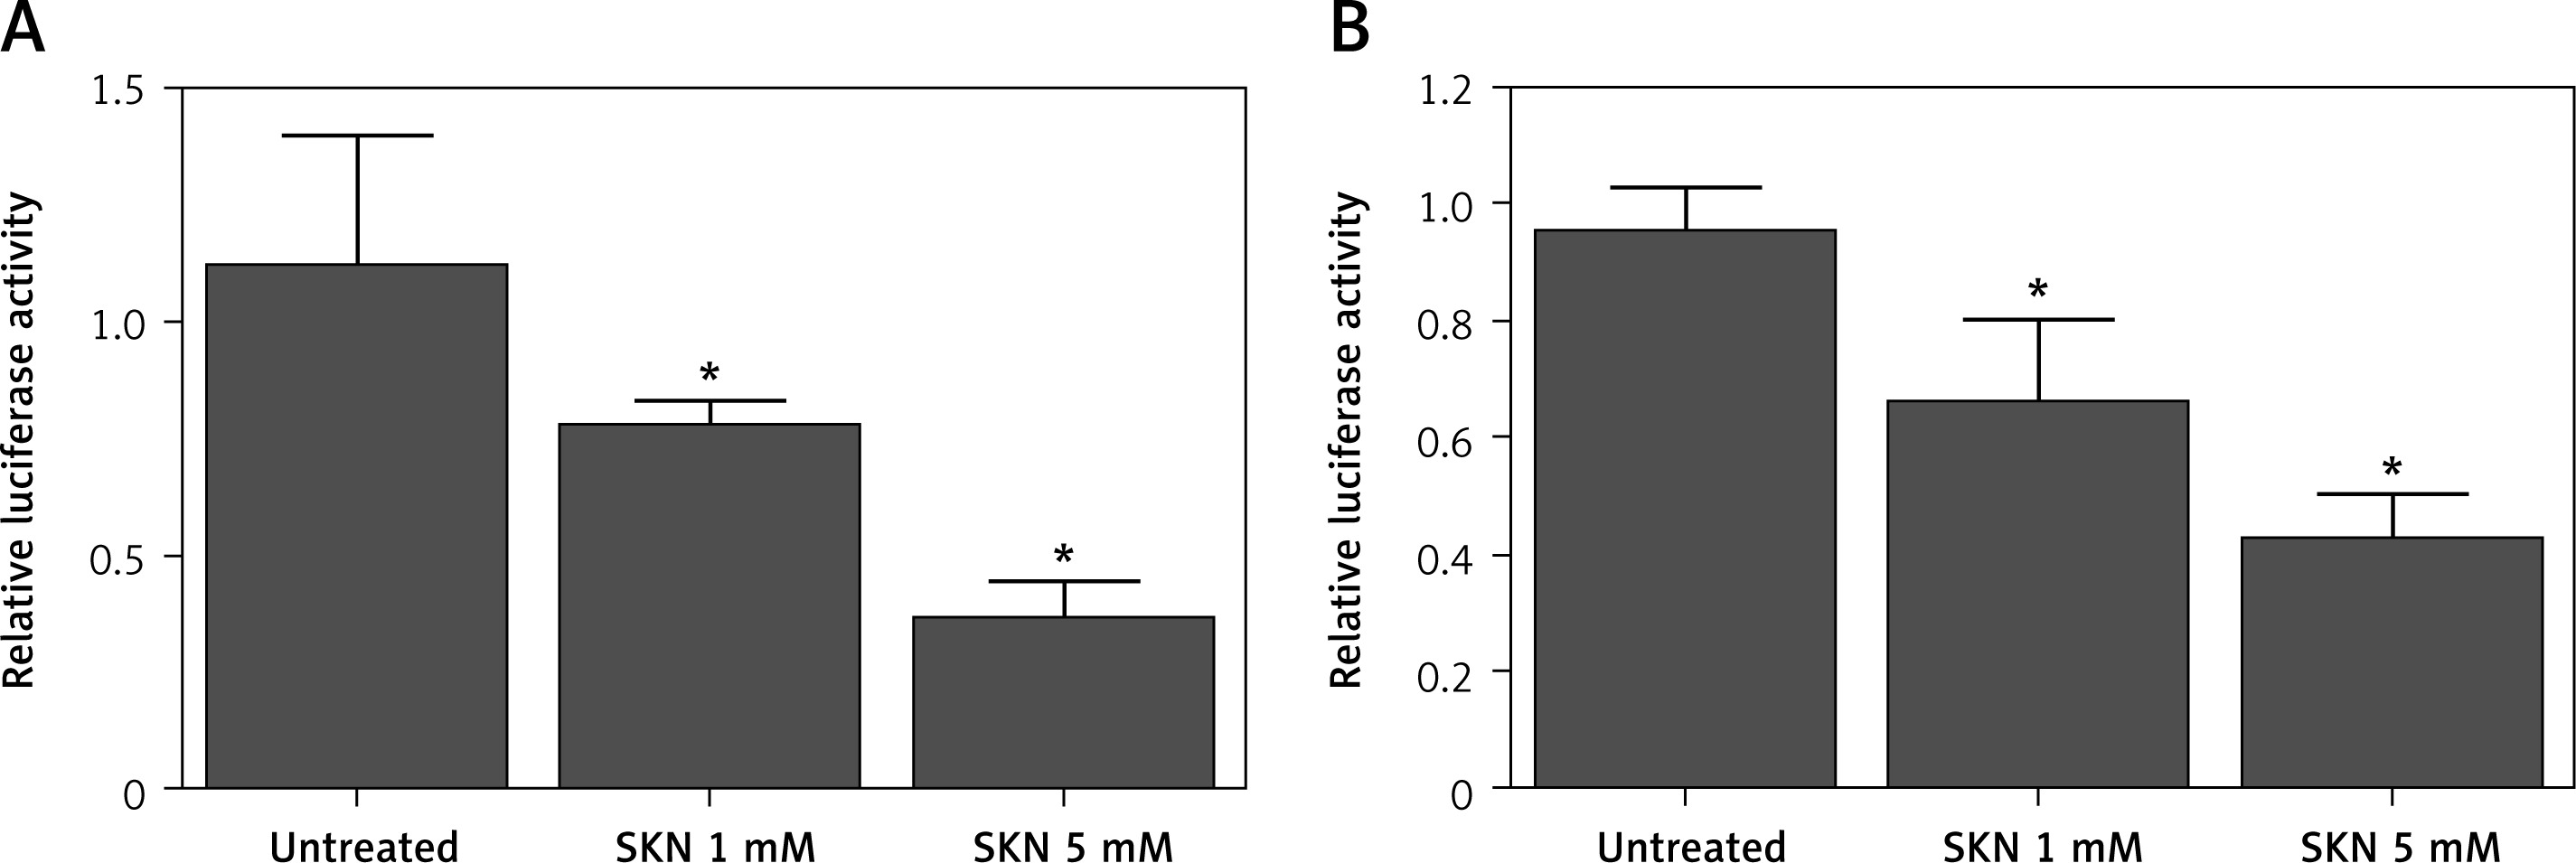
The effects of SKN on miR-106/miR-34a promotors were assessed. LO2 cells were treated with 1 mM or 5 mM SKN before the relative luciferase activity of miR-106/miR-34a was measured. As shown in Figure 7, the luciferase activity which indicated the expression of miR-106 (Figure 7 A) and miR-34a (Figure 7 B) was decreased with a higher dose of SKN.
Figure 7
Effects of SKN on miR-106/miR-34a promotors in LO2 cells treated with 1 mM or 5 mM SKN. A – Luciferase activity of miR-106 in LO2 cells treated with control and 1 mM or 5 mM SKN. B – Luciferase activity of miR-34a in LO2 cells treated with control and 1 mM or 5 mM SKN
*p-value < 0.05 vs. control group, SKN – shikonin.
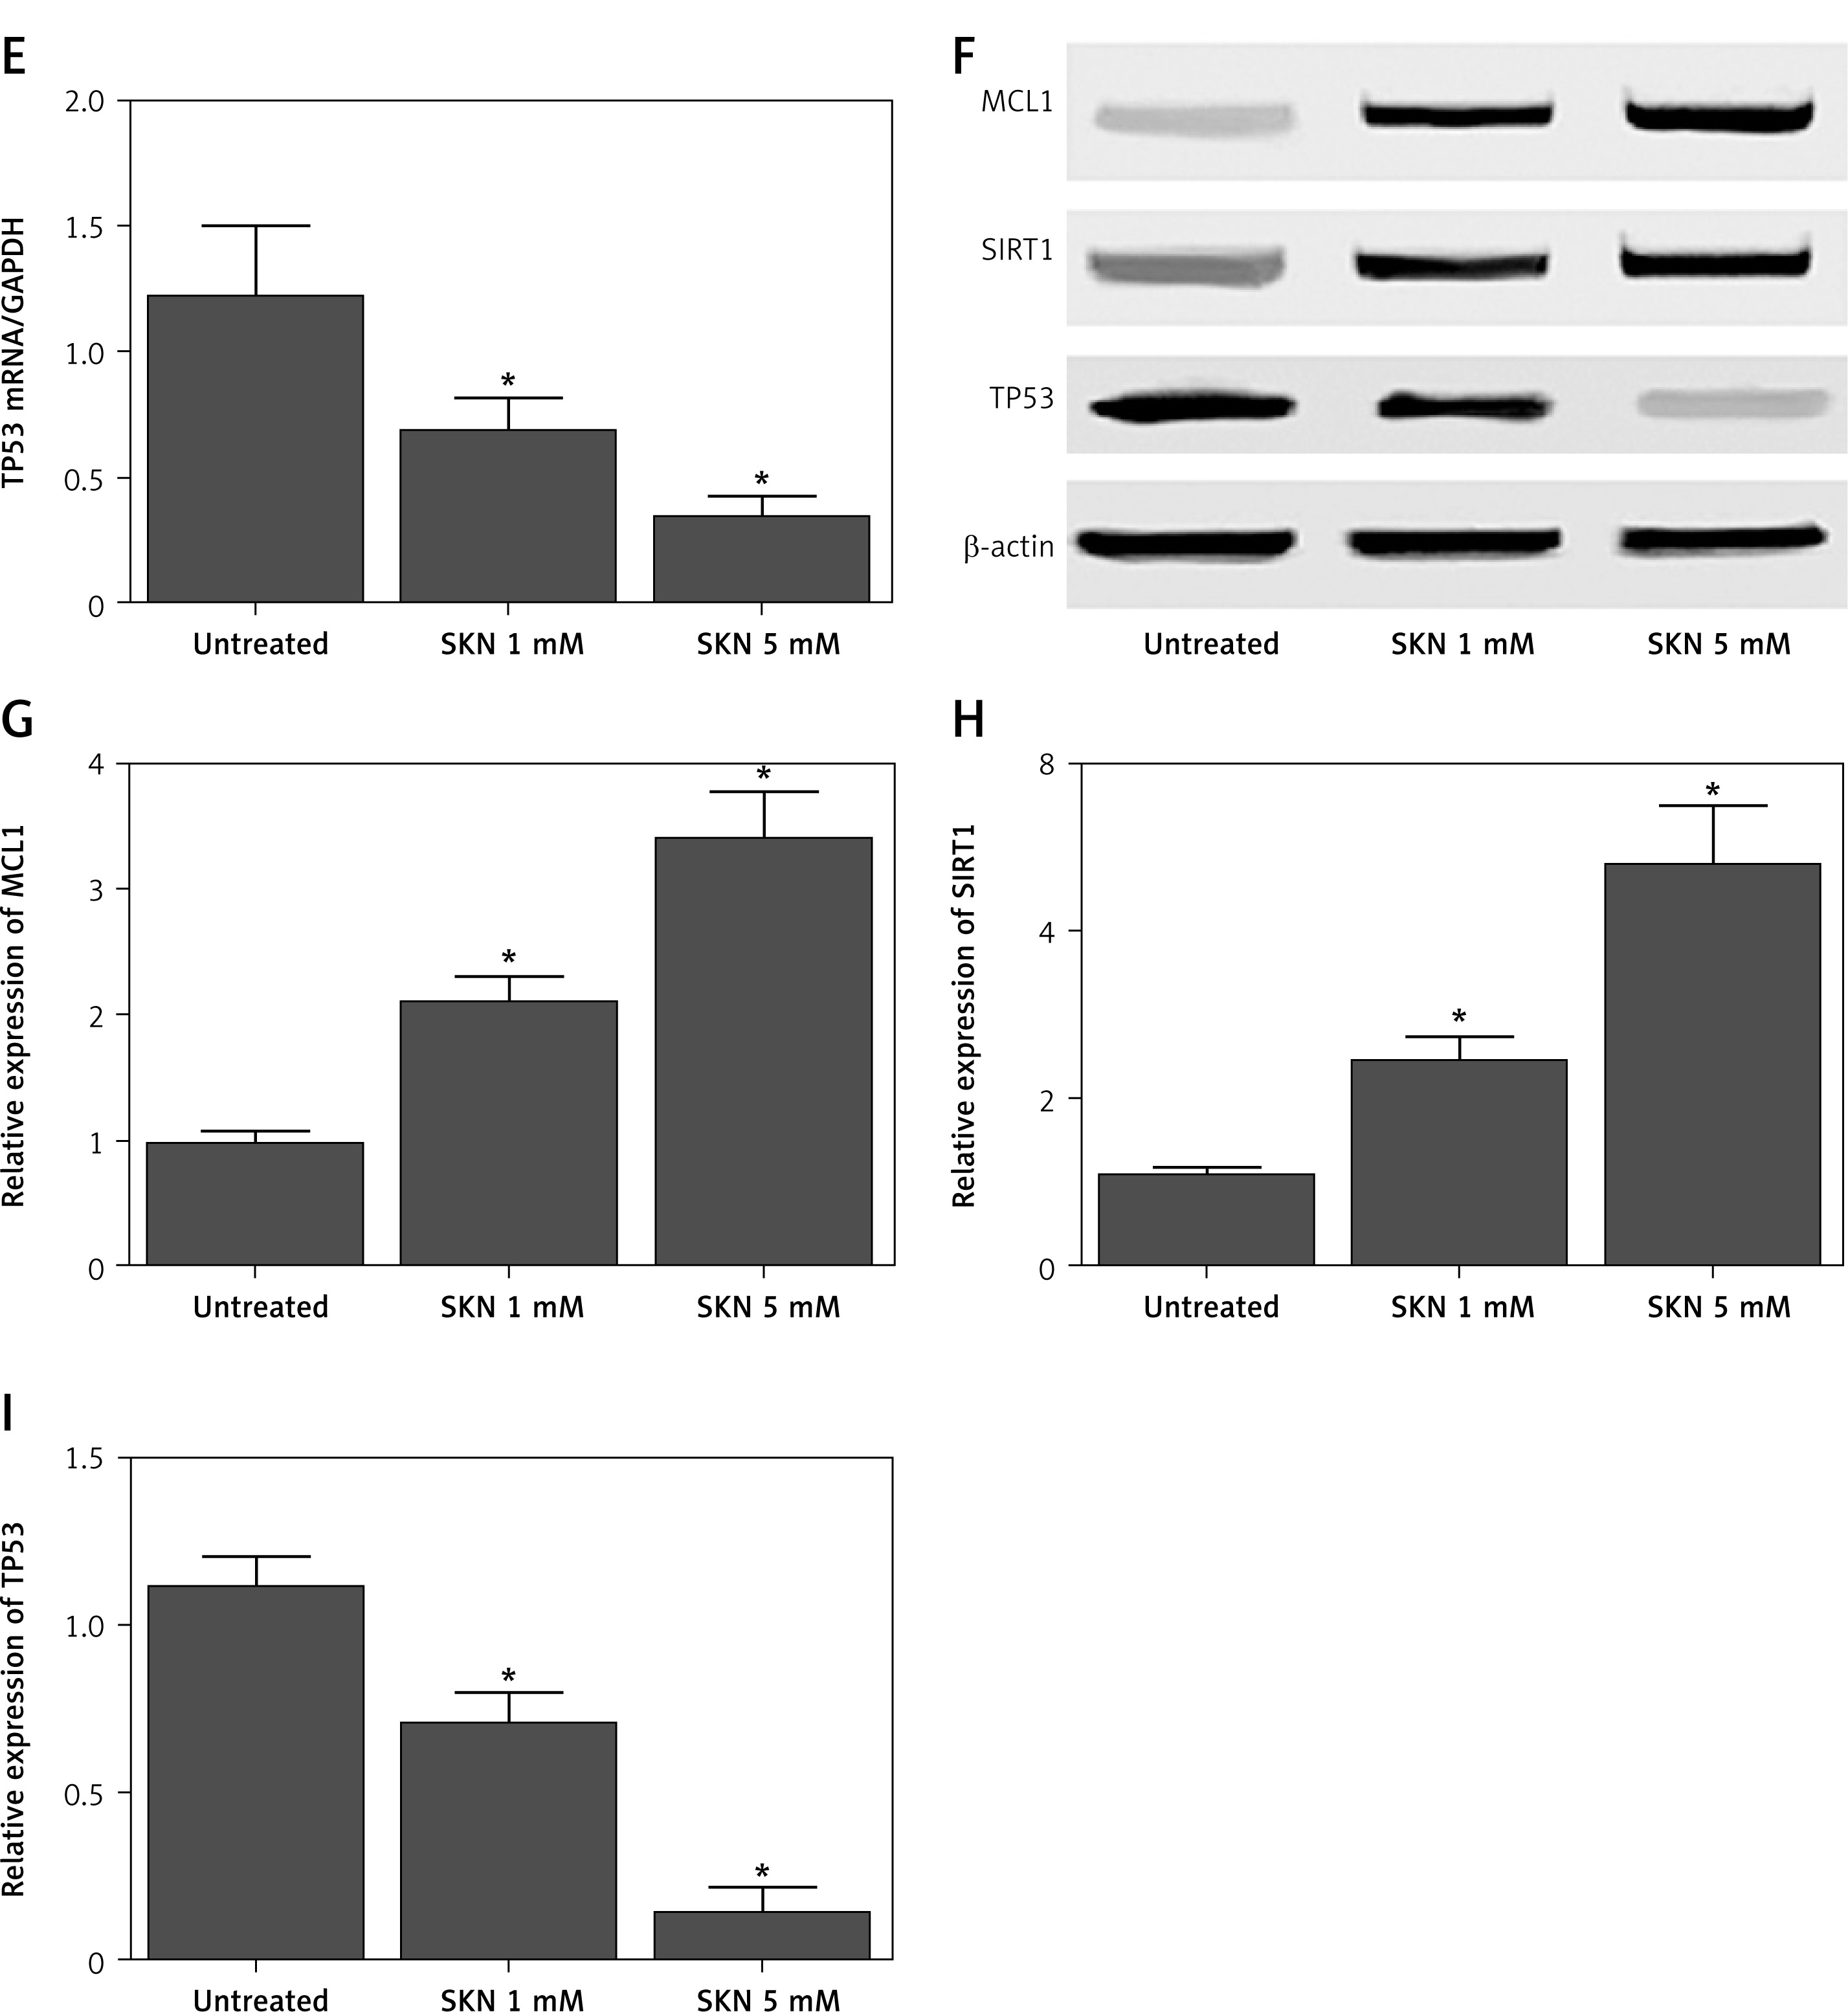
In addition, the mRNA levels of miR-106 and miR-34a were analyzed using RT-qPCR. Compared with the control, the expression levels of miR-106 (Figure 8 A) and miR-34a (Figure 8 B) decreased with a higher dose of SKN. The expression levels of downstream genes of miR-106 and miR-34a were also detected. The mRNA and protein levels of MCL1 (Figures 8 C, F, G) and SIRT1 (Figures 8 D, F, H) increased as the SKN concentration increased, while the mRNA and protein levels of TP53 (Figure 8 E, F, I) decreased as the SKN concentration increased. Taken together, SKN slowed down ALF in a dose-dependent manner by reducing the activity of miR-106 and miR34a promoters while inhibiting the expression of their downstream genes (MCL1, SIRT1 and TP53).
Figure 8
Effects of SKN on expression of miR-106, miR-34a, MCL1, SIRT1and TP53 in LO2 cells treated with 1 mM or 5 mM SKN. A – Expression levels of miR-106 in LO2 cells treated with control and 1 mM or 5 mM SKN. B – Expression levels of miR-34a in LO2 cells treated with control and 1 mM or 5 mM SKN. C – mRNA levels of MCL1 in LO2 cells treated with control and 1 mM or 5 mM SKN. D – mRNA levels of SIRT1 in LO2 cells treated with control and 1 mM or 5 mM SKN. E – mRNA levels of TP53 in LO2 cells treated with control and 1 mM or 5 mM SKN. F – Protein levels of MCL1, SIRT1and TP53 in LO2 cells treated with control and 1 mM 5 mM of SKN. G – Relative density of MCL1 proteins in LO2 cells treated with control and 1 mM or 5 mM SKN. H – Relative density of SIRT1 proteins in LO2 cells treated with control and 1 mM or 5 mM SKN. I – Relative density of TP53 proteins in LO2 cells treated with control and 1 mM or 5 mM SKN
*p-value < 0.05 vs. control group, SKN – shikonin.
Discussion
As a natural compound isolated from the root of Lithospermum erythrorhizon, shikonin (SHK) can exert various pharmacological effects, such as anti-bacterial, anti-inflammatory, as well as anti-cancer effects [39]. SHK also plays an essential role in the regulation of inflammation by exerting a potent anti-inflammatory effect. In addition, SHK effectively suppresses inflammation in the airways by inhibiting the maturation of bone marrow derived dendritic cells (BM-DC) [40]. In this study, a mouse model of ALF was treated with high and low doses of SKN. We found that the serum levels of ALT and AST were the lowest in the control group and the highest in the ALF group. Treatment with SKN decreased the levels of ALT and AST in a dose-dependent manner and also significantly decreased the number of apoptotic hepatocytes. Meanwhile, miR-106 and miR-34a levels in ALF mice were reduced by treatment with SKN in a dose-dependent manner.
The down-regulation of miR-106b induced by SHK can modulate the PTEN/AKT/Mtor signaling pathway in EEC cells. Moreover, treatment with SHK obviously increased the expression of PTEN while decreasing the expression of p-AKT as well as p-mTOR, although the effects of SHK can be significantly blocked by the over-expression of miR-106b (p < 0.01). These data suggested that SHK is able to repress the PTEN/AKT/mTOR signaling pathway in human EEC cells, but its activity is impaired by the over-expression of miR-106b. In this study, bioinformatic methods showed that miR-106 contained a binding site for MCL1 while miR-34a contained a binding site for SIRT1. Luciferase assay revealed that the wild type MCL1/SIRT1 significantly decreased the relative luciferase activity of miR-106/miR-34a. In addition, the luciferase activity of miR-106 and miR-34a decreased by SKN in a dose-dependent manner along with the mRNA levels of miR-106 and miR-34a. The mRNA and protein levels of MCL1 (Figures 8 C, F, G) and SIRT1 (Figures 8 D, F, H) increased as the SKN concentration increased, while the mRNA and protein levels of TP53 (Figures 8 E, F, I) decreased as the SKN concentration increased.
MCL1 expression is often elevated in human cancers, including non-small cell lung cancer, breast cancer, and acute myeloid leukemia. An anti-apoptotic factor in the BCL2 family, MCL1 acts as a crucial target in cancer therapies [41, 42]. In addition, MCL1 exerts certain anti-apoptotic effects by inhibiting the expression of pro-apoptotic proteins BAX and BAK [43]. After treatment with demethylzeylasteral, the expression of MCL1 is reduced while the apoptosis of melanoma cells is promoted. Since Mcl-1 plays a protective role while JNK functions as the mediator in a wide range of stimuli, the combination of JNK and Mcl-1 can play a critical role in the survival of cells [44, 45].
The expression of miR-34a is elevated upon the induction of adipogenesis, while the expression of miR-34a is inhibited by SHK. Furthermore, the expression level of FKBP1B mRNA is reduced during the process of adipogenesis, while treatment with SHK can increase the expression level of FKBP1B mRNA by suppressing the expression of mir-34a [33]. Pterostilbene can recover the expression of Sirt1 by inhibiting the expression of miR-34a, thus attenuating the epithelial-to-mesenchymal transition of hepatocytes [37]. Pterostilbene can also suppress activation of the TGF-β1/Smads and miR-34a/Sirt1/p53 signaling pathways in cultured hepatocytes upon stimulation with fructose [37].
P53 regulates the expression of miR-34a and modulates the expression of various proteins involved in cell cycle progression, cell apoptosis, and cell differentiation [46, 47]. Activation of the signaling pathway of miR-34a/Sirt1/p53 in liver cells can induce apoptosis and subsequently promote liver fibrosis by activating the stellate cells in the liver [48]. In this study, RT-qPCR and Western blot analyses showed that the mRNA and protein levels of MCL1 and SIRT1 decreased in the ALF mouse model, while the treatment with SKN reversed the effects of ALF by increasing the mRNA/protein levels of MCL1 and SIRT1 while reducing the mRNA and protein levels of TP53.
Resveratrol can play a cyto-protective role in hepatocytes through different routes [49]. In addition, the expression of SIRT1 can be regulated by resveratrol, which can bind to the N-terminal of SIRT1 proteins to suppress the activation of various transcription factors including nuclear factor κB (NF-κB) [50]. The expression of KLF6 is elevated in liver tissues undergoing regeneration to activate autophagy in these cells. In addition, KLF6 acts as a potent inhibitor of hepatocyte growth after autophagy is activated in hepatocytes [51]. The wild type p53 gene can induce apoptosis by inducing arrest of the cell cycle while promoting apoptosis [52]. In addition, as a key mediator in the transduction of apoptotic signals, P53 proteins are involved in determining the integrity of DNA in cells. In fact, in the presence of DNA damage, the expression of p53 is elevated to terminate ongoing cell proliferation and to promote the repair of DNA damage. On the other hand, in the presence of severe DNA damage that cannot be fully repaired, the level of p53 protein expression continues to rise to promote cell apoptosis [53].
In conclusion, miR-106 helped to prevent acute liver failure by directly targeting MCL1, a negative regulator of acute liver failure, while miR-34a helped to prevent acute liver failure by direct targeting SIRT, a negative regulator of TP53. In addition, SKN modulates acute liver failure by regulating miR-106/MCL1 and miR-34a/SIRT1/TP53 signaling. Therefore, SKN may be used as a potential agent in the prevention of acute liver failure.