Kawasaki disease (KD) is identified as a prevalent systemic inflammatory disease in childhood [1, 2]. According to a latest epidemiological survey in Shanghai, China, the average annual incidence rate of KD has risen by 0.38% for the past 5 years [3, 4]. The possible etiology of KD is associated with the inappropriate immunological response to one or more infectious triggers in genetically-susceptible individuals, and have emphasized the importance of activated T cells in its pathogenesis [5]. Coronary artery abnormalities (CAAs) are an important prognostic factor in KD and act as the leading cause of acquired heart disease. Although the standard therapy (high-dose intravenous immune globulin (IVIG) plus aspirin) is undertaken within the first 10 days of illness, there are also 10–20% of KD patients with persistent or recurrent fever, and 5% developing CAAs [6, 7]. Moreover, there has always been a lack of any definitive test for the diagnosis of KD except for the increases in several inflammatory mediators, such as C-reactive protein (CRP) and erythrocyte sedimentation rate (ESR) in clinical trials. However, these inflammatory mediators have certain limited diagnostic efficacies. Serum ferritin (SF) has been widely recognized as an acute phase reactant in systemic inflammatory disease, such as systemic lupus erythematosus (SLE), systemic juvenile idiopathic arthritis (sJIA), and even macrophage activation syndrome (MAS). Much evidence has suggested SF had the higher sensitivity, specificity for ascertaining clinical SLE/sJIA activity and the early recognition of MAS secondary to active sJIA, as compared with ESR and CRP [8, 9]. Multisystem inflammatory syndrome in children (MIS-C) is a life-threatening complication triggered by Coronavirus disease 2019 (COVID-19), characterized by prominent cardiovascular involvement and excessive systemic inflammation with increased SF levels [10, 11]. Therefore, our aim was to clarify whether SF can serve as a helpful biomarker for KD diagnosis and even its risk associated with MAS.
Methods
Two hundred and forty-four KD children were recruited from July 2015 to December 2019 in our center. According to the 2017 American Heart Association (AHA) guidelines [6], all the KD patients were divided simultaneously into 6 subgroups according to three criteria: clinical course (typical KD, atypical KD), IVIG responsiveness (IVIG-responsive KD, IVIG-nonresponsive KD) and CAAs presence (non-coronary artery abnormalities KD, CAAs KD). MAS could be identified if any patient fulfilled the 2004 Swedish guidelines [12]. In addition, 243 sex- and age-matched healthy children in the same period were enrolled as the controls. Approval for this research was acquired from the Medical Ethic Committee of our hospital (Code number; LLSC/20150009) and obtained consent from parents. Blood samples were collected from all subjects within 24h pre-IVIG therapy and 48h post-IVIG therapy, respectively, including CRP, ESR, white blood cells counts (WBC), absolute neutrophil counts (ANC), red blood cells counts (RBC), hemoglobin (Hb), mean corpuscular volume (MCV), mean corpuscular hemoglobin (MCH), mean corpuscular hemoglobin concentration (MCHC), platelet count (PLT), SF, fibrinogen and fasting triglycerides.
Statistical analysis
Normally distributed continuous data were expressed as mean ± SD. Comparisons of the frequencies between groups were analyzed using χ2 tests and comparisons among groups were made using ANOVA. A standard two-tailed t test was used for analyzing serum data, and paired t test was used in comparison of pre-IVIG to post-IVIG data. Pearson correlation coefficients were reported for SF and other variables of interest. Cutoff value, sensitivity and specificity of SF were identified by receiver operating characteristic (ROC) curve. Outliers were eliminated in the process of statistical analysis. A value of p < 0.05 was considered significant. Statistical analysis was performed using SPSS version 16.0.
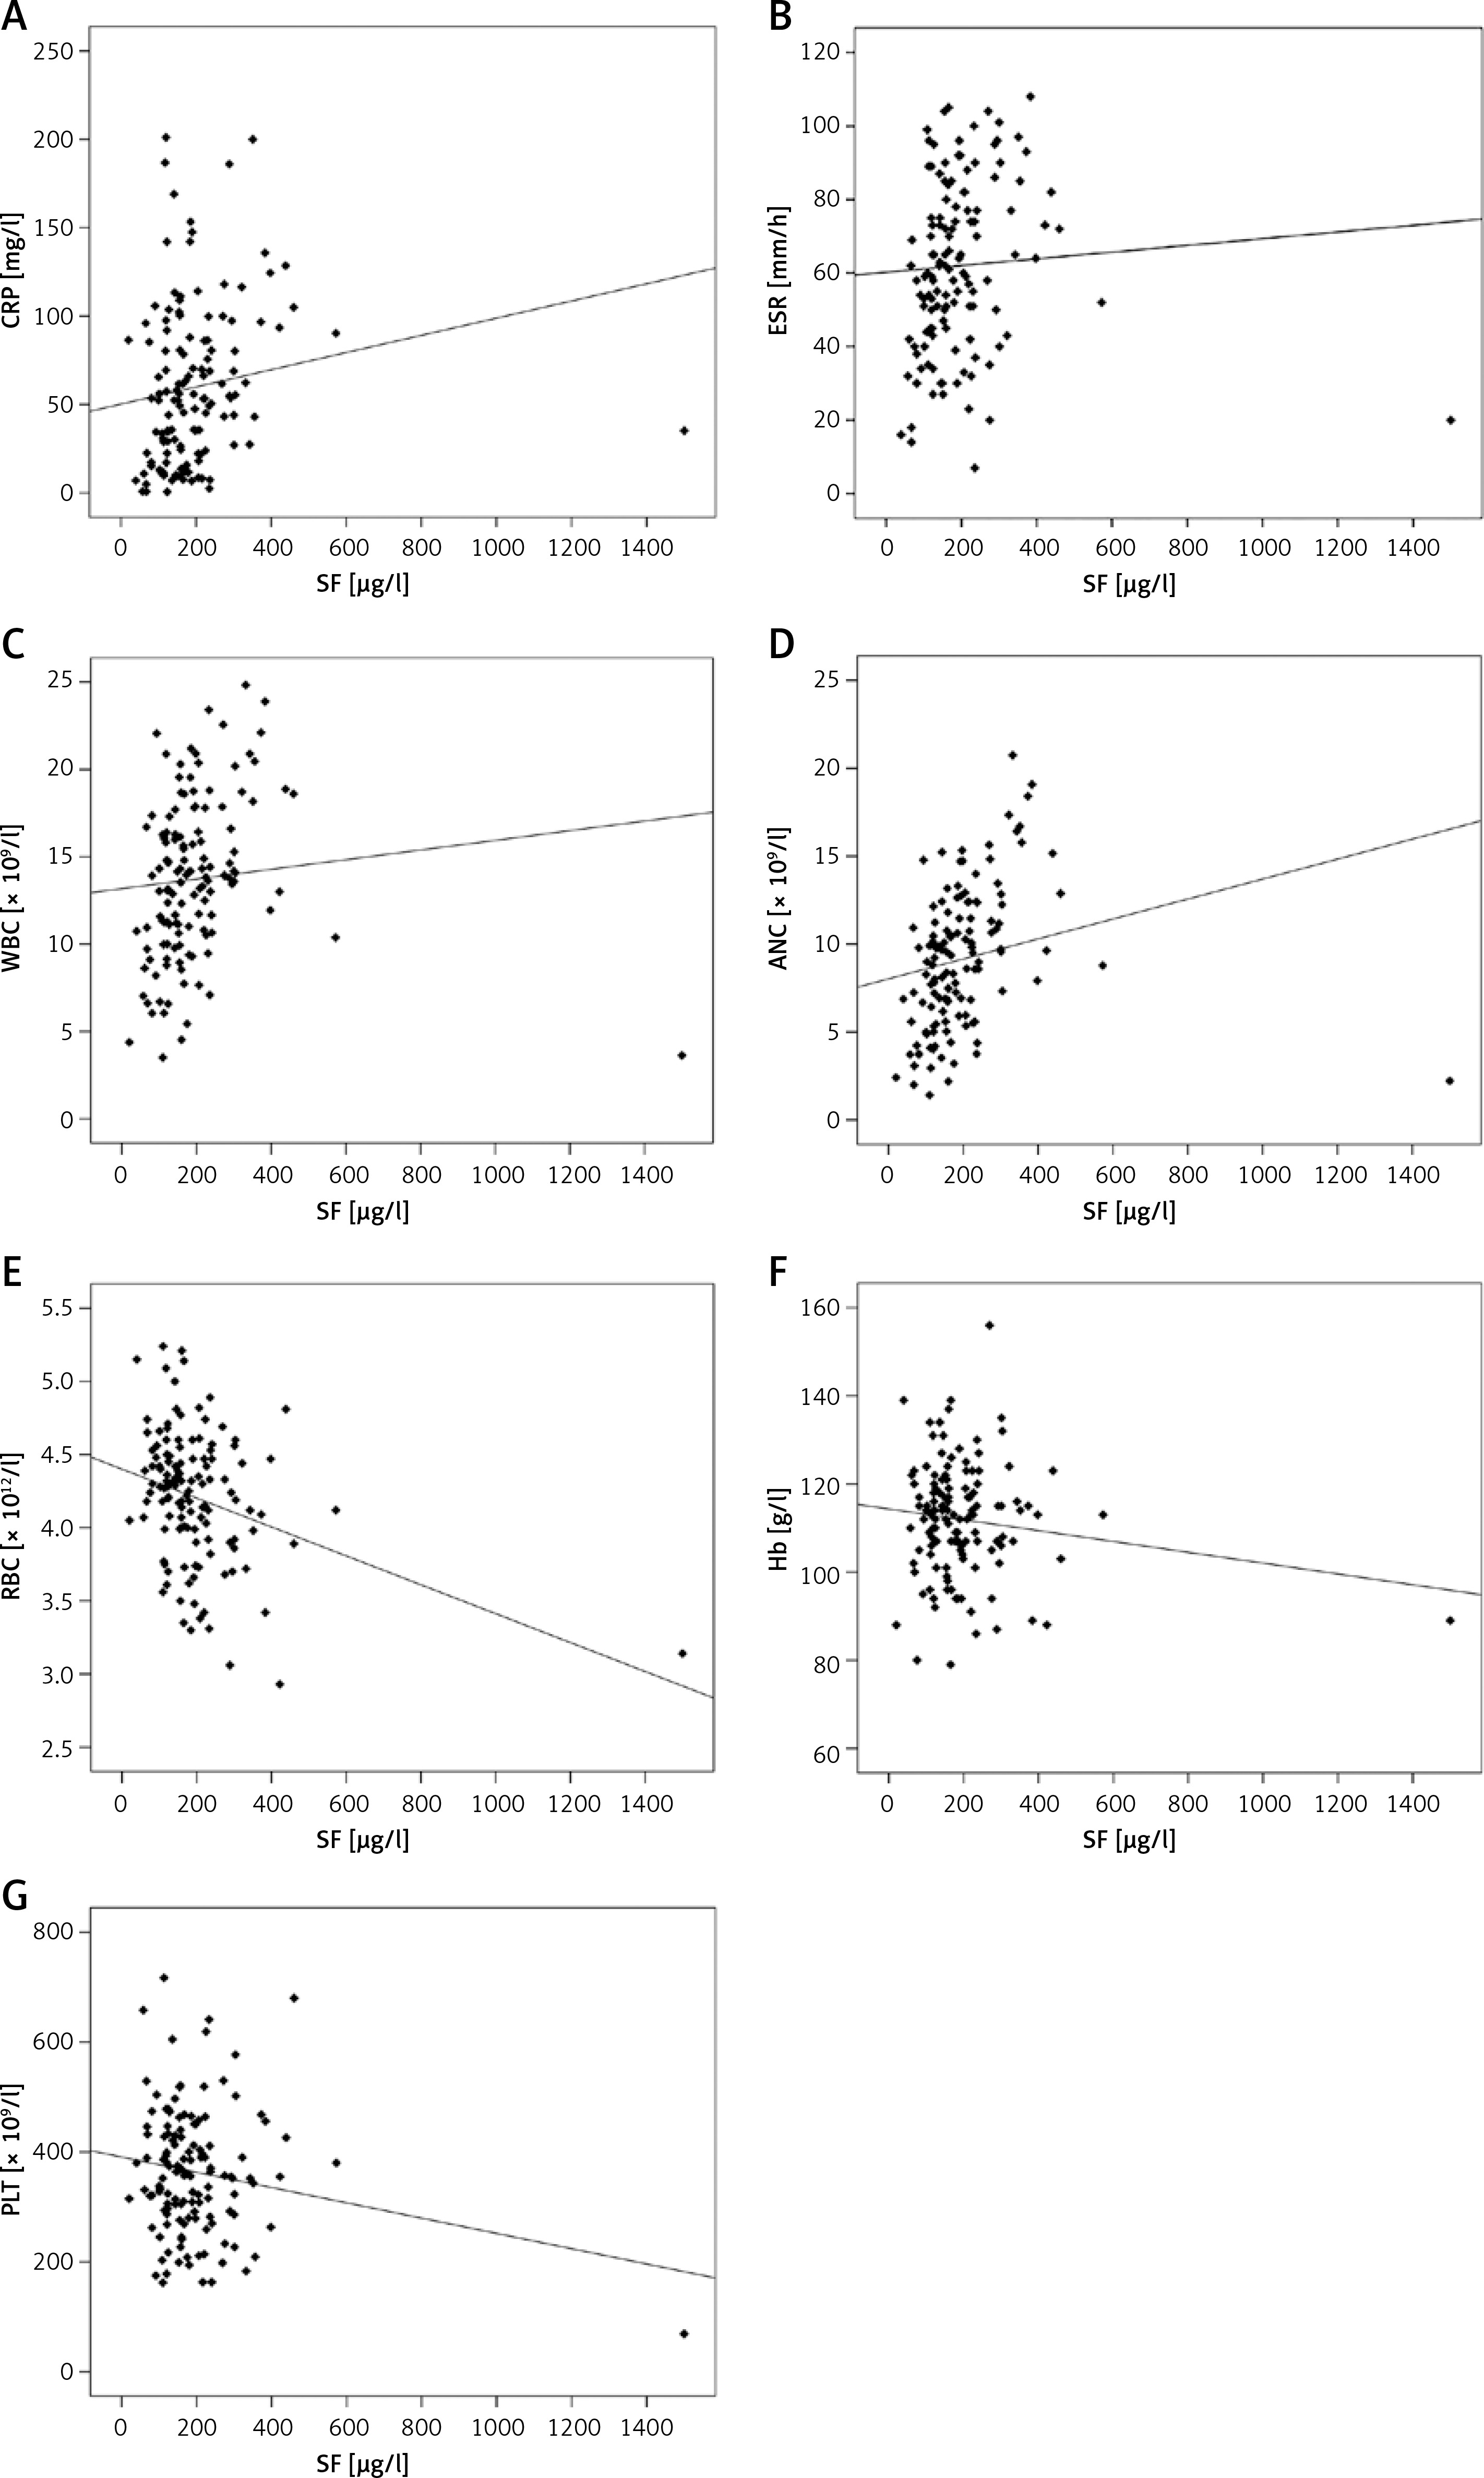
Results. Comparison of laboratory characteristic of KD patients and the healthy controls was shown in Table I. SF in KD patients after IVIG therapy still maintained an elevated level (p > 0.05), and significantly higher than that in the healthy controls (p < 0.05). Meanwhile, it was positively correlated with CRP, ESR, WBC and ANC. The associations of SF with conventional inflammatory mediators and blood cell counts before IVIG therapy are shown in Figure 1. SF was positively correlated with CRP (Figure 1 A; r = 0.31, p < 0.05) and ESR (Figure 1 B; r = 0.30, p < 0.05), WBC (Figure 1 C; r = 0.39, p < 0.05) and ANC (Figure 1 D; r = 0.53, p < 0.05), but no correlation existed between SF and RBC (Figure 1 E; r = –0.26, p > 0.05), Hb (Figure 1 F; r = –0.03, p > 0.05), and PLT (Figure 1 G; r = –0.01, p > 0.05), respectively.
Table I
Comparison of laboratory characteristics in KD patients and the healthy control groups
| Parameter | KD patients (n = 244) | Healthy controls (n = 243) | |
|---|---|---|---|
| Pre-IVIG | Post-IVIG | ||
| Age [months] | 32.81 ±27.58 | 36.48 ±12.77 | |
| Sex (male/female) | 133/111 | 127/116 | |
| SF [μg/l]*†∆ | 188.16 ±92.15 | 222.20 ±140.36 | 89.49 ±61.89 |
| CRP [mg/l]*†∆# | 61.32 ±45.63 | 6.04 ±5.84 | 0.99 ±0.94 |
| ESR [mm/h]*†∆ | 61.83 ±23.69 | 61.21 ±20.87 | 17.20 ±15.67 |
| WBC [× 109/l]*†∆# | 13.65 ±5.01 | 9.83 ±3.97 | 7.87 ±2.69 |
| ANC [× 109/l]*†# | 9.14 ±4.64 | 4.14 ±2.40 | 3.65 ±3.27 |
| RBC [× 1012/l]*†∆ | 4.22 ±0.42 | 4.19 ±0.39 | 4.58 ±0.40 |
| Hb [g/l]*†∆ | 110.91 ±14.37 | 110.99 ±10.73 | 127.40 ±10.95 |
| MCV [fl] | 79.77 ±4.24 | 79.87 ±4.43 | 80.87 ±4.47 |
| MCH [pg] | 26.35 ±2.08 | 26.49 ±1.67 | 27.84 ±1.67 |
| MCHC [g/l] | 330.19 ±18.15 | 331.58 ±10.44 | 332.04 ±9.55 |
| PLT [× 109/l]*†∆# | 356.16 ±121.24 | 507.55 ±159.11 | 300.38 ±76.71 |
† p < 0.05, significantly different between KD patients before IVIG therapy and the healthy controls;
∆ p < 0.05, significantly different between KD patients after IVIG therapy and the healthy controls;
KD – Kawasaki disease, IVIG – intravenous immunoglobulin, SF – Serum ferritin, CRP – C-reactive protein, ESR – erythrocyte sedimentation rate, WBC – white blood cell counts, ANC – absolute neutrophil counts, RBC – red blood cell counts, Hb – hemoglobin, MVC – mean corpuscular volume, MCH – mean corpuscular hemoglobin, MCHC – mean corpuscular hemoglobin concentration, PLT – platelet count.
Figure 1
The associations of SF with conventional inflammatory mediators and blood cell counts before IVIG therapy. Outliers are not depicted (SF: 864.50 μg/l and 1500 μg/l). SF was positively correlated with CRP (A; r = 0.31, p < 0.05) and ESR (B; r = 0.30, p < 0.05), WBC (C; r = 0.39, p < 0.05) and ANC (D; r = 0.53, p < 0.05), but no correlation existed between SF and RBC (E; r = –0.26, p > 0.05), Hb (F; r = –0.03, p > 0.05), and PLT (G; r = –0.01, p > 0.05), respectively
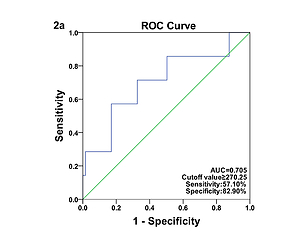
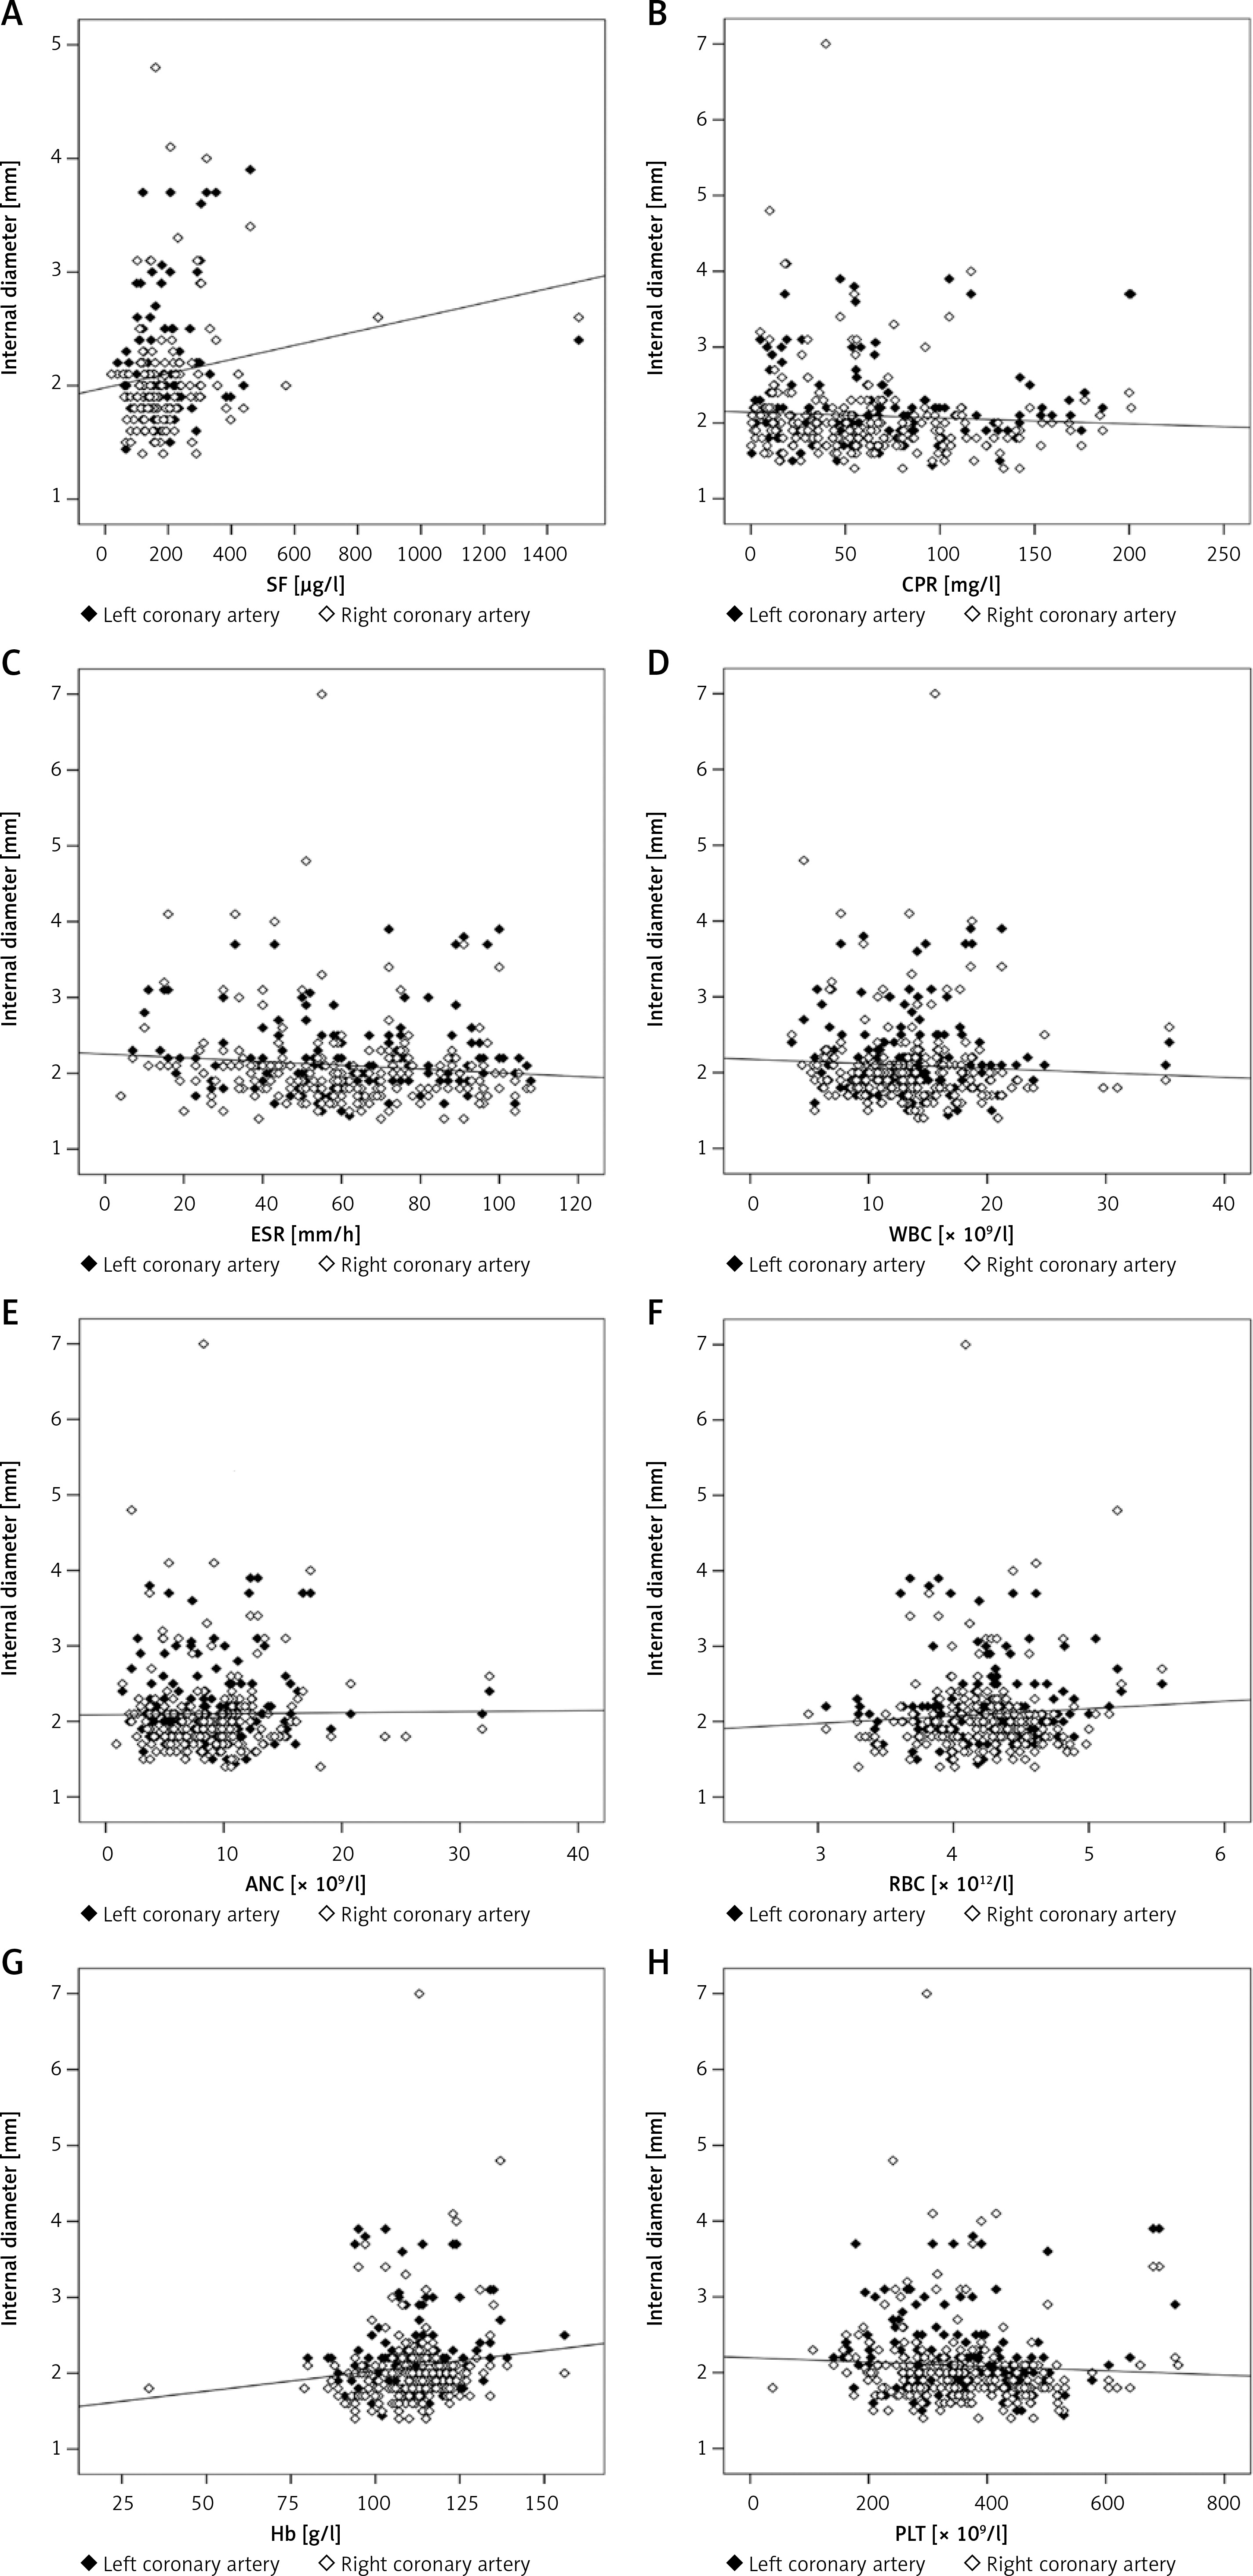
Comparison of laboratory characteristics in patients with different types of KD was presented in Table II. SF was significantly elevated in patients with IVIG-nonresponsive KD when compared with their IVIG-responsive counterparts (t = 1.60, p < 0.05). The AUC value for SF in prediction of IVIG-nonresponsive KD was 0.705, and the estimated sensitivity and specificity were 57.10% and 82.90% with a cutoff of SF ≥ 270.25 μg/l, respectively (Figure 2 A). However, no significant differences in SF were found between the typical KD patients and the atypical KD patients (p > 0.05), and between KD patients with and without CAAs (p > 0.05). The associations of coronary artery involvement with SF, inflammatory mediators and blood cell counts are shown in Figure 3. The internal diameter of the coronary artery was positively correlated with SF (Figure 3 A; r = 0.19, p < 0.05), but no correlation of the internal diameter of the coronary artery with CRP (Figure 3 B; r = –0.07, p > 0.05), ESR (Figure 3 C; r = –0.12, p > 0.05), WBC (Figure 3 D; r = –0.08, p > 0.05), ANC (Figure 3 E; r = –0.01, p > 0.05), RBC (Figure 3 F; r = 0.07, p > 0.05), Hb (Figure 3 G; r = 0.12, p > 0.05), and PLT (Figure 3 H; r = –0.07, p > 0.05) was determined, respectively. The AUC value for SF in prediction of KD patients with CAAs was 0.603, and the estimated sensitivity and specificity were 92.30% and 37.70% with a cutoff of SF ≥ 143.05 μg/l, respectively (Figure 2 B).
Table II
Comparison of laboratory characteristics in patients with different types of KD
| Parameter | Clinical classification | IVIG therapy | Coronary artery | |||
|---|---|---|---|---|---|---|
| Typical KD | Atypical KD | Response | Nonresponse | Normal | CAAs | |
| Age [months] | 33.52 ±27.77 | 31.16 ±27.25 | 32.91 ±27.80 | 31.20 ±24.62 | 32.46 ±27.20 | 36.70 ±32.00 |
| Sex (male/female) | 99/71 | 34/40 | 127/102 | 6/9 | 120/104 | 13/7 |
| SF [μg/l] | 187.19 ±87.34 | 190.82 ±102.67 | 185.40 ±90.13 | 247.07 ±123.23* | 184.8 ±91.17 | 219.12 ±99.27 |
| CPR [mg/l] | 59.46 ±44.15 | 65.55 ±48.88 | 61.38 ±46.42 | 60.36 ±31.38 | 63.06 ±46.37 | 42.28 ±31.57 |
| ESR [mm/h] | 60.89 ±23.89 | 64.15 ±23.22 | 61.07 ±23.52 | 75.25 ±23.68 | 62.57 ±23.55 | 53.68 ±24.36 |
| WBC [× 109/l] | 13.40 ±4.53 | 14.22 ±5.98 | 13.52 ±4.83 | 15.87 ±7.37 | 13.70 ±5.08 | 13.15 ±4.38 |
| ANC [× 109/l] | 9.05 ±4.16 | 9.35 ±5.58 | 8.96 ±4.42 | 12.67 ±7.06* | 9.21 ±4.69 | 8.44 ±4.11 |
| RBC [× 1012/l] | 4.23 ±0.40 | 4.19 ±0.43 | 4.23 ±0.42 | 4.06 ±0.45 | 4.20 ±0.42 | 4.35 ±0.41 |
| Hb [g/l] | 111.84 ±12.66 | 110.40 ±12.09 | 111.58 ±12.48 | 107.92 ±12.52 | 111.04 ±12.52 | 115.11 ±11.64 |
| PLT [× 109/l] | 354.57 ±124.46 | 359.81 ±114.24 | 353.82 ±118.91 | 394.00 ±154.67 | 356.10 ±120.37 | 356.80 ±133.78 |
SF – Serum ferritin, KD – Kawasaki disease, CRP – C-reactive protein, ESR – erythrocyte sedimentation rate, WBC – white blood cell counts, ANC – absolute neutrophil counts, RBC – red blood cell counts, Hb – hemoglobin, PLT – platelet count, IVIG – intravenous immunoglobulin, CAAs – coronary artery abnormalities.
Figure 2
A – Receiver operating characteristic curve of SF for the diagnosis of IVIG-nonresponsive KD. B – Receiver operating characteristic curve of SF for the diagnosis of KD patients with CAAs
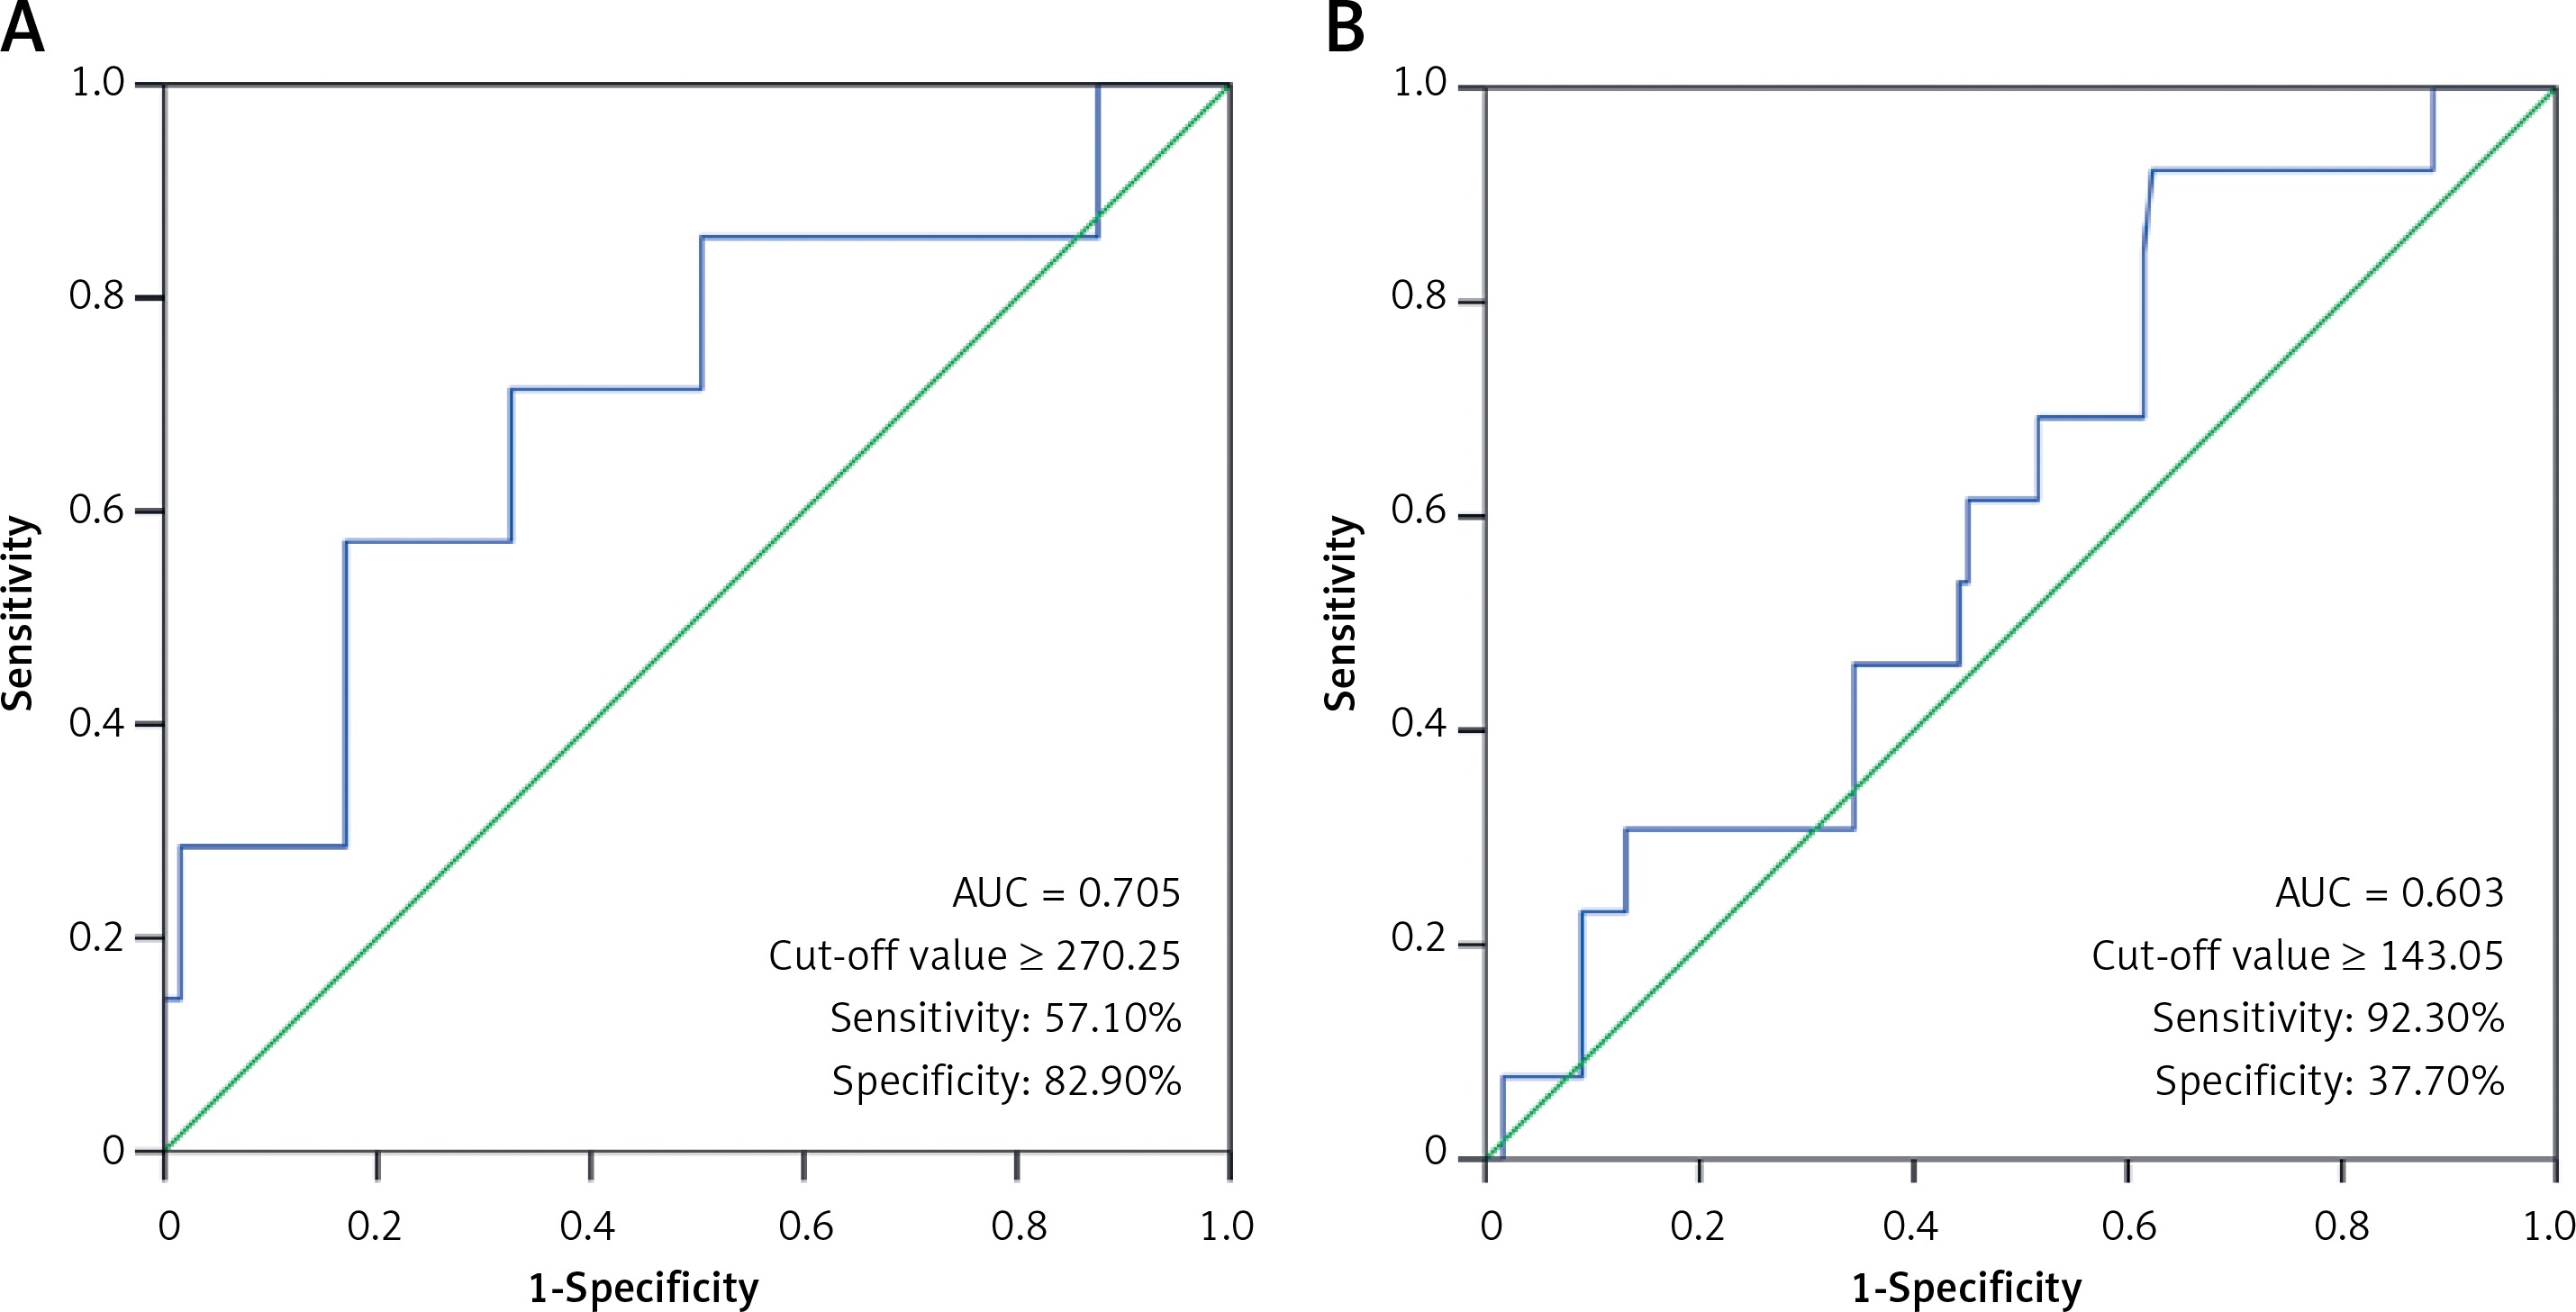
Figure 3
The associations of coronary artery involvement with SF, inflammatory mediators and blood cell counts. Outliers are not depicted (SF = 864.50 μg/l and 1500 μg/l). The internal diameter of the coronary artery was positively correlated with SF (A; r = 0.19, p < 0.05), but no correlation of the internal diameter of the coronary artery with CRP (B; r = –0.07, p > 0.05), ESR (C; r = –0.12, p > 0.05), WBC (D; r = –0.08, p > 0.05), ANC (E; r = –0.01, p > 0.05), RBC (F; r = 0.07, p > 0.05) Hb (G; r = 0.12, p > 0.05), and PLT (H; r = –0.07, p > 0.05) was determined, respectively
Based on the diagnostic criteria of MAS, there were 1 patient (0.41%) diagnosed as MAS and 3 (1.23%) patients with the tendency of MAS. The clinical characteristics of these 4 patients are shown in Table III. SF served as the most prevalent characteristic of MAS tendency except for fever. In the 4 KD patients with MAS tendency, the levels of SF ranged from 572.6 to 1500 μg/l in the acute stage with a mean value of 979.03 ±474.19 μg/l, and was significantly increased when compared to their counterparts without MAS tendency (185.27 ±86.19 μg/l, p < 0.05).
Discussion
To the best of our knowledge, little information has been available regarding the association of SF with KD to date. In this circumstance, we conducted a clinical observational study encompassing 244 KD patients and found that SF of KD patients was significantly higher than that of the healthy controls; and moreover, SF still maintained an elevated level during the acute episode of KD, even after IVIG therapy. The possible mechanisms of SF up-regulation may involve anemia and systemic inflammation. In childhood, nutritional anemia occurs mainly in individuals < 3 years old. Based on the data from 11 province-level regions, China, Xin et al. [13] indicated that the estimated prevalence of nutritional anemia in 24235 children aged 0-3 years was 24.4%. Similarly, KD predominantly affects children ≤ 5 years old, thus the influences of nutritional anemia on SF should be investigated. In the present study, no significant differences were found in MCV, MCH, and MCHC between KD patients and the healthy controls. Therefore, systemic inflammation is the major contributor of SF up-regulation during the acute episode of KD, rather than nutritional anemia. Zhou et al. [14] have conducted a systematic review and meta-analysis to characterize the laboratory parameters of MIS-C compared with those of KD, and found that patients with MIS-C usually have higher SF levels than KD patients. Further investigations will be required to compare and contrast features between MIS-C and KD basing on increased SF levels.
In the present study, SF remained statistically higher after IVIG therapy. Nasir et al. [15] determined SF of 3 newborns with Kawasaki-like illness before and after IVIG therapy respectively, and noted that SF had a 7–100-fold increase than the normal values before IVIG therapy, and even still had a 4–80-fold increase after IVIG therapy. Our panel performed the retrospective studies using inpatient database of KD, the observational time only covered the acute episode (within 14 days) and was too short to reveal the variation of SF before and after IVIG therapy. We hypothesize that SF may be superior to conventional inflammatory mediators in evaluating the long-term outcomes of KD. In addition, the present study found that SF was positively correlated with CRP, ESR, WBC and ANC during the acute episode of KD. Although scant literature exists about the relationships between SF and conventional inflammatory mediators in KD, their relationships have been probed in other systemic inflammatory diseases [16, 17]. Ciprandi et al. [18] compared serum vascular endothelial growth factor (VEGF) levels in 40 normal subjects, 40 allergic patients and 40 SLE patients, and found that VEGF levels were significantly increased in SLE patients in comparison with normal subjects as well as allergic patients. Elevated SF levels have been implicated in the development of diabetic microvascular disease through interaction with VEGF [19]. On this background, elevated SF levels may be implicated in endothelial dysfunction in patients with chronic immune-mediated diseases through interaction with VEGF. However, no association has been established between VEGF and SF in KD.
In the present study, SF was significantly increased in patients with IVIG-nonresponsive KD when compared with their IVIG-responsive counterparts; furthermore, SF was positively correlated with the internal diameter of the coronary artery. Based on our findings, SF is prone to serve as a helpful biomarker for predicting both IVIG-nonresponsive KD and CAAs.
The last but the most important objective of our study was to determine whether the increased SF was associated with MAS in KD patients. MAS is a severe, potentially life-threatening complication of multiple systemic inflammatory diseases in childhood, which is seen commonly in sJIA (7–13%) and SLE (0.9–4.6%) [20–22]. However, few studies have been conducted to observe the occurrence of MAS in KD patients. In the present study, the prevalence of MAS tendency was estimated to be 1.23% in KD and significantly lower than the other systemic inflammatory diseases, which may be ascribed to a weaker inflammatory reaction in KD as compared with sJIA and SLE. Our study also revealed that increased SF occurred in 3 patients with MAS tendency (75%) and thus SF may be regarded as the most prevalent characteristic laboratory changes of MAS tendency. A multinational, multicenter collaborative study found that SF had a sensitivity of 96.4% and a specificity of 100% for discriminating MAS from SLE without MAS at a cutoff point of > 249 μg/l [22]. Honestly, since the sample size is relatively small, the results obtained from our study were the preliminary clinical outcomes.
In conclusion, SF is prone to serve as a helpful biomarker for predicting IVIG-nonresponsive KD, CAAs and MAS tendency. A panel containing the available risk factors and SF should be established to enhance the predictive efficacy of KD-associated risks.