Introduction
Multiple studies have suggested an allied relationship between clotting pathway activation and thromboembolic events [1–4]. Clotting disorders occur in approximately 60% of cancer patients and in 95% of those with stage IV disease. Additionally, the presence of venous thromboembolic disease is considered a negative prognostic factor in these patients [4].
It has been reported that 25–30% of patients with kidney cancer present primarily with metastatic disease, and from those with localized tumors, up to 50% will develop metastases during the course of the disease [5]. Despite new treatment methods, the 5-year survival rate is still low, highlighting the aggressiveness of the disease as well as unsatisfactory systemic treatment efficacy [6, 7]. Due to these factors, it is critical to predict the disease course and probable therapy response. This can aid in tailoring therapy for patient-specific needs, potentially resulting in increased drug efficacy, especially in the era of tyrosine kinase inhibitors and emerging immunotherapies. Still, 4–10% of patients with kidney cancer present with renal vein thrombosis, and its development is connected with the presence of kidney tumors [8, 9]. Past observations saw no correlation between renal vein thrombosis and survival, metastatic development, or disease recurrence in kidney tumor patients [10, 11]. Currently, the presence of kidney tumor thrombosis in the renal vein or inferior cava vein is generally accepted as a negative prognostic factor. As such, this led to the incorporation of kidney cancer staging system disease management guidelines [12, 13]. Data regarding clotting and fibrinolysis in kidney tumor patients are scarce, but overclotting is believed to be a negative prognostic factor; therefore, further data are needed [14].
The aims of this study were to first compare selected clotting and fibrinolysis factors in patients who had undergone surgery due to kidney tumors as well as in healthy volunteers. Second, we evaluated these factors for their influence on kidney cancer patient survival.
Material and methods
In this study, 96 consecutive patients who had undergone surgery at the Department of Urology and Oncologic Urology of the Wroclaw Medical University due to kidney tumors were included. There were 30 healthy volunteers included in the study as controls. All research was financed by a university internal grant (No. ST-875) and a grant for young scientists (No. Pbmn-114). This study was approved by the University Bioethics Committee, and all subjects gave written informed consent.
The primary kidney tumor, diagnosed by ultrasonography, was confirmed by abdominal computed tomography or magnetic resonance imaging. Staging was performed using the 2002 TNM system [15], and kidney cancer grading was determined by use of the Fuhrman system [16]. Blood was collected at 0800 hours by venipuncture of the basilic vein. Basic laboratory testing (blood morphology, INR, fibrinogen concentration, thrombin time, activated partial thromboplastin time, prothrombin index) was performed in a local hospital laboratory.
Tissue factor (TF) was assessed using the Imubind Tissue Factor ELISA Kit No. 846 (American Diagnostica Inc., Stamford); serum tissue factor pathway inhibitor (TFPI): total TFPI, full-length TFPI, truncated TFPI were measured using the Imubind total TFPI ELISA Kit No. 849 (American Diagnostica Inc, Stamford, USA); plasmin-anti-plasmin complex (PAP) was assessed using the Enzygnost PAP micro test (Dade Behring, Marburg, Germany); thrombin-anti-thrombin complex (TAT) was measured by Enzygnost TAT micro (Behring, Behringwerke AG, Marburg, Germany); von Willebrand factor (vWF) using the Asserachrom vWF test (Diagnostica Stago, Glattbrugg, Switzerland); D-dimers were assessed using STA-Liatest D-Di (Diagnostica Stago, Glattbrugg, Switzerland); and XIII A1 clotting factor was measured with the ELISA Kit for human coagulation factor XIIIA1 polypeptide (USCN Life Sciences Inc., Wuhan, China). All kits were used according to the manufacturer’s recommendations.
Statistical analysis
Statistical analysis was performed with Statistica 13 (Tibco, USA). For measurable variables, arithmetic means, medians, standard deviations (SD), and variation ranges (extremes) were calculated. For qualitative variables, the frequency of occurrence in percent (%) was calculated. All investigated variables were tested using the Shapiro-Wilk test to examine distribution type. Kaplan-Meier curves were calculated for overall survival (OS) analysis, and a log-rank test was used for survival comparison between groups. The Cox proportional hazard test and Cox stepwise tests were used for investigating the influence of these variables on survival. Kaplan-Meier curves were calculated for prognostic factor influence. The observable differences between groups was assessed using Student’s t-test for independent variables or the Mann-Whitney U-test. Relationships between selected variables were calculated using Pearson’s correlation coefficient or Spearman’s rank test. For all comparisons, significance was set at p ≤ 0.05.
Results
There were no significant demographic differences between experimental and control patients (Table I). Patients with kidney tumors had significantly higher concentrations of TAT, PAP, TF, total TFPI, full TFPI, vWF, FXIIIA1, and a higher leukocyte count than controls (Table II). The platelet count in cancer patients was higher, but the difference was not found to be statistically significant. Tissue factor concentration was sixfold higher in the patients with kidney cancer than in healthy volunteers, while total TFPI, truncated TFPI, and full TFPI were 2.0, 2.5, and 1.4-fold higher, respectively. Correlation analysis presented in Table III showed a positive correlation between the concentration of coagulation factors, platelet count, and fibrinolysis factors. The strongest correlation was noted between total TFPI and truncated and full length TFPI. There was no correlation between subfractions of TFPI and TF. In contrast, TF was positively correlated with FXIII. There was also a positive correlation between fibrinogen concentration and the concentration of D-dimers, PAP, total TFPI, and vWF as well as platelet count. Platelet count positively correlated with D-dimers, fibrinogen, TAT, PAP, and leukocyte count.
Table I
Demographic comparison of kidney tumor patients and controls and clinical data of experimental group
| Factor | Experimental group (n = 96) | Control group (n = 30) | P-value | ||||||||
|---|---|---|---|---|---|---|---|---|---|---|---|
| Mean | Median | Min. | Max. | SD | Mean | Median | Min. | Max. | SD | ||
| Age | 60.6 | 60 | 21 | 88 | 12 | 58 | 58.5 | 44 | 69 | 7 | 0.14** |
| Body weight [kg] | 80.5 | 80 | 49 | 125 | 15.6 | 76.2 | 73 | 55 | 120 | 12.6 | 0.12** |
| Height [cm] | 168.1 | 170 | 150 | 188 | 9.5 | 169.8 | 170 | 156 | 183 | 8.8 | 0.06* |
| BMI [kg/m2] | 28.5 | 27.8 | 20.4 | 43.8 | 4.8 | 26.7 | 26 | 21.5 | 39 | 3.6 | 0.07** |
| Sex | Female – n = 41 (43%) Male – n = 55 (57%) | Female – n = 15 (50%) Male – n = 15 (50%) | 0.48*** | ||||||||
Table II
Comparison of clotting and fibrinolysis parameters between experimental and control group. P ≤ 0.05
[i] SD – standard deviation, min – minimum, max – maximum, APTT – activated partial thromboplastin time, INR – international normalized ratio, TT – thrombin time, Prot. Index – prothrombin index, PLT – platelets, Hb – hemoglobin, WBC – white blood cells, TAT – thrombin-anti-thrombin complex, PAP – plasmin-anti-plasmin complex, TF – tissue factor, TFPI trunc – serum tissue factor pathway inhibitor truncated, TFPI total – serum tissue factor pathway inhibitor total, TFPI full – serum tissue factor pathway inhibitor full length, vWF – von Willebrand factor, FXIII – factor XIII. U Mann-Whitney test.
Table III
Analysis of correlations between selected clotting and fibrinolysis factors. Spearman rank correlation test; p < 0.05
[i] APTT – activated partial thromboplastin time, INR – international normalized ratio, TT – thrombin time, Prot. Index – prothrombin index, PLT – platelets, Hb – hemoglobin, WBC – white blood cells, TAT – thrombin-anti-thrombin complex, PAP – plasmin-anti-plasmin complex, TF – tissue factor, TFPI trunc – serum tissue factor pathway inhibitor truncated, TFPI total – serum tissue factor pathway inhibitor total, TFPI full – serum tissue factor pathway inhibitor full length, vWF – von Willebrand factor, FXIII – factor XIII.
In 85 out of 96 tumor patients, kidney cancer was diagnosed by histological methods. The remaining 11 patients had benign disease. During the observation course 22 patients died, 20 due to kidney cancer and two due to non-cancerous causes. None of the benign kidney tumor patients died in the course of observation. There were no incidents of death due to venous thrombotic events. The median survival time was 62.5 months. No deaths were observed in the healthy volunteers.
Utilizing Cox proportional hazards analysis, it was observed in the cancer patient group that pre-operative levels of fibrinogen, corrected calcium, C-reactive protein (CRP), PAP, TFPI full, and vWF and female gender were significantly associated with survival, while other parameters – preoperative hemoglobin level, leukocyte count, serum iron, sodium, potassium, creatinine, albumin, aspartate aminotransferase, alanine aminotransferase levels – did not reach statistical significance. In a stepwise Cox analysis, only elevated fibrinogen and D-dimer concentrations were significantly associated with survival (p = 0.004 and p = 0.005, respectively) whereas sex was marginally associated with overall survival (p = 0.062).
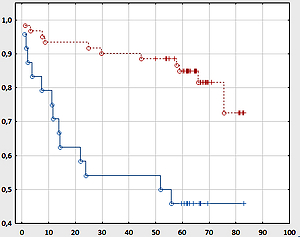
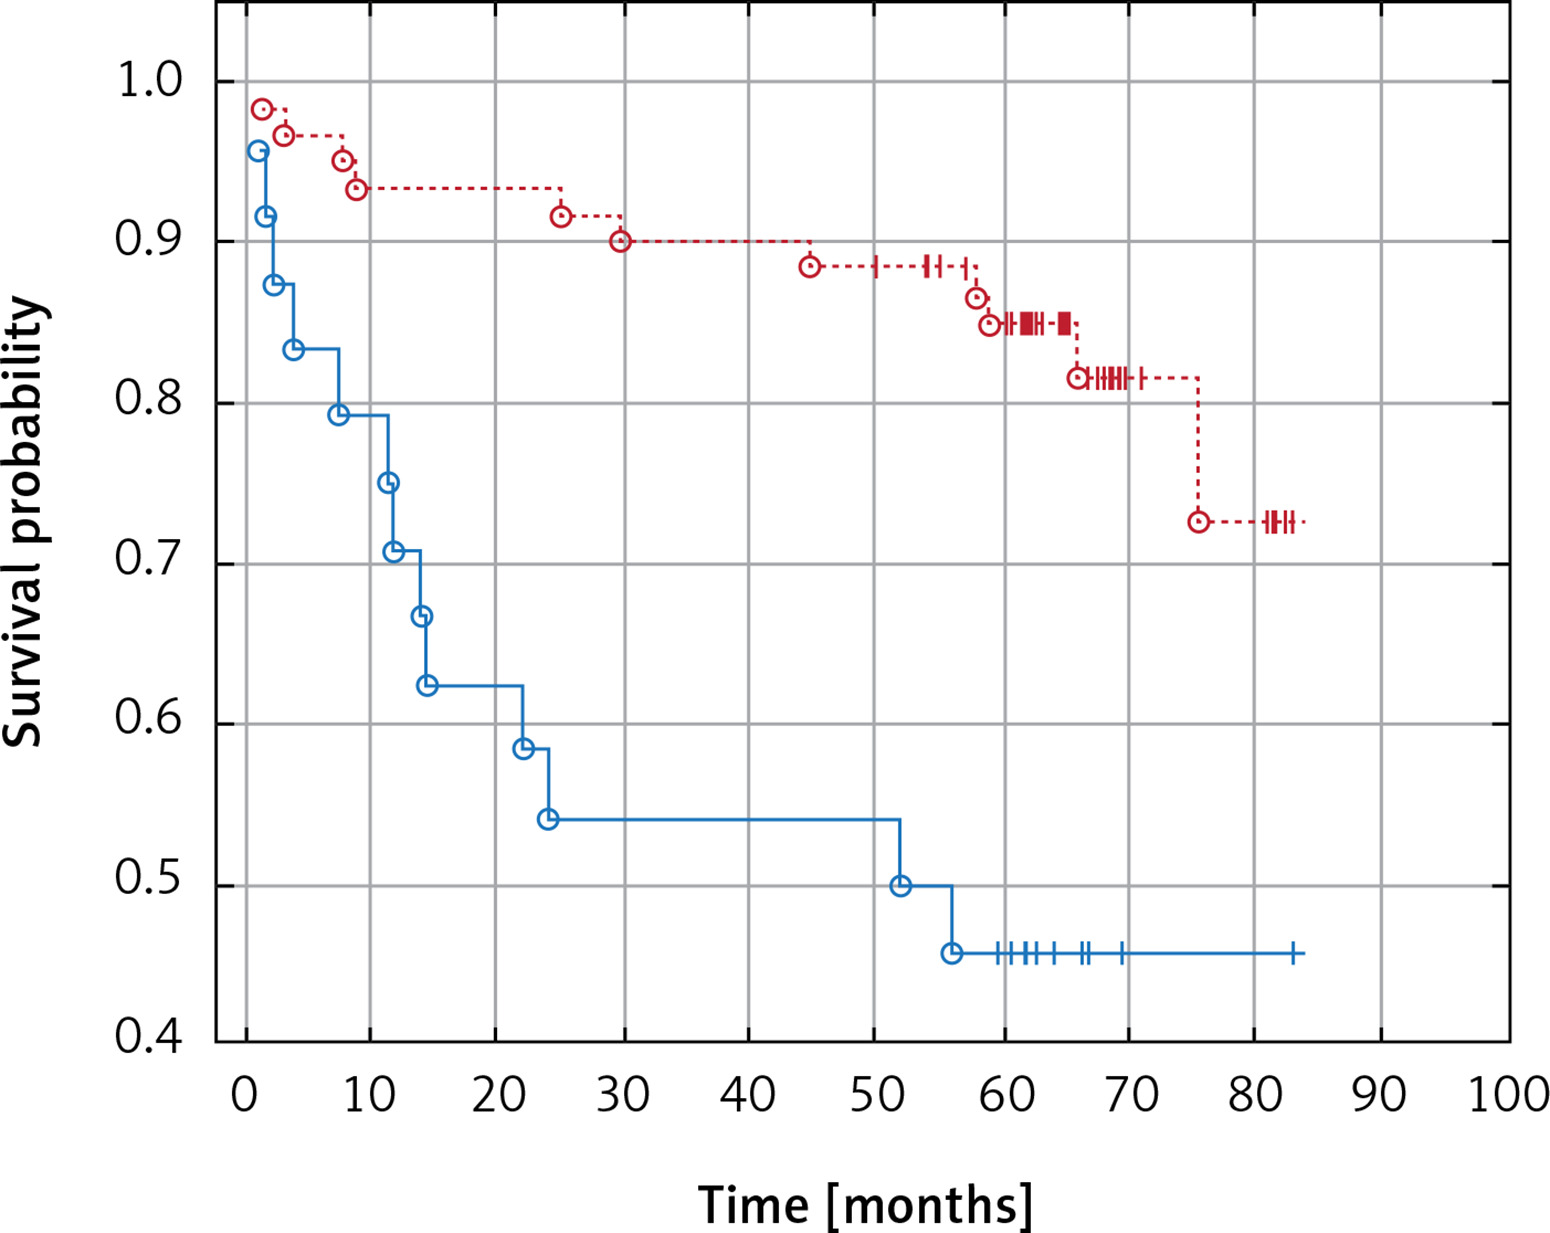
In Kaplan-Meier analysis, patients with increased fibrinogen levels had worse overall survival than those within normal ranges (53.7 vs. 64.7 months, p = 0.000, Figure 1), and patients with elevated pre-operative D-dimer concentrations had worse overall survival than those with D-dimers within the normal range (55.7 vs. 64.3 months, p = 0.000, Figure 2).
Discussion
Tissue factor is significantly elevated in tumor patients. It plays a role in induction and enhancement of clotting process and is a necessary cofactor for factor VII activation. A complex of TF/VIIa activates factors IX and X, thus initiating a reaction cascade that leads to thrombin generation and clotting [17]. Physiologically TF concentration is low but in response to tissue damage it rises dramatically proportionally to the severity of blood vessel wall damage. Tissue factor is also a marker of elevated thromboembolic readiness [18, 19] and is considered an important risk factor for thromboembolic events in cancer patients [20, 21]. It is essential for tumor growth and metastasis formation as it influences angiogenesis. In microparticles of cellular membranes, it is considered the most critical procoagulation factor [22]. Increased TF expression in tumor patients correlates with elevated frequency of thromboembolic events. Tumors with high TF expression cause thromboembolism more frequently than those with low expression of TF [23]. Studies examining the role of TF in kidney tumor patients are scarce. Immunohistochemical analysis has shown localization of TF antigens in the endothelial layer of blood canals inside the tumor, diffuse fibrinogen and factor V presence in perivascular connective tissue, and linear deposits of fibrin along tumor cells. Tissue plasminogen activator was observed in the endothelium of peritumoral vessels. Those results suggest that thrombin is synthesized locally in the tumorous tissue of kidney cancer and a regional fibrinolysis process controls clot formation [24].
In both the physiological and disease states, the prothrombotic activity of TF is inhibited by tissue factor pathway inhibitor (TFPI). Tissue factor pathway inhibitor is a protease inhibitor containing three inhibitory domains. The first domain inhibits the TF/VIIa complex, the second domain inhibits factor Xa, and the third domain is responsible for heparin content and lipoprotein binding. Tissue factor pathway inhibitor can primarily bind factor Xa and the TF/VIIA complex or directly inhibit the TF/VIIa/Xa complex [25]. Several factors modulate TF activity, which affects TFPI concentration, and low TFPI levels correlate with increased risk of venous embolism and recurrence [26–28]. Physiological concentrations of TFPI are not always sufficient to suppress the prothrombotic action of TF [29]. Because of their modes of action, TF and TFPI have become interesting targets of therapeutic intervention in cancer patients due to their ability to lower the risk of thromboembolic events as they can suppress tumor neoangiogenesis, a mechanism necessary for primary tumor and metastasis growth [30]. In this study, we observed significantly elevated levels of TF, total TFPI and full TFPI, while truncated TFPI was elevated but not found to be statistically significant. When compared to healthy volunteers, patients with kidney cancer had elevated TF (6-fold), truncated TFPI (2.5-fold), total TFPI (2-fold), and full TFPI (1.5-fold). Interestingly, there was no correlation between TF and TFPI. It can be presumed that in patients with kidney cancer, TFPI elevation is insufficient to counteract the prothrombotic action of TF. In our study, TF concentrations were only found to correlate with FXIII.
Clotting factor XIII (FXIII) is a zymogen consisting of 2 A catalytic subunits and 2 B carrier subunits (A2B2). In the presence of calcium ions, FXIII is converted by thrombin to active transglutaminase FXIIIa by removing 37 N-terminal amino acids of subunit A. Active FXIII stabilizes the clot by forming covalent bonds between fibrin fibers. Substrates for FXIIIa are also fibrinolysis inhibitors (α2-PI-inhibitor of α2-plasmin, plasminogen activator inhibitor PAI, thrombin activatable fibrinolysis inhibitor (TAFI)), fibrinogen, adhesive proteins (vitronectin, vitronectin, laminin, vWF factor, thrombospondin), vimentin, plasminogen, and apolipoprotein A [31–34]. Active FXIII also plays a role in the inactivation of the GPIIb-IIIa receptor by plasmin; in incorporation of fibrin into the clot, causing thickening of fibrin fibers; and in bond formation between αvβ3 integrin and vascular endothelial growth factor receptor 2 (VEGFR-2) on endothelial cells. Mechanical resistance of the clot, susceptibility to enzymatic fibrinolytic dissolution, resistance to shear forces and to other blood components (urea) are dependent on FXIII [33]. Apart from its role in hemostasis, FXIII acts in the angiogenesis process by forming αvβ3 integrin/VEGFR-2 bonds on endothelial cells [33, 34]. All these properties support the role of FXIII in matrix formation for primary tumors and metastases. In animal models, it was noted that inhibition of FXIIIa action prevents metastasis formation. It was postulated that FXIII takes part in metastasis formation by protecting tumor cells from natural killer (NK) cell action [35]. Additionally, Xu et al. showed different electrophoretic distributions of FXIIIb in patients with kidney cancer as compared to a control group and hypothesized that FXIIIb can be a marker for early kidney cancer [36]. In our study, increased FXIII concentrations were found in kidney tumor patients, suggesting a role for FXIII tumor angiogenesis, particularly as it has a positive correlation with TF concentration.
Our results show that platelet count is important in predicting kidney cancer survival. Both platelet count and function are often aberrant in cancer, and the most common pathology is thrombocytosis. Function aberrations manifest clinically as either bleeding diathesis or thromboembolism. In solid tumors, the tumor cells themselves can induce platelet adhesion and aggregation [37]. Apart from tumor derived microparticles, microplatelets also have TF on the surface and are necessary for thrombin generation [38]. In our study, platelet count was positively associated with clotting activation (TAT), fibrinolysis (D-dimers and PAP), and fibrinogen levels. Fibrinogen is the main ligand for the platelet GPIIb-IIIa receptor, which is responsible for platelet aggregation. Platelet counts did not differ in our study between cancer patients and healthy volunteers.
Fibrinogen and D-dimers were significantly correlated with survival in our study. Fibrinogen, apart from fibrin generation in the end phase of the clotting process, is a main ligand for platelet surface receptor GPIIb-IIIa, responsible for aggregation. It is also an acute-phase protein secreted in response to inflammation, infection, trauma, neoplastic processes, acute coronary syndrome, brain ischemia, and venous thromboembolic disease. Fibrinogen concentration is higher in patients with kidney cancer than in patients with benign tumors. Patients with disseminated disease have higher fibrinogen levels than those with localized cancer [39]. Several studies have shown that fibrinogen levels are a prognostic factor for overall survival in kidney cancer patients [40–43]. In our study, fibrinogen concentration correlated with endothelial damage (vWF), fibrinolysis activation (PAP, D-dimers), and platelet count. In our study, above normal concentration of fibrinogen (3.5 g/l) significantly lowered the probability of survival in patients with kidney cancer (Figure 1). Additionally, in patients with kidney cancer, fibrinogen concentration above 5.9 g/l was a marker of poor survival.
We also observed a rise in activity of the coagulation system (TAT), fibrinolysis processes (PAP, D-dimers), and elevated endothelial damage markers (vWF, TF) in cancer patients as compared to the control group. D-dimer concentrations above 0.6 mg/ml were associated with poorer survival in patients with kidney cancer. In patients with combined malignant tumors and D-dimer concentrations above normal (> 0.5 mg/dl), lower survival rates were observed when assessed against patients with a normal D-dimer concentration (Figure 2).
Apart from laboratory abnormalities, the presence of renal vein thrombosis is associated with poor survival. Some authors have observed that renal vein thrombosis does not worsen prognosis in kidney cancer patients [10, 11]. Others have concluded that the presence of thrombosis and its extent are significant risk factors for poor survival, leading to the TNM staging system: T3a – with thrombus present in the renal vein and T3b and T3c – thrombus present in the inferior cava vein below and above the diaphragm [12, 13].
Our study has some limitations. The experimental group consists of only 96 patients with mixed (malignant and benign) histology. We used this mixed group as pre-operatively we usually do not know the nature of the tumor. Prognostic Cox models were constructed as post-operative models only, but this method tested the influence of clotting and fibrinolysis pathways in cancer patients.
So far, no prognostic model used in clinical decision making incorporates any clotting parameters in patients who undergo surgery due to kidney cancer. The addition of these parameters could increase model accuracy, aid in proper patient selection for surgery, and improve adjuvant treatment options after surgery. They may also provide improved response prediction in patients treated with antiangiogenic or immunomodulatory drugs. Our results support the idea that simple basic laboratory evaluations of fibrinogen and D-dimers prior to surgery could aid in predicting the further disease course and survival of kidney cancer patients.
In conclusion, in patients with malignant kidney tumors, pre-operative and post-operative evaluation of fibrinogen and D-dimers should be mandatory. In kidney cancer patients who undergo surgery due to primary tumors, elevated fibrinogen and D-dimer levels are associated with poor overall survival.