Introduction
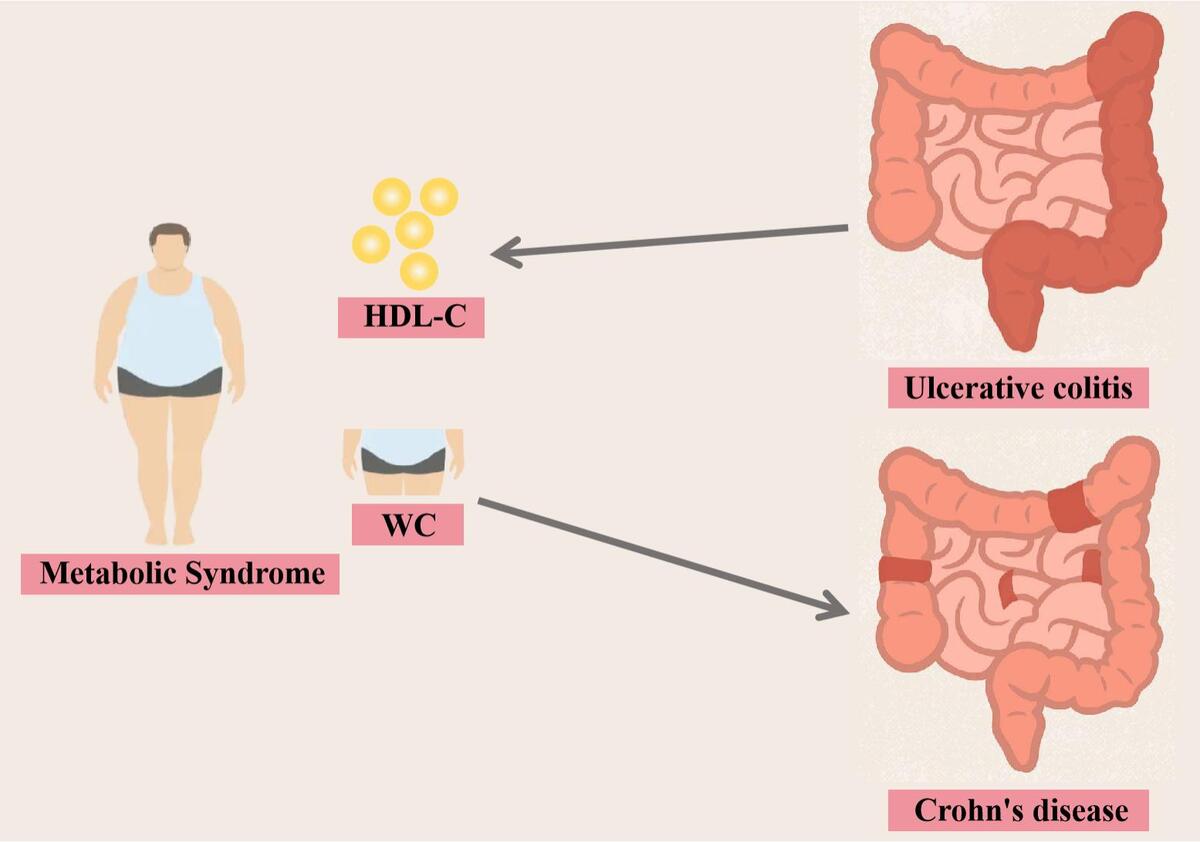
Inflammatory bowel disease (IBD) is a chronic, immune-mediated inflammatory disease of the intestine. Ulcerative colitis (UC) and Crohn’s disease (CD) are the two main types of IBD. The pathogenesis of IBD remains unknown, but it involves complex interactions among genetic, environmental, microbial, and immune factors. The incidence of IBD is increasing globally [1]. Metabolic syndrome (MetS) is a group of complex metabolic disorders that includes obesity, dyslipidemia, hypertension, and insulin resistance; the syndrome has a global incidence of approximately 12–31% [2, 3]. The clinical features of MetS include elevated diastolic or systolic blood pressure, increased fasting blood glucose and triglyceride levels, increased waist circumference, and decreased levels of high-density lipoprotein cholesterol [4].
Epidemiological studies have revealed similar upward trends in the incidences of IBD and MetS in recent decades, suggesting a common environmental link between these two diseases. Both diseases share clinically relevant features, such as an increased risk of cardiovascular disease [5, 6] and increased incidences of non-alcoholic cirrhosis [7, 8] and obesity [9, 10]. MetS is a common comorbidity of IBD, and their co-occurrence is increasing in incidence. MetS and IBD have several similar pathophysiological features, including immune imbalance, chronic inflammation, adipose tissue dysfunction, and disorders of the gut microbiota [11]. Although studies have suggested an association between MetS and a poor prognosis of IBD [12, 13], previous studies on the relationship between IBD and MetS have largely been limited to observational or single-center studies with small sample sizes. Consequently, the causal relationship between IBD and MetS remains unclear [14].
Mendelian randomization (MR) is a genetics-based research method used to assess the causal effects of exposure factors on outcomes. It employs genetic variations associated with these factors as instrumental variables. The core concept of this method is that genetic variation in the population is randomly distributed, similar to the randomization employed in randomized controlled trials; this effectively controls the influence of confounding factors [15].
Therefore, this study aimed to use MR to explore the causal relationship between MetS and IBD based on the latest summary statistics of genome-wide association studies (GWASs), providing new insights into the prevention and treatment of IBD.
Material and methods
The overall study design of this bidirectional two-sample MR analysis is shown in Figure 1. To be used as instrumental variables, single nucleotide polymorphisms (SNPs) were required to meet three assumptions: (1) they are associated with the exposure, (2) they are independent of any confounding factors in the exposure–outcome relationship, and (3) they affect the outcome solely through the exposure [16]. The detailed summary data used in the present study are shown in Table I. This study was conducted in accordance with the Strengthening the Reporting of Observational Studies in Epidemiology Using Mendelian Randomization reporting guidelines [17]. All data used in this study are derived from published public databases; therefore, no additional ethical approval was required.
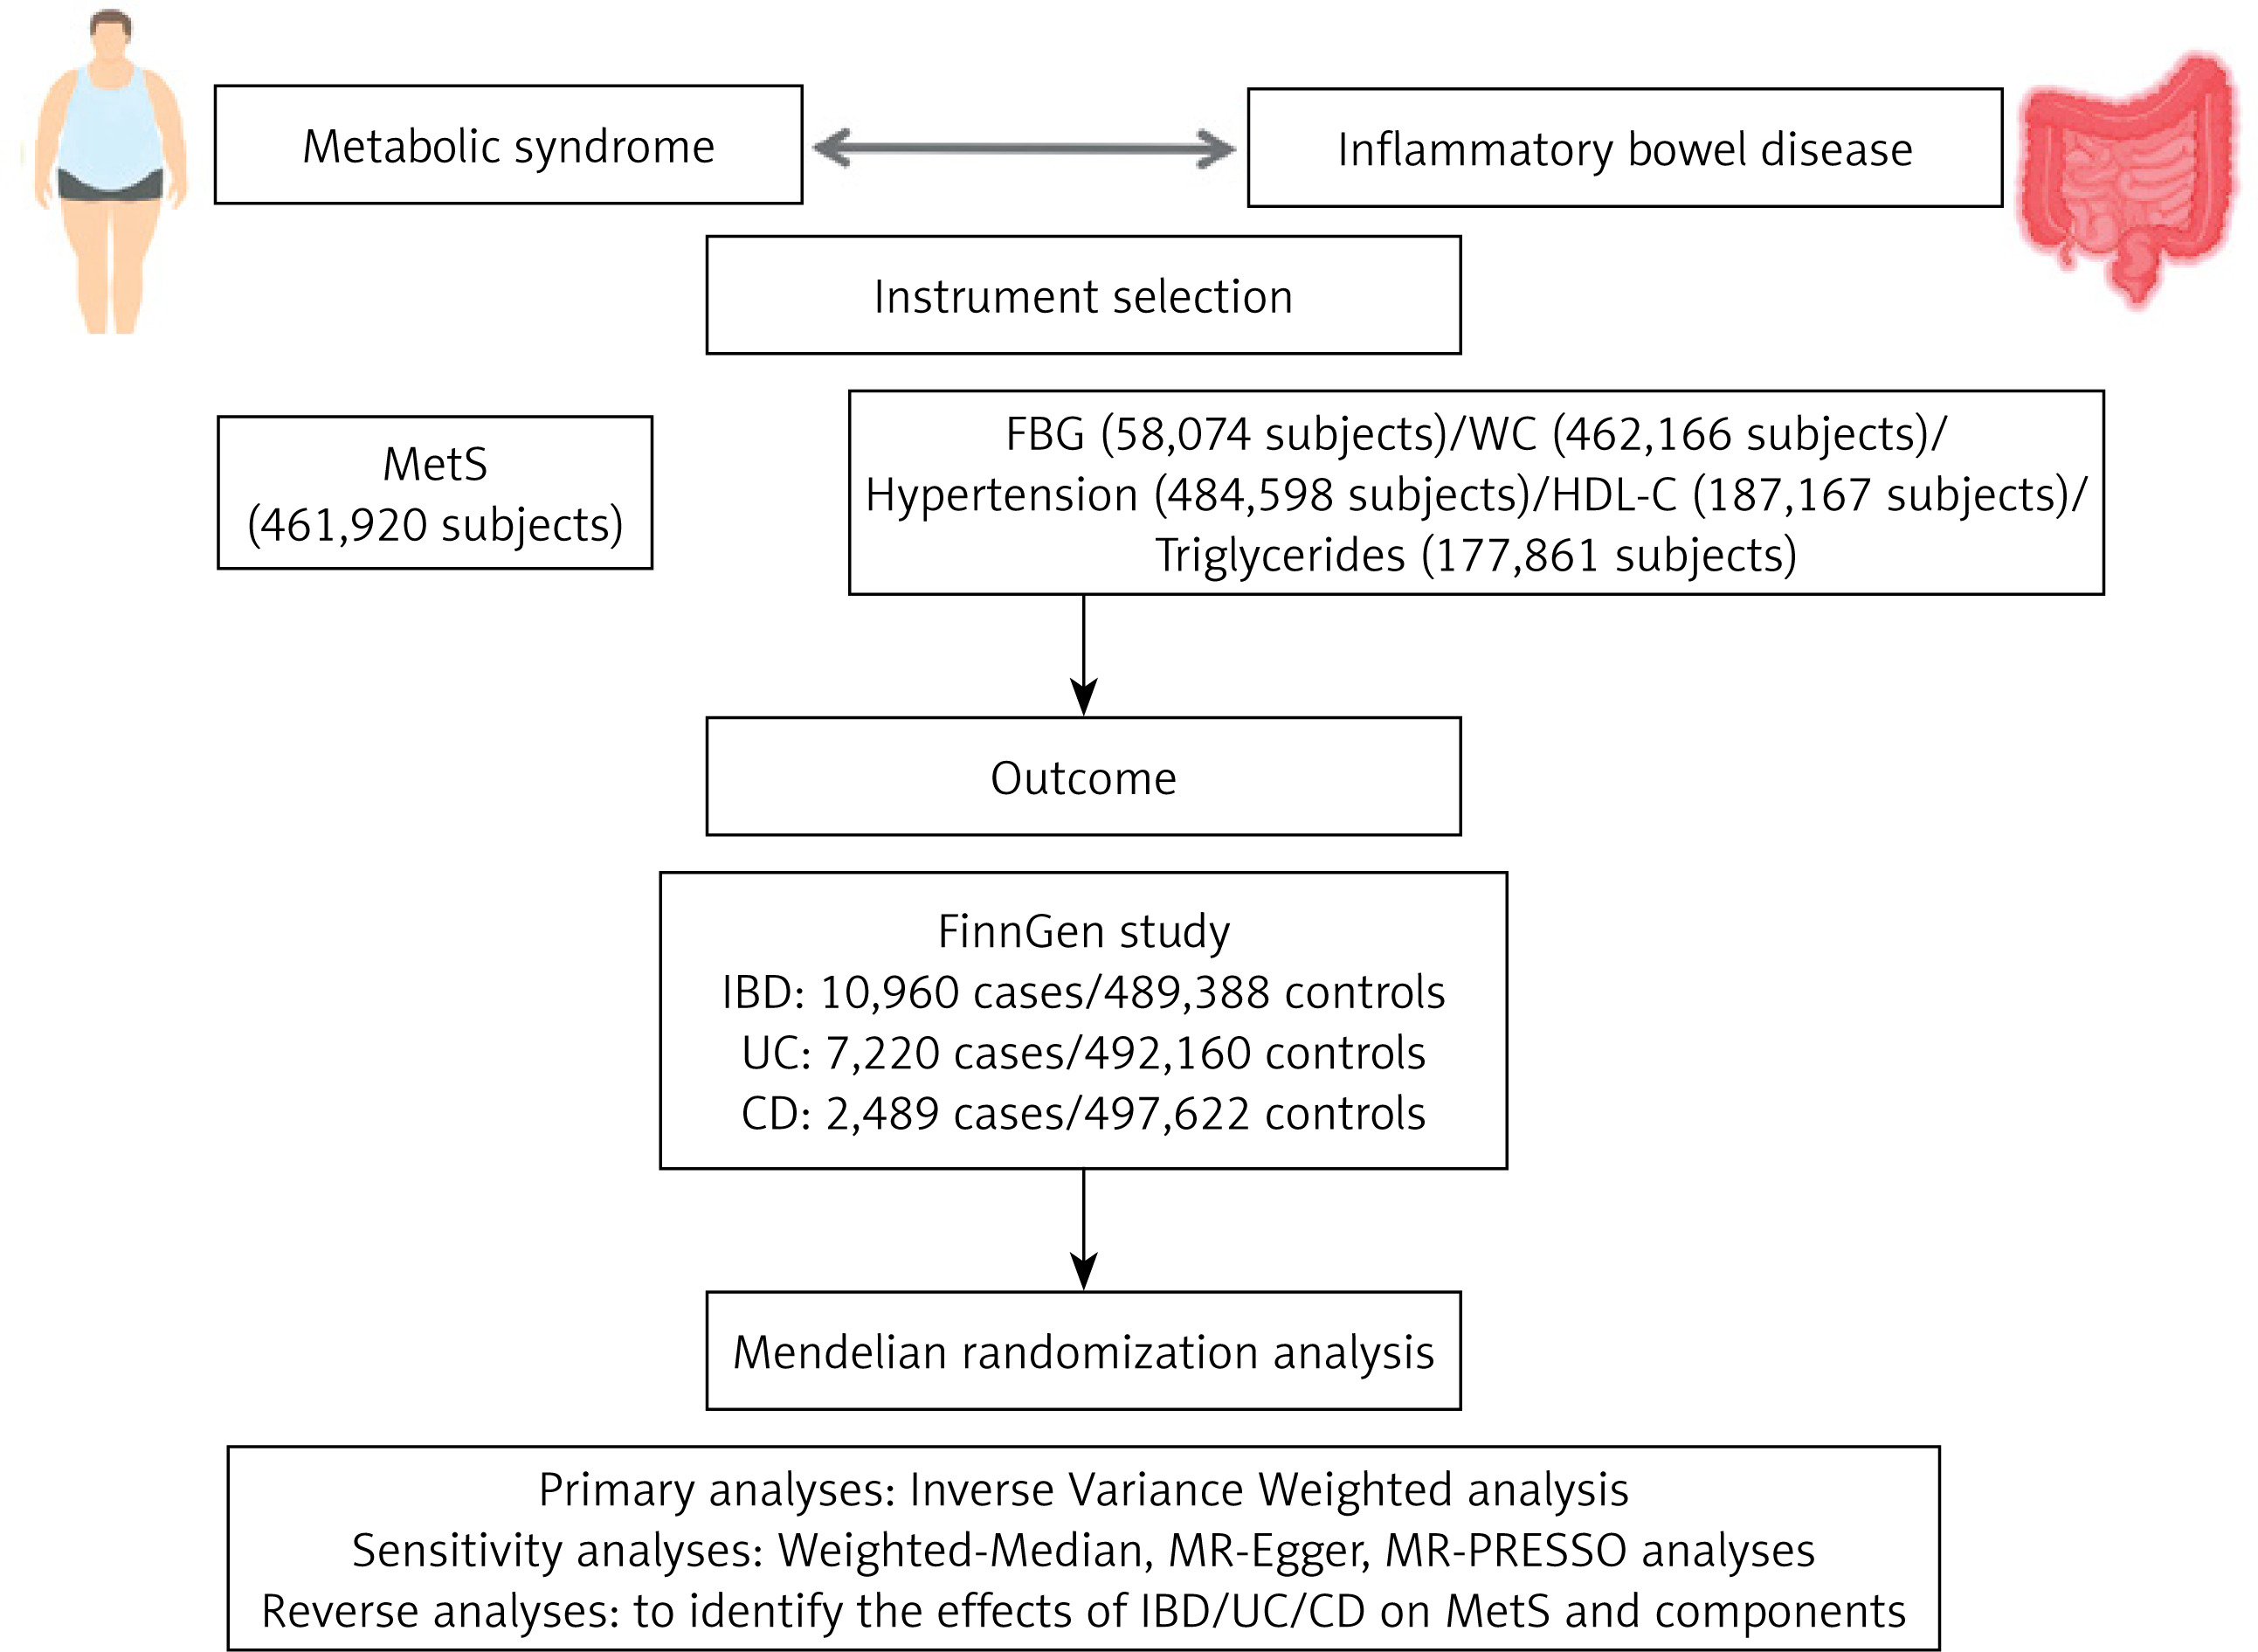
Table I
Characteristics of the genome-wide association studies used in this analysis
| Phenotypes | Ancestry | Sample size | Data sources |
|---|---|---|---|
| MetS | European | 461,920 | van Walree et al. |
| FBG | European | 58,074 | https://gwas.mrcieu.ac.uk/datasets/ebi-a-GCST005186/ |
| WC | European | 462,166 | https://gwas.mrcieu.ac.uk/datasets/ukb-b-9405/ |
| Hypertension | European | 484,598 | https://gwas.mrcieu.ac.uk/datasets/ebi-a-GCST90038604/ |
| HDL-C | Mixed (96% European) | 187,167 | https://gwas.mrcieu.ac.uk/datasets/ieu-a-299/ |
| Triglycerides | Mixed (96% European) | 177,861 | https://gwas.mrcieu.ac.uk/datasets/ieu-a-302/ |
| IBD | European | 500,348 | FinnGen consortium |
| UC | European | 499,380 | FinnGen consortium |
| CD | European | 500,111 | FinnGen consortium |
Source of GWAS data
MetS GWAS
GWAS data for MetS were obtained from the Center for Neurogenomics and Cognitive Research database, including data from a study by Van Walree et al. [18] – the largest GWAS study so far to focus on MetS, which includes data from 461,920 individuals of European ancestry. The GWAS summary data of the five components of MetS (waist circumference (WC), high blood pressure, fasting blood glucose (FBG), high-density lipoprotein cholesterol (HDL-C), and triglyceride (TG) were obtained from the IEU Open GWAS database (https://gwas.mrcieu.ac.uk/).
IBD GWAS
GWAS data for IBD and its subtypes – UC and CD – were obtained from the latest FinnGen R12 dataset [19], which includes 10,960 cases and 489,388 controls for IBD, 7,220 cases and 492,160 controls for UC, and 2,489 cases and 497,622 controls for CD.
Instrument selection
Strict selection criteria and linkage disequilibrium clumping were used to identify suitable instrumental variables for the MR analyses. SNPs with a genome-wide significance level of p < 5 × 10⁻⁸ were included. Furthermore, we performed a linkage disequilibrium clumping and excluded SNPs with an r2 value of ≥ 0.001 and a clump distance of ≤ 10,000 kb to eliminate SNPs that correlated more strongly with outcomes than with exposure [20]. The F statistic was calculated separately for each SNP. Weak instrumental variables were defined as those with an F statistic of < 10, and all weak instrumental variables were excluded from the analyses [21].
Statistical analysis
A generalized inverse variance weighted (IVW) MR approach was used for the principal analysis. MR analysis was conducted for each of the three European databases, and the overall effect of each specific outcome was assessed using a meta-analysis. Cochrane’s Q was used to calculate the I2 statistics to assess the heterogeneity of the SNP estimates. A random effects model was used when significant heterogeneity was detected (p < 0.05); otherwise, a fixed effects model was used. Several complementary methods were applied to provide reliable and consistent causal estimates, including the weighted median [22], MR-Egger [23], and Mendelian Randomization Pleiotropy RESidual Sum and Outlier (MR-PRESSO) [24] methods. The p-value of the MR-Egger method intercept was used to evaluate the horizontal pleiotropy, with p < 0.05 indicating the presence of horizontal pleiotropy. An MR-PRESSO analysis was performed to identify and eliminate outliers, and to evaluate whether a significant difference in the causal effect could be observed after these outliers were removed (p < 0.05). The leave-one-out method was used to determine whether the overall causal effect was influenced by any single SNP, which could potentially introduce bias. Multiple tests were performed using the Benjamini–Hochberg correction to control the false discovery rate; correlations with p < 0.05 were considered significant.
All statistical analyses were performed using the R packages MR-PRESSO and TwoSampleMR within the open-source statistical software R (version 4.4.0; R Foundation for Statistical Computing, Vienna, Austria).
Results
Causal role of MetS in IBD, UC, and CD
Our results suggested that MetS could increase the risk of CD (OR = 1.34, 95% CI: 1.009–1.779; p = 0.043) with low heterogeneity. Genetically predicted MetS was also not associated with IBD and UC (Figure 2). In further analysis, we found a causal relationship between waist circumference and CD (OR = 1.33, 95% CI: 1.05–1.684; p = 0.018) and a causal relationship between hypertension and UC (OR = 1.61, 95% CI: 1.084–2.39; p = 0.018) in the MetS component with low heterogeneity (Figure 2). Our study found no causal relationship between genetically predicted FBG, HDL-C, triglycerides and IBD, UC, and CD. The scatter plots for the forward analyses and the leave-one-out analyses for each SNP association are summarized in Supplementary Figures S1 and S2, respectively. Detailed information regarding the instrumental variables for MetS and components is provided in Supplementary Tables. Sensitivity analyses, including the weighted median, MR-Egger, and MR-PRESSO methods, yielded consistent findings (Table II). The statistical results between FBG and UC based on the MR-Egger intercept show horizontal pleiotropy, while other statistical results do not show horizontal pleiotropy (Table II).
Figure 2
Genetically predicted association between MetS and IBD by forward MR analysis
IBD – inflammatory bowel disease, UC – ulcerative colitis, CD – Crohn’s disease, FBG – fasting blood glucose, WC – waist circumference.
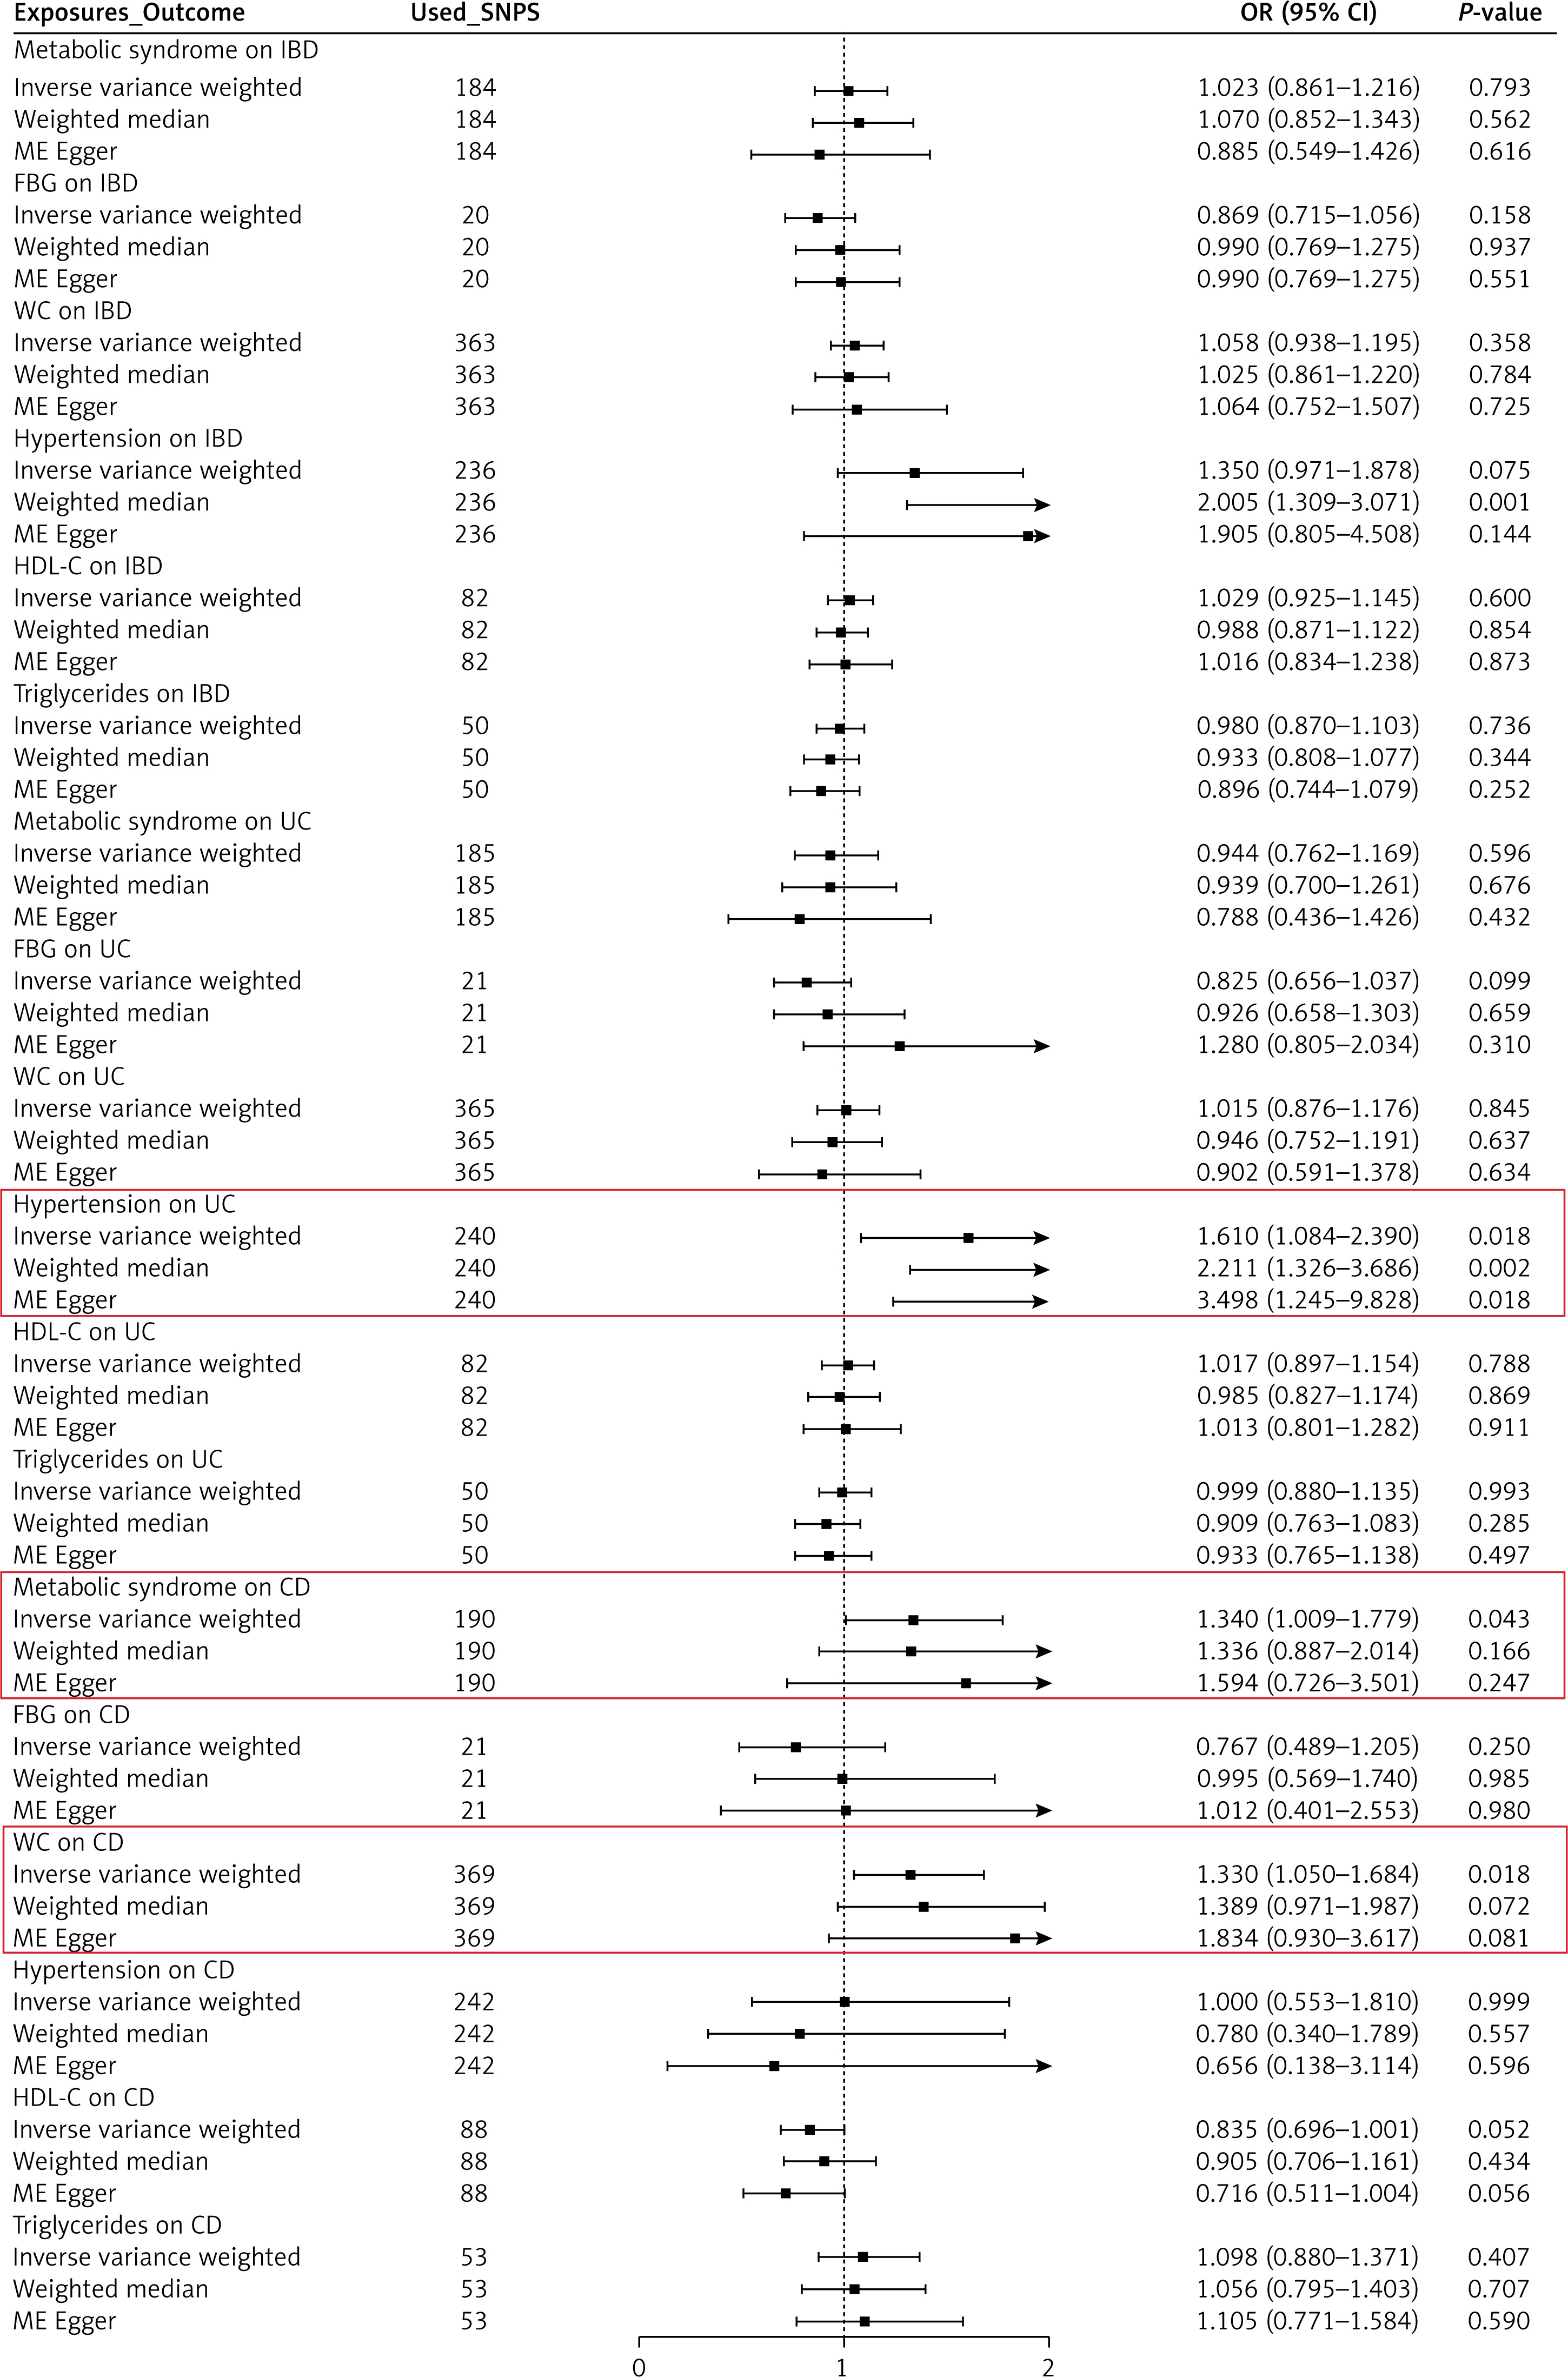
Table II
Results of the forward Mendelian randomization analysis for the effect of metabolic syndrome on inflammatory bowel disease
Causal role of IBD, UC, and CD in MetS
In reverse analysis, our findings showed that genetically predicted IBD, UC, and CD were not associated with MetS (Figure 3). In addition, we found a causal relationship between IBD and triglycerides (OR = 1.019, 95% CI: 1.000–1.038; p = 0.049) with no heterogeneity (Figure 3). Our results suggest no causal relationship between genetically predicted IBD, UC, and CD and FBG, WC, HDL-C, and hypertension. No horizontal pleiotropy was observed for all outcomes. The sensitivity analysis revealed similar findings (Table III). Scatter plots for the reverse analyses and the plots of the leave-one-out analyses for each SNP are summarized in Supplementary Figures S3 and S4, respectively. Detailed information regarding the instrumental variables for IBD, UC, and CD is provided in Supplementary Tables.
Figure 3
Genetically predicted association between IBD and MetS by reverse MR analysis
IBD – inflammatory bowel disease, UC – ulcerative colitis, CD – Crohn’s disease, FBG – fasting blood glucose, WC – waist circumference.
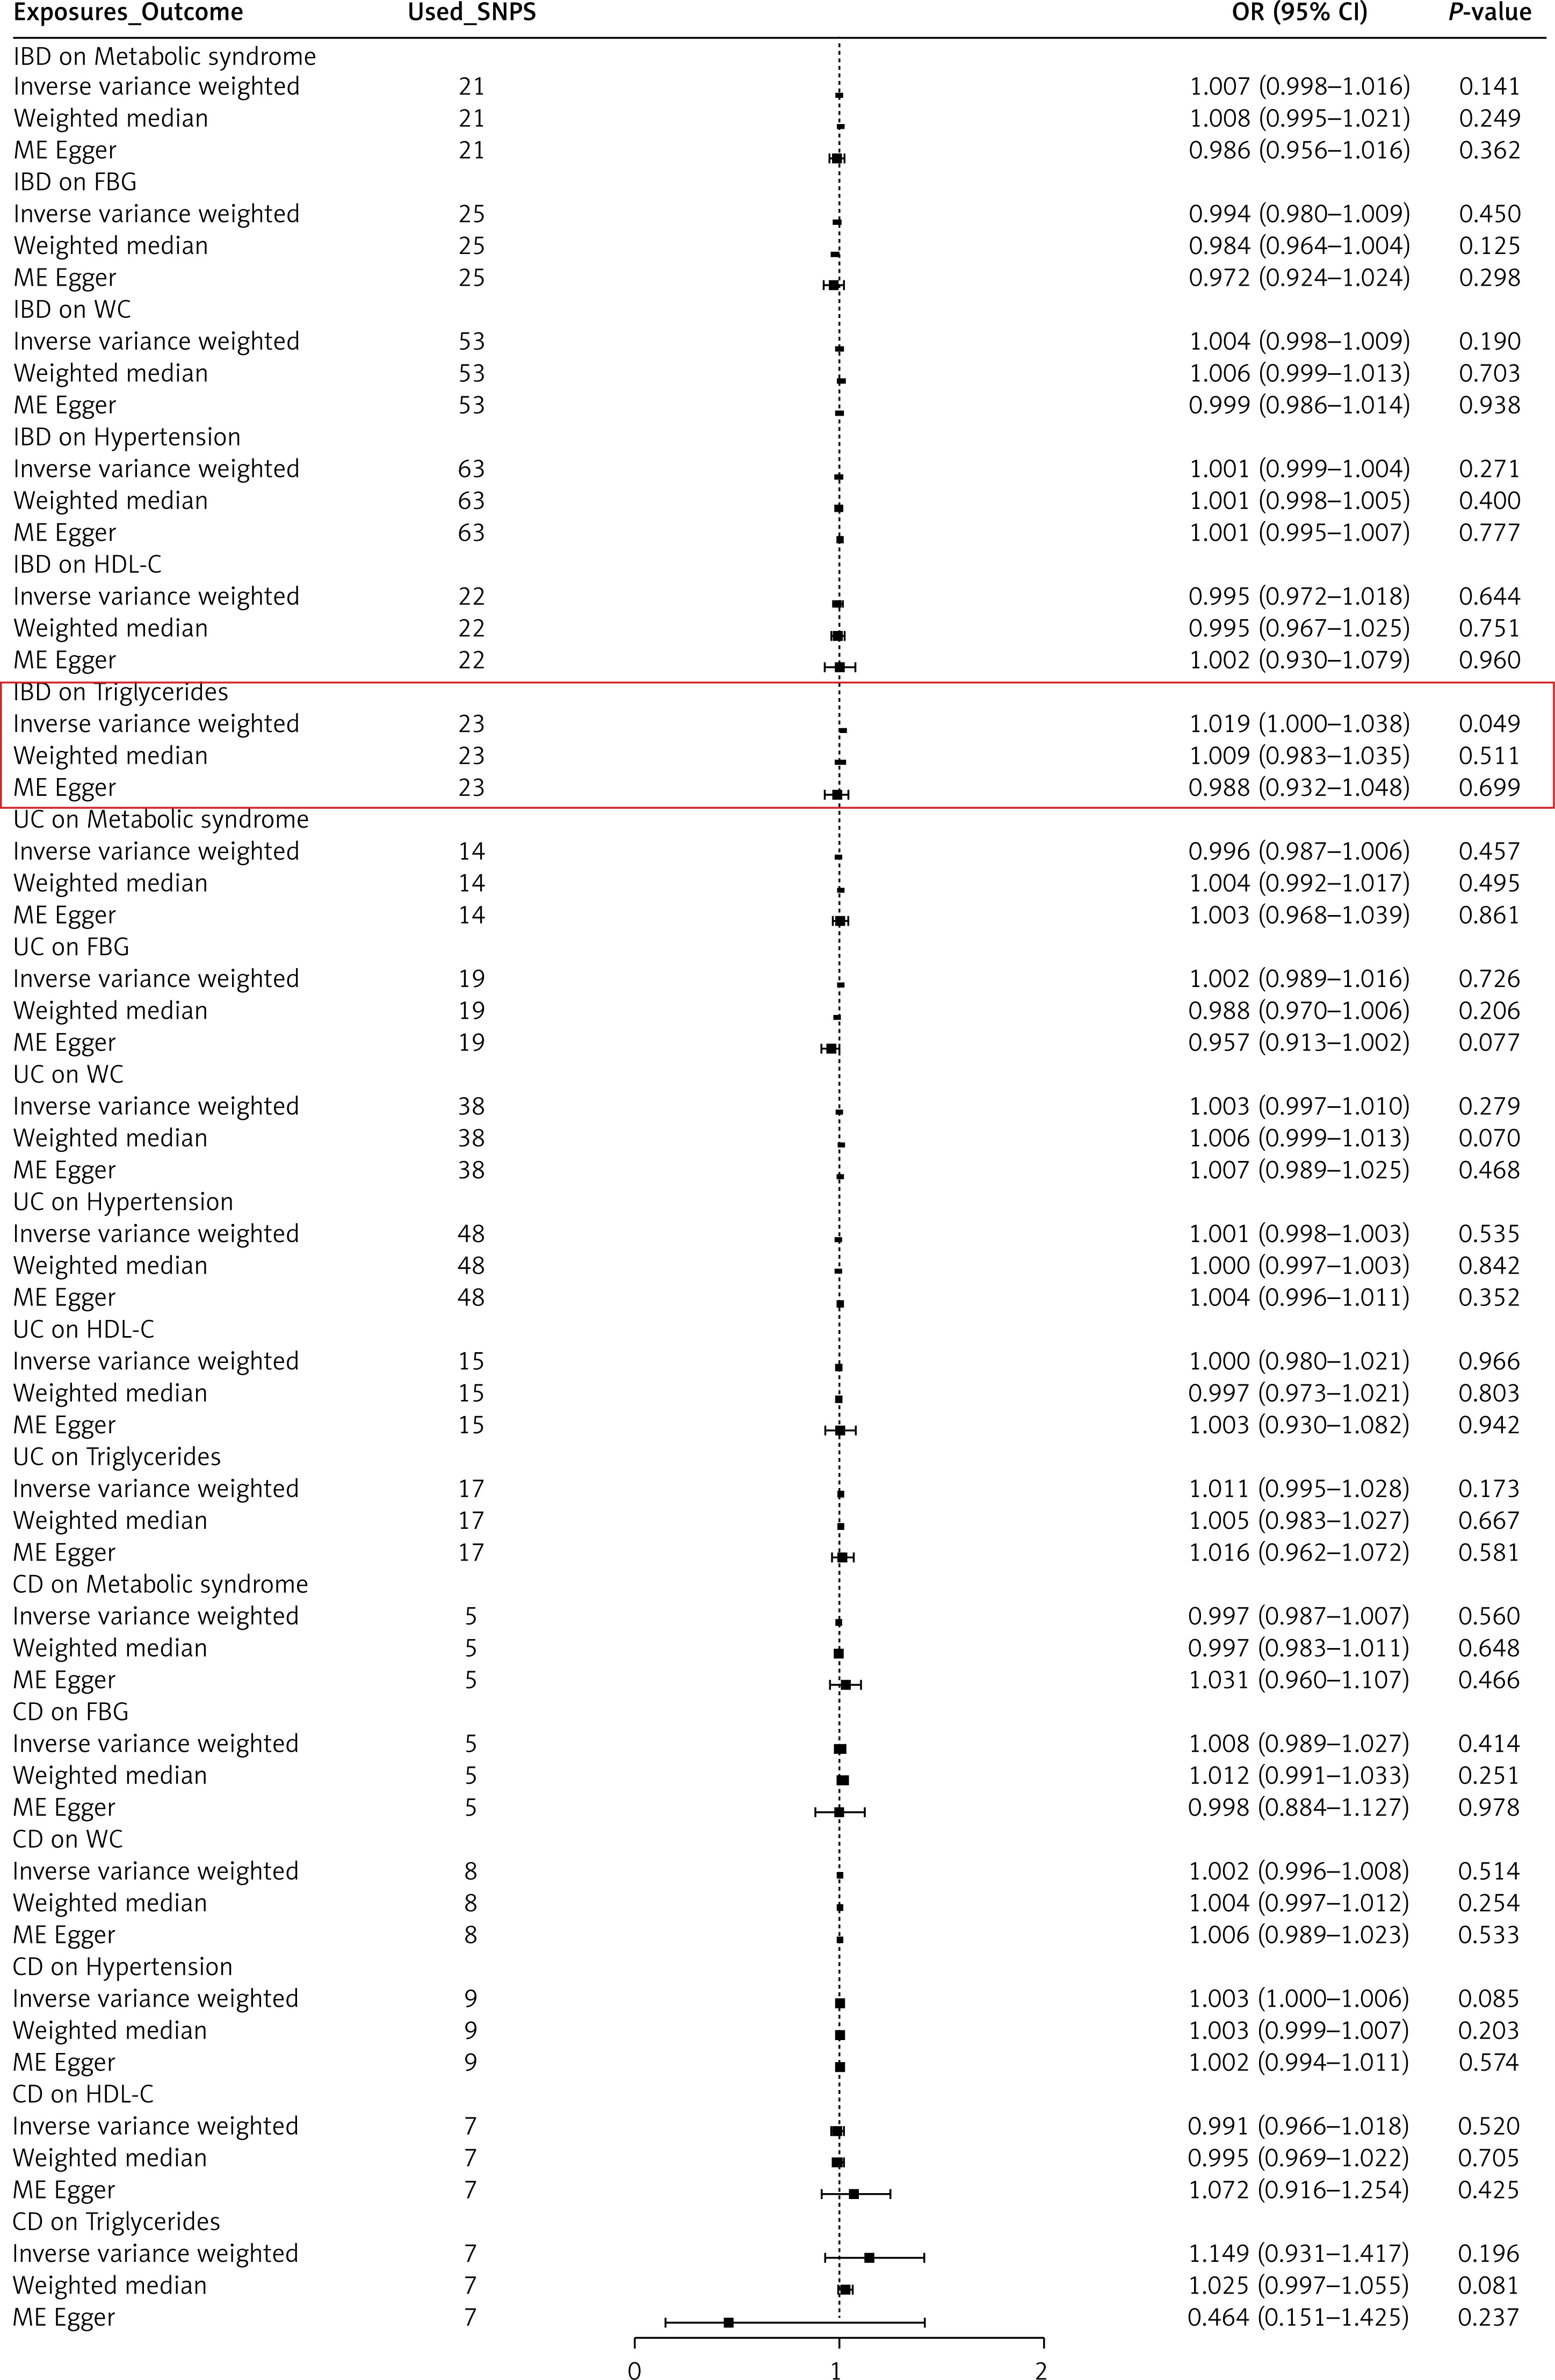
Table III
Results of the reverse Mendelian randomization analysis for the effect of inflammatory bowel disease on metabolic syndrome
Discussion
This is the first study to comprehensively examine the causal relationship between MetS and IBD, including the IBD subtypes UC and CD. After rigorous reverse variance weighted analysis and sensitivity analysis, our results revealed a significant association between MetS, WC, hypertension, triglycerides, and IBD.
The comorbidities of IBD must be considered during treatment, as they can alter disease activity and parenteral manifestations, ultimately affecting the disease prognosis and drug treatment responses. The global incidences of MetS and IBD have increased in tandem, and approximately 19.4% of patients with IBD also have MetS [25]. As a comorbidity of IBD, MetS increases the risk of cardiovascular disease, liver disease, and surgical complications and reduces patients’ quality of life [5, 12, 25–27]. Obesity, a characteristic of MetS, may increase the incidence and severity of CD and the risk of cancer, and affect the patient’s response to treatment, although MetS does not have the same impact in patients with UC [9, 28–30]. Previous studies on the effects of MetS on IBD were observational, rendering them susceptible to reverse causality and other biases. The causal relationship between MetS and IBD remains unclear, as some studies have reported conflicting results [31, 32]. Through the use of different estimation models and rigorous sensitivity analyses, MR effectively reduces potential biases such as confounding and reverse causality, enhancing the causal reasoning and ensuring the reliability and robustness of the study findings. The results of this study suggest that MetS may increase the risk of CD. In a further analysis of MetS components, increased WC appeared to have a more significant effect on risk of CD. In addition, we observed that hypertension may increase the risk of UC, and IBD may lead to elevated triglyceride levels.
Although there is limited research on the causal relationship between MetS and IBD, there have been several studies exploring whether obesity, a core component of MetS, has an impact on the development of IBD, but they have provided inconsistent and conflicting evidence [33–40]. While most cohort studies have proposed that general obesity, as represented by body mass index, increases the risk of CD and decreases the risk of UC [35, 38–40], a few studies have shown inconsistent findings [35, 37, 39]. As for abdominal obesity as measured by WC, limited cohort study evidence suggests a positive association with the risk of CD [34, 40]. WC usually reflects abdominal adipose tissue, including visceral adipose tissue (VAT) and subcutaneous adipose tissue (SAT). VAT, adipocyte dysfunction, chronic low-grade inflammation, and insulin resistance are components of MetS [41], and VAT plays a central role in the pathophysiology of MetS. Therefore, VAT may contribute to chronic systemic inflammation in patients with MetS or IBD [11]. As an important endocrine organ regulating the body’s energy homeostasis, adipose tissue plays a key metabolic role by secreting adipokines with pro-inflammatory and anti-inflammatory activities [42]. In a normal metabolic state, the balance between pro-inflammatory and anti-inflammatory adipokines maintains homeostasis; however, excessive calorie intake can cause fat cells to become hypertrophic, leading to central obesity. If this state persists and exceeds the buffering capacity of adipocytes, the cells are subjected to oxidative stress, resulting in cellular disruption and the production by adipose tissue of abnormal levels of resistin, leptin, and adiponectin [43, 44]. Hypertrophic adipocytes secrete interleukin-6, tumor necrosis factor-α, and monocyte chemoattractant protein-1, which recruit monocytes and promote their differentiation into pro-inflammatory macrophages. These macrophages infiltrate the VAT and promote chronic, low-grade inflammation throughout the body [45]. Unlike subcutaneous adipose tissue, VAT actively promotes local systemic inflammation [46]. Individuals with obesity and VAT are more likely to develop MetS and IBD than individuals with SAT [47]. In patients with CD, VAT will cover the intestinal surface to form “creeping fat”. Creeping fat cells have inflammatory characteristics, and the expression of cytokines and adipokines involved in inflammation is increased [48]. As an important indicator of disease activity, creeping fat is found in 100% of patients with CD, whereas it is generally absent in UC [49]. In addition, compared with UC patients, the visceral adipose tissue of CD patients is more prone to inflammation and colonization by intestinal bacteria [50]. Therefore, MetS and WC may be more strongly associated with the risk of CD than UC.
Hypertension is an important component of MetS, and hypertension and IBD share some common core pathways in pathogenesis. Pro-inflammatory signaling molecules, including interleukin-1β, tumor necrosis factor-α, and interleukin-6, are significantly elevated in both diseases. These molecules coordinate chronic inflammation, endothelial dysfunction, and smooth muscle cell proliferation, which leads to plaque formation and vascular damage. In essence, the persistence of systemic inflammation triggered by these cytokines is the common driving force behind the development and progression of IBD and cardiovascular disease. The endothelium is an important regulator of vascular function and plays a key role in maintaining cardiovascular health. In healthy conditions, endothelium promotes vasodilation, inhibits thrombosis, and regulates inflammation. Endothelial dysfunction disrupts this delicate balance, resulting in impaired vasoconstriction and vasodilation [51]. A previous cohort study suggested that UC patients have a higher cumulative risk of developing hypertension than the general population [52]. Another meta-analysis found that patients with IBD had a higher risk of co-existing hypertension [53]. However, the evidence for a causal relationship between hypertension and IBD remains limited. This study found for the first time that hypertension may increase the risk of UC through MR analysis, but its mechanism still needs further study. In addition, previous studies have shown elevated triglyceride levels in IBD patients [54, 55], and triglycerides play an important role in atherosclerosis [56]; similarly, the results of this study indicate that IBD increases triglyceride levels, suggesting that IBD may increase the risk of cardiovascular disease.
Although this study used MR to effectively control for confounding factors and inverse causality, some limitations remain. First, MR analyses infer causal hypotheses by randomly assigning genetic variants, so it is difficult to fully distinguish between pleiotropy and mediations during the analysis. Second, the genetic data used in this study were primarily derived from European populations and may limit the applicability of the findings to other ethnicities and regions. Finally, larger sample sizes and more advanced methodologies are needed to confirm these findings and enhance the statistical power.
In conclusion, this MR analysis showed a causal relationship between genetically predicted MetS and CD, and genetically predicted hypertension and UC. Therefore, these patients need to be closely monitored clinically for the risk of CD/UC comorbidities. In patients with IBD, close monitoring of triglyceride-associated cardiovascular risk is required.