Goal-directed fluid management constitutes an inseparable part of the perioperative routine practice of anesthesiologists. The patient’s dehydration or overhydration status frequently contributes to severe sequelae secondary to cardiopulmonary dysfunction and impairs enhanced recovery after surgery in the long term. Therefore, stringent fluid management tailored to the individualized volume status in those patients is mandatory. The application of inferior vena cava (IVC) respiratory variation in predicting fluid responsiveness has been a standard practice for patients undergoing major surgery in the tertiary hospital. However, the role of IVC-derived variables in fluid responsiveness evaluation in mechanically ventilated patients remains undetermined [1]. In addition, the acquisition of IVC images at the subxiphoid area is unavailable in patients undergoing open surgery with an abdominal midline incision. However, the superior vena cava (SVC) variation during the respiratory phase has better diagnostic value for volume status assessment, with high sensitivity and specificity [2, 3]. The subjects in those studies, however, unexceptionally received transesophageal echocardiographic (TEE) examination. Besides the high cost of purchasing this device and the relatively long duration of the learning curve for novices in the TEE technique, this mini-invasive procedure carries potential risks from denture injury and throat contusion to gastrointestinal tract perforation and bleeding [4]. In the present study, we tried to obtain the SVC image through superficial transthoracic echocardiography (TTE) and assess the diagnostic validity of the volume status assessment of patients with SVC-derived variables.
The prospective cohort study was conducted between September 2020 and December 2020. Ethical approval for this study (No. 2017-122-02) was provided by the Ethics Committee of Drum Tower Hospital, Medical College of Nanjing University, Nanjing, China (Chairperson Lili Sha) on 26 September 2017. All patients provided written informed consent.
Mechanically ventilated patients aged 25 to 75 years, with ASA physical status II to III (patients with mild systemic disease were classified as ASA II; patients with severe systemic disease that limits activity but is not incapacitating were classified as ASA III [5]) following elective abdominal surgery, were consecutively recruited to this study. Patients with spontaneous respiratory effort, irregular heart rhythm, peripheral vascular disease, cardiopulmonary dysfunction, intraabdominal hypertension, poor ultrasonographic image quality, as well as those who may be jeopardized by fluid challenge test, were excluded. Patients were mechanically ventilated using a volume-control mode with a tidal volume of 8 ml/kg, respiratory rate of 12 breaths/min and positive end expiratory pressure of 5 cm H2O. The fluid challenge was performed using 5 ml/kg of compound sodium chloride infused for 15 min. According to whether cardiac output (CO) increased ≥ 15% or not, patients were classified as responders or non-responders. All transthoracic ultrasound measurements were performed by a professional investigator in echocardiography using a Philips EPIQ 7C machine (Philips Healthcare, Andover, Massachusetts). The longitudinal axis of the SVC was obtained from the left parasternal region according to the methodology described in the previous studies conducted by Ugalde et al. [6], with the patients in a semi-recumbent position (Figures 1, 2). SVC collapsibility index (SVCCI) was calculated as SVCCI = (SVCmax – SVCmin)/SVCmax. CO can be estimated using the formula CO = 3.14 × (D × 2–1)2 × VTI × HR after achieving the velocity-time interval (VTI) of left ventricular outflow tract (LVOT) blood flow and the diameter (D) of the LVOT according to the standard protocol [7]. Receiver operating characteristic (ROC) curve analysis was performed to determine the ability of vena cava-related parameters in predicting fluid responsiveness. The optimal cut-off value was determined by the point of the maximum Youden index (sensitivity + specificity – 1) [8]. The gray zone approach determined by the area between 90% sensitivity and 90% specificity was used to determine an uncertain range of predictive parameters [9].
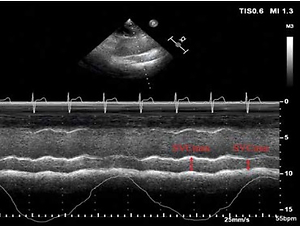
Figure 1
M-mode visualization of the superior vena cava (SVC) measured with transthoracic echocardiography showing the maximal (SVCmax) and minimal (SVCmin) diameters over the respirophasic cycle (A). Receiver operating characteristic curves showing the ability of superior vena caval collapsibility index (SVCCI) (B) to discriminate responders from nonresponders. Sensitivity and specificity plots predicting fluid responsiveness according to the values of SVCCI (C) to determine the gray zone, which is indicated by the two vertical dotted lines
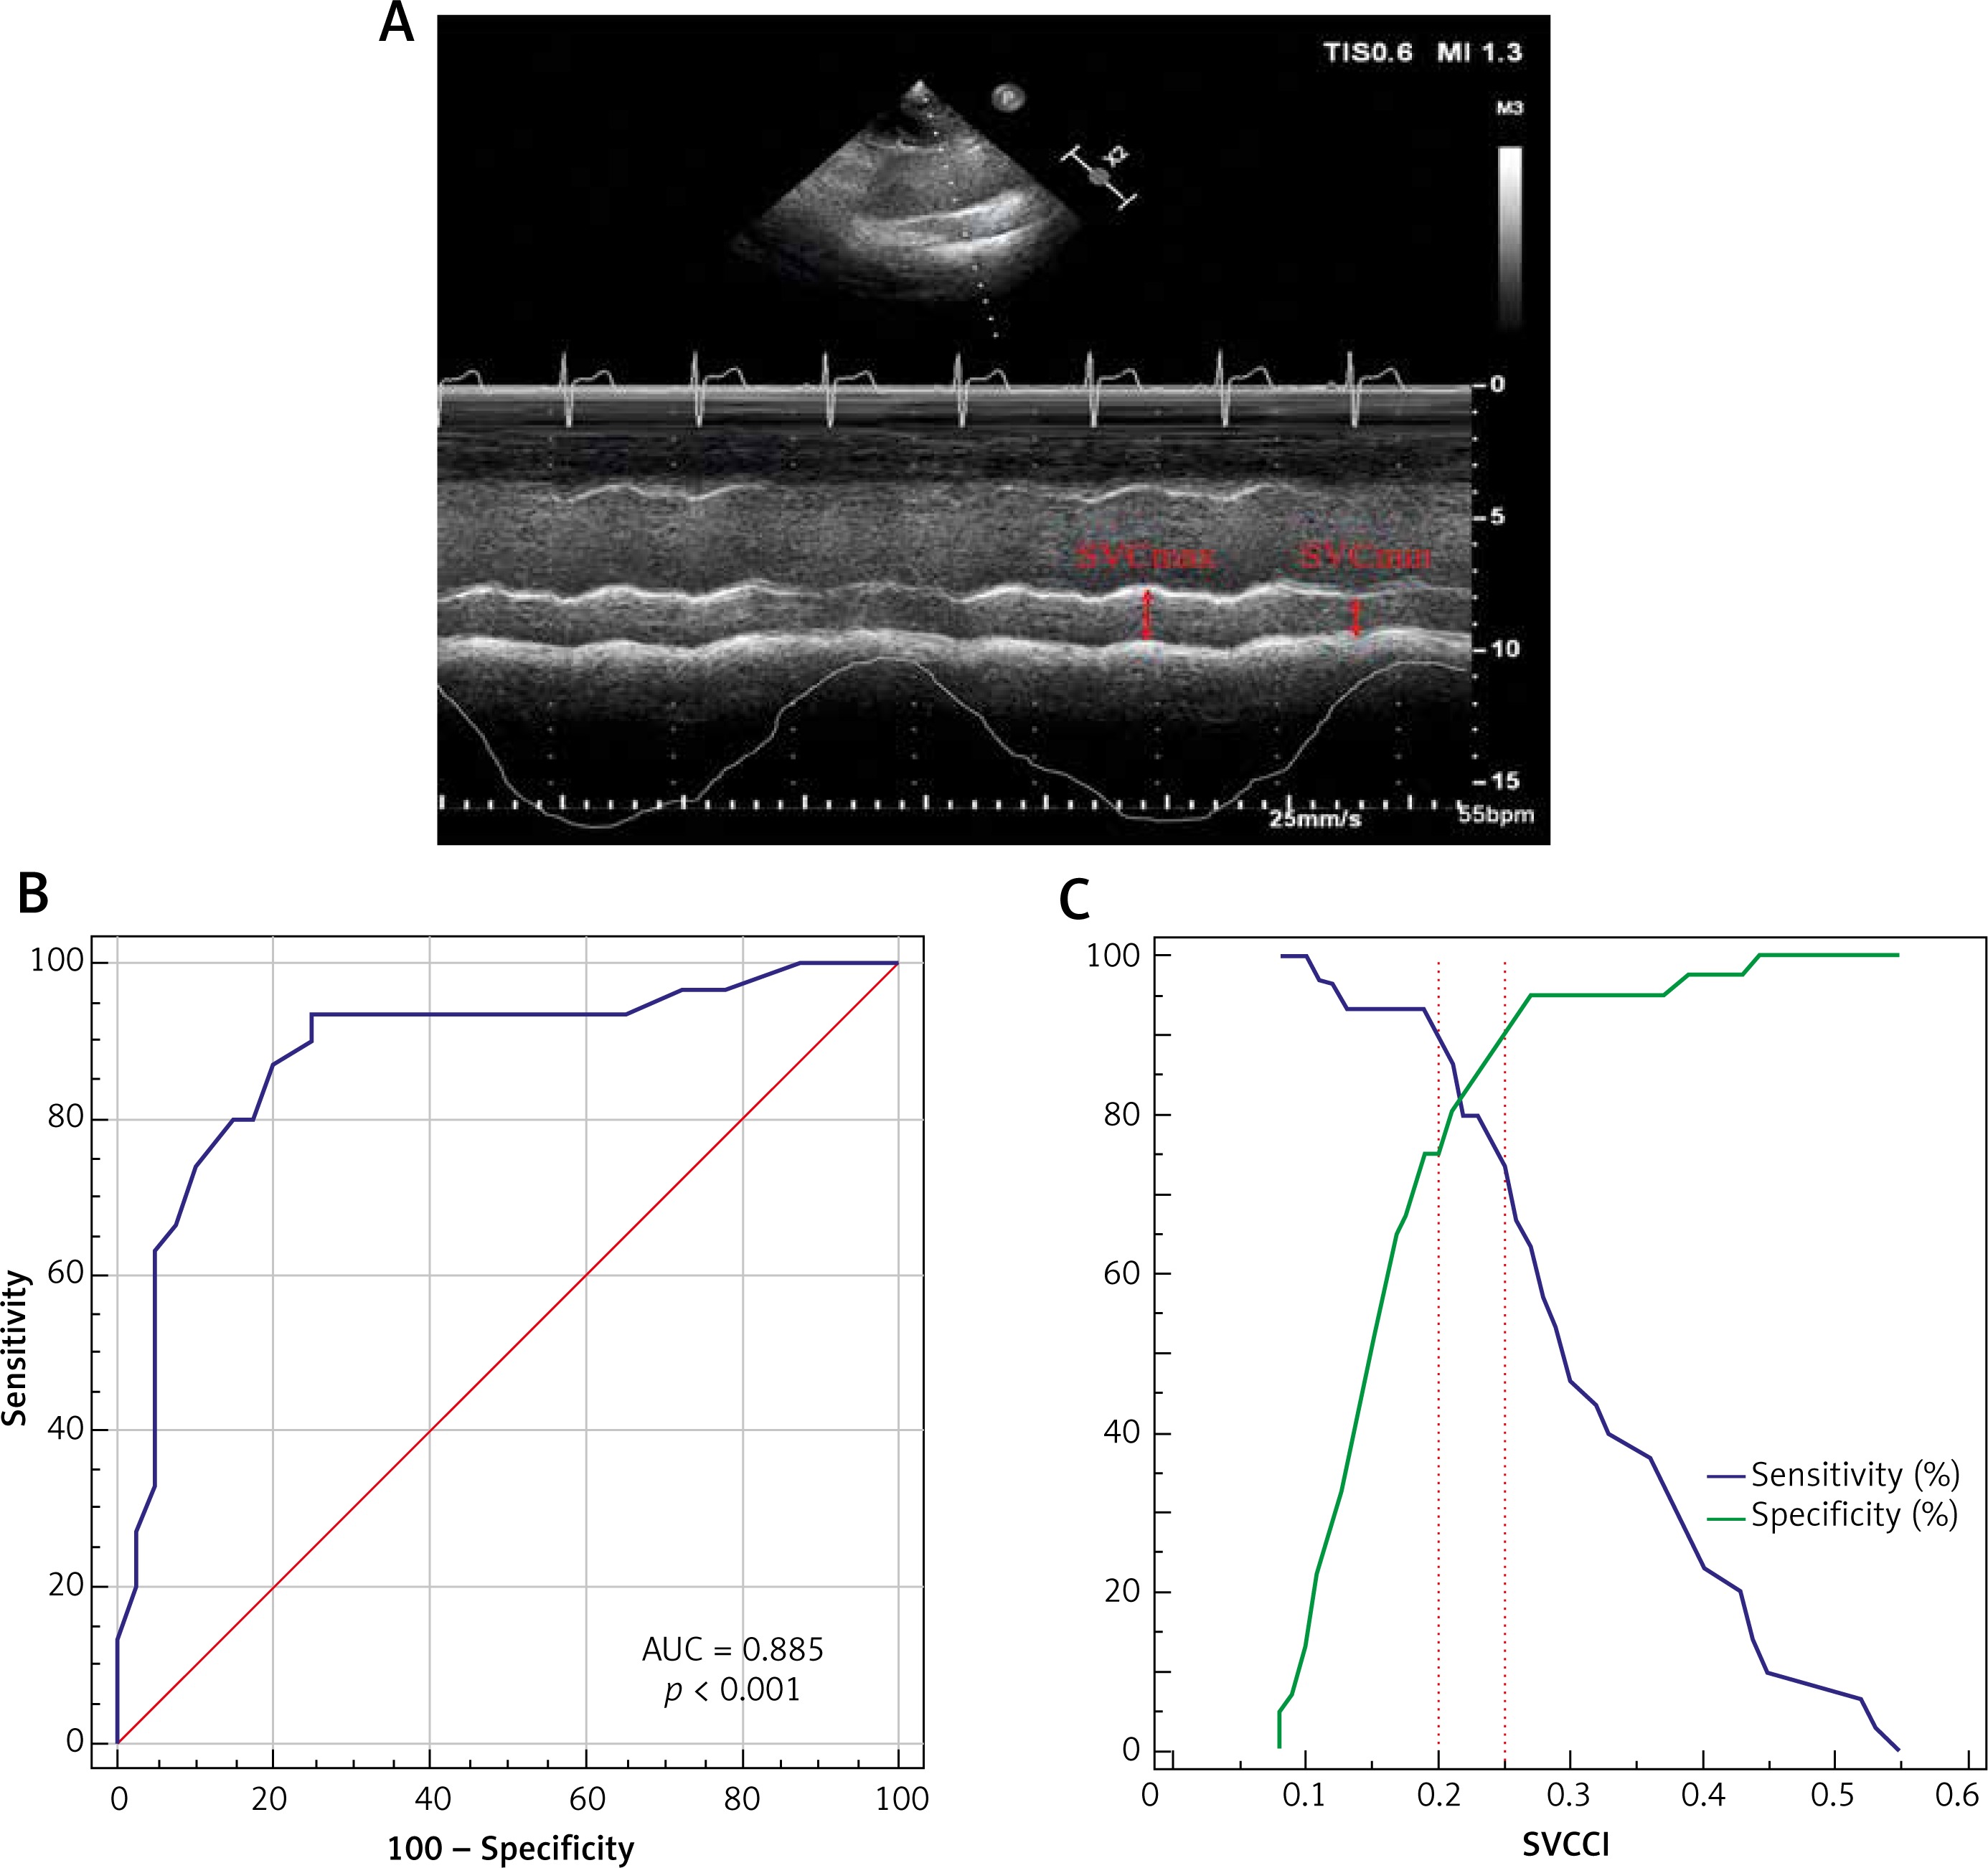
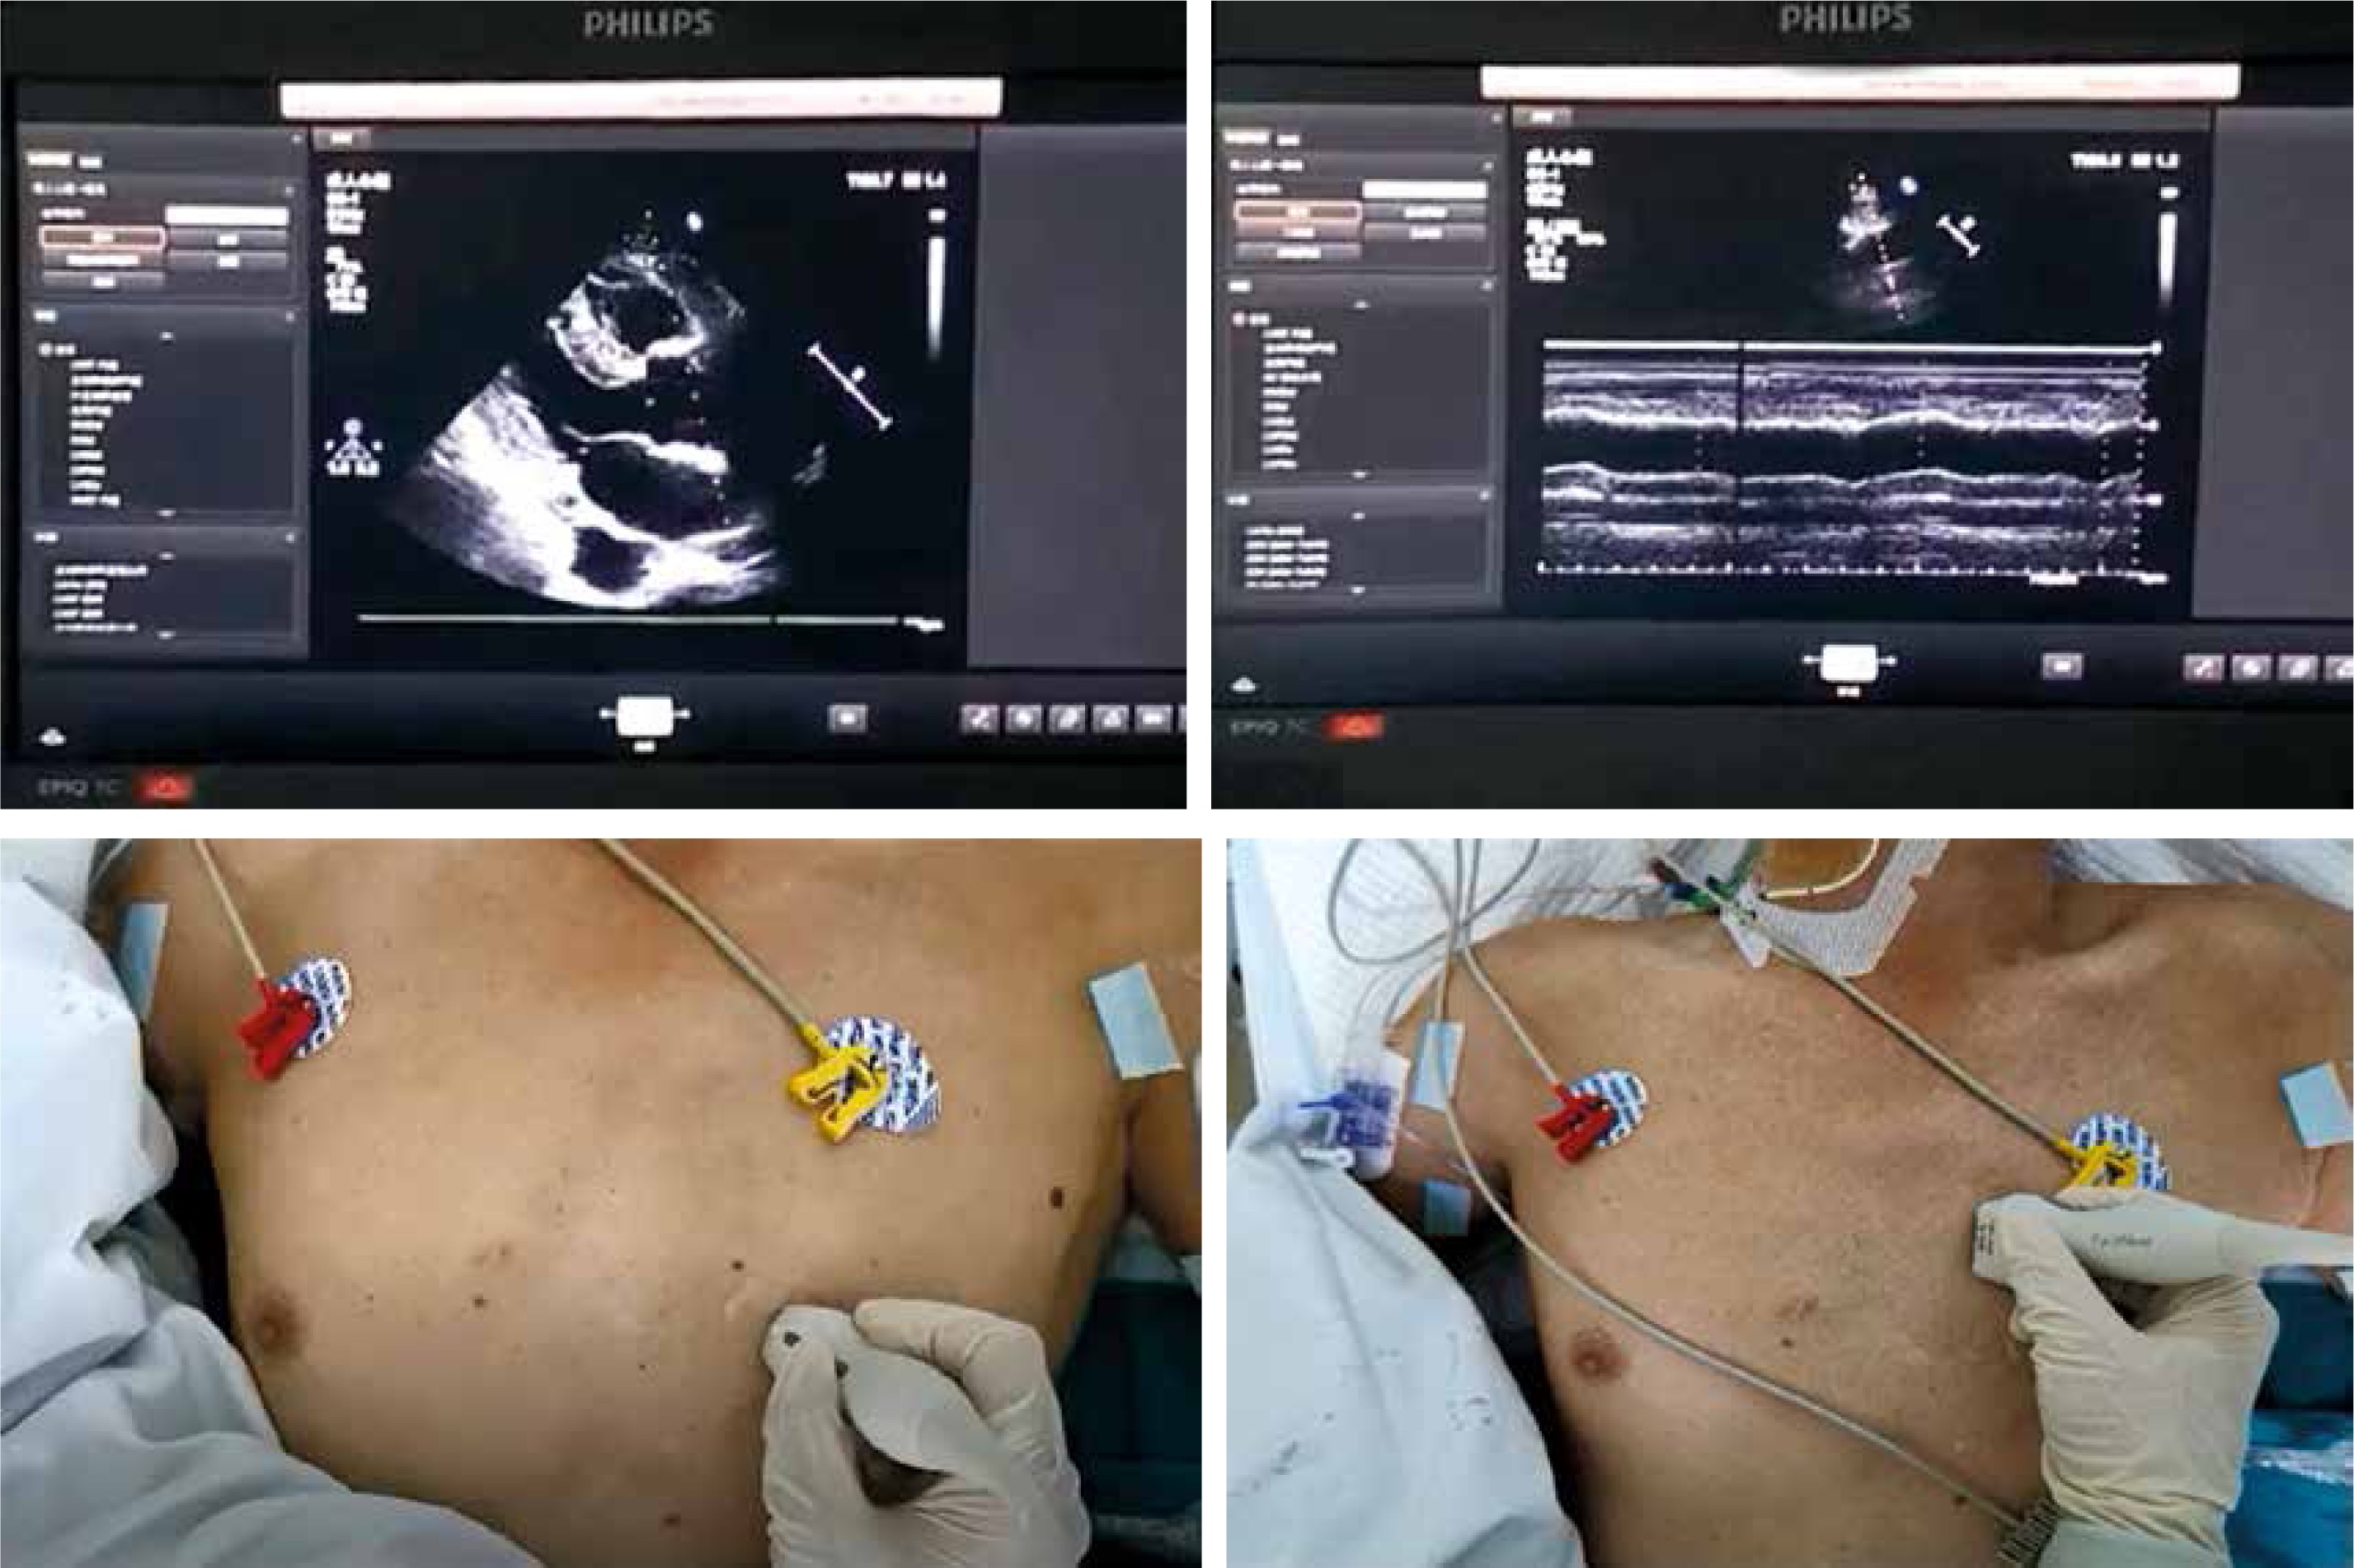
Figure 2
The probe position and measurement of SVC by TTE. The parasternal long-axis view was obtained at the left parasternal between the third and fourth intercostal spaces with the probe marker pointing toward the patient’s right shoulder. The probe position was then adjusted to image the longitudinal axis view of the SVC parallel to the aorta at the left parasternal between the second and fourth intercostal spaces by pointing the probe marker cephalad and tilting the appropriate angle medially from the sagittal to the coronal plane
Seventy-nine patients were assessed for eligibility during the study period. A total of seventy patients were included in the final analysis, whereas 9 patients were excluded because of poor SVC image quality. Good quality of the SVC view was obtained in 91.4% of subjects (allowing complete M-mode trace during the respiratory cycle) and suboptimal in 8.6% of subjects. Thirty (42.9%) patients responded to the fluid challenge test. Baseline demographic characteristics of the patients are comparable and presented in Table I. SVCCI by thoracic ultrasonography was a strong predictor of fluid responsiveness, with an AUC of 0.885 (95% CI: 0.786–0.949; p < 0.0001). The optimal cut-off value for SVCCI was 19%, with a sensitivity of 93.3% and a specificity of 75%. To avoid the dualism of a single cutoff value, a sensitivity/specificity plot shows the probability interval for SVCCI. The gray zone for SVCCI lay between 20% and 25% and comprised only 11 (15.7%) patients (Figure 1).
Table I
Baseline demographic and intraoperative data
To our knowledge, this is the first study to assess and confirm the value of the diameter variation of SVC during the respiratory phase using noninvasive TTE for predicting fluid responsiveness in postoperative mechanically ventilated patients. Its eminent advantages in predicting fluid responsiveness can be outlined as follows: 1) The predictive validity of SVC respiratory variation was high in terms of AUC and there were only 15.7% of patients in the gray zone, which underlined the clinical significance of SVCCI. Vieillard-Baron et al. initially found that SVC phasic collapse during the respiratory cycle reflects insufficient venous filling and can be tackled by volume expansion [10]. Subsequently, they verified that an SVCCI ≥ 36% obtained by TEE was evidenced as a robust index of fluid responsiveness in mechanically ventilated patients with 90% sensitivity and 100% specificity [11]. In a large cohort, Vignon et al. reported that the AUC for SVCCI (0.75) was significantly greater than the distensibility index of IVC (0.63) in patients with mechanical ventilation [12]. The cut-off value for SVCCI was 21% (61% sensitivity, 84% specificity), which is consistent with ours. The reason for the better predictive value of SVCCI is still far from being elucidated. A plausible explanation is the greater extent of intrathoracic pressure change than the intra-abdominal pressure caused by mechanical ventilation, which contributes to more evident fluctuation in venous return of SVC. 2) Compared with IVC, SVC is located entirely in the thoracic cavity, so it could hardly be affected by intra-abdominal pressure [3, 13]. Several lines of evidence have suggested that the intraabdominal pressure has a remarkable effect on the IVC variation, which is independent of fluid responsiveness [1, 14]. 3) The application of abdominal bands, gauze, and adhesive tape on the midline incisional site after open surgery restricts the acquisition of IVC in the subxiphoid area. SVC variables provide an alternative to assess the volume status in those surgical patients.
Our pilot study has several limitations. First, the study was performed in this specific clinical setting and patients undergoing abdominal surgery. The findings should not be extrapolated to other populations. Second, it was found that transthoracic ultrasound was feasible to obtain the long axis of SVC, but further large-sample clinical studies are still warranted for reproducibility of measurements and variability assessment. Third, we did not achieve CO with pulmonary artery catheterization (PAC), which is the gold standard to validate the predictive value of SVCCI. However, previous studies have compared CO-TTE and CO-PAC measurements and found that the two measurements were closely correlated in mechanically ventilated patients (r = 0.95; p < 0.0001) [15].
In conclusion, the SVC-derived variable using the TTE technique provides a feasible predictor of fluid responsiveness for a wider spectrum of postoperative patients. Further study concerning the comparison with the conventional IVC-derived variable in predicting fluid responsiveness of patients after surgery is warranted.