Introduction
Alopecia areata (AA) is a prevalent autoimmune skin condition characterized by distinct circular areas of hair loss. Current treatments for AA predominantly revolve around broad immune suppression or topical immunotherapy [1, 2]. Nevertheless, the efficacy of these treatments remains debatable. A thorough comprehension of the disease’s underlying mechanisms is imperative for the advancement of innovative therapeutic approaches.
To date, the precise pathophysiology of AA has not been thoroughly investigated. Previous research has consistently suggested that the disease’s etiology is associated with an autoimmune response targeting hair follicles. Histopathological examination reveals a peribulbar lymphocytic infiltrate surrounding anagen follicles, predominantly composed of CD4+ and CD8+ T-cells during acute and subacute stages [3].
Additionally, other immune cells such as macrophages, natural killer cells, and mast cells are also present [4]. AA typically manifests in three primary phenotypic variants: alopecia totalis (AT), alopecia universalis (AU), and patchy-type AA (AAP). Recent studies have highlighted the involvement of novel molecular pathways and immune-related molecules in AA development. A meta-analysis conducted by Betz et al. underscored the significant association between human leukocyte antigen-DR and T cells as the primary risk factor for AA [5]. Petukhova and colleagues identified genes related to natural killer cell receptor D ligands as potential influencers of AA susceptibility [6]. However, the distinct pathogenic mechanisms underlying these three disease variants remain elusive.
Hence, our study was devised to investigate the genetic and immunological underpinnings of AA. We screened for differentially expressed genes and investigated disease progression along with immune-related modules across AAP, AU, and AT. Furthermore, we analyzed the infiltration levels of immune cells in these groups. Our findings reveal a significant association between AA development and the infiltration of specific immune cell subtypes. Additionally, we substantiated the pivotal role of CXCL9 and CXCL10 in AA progression.
Material and methods
Data sources
In this study, the GSE68801 [7] dataset was downloaded from the NCBI GEO (https://www.ncbi.nlm.nih.gov/) [8] database, which provides a comprehensive expression profile of scalp skin biopsies from individuals with various subtypes of AA and normal controls. This dataset was selected due to its extensive sample size and representation of different AA subtypes, enabling a robust comparative analysis. The detection platform for this expression profile data was GPL570 [HG-U133_Plus_2] Affymetrix Human Genome U133 Plus 2.0 Array. The dataset comprised 122 scalp skin biopsies obtained from individuals with AA and normal healthy controls (NC). Specifically, there were 36 samples from healthy controls, and 86 samples from individuals with AA (comprising 28 lesional samples and 26 nonlesional samples from AAP, 23 lesional samples from AU, and 9 lesional samples from AT). For consistency in our analysis, we excluded gene expression profiling data from 26 nonlesional samples from AAP.
Exploration of differentially expressed RNAs (DERs)
We retrieved comprehensive annotation information related to the platform from GPL570 [HG-U133_Plus_2] Affymetrix Human Genome U133 Plus 2.0 Array via the Ensembl genome browser 96 database (http://asia.ensembl.org/index.html). This information encompassed probes, gene symbols, RNA types, as well as other relevant details. Subsequently, we re-annotated the probes in the downloaded expression profile dataset to acquire the respective expression levels of both lncRNAs and mRNAs.
Selection criteria and relevance
We selected lncRNAs and mRNAs for our analysis because they play crucial roles in the regulation of gene expression and are involved in various biological processes, including immune responses and inflammation. LncRNAs were chosen due to their ability to modulate immune responses through mechanisms such as acting as molecular scaffolds, decoys, or guides for chromatin-modifying complexes, thereby influencing the transcription of immune-related genes. mRNAs were selected because they encode proteins that are directly involved in immune signaling pathways and cellular responses. Analyzing both lncRNAs and mRNAs allowed us to capture a comprehensive picture of the transcriptional changes associated with AA and identify potential biomarkers and therapeutic targets.
The samples were categorized into three comparison groups: AAP vs. NC, AU vs. NC, and AT vs. NC. Differential expression analyses were conducted using the limma package Version 3.34 in R3.6.1 [9]. We set the threshold at FDR < 0.05 and |log2FC| > 0.263 to identify significantly differentially expressed regions (DERs) between the groups. Subsequently, bi-directional hierarchical clustering [10, 11] was performed using the pheatmap package (Version 1.0.8) [12] in R3.6.1. This clustering utilized the expression values of DERs obtained from each group and was based on Euclidean distance. Finally, the clustering results were visualized using a heatmap.
We retained the overlapping differentially expressed regions (DERs) identified across the three comparison groups for further analysis. Gene Ontology (GO) biological process and Kyoto Encyclopedia of Genes and Genomes (KEGG) signaling pathway enrichment analyses were conducted using DAVID (version 6.8) [13]. A significance threshold of p < 0.05 was applied to select the enriched terms.
Evaluation of immune cell subsets using the single sample Gene Set Enrichment Analysis (ssGSEA) algorithm
The microenvironment component primarily encompasses fibroblasts, the extracellular matrix, immune cells, diverse growth and inflammatory factors, and distinctive physical characteristics. These elements exert a profound influence on disease diagnosis, survival outcomes, and clinical treatment sensitivity. Intricate and significant interactions exist among different cell types, leading to robust patterns of cell infiltration.
To assess the subtype of immune infiltration in the combined sample, immunologic signature gene sets were obtained from the GSEA database [14]. Subsequently, the type of immune infiltration in the combined sample was evaluated using the gene set variation analysis for microarray and RNA-Seq data package (GSVA, Version 1.36.3) [15]. GSVA, a non-parametric unsupervised analysis, was employed to determine whether various immune infiltrations were enriched in different samples based on the type of immune cell infiltration. Following this, the differences in the proportion of individual immune cells between AA samples and normal controls were analyzed.
Screening of disease progression and immune-related modules using weighted gene co-expression network analysis (WGCNA)
WGCNA is a bioinformatics algorithm utilized for constructing co-expression networks, facilitating the exploration of disease-related modules and the identification of potential therapeutic targets or pathogenic mechanisms [16]. We employed the WGCNA package (Version 1.61) [17] in the R3.6.1 language to identify modules significantly linked to both the sample stage and immune cells based on the expression levels of all RNAs detected in GSE68801. In this analysis, we set a threshold for the module size to contain at least 100 differentially expressed regions (DERs) (cutHeight = 0.995). Subsequently, we assessed the correlation between the identified modules, the stage of AA, and subsets of immune cells.
The shared differentially expressed regions (DERs) identified across the three comparison groups were assigned to each WGCNA module. Fold enrichment and p-values of the DERs within each module were computed using the hypergeometric algorithm [18], expressed as f(k,N,M,n) = C(k,M)*C(n-k,N-M)/C(n,N) (where N represents all RNAs involved in WGCNA analysis, M represents the number of RNA factors in each module, n represents the number of significantly different RNAs screened in step 2, and k represents the count of DERs mapped to the respective module).
The criterion for selecting modules was established as p < 0.05 and fold enrichment > 1. DERs exhibiting significant enrichment within the target module were selected for further analysis.
Construction of co-expression network
The Pearson correlation coefficient (PCC) was computed for significantly enriched genes and lncRNAs within the target module utilizing the cor function in the R3.6.1 language. The resulting co-expression network was visualized utilizing Cytoscape 3.6.1 [19]. Connection pairs with a significance p-value below 0.05 as well as a significant absolute PCC value exceeding 0.7 were retained. Subsequently, KEGG pathway analysis was conducted using the DAVID tool [20].
Screen of key genes
To investigate KEGG pathways and disease-related genes associated with AA, we utilized the Comparative Toxicogenomics Database 2019 update [21]. We employed “Alopecia Areata” as the keyword for our analysis. Additionally, we selected overlapping pathways and genes identified in the previously constructed co-expression network and the current results to construct pathways linked to AA. Furthermore, we screened for overlapping lncRNAs and DERs.
Results
DER selection
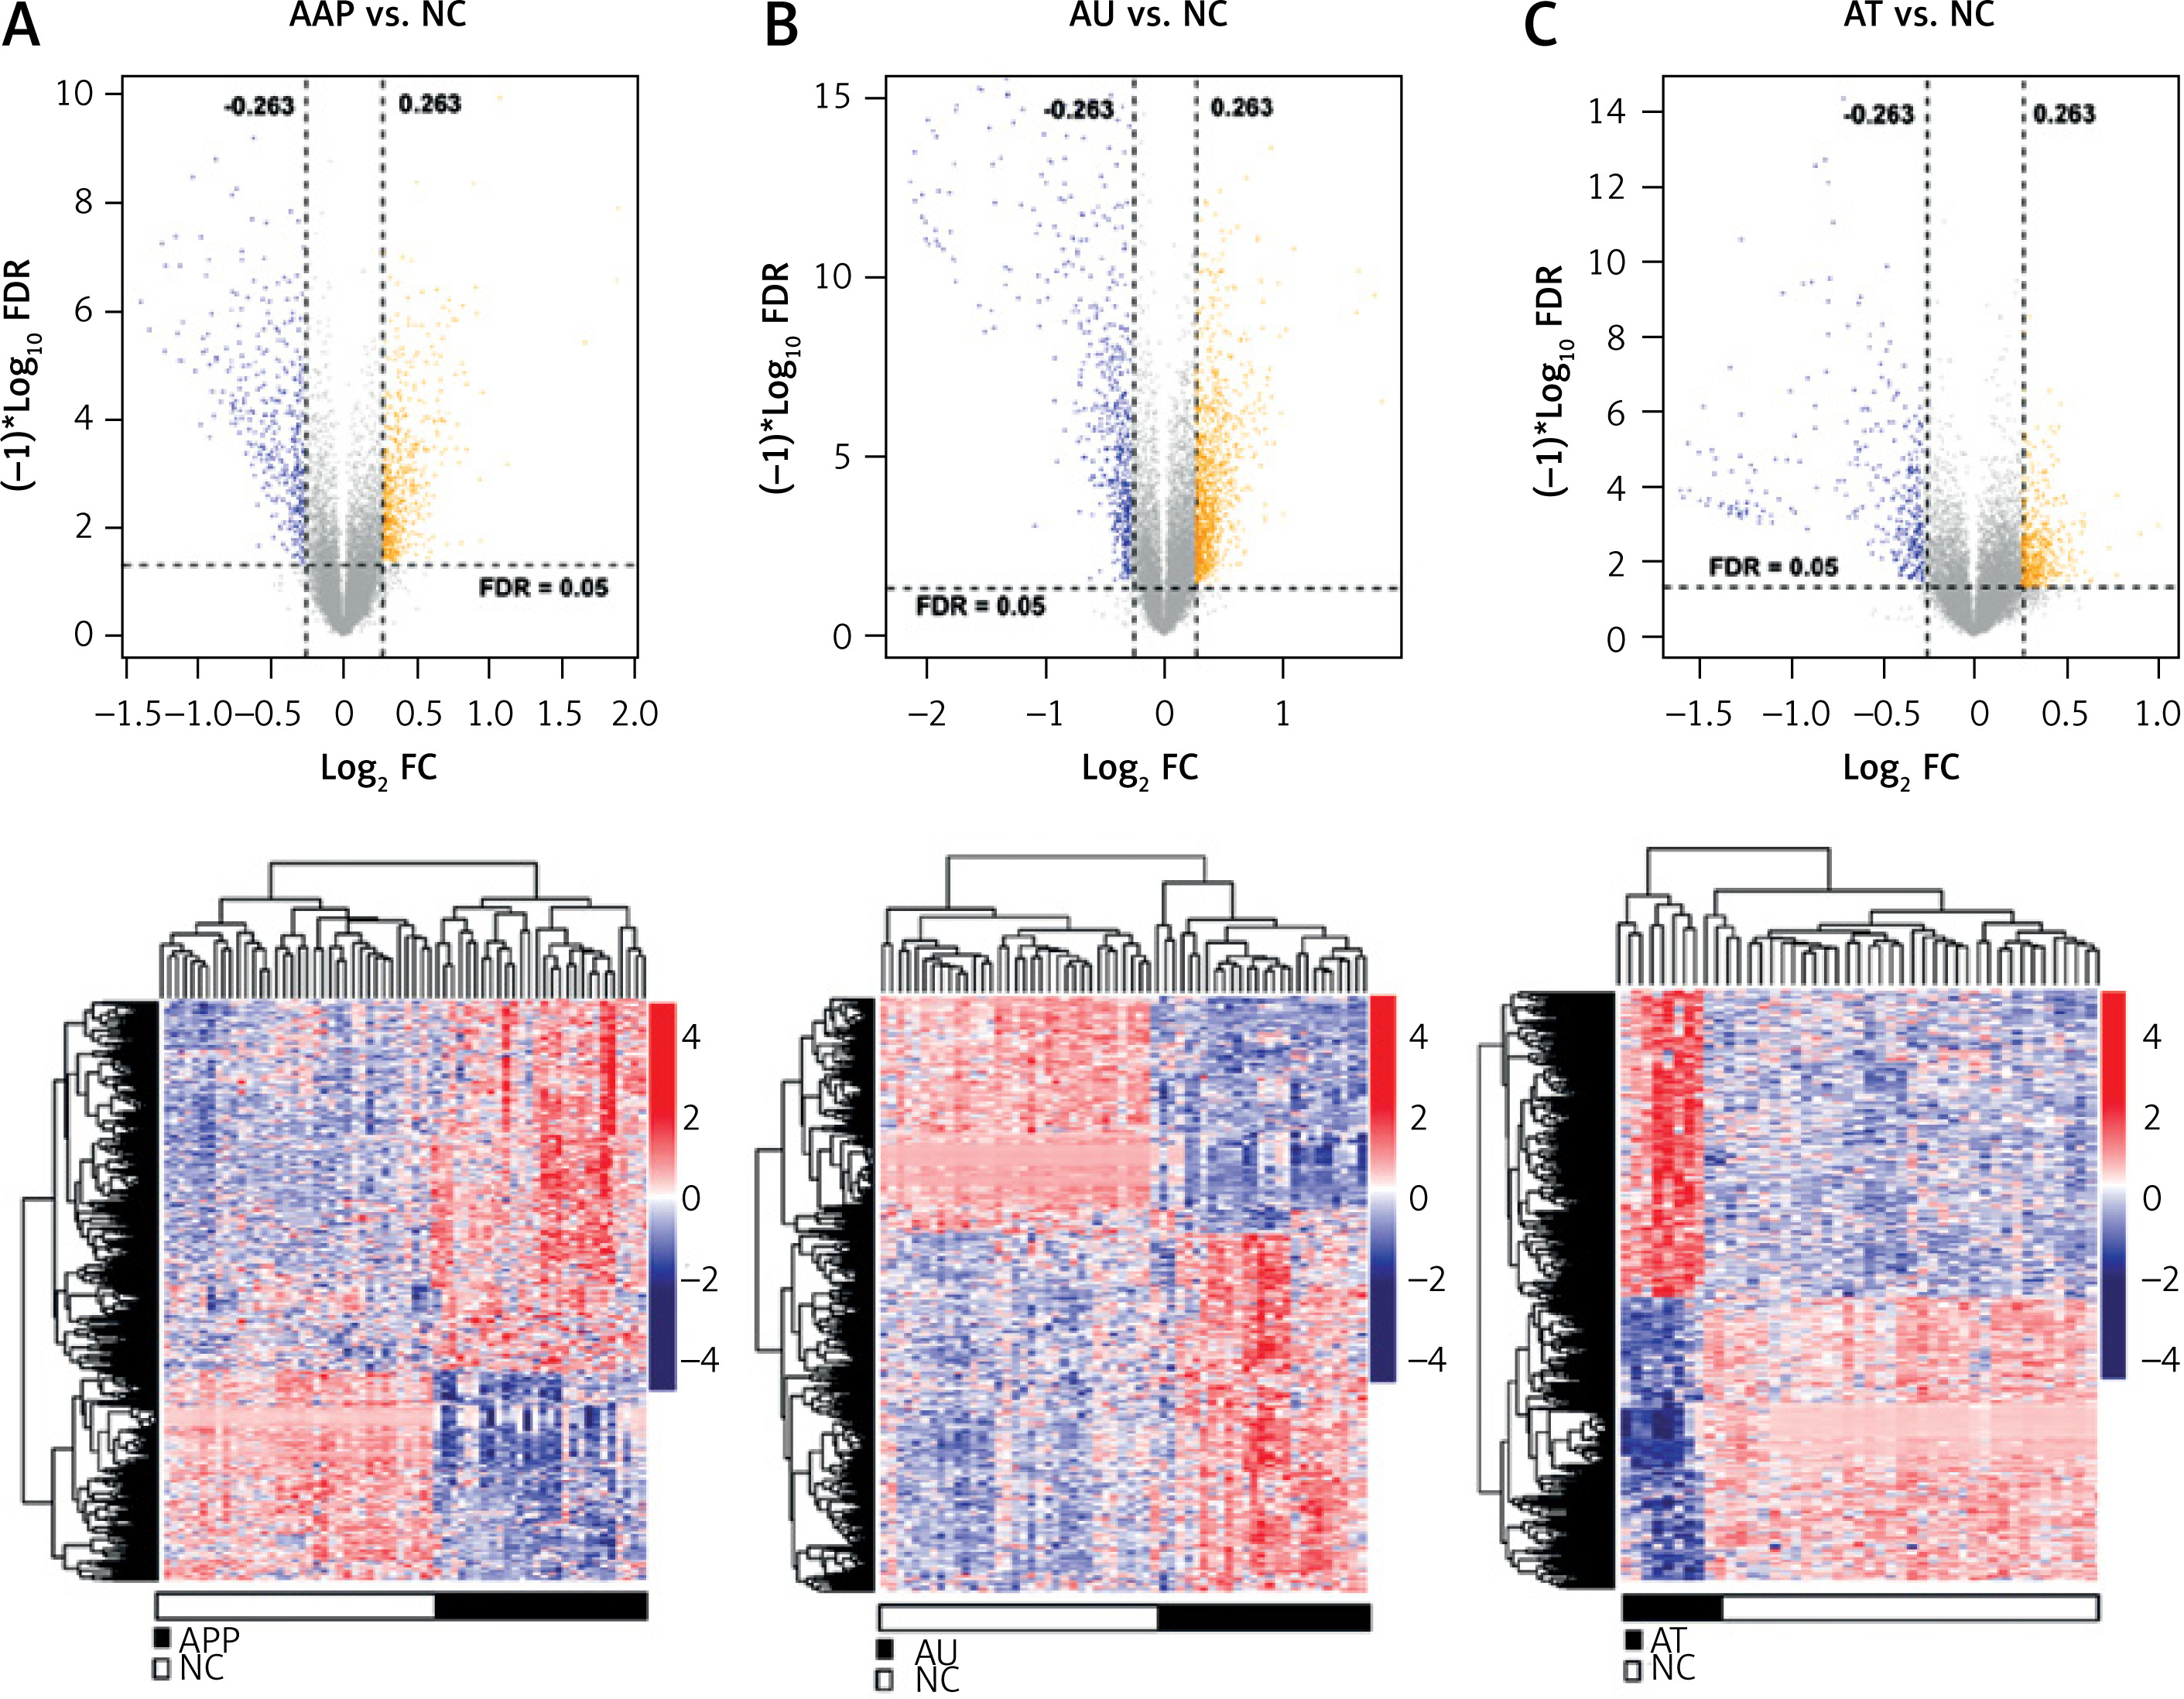
A total of 1708 lncRNAs and 17,326 mRNAs were collected. Based on the sample’s source stage, we divided them into three comparison groups: AAP vs. NC, AU vs. NC, and AT vs. NC. Subsequently, we identified 1076, 781, and 867 DERs in AAP vs. NC, AU vs. NC, and AT vs. NC, respectively. The volcano plot and hierarchical clustering heatmap are depicted in Figure 1. The clustering heatmap reveals that the expression values of the DERs identified in each comparison group could be distinguished according to different sample types. The distinct colors indicate that the DERs possess unique expression characteristics in each group.
Figure 1
Volcano map and heat map of differentially expressed RNAs (DERs) of patchy-type AA (AAP) vs. normal controls (NC) (A), alopecia universalis (AU) vs. NC (B), and alopecia totalis (AT) vs. NC (C). Above map: volcano map. Blue and orange dots indicate significantly down-regulated and up-regulated DERs, respectively. The horizontal dashed line indicates FDR < 0.05, and the vertical dashed line indicates |log2FC| > 0.263. Bottom map: two-way hierarchical clustering heat map based on the expression level of DERs
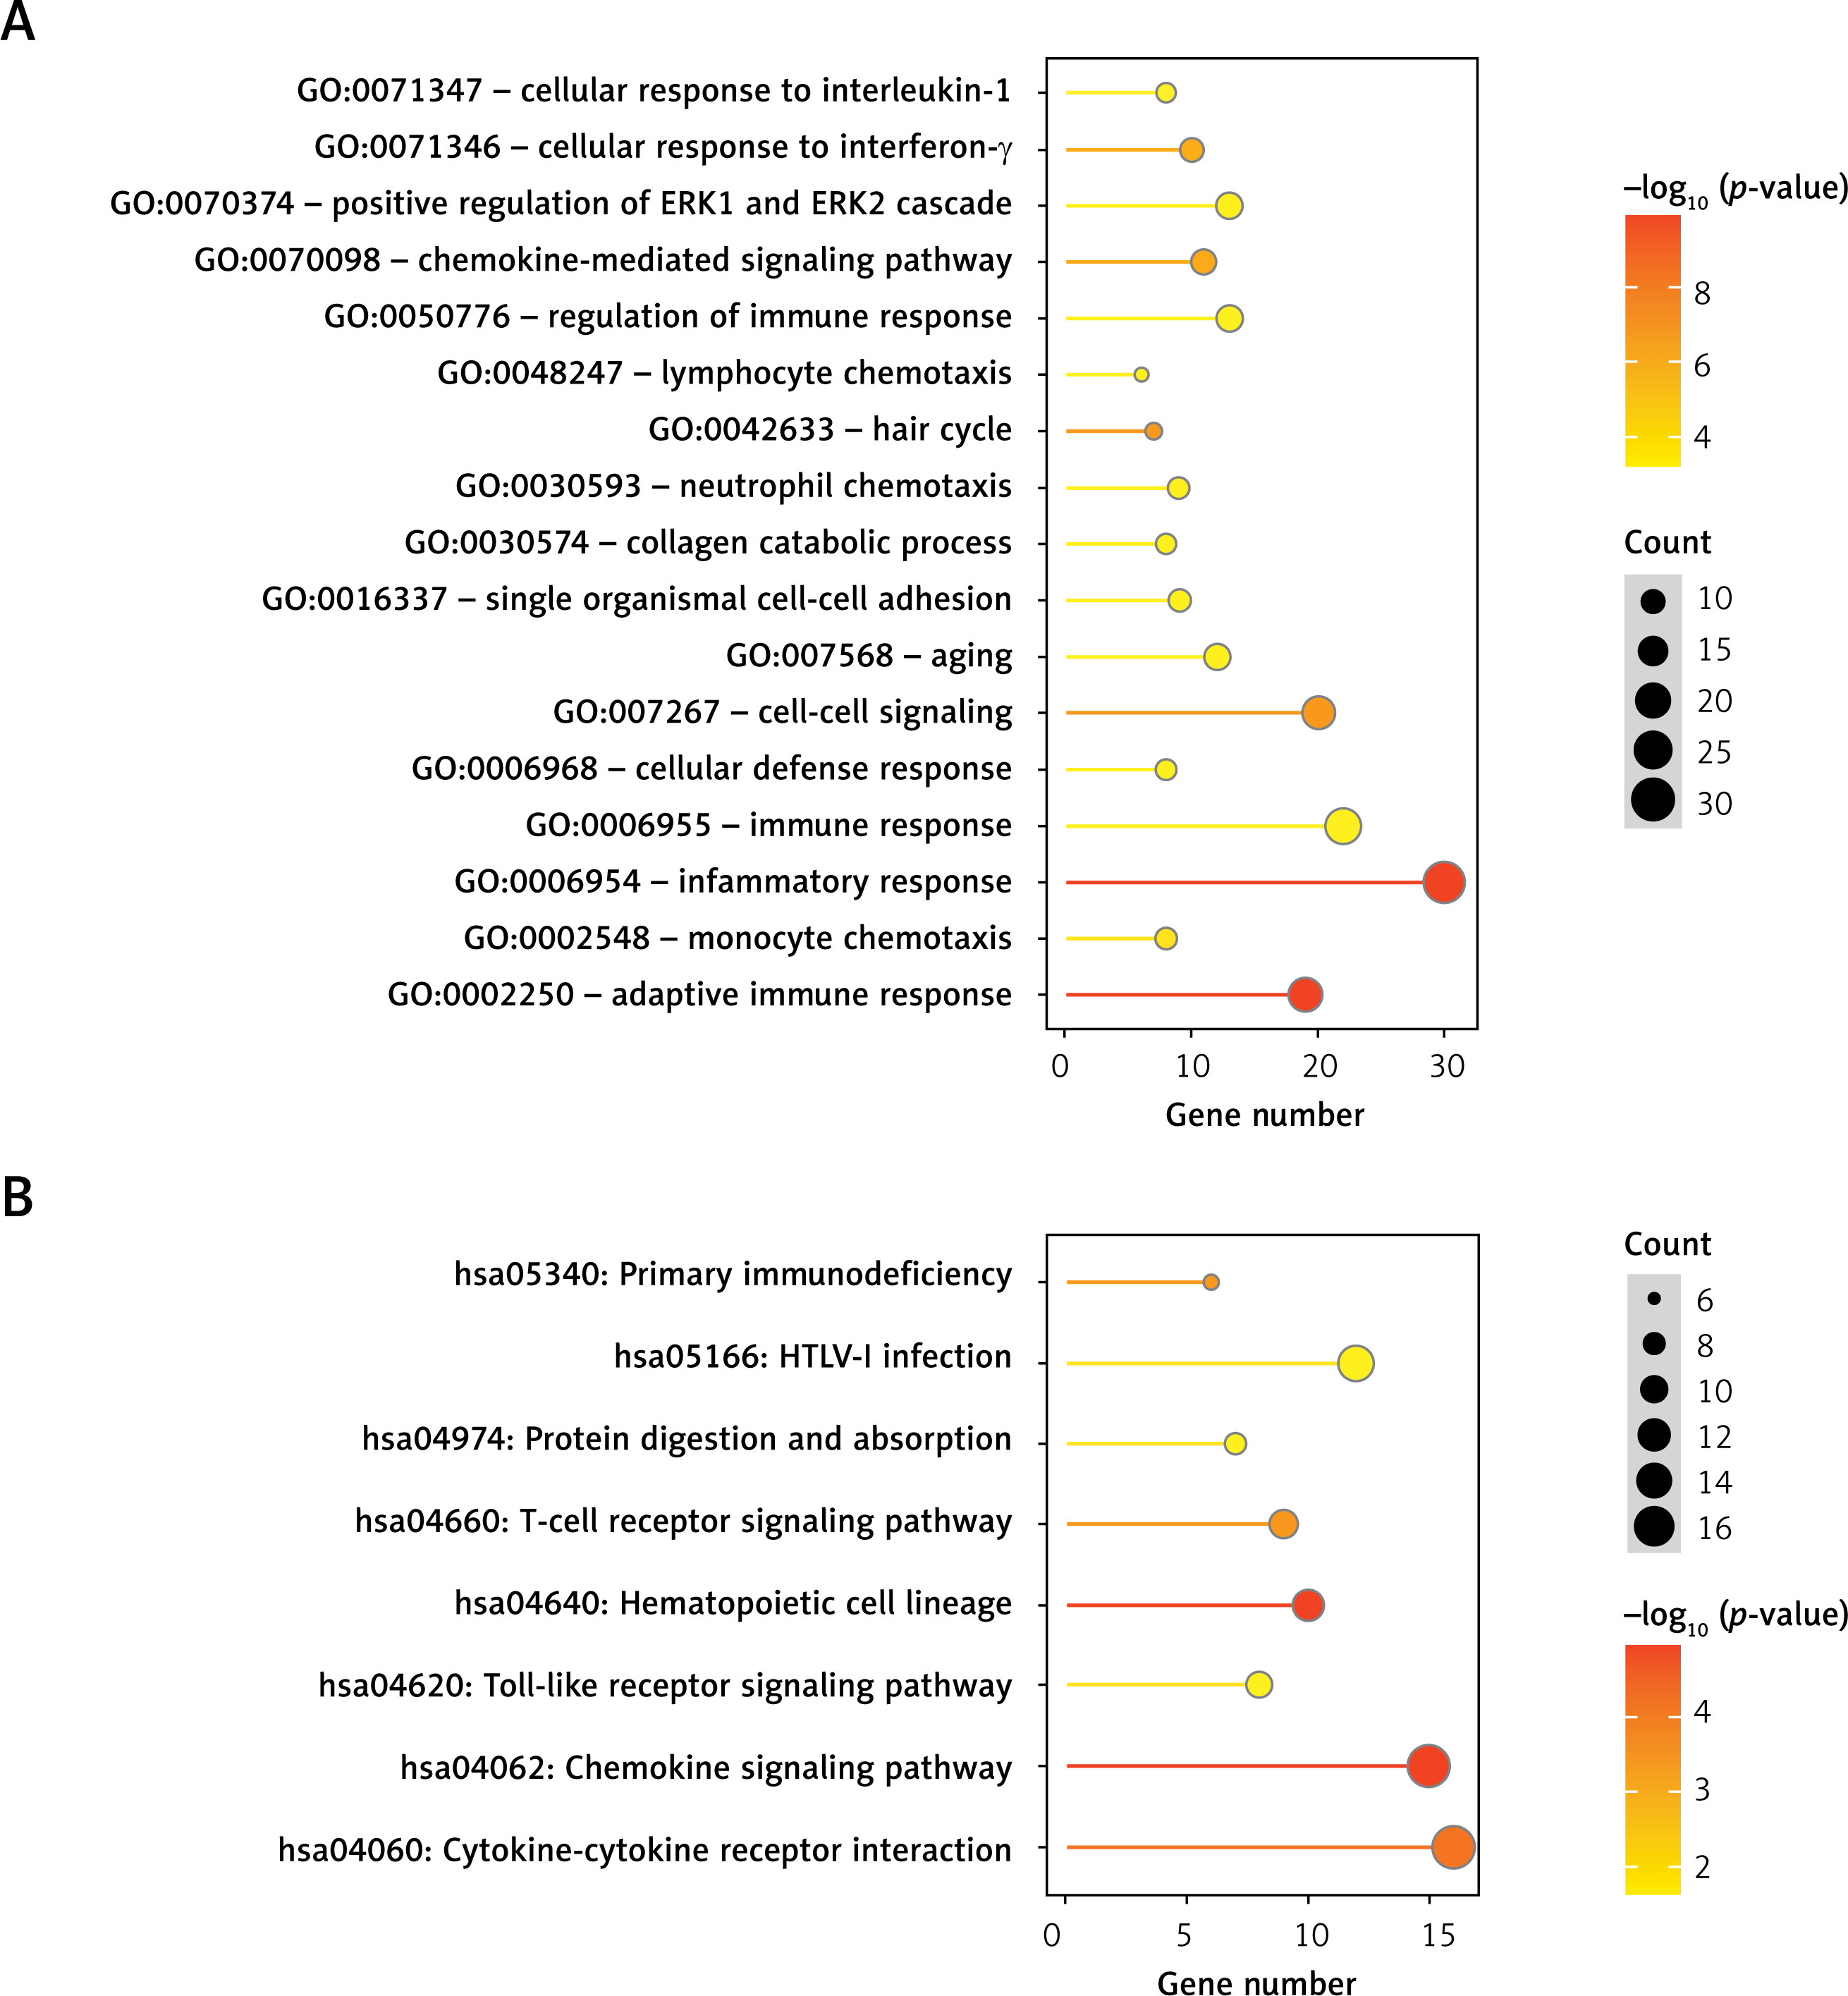
The overlapping differentially expressed regions (DERs) identified in the three comparison groups were analyzed, resulting in a total of 427 overlapping genes, comprising 29 lncRNAs and 398 mRNAs. Functional enrichment analysis revealed that these DERs were significantly enriched in 17 related biological processes, including inflammatory response, adaptive immune response, and cell-cell signaling, as well as 8 KEGG signaling pathways, such as the chemokine signaling pathway, hematopoietic cell lineage, and cytokine-cytokine receptor interaction (Figure 2 and Table I).
Table I
Biological process and Kyoto Encyclopedia of Genes and Genomes (KEGG) pathways significantly enriched by overlapping differentially expressed RNAs (DERs)
Figure 2
Dot plot of biological process (A) and Kyoto Encyclopedia of Genes and Genomes (KEGG) pathways (B) significantly enriched by overlapping differentially expressed RNAs. The horizontal axis represents the number of genes, the vertical axis represents the item name, the color represents significance, and the color closer to red represents the greater significance
Immune cell subsets in AA
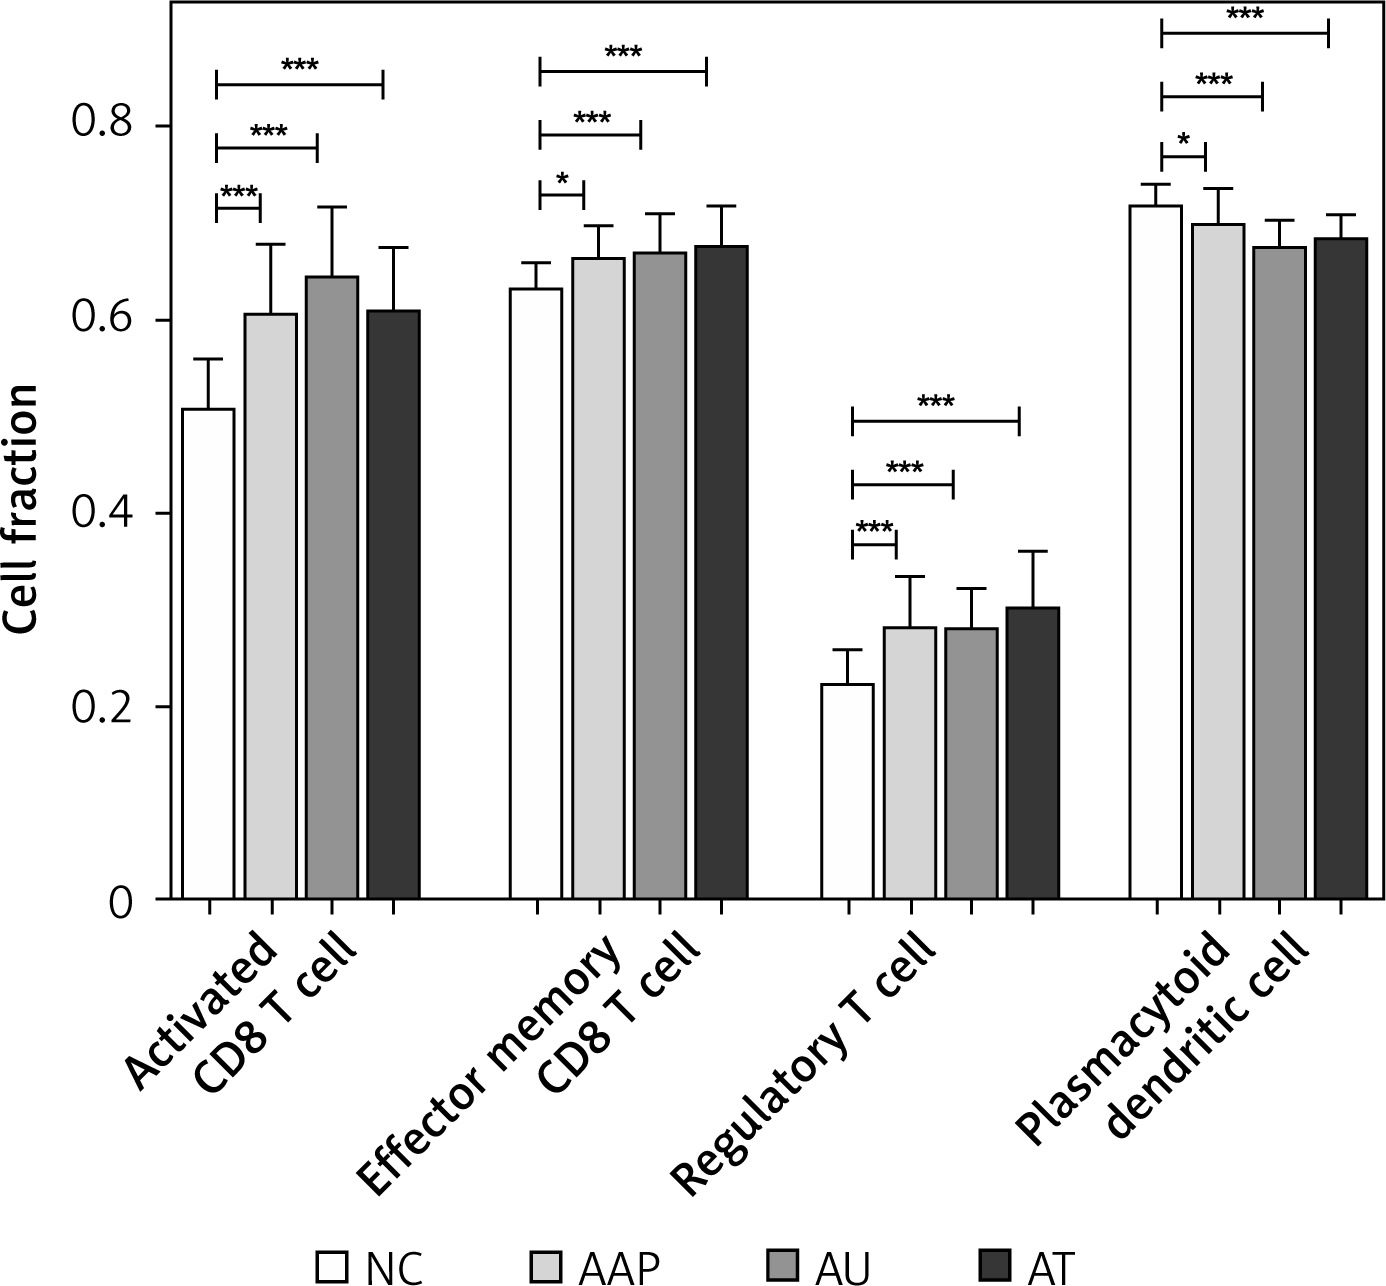
Utilizing ssGSEA, we identified 28 immune cell types associated with the three forms of AA. Subsequently, we compared the proportions of these immune cells across the three comparison groups. Significant differences in four immune cell types were observed compared to NC, including activated CD8 T cells, effector memory CD8 T cells, regulatory T cells, as well as plasmacytoid dendritic cells (Figure 3). Notably, three out of the four immune cells were T cells, indicating that AA is a lymphocyte-mediated autoimmune disorder.
Disease progression and immune-related modules
We evaluated the weight parameter power of the adjacency matrix to ensure compliance with the requirements of a scale-free network distribution. As depicted in Figure 4 A, the power reached 12 when the square value of the correlation coefficient initially reached 0.9. At this juncture, the average node connectivity of the co-expression network was 1, aligning perfectly with the characteristics of a small-world network. Subsequently, we computed the dissimilarity coefficient between nodes and generated the hierarchical clustering tree. We then established a minimum of 100 genes for each module, with a pruning height (cutHeight) set to 0.995. As illustrated in Figure 4 B, a total of 9 modules were identified. Following this, we calculated the correlation between the disease status of the samples, immune grouping, and the division of each module.
Figure 4
Identification and assessment of immune-related modules using WGCNA. A – Adjacency matrix weight parameter power selection graph and schematic diagram of the average connection degree of genes under different power parameters. In the left graph, the horizontal axis represents the weight parameter power, and the vertical axis represents the square of the correlation coefficient between log(k) and log(p(k)) in the corresponding network. The red line represents the standard line where the square value of the correlation coefficient reaches 0.9. In the right graph, the red line represents the value of the average connectivity of the network nodes under the value of the power parameter of the adjacency matrix in the left figure. B – Module division tree diagram. Each color represents a different module. C – Module-trait correlation heat map
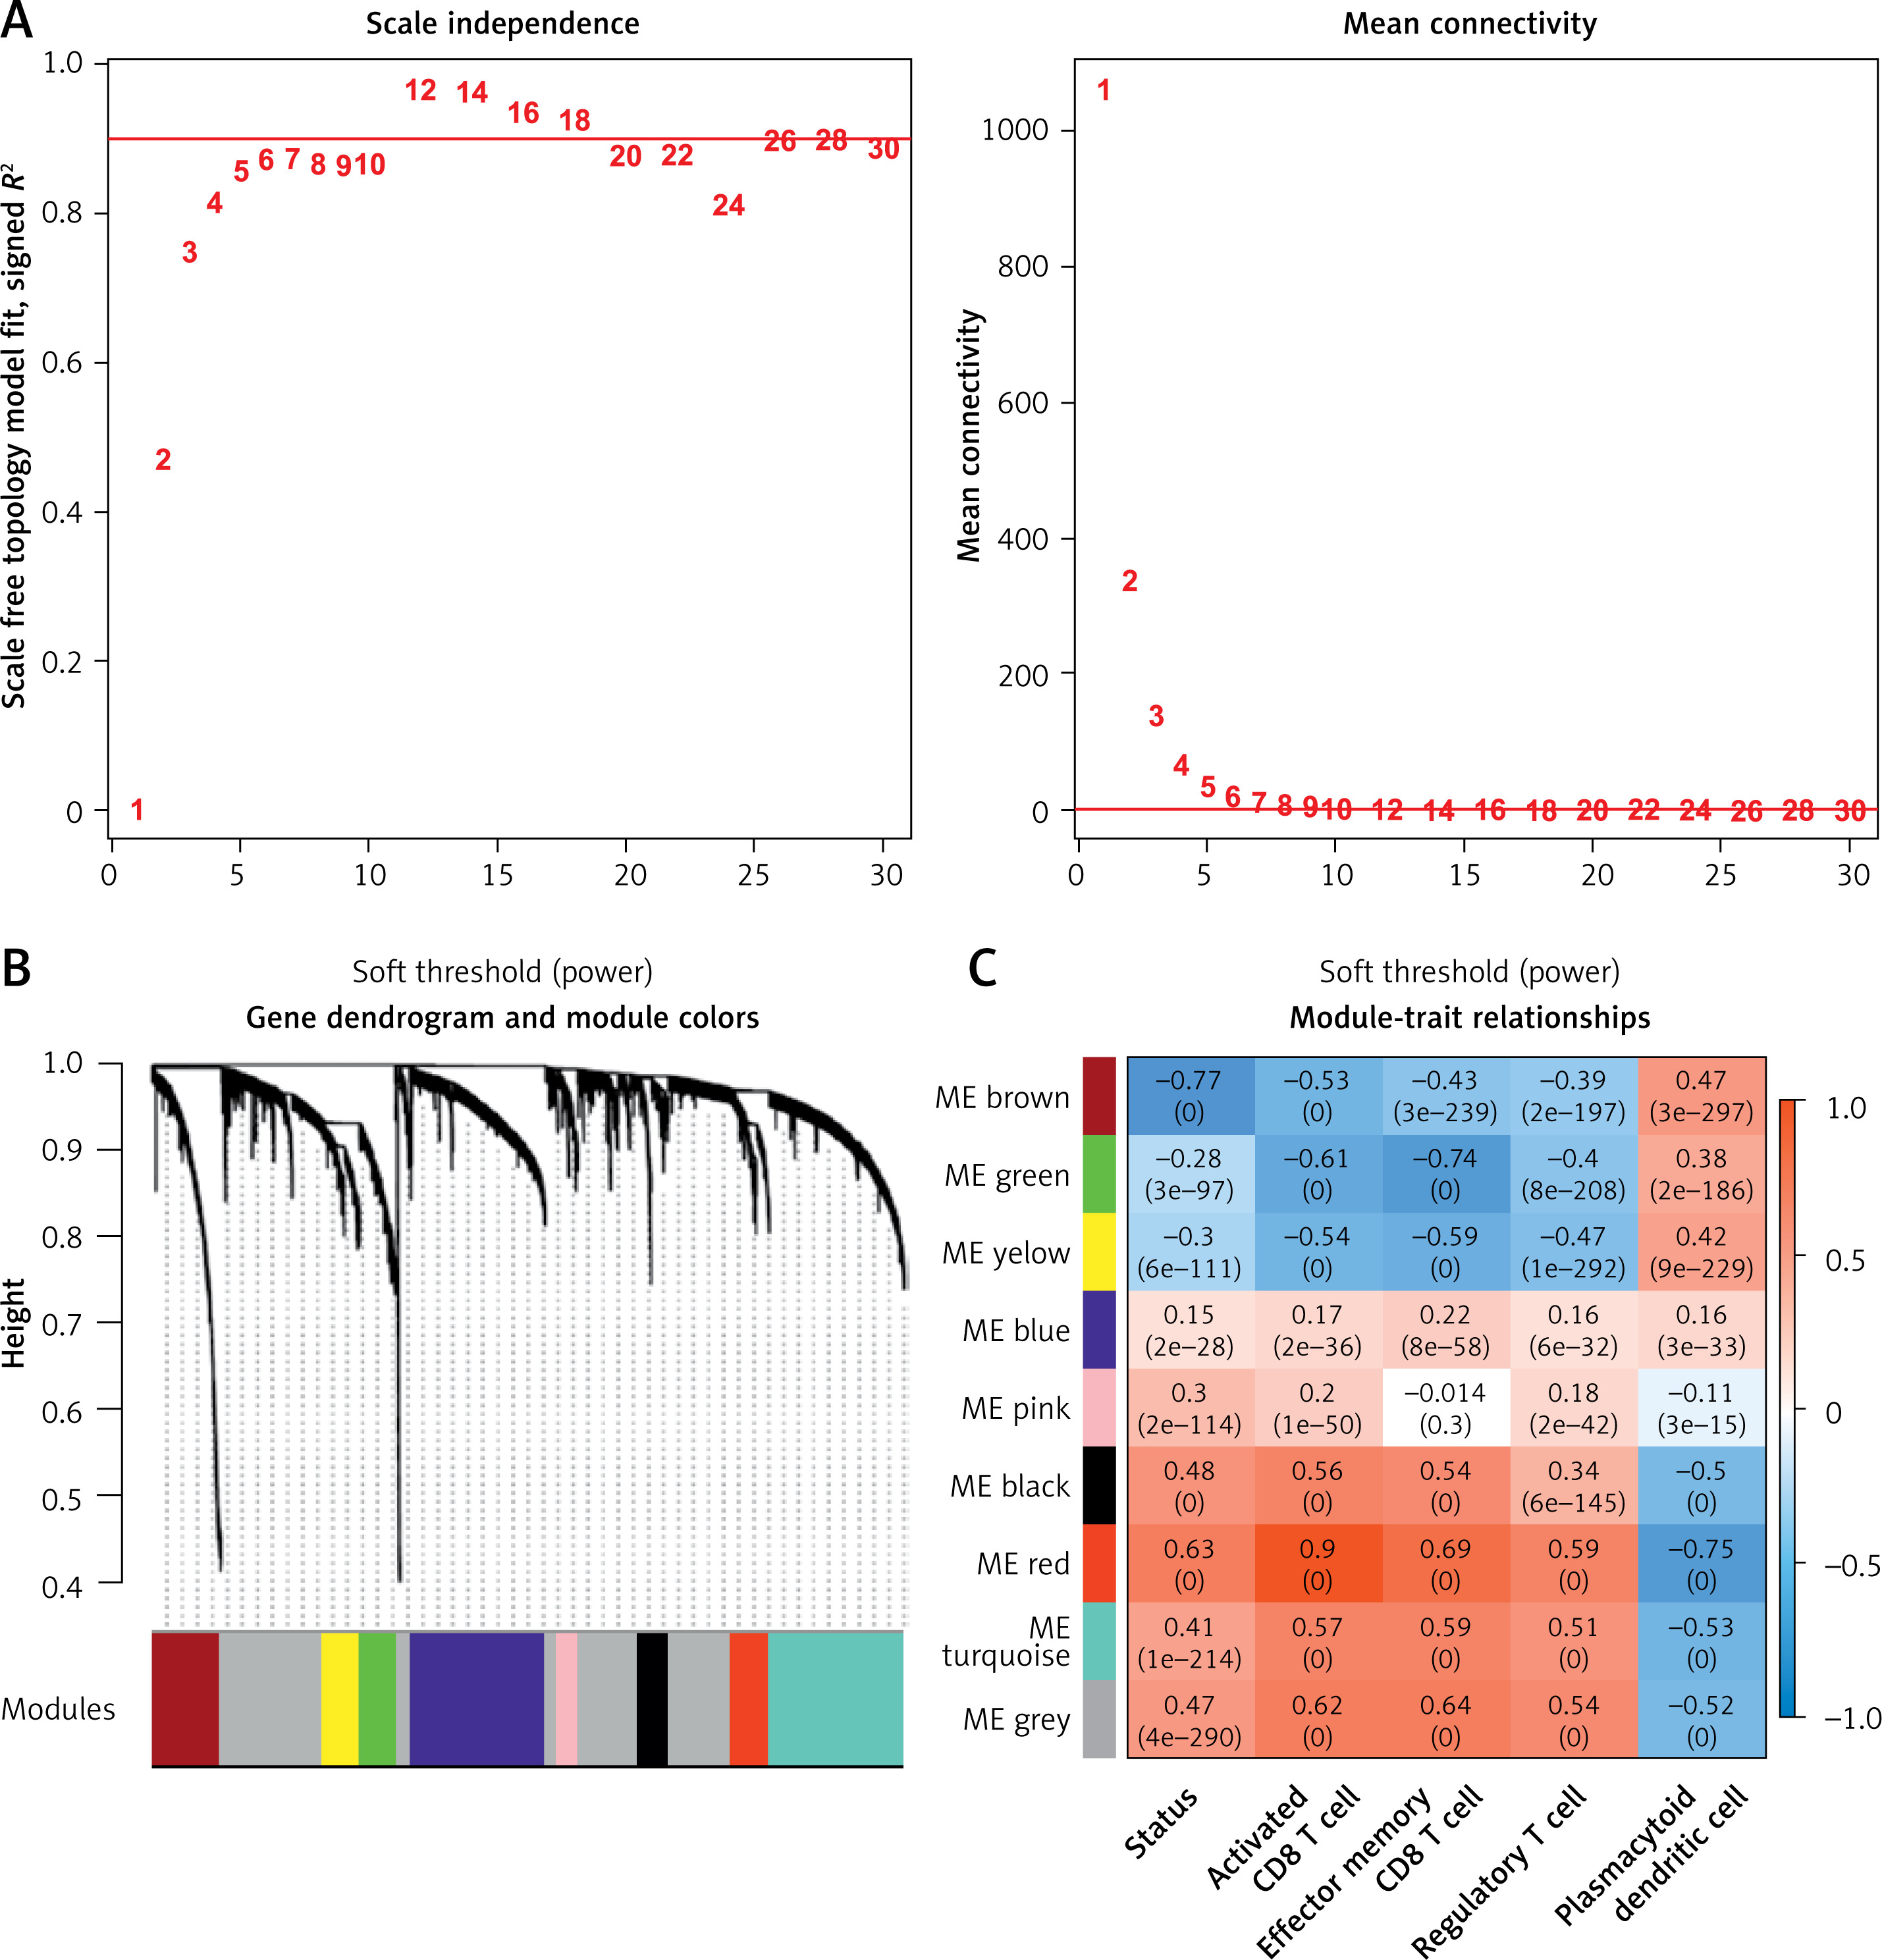
Additionally, 427 overlapping DERs were assigned to each WGCNA module, resulting in a total of 419 RNAs being allocated across the modules. As illustrated in Table II, DERs are notably enriched in the brown and red modules, encompassing 197 and 118 DERs, respectively. Among these DERs are 12 lncRNAs and 303 mRNAs. Figure 4 C shows a significant negative correlation between the brown module and disease progression as well as various T cell subsets, whereas the red module exhibits a significant positive correlation with disease progression and T cell subsets.
Table II
Statistical information of modules
Co-expression network
A total of 583 co-expression pairs were identified, and subsequently the lncRNAs-mRNAs co-expression pair network was constructed (Figure 5).
Figure 5
Co-expression network of lncRNAs-mRNAs. Squares and circles represent lncRNAs and mRNAs, and the color of the node edge represents the color module corresponding to WGCNA
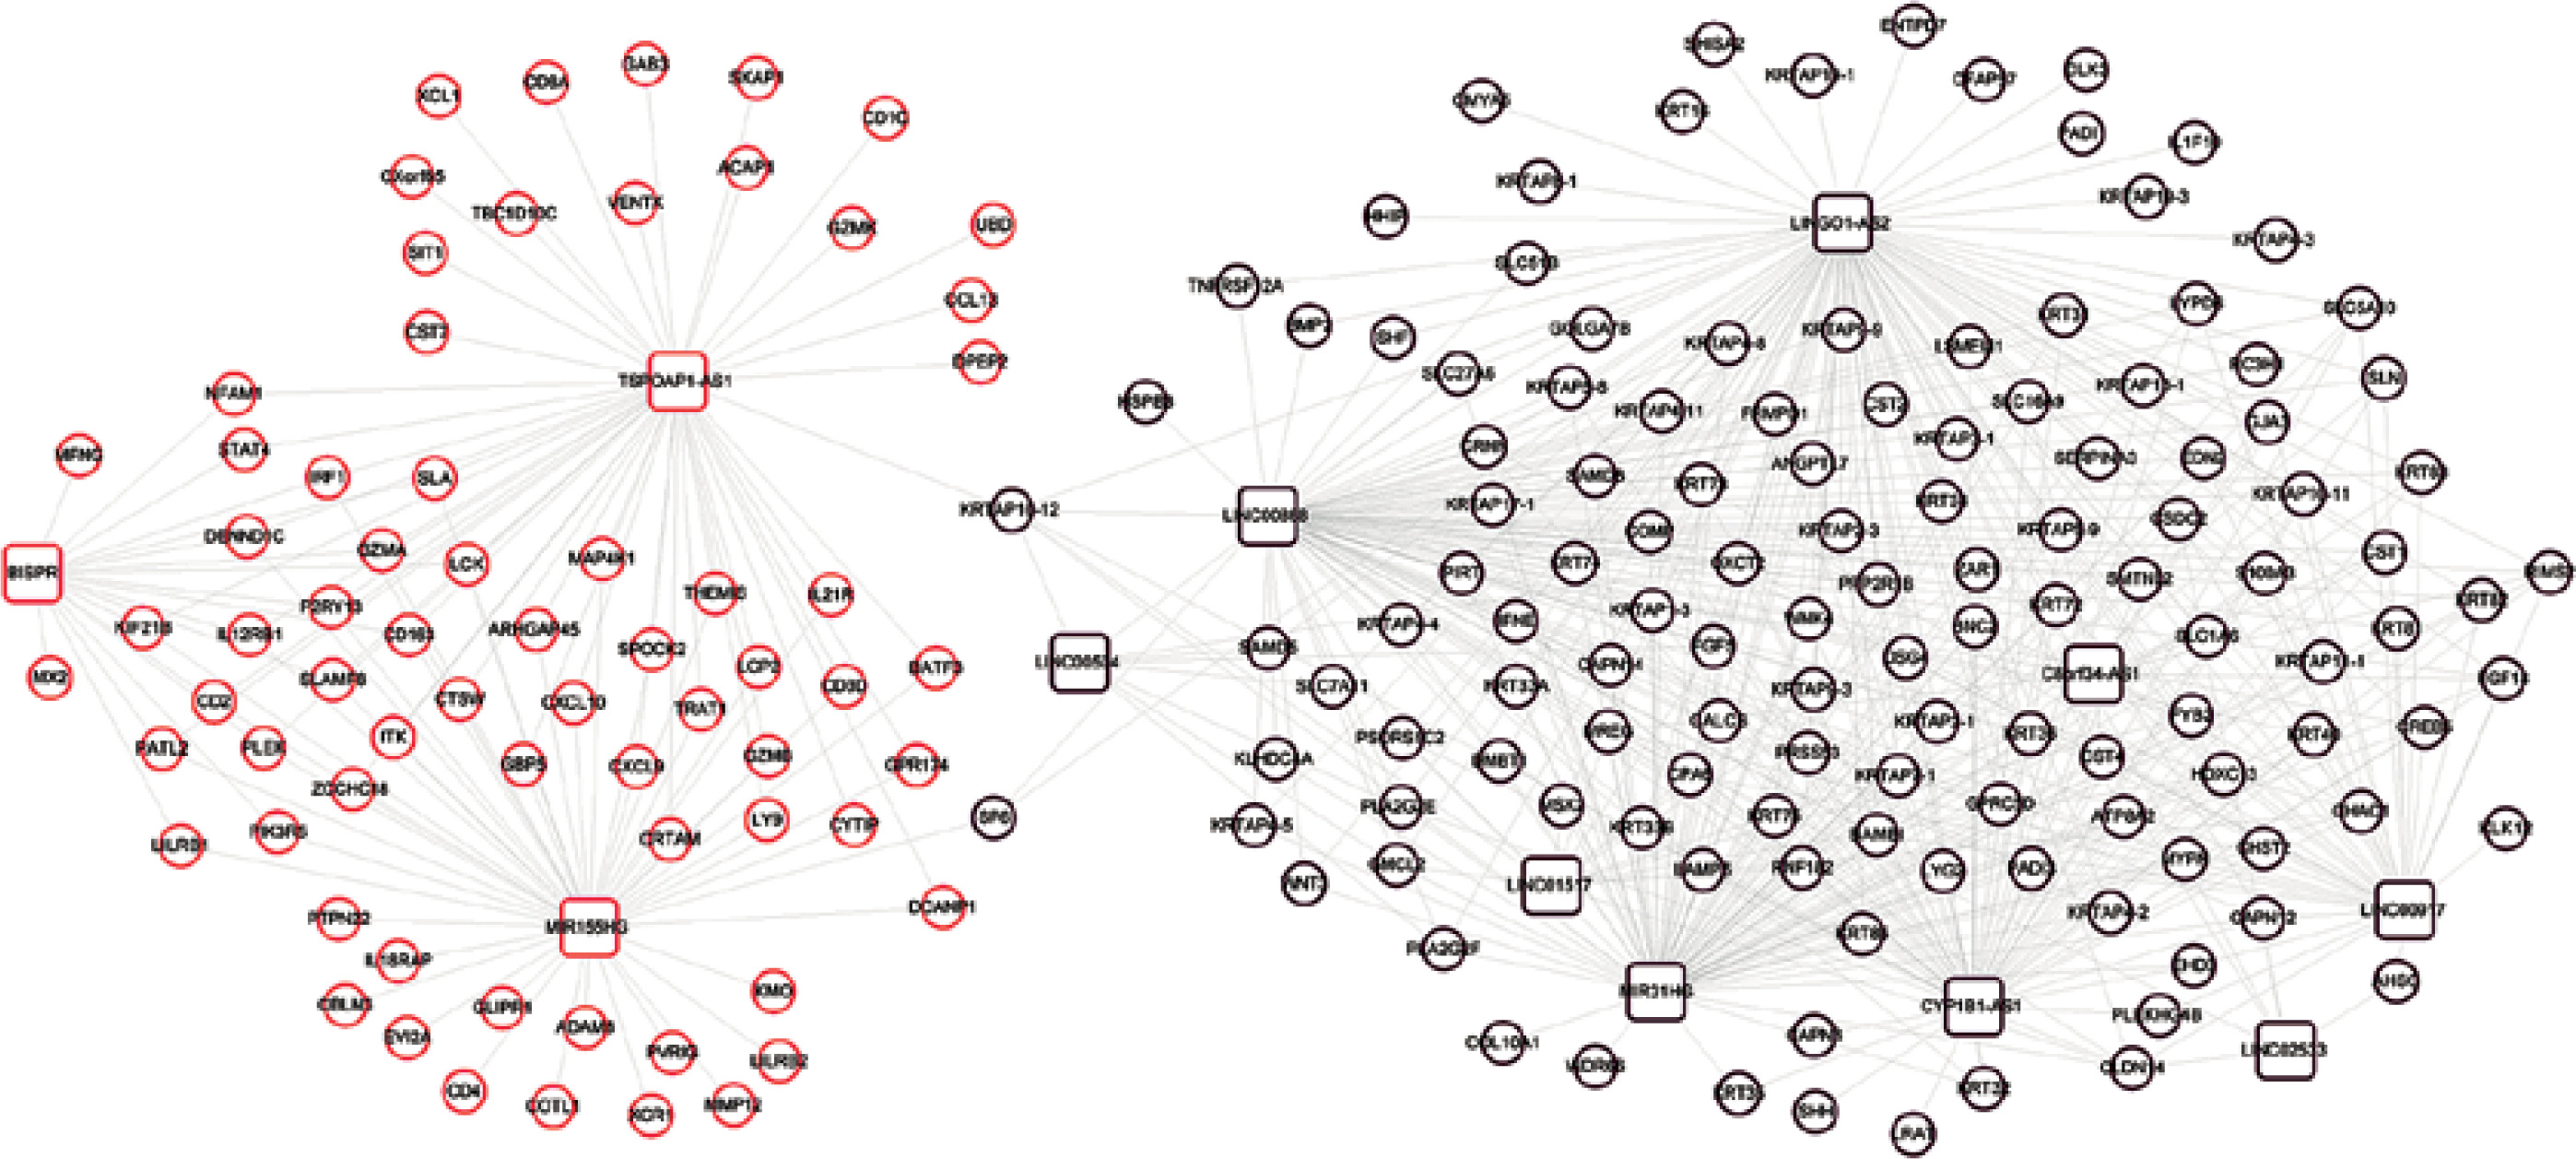
The functional analysis revealed significant enrichment of the genes within the co-expression network in ten KEGG pathways, including the T cell receptor signaling pathway, cytokine-cytokine receptor interaction, and primary immunodeficiency (Table III).
Table III
Kyoto Encyclopedia of Genes and Genomes (KEGG) signaling pathways significantly related to genes in the co-expression network
| Term | Count | P-value |
|---|---|---|
| *hsa04060: Cytokine-cytokine receptor interaction | 11 | 4.00E-05 |
| *hsa04660: T cell receptor signaling pathway | 7 | 2.15E-04 |
| hsa05340: Primary immunodeficiency | 4 | 3.12E-03 |
| *hsa04062: Chemokine signaling pathway | 7 | 5.37E-03 |
| *hsa04640: Hematopoietic cell lineage | 5 | 6.79E-03 |
| hsa04380: Osteoclast differentiation | 5 | 2.70E-02 |
| *hsa04514: Cell adhesion molecules (CAMs) | 5 | 3.48E-02 |
| *hsa04630: Jak-STAT signaling pathway | 5 | 3.72E-02 |
| *hsa04620: Toll-like receptor signaling pathway | 4 | 4.65E-02 |
| *hsa04650: Natural killer cell mediated cytotoxicity | 4 | 4.90E-02 |
Important biomarkers related to AA
Using “Alopecia Areata” as a keyword search in the CTD database, we identified 24 KEGG signaling pathways and 10 genes directly linked to the disease. Among these, 8 pathways overlapped (marked with “*”) in Table III. Notably, CXCL9 and CXCL10 were found to be directly linked to the overlapping disease within the pathways. ROC analysis was conducted to assess the sensitivity and specificity of CXCL9 and CXCL10 in discriminating AA patients from controls, resulting in notably high AUC values of 0.87 and 0.836, respectively (Figure 6 A, B). Additionally, analysis of GSE80342 yielded similar results, demonstrating significantly elevated expression levels of CXCL9 and CXCL10 in AA patients compared to controls (Figure 6 C).
Figure 6
Validation of CXCL9 and CXCL10 as diagnostic markers in AA patients. A – ROC analysis of CXCL9 in GSE68801. B – ROC analysis of CXCL10 in GSE68801. C – Expression levels of CXCL9 and CXCL10 in GSE80342
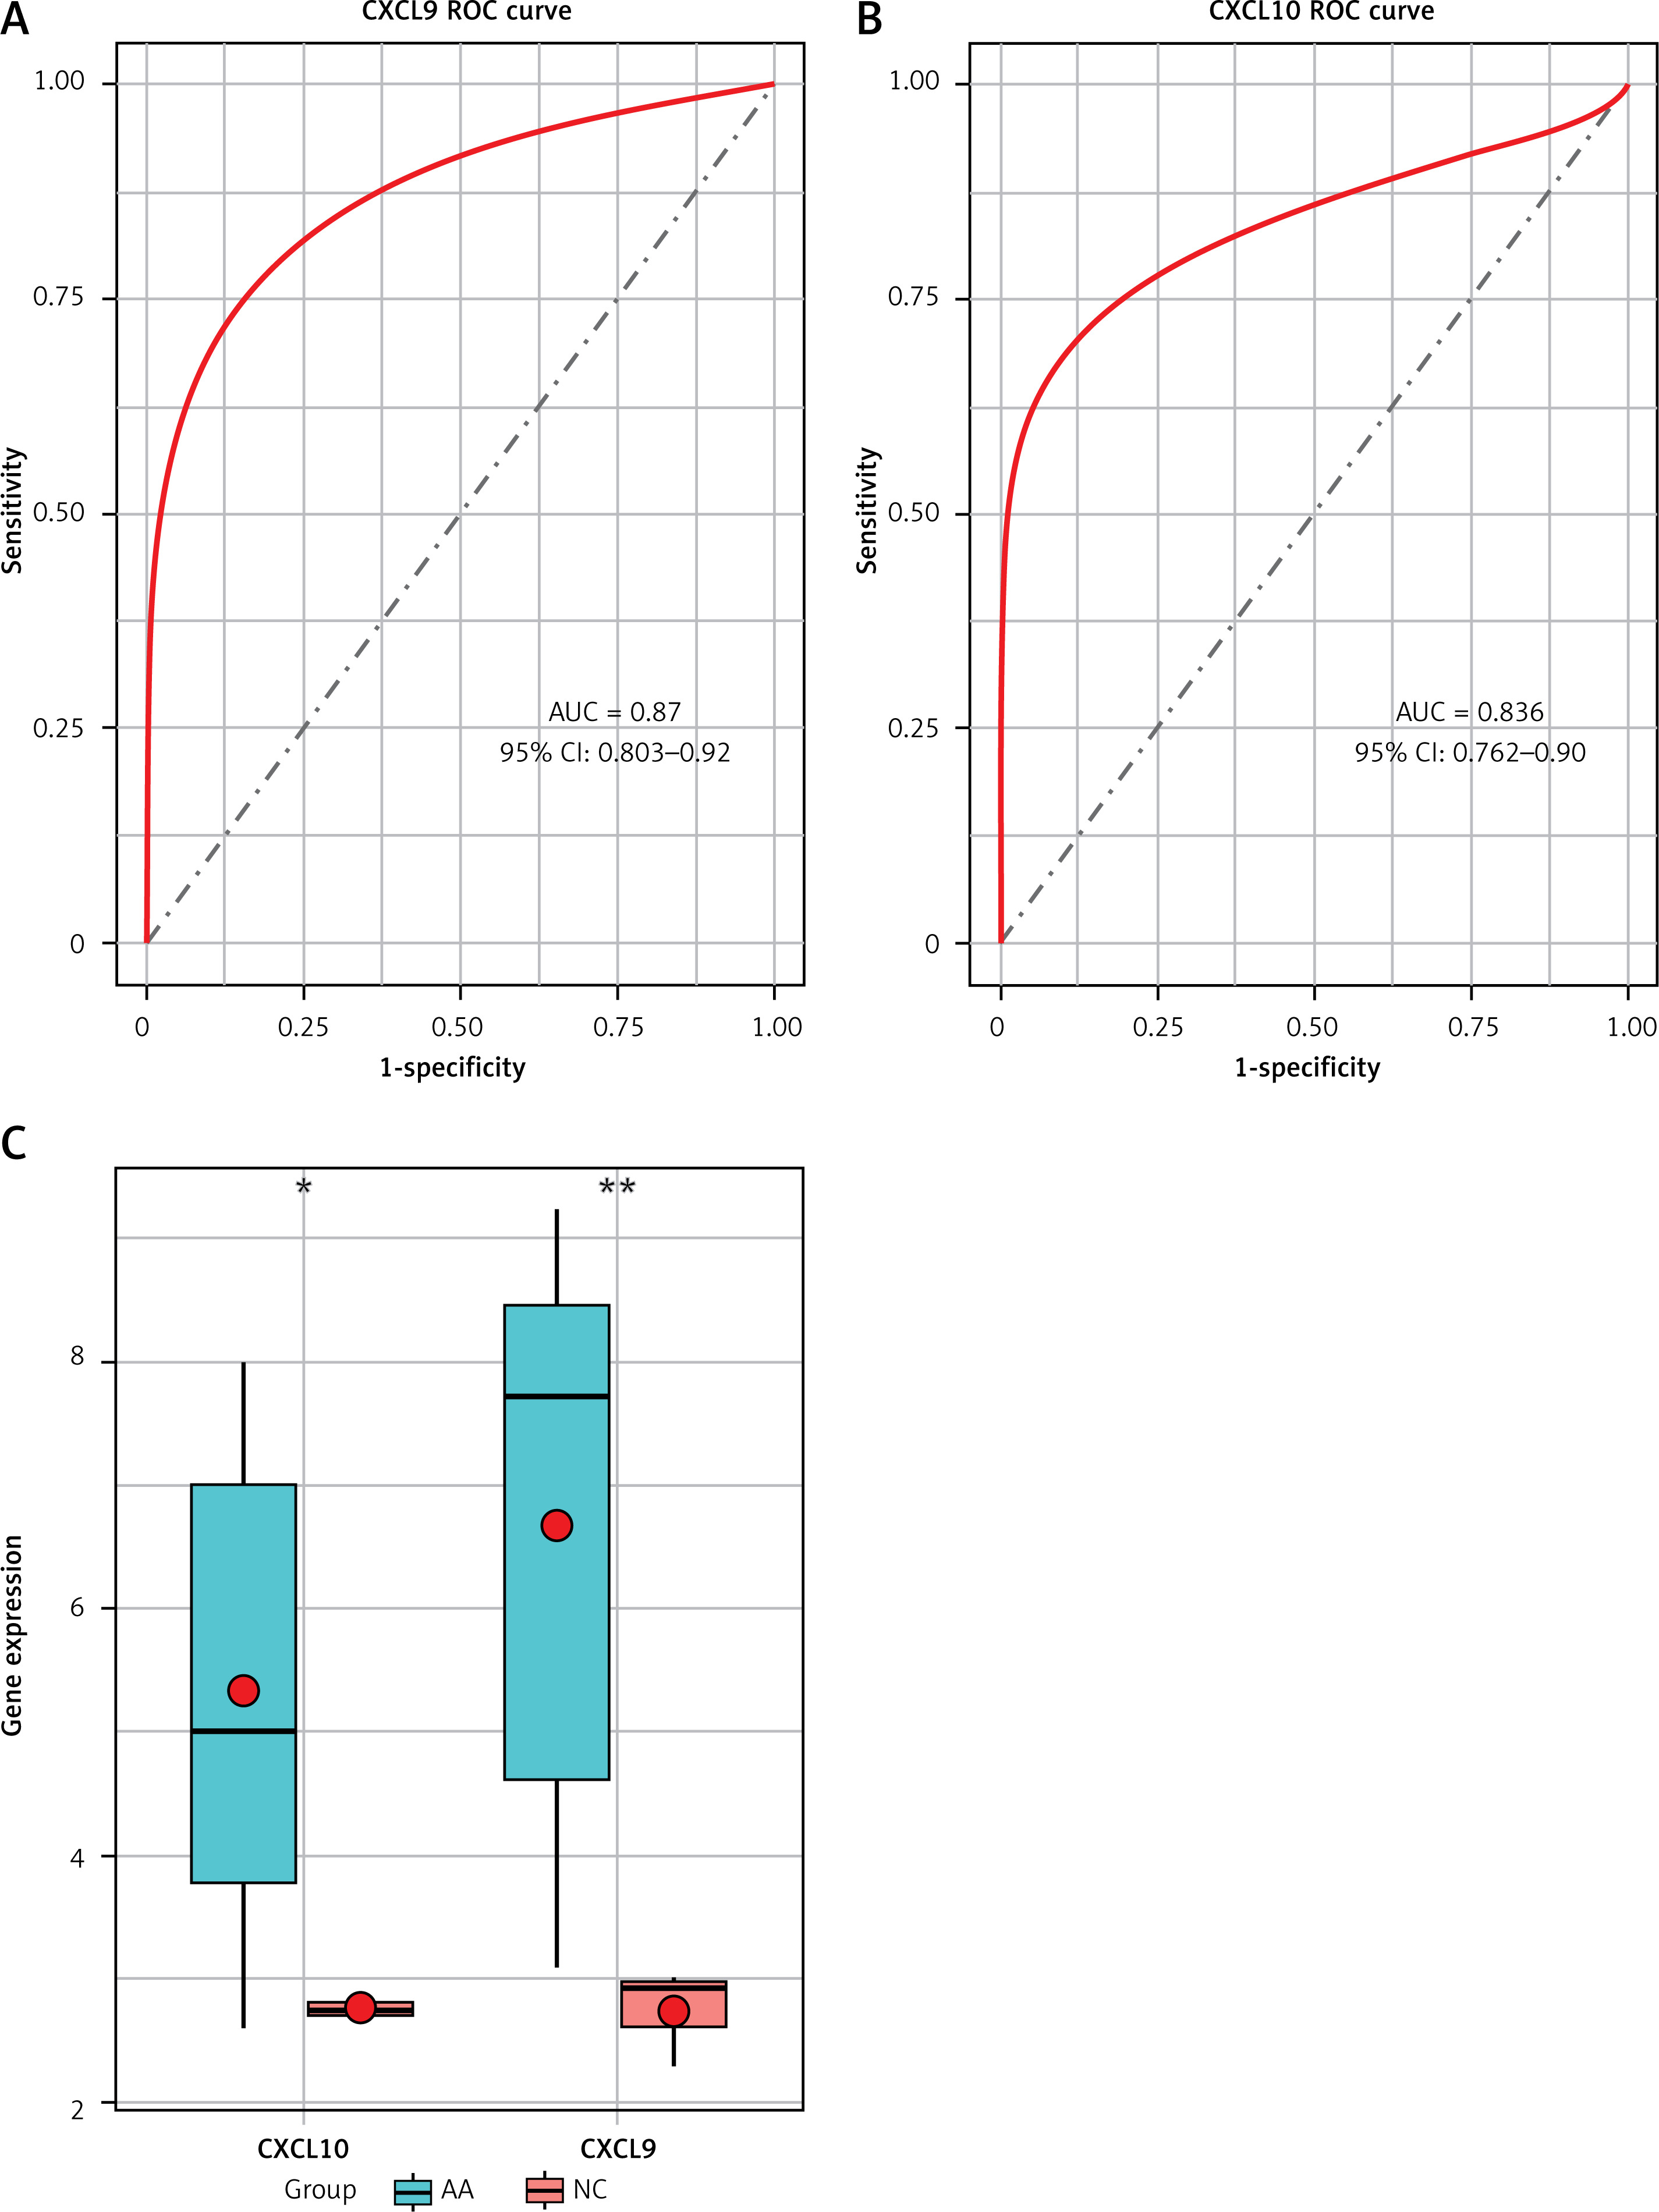
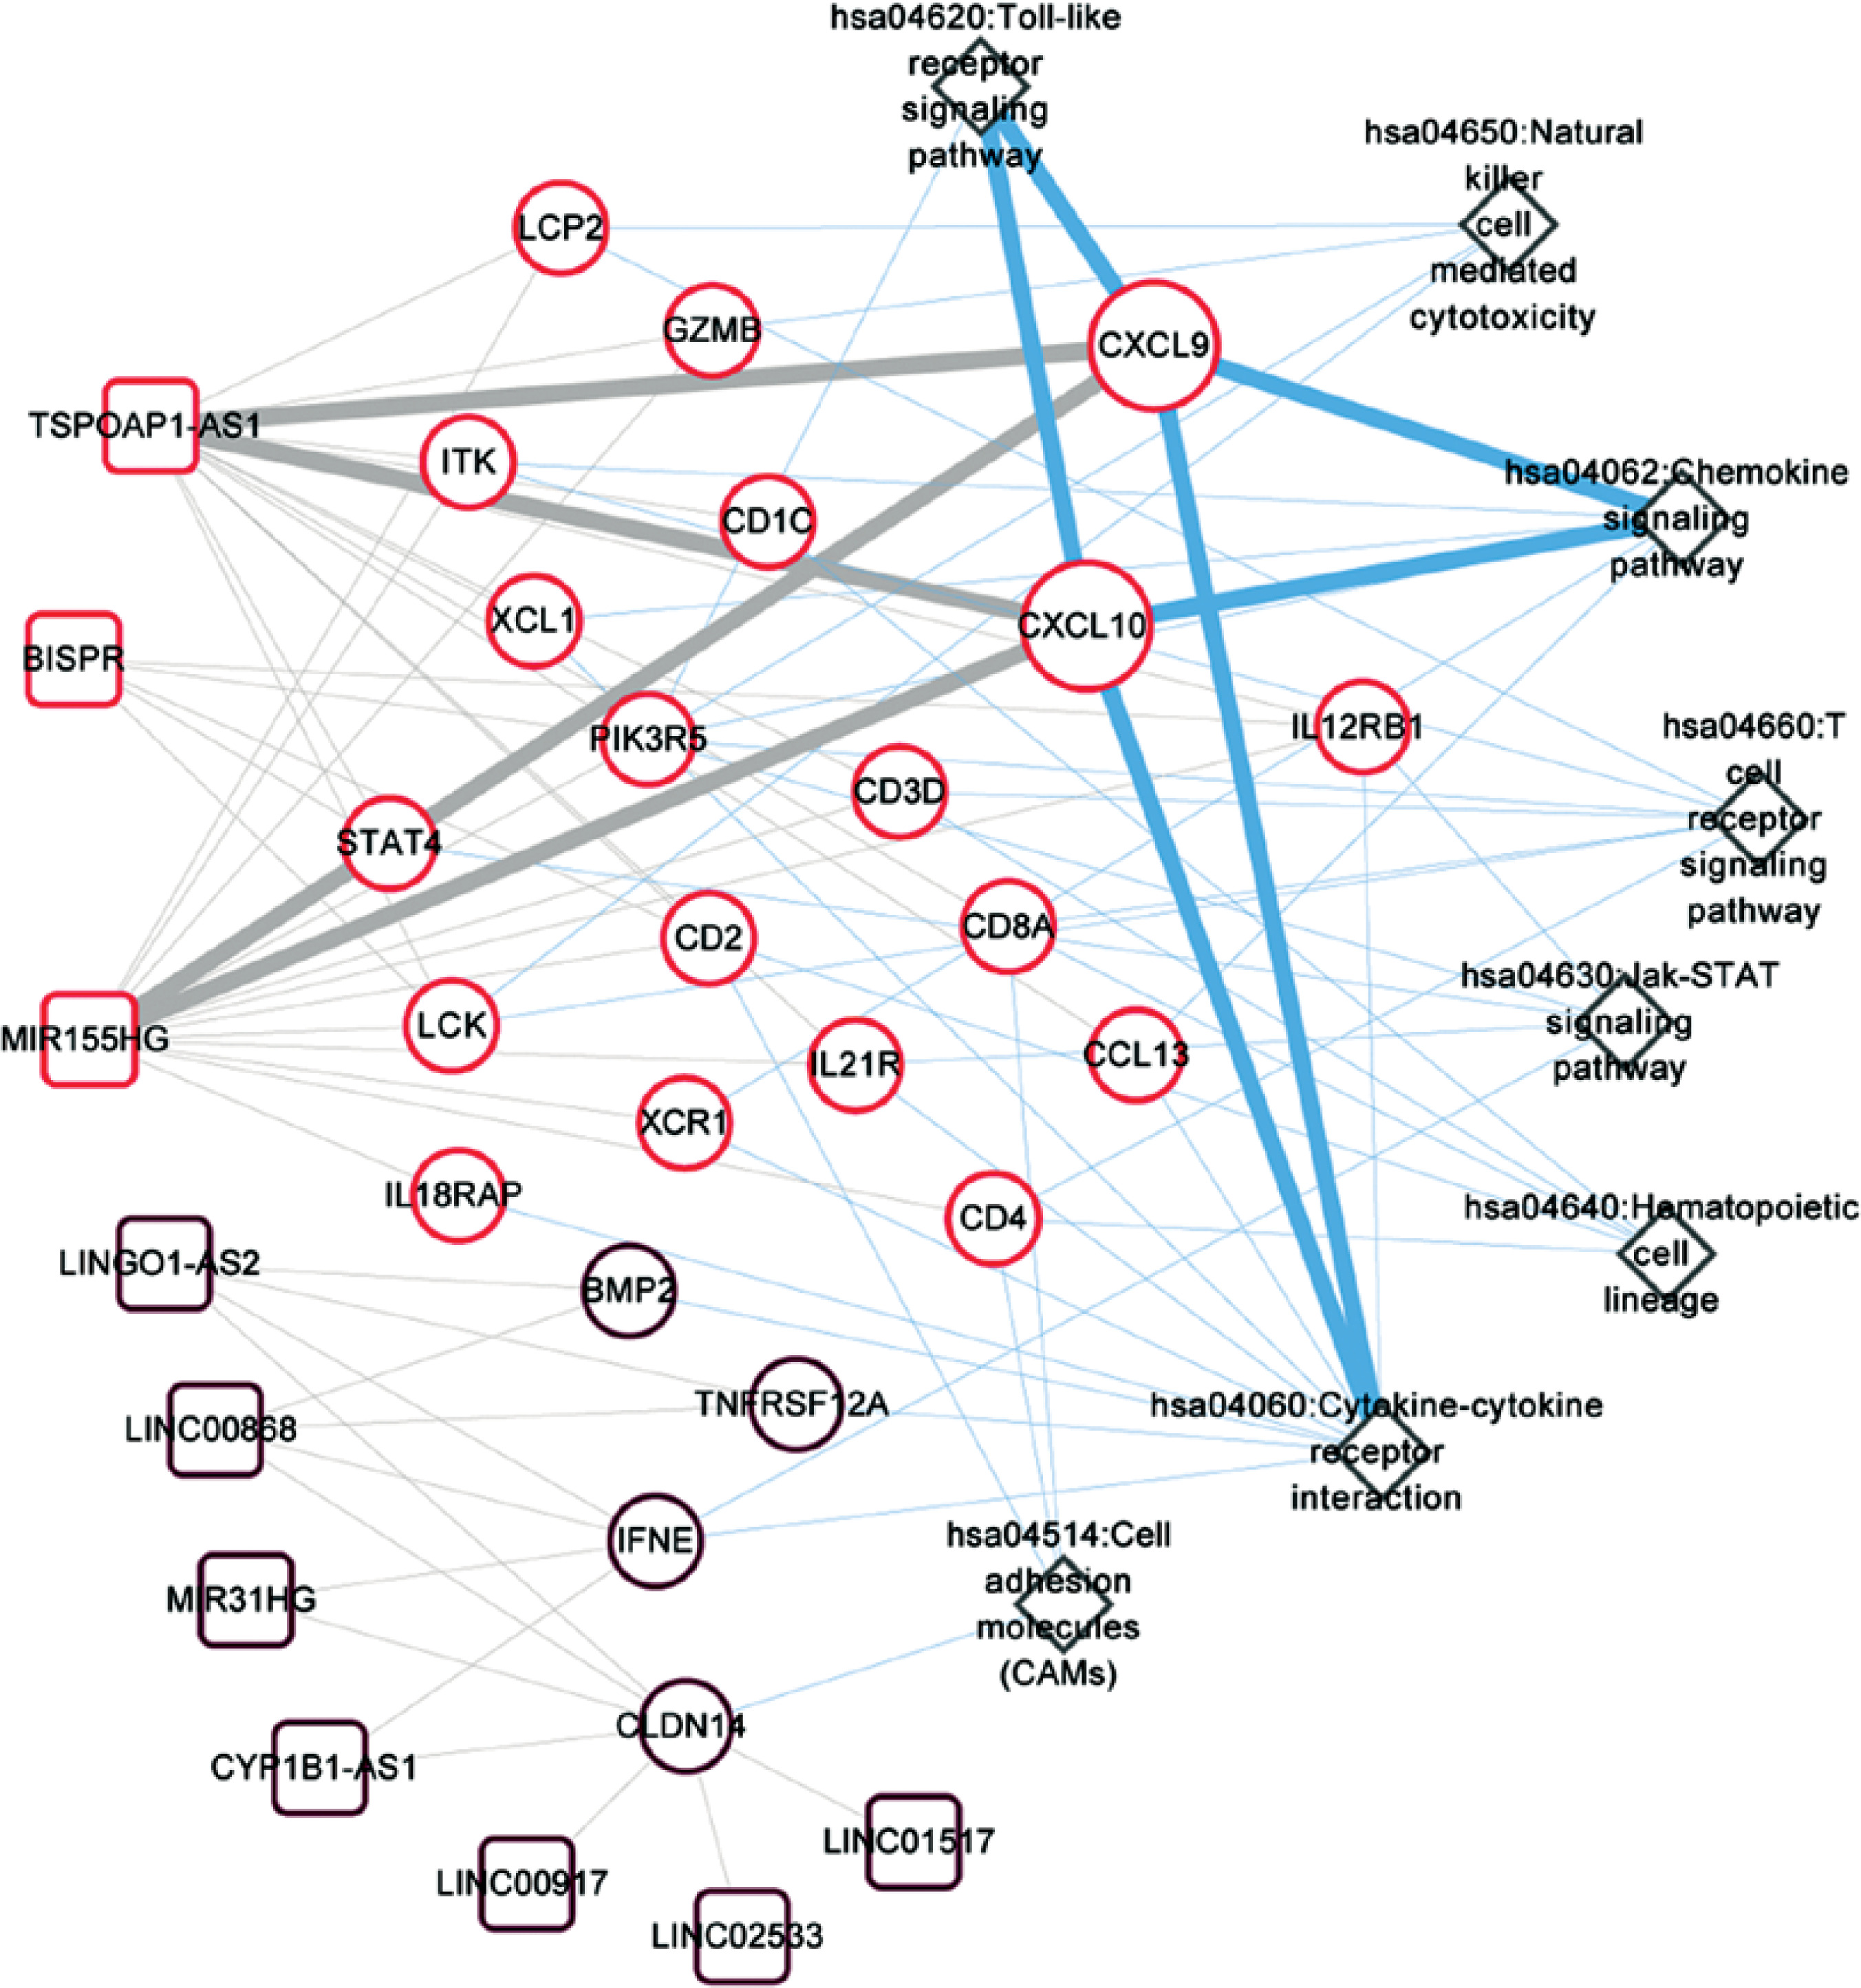
Figure 7 illustrates the involvement of CXCL9 and CXCL10 in three KEGG pathways: the chemokine signaling pathway, cytokine-cytokine receptor interaction, and Toll-like receptor signaling pathway. Furthermore, the expression levels of CXCL9 and CXCL10 showed significant associations with lncRNAs, such as MIR155HG and TSPOAP1-AS1. Additionally, other important immune-related genes, namely CCL13 and IL-21R, were also found to be involved in the pathways associated with CXCL9 and CXCL10.
Discussion
AA is a multifaceted T cell-mediated autoimmune ailment. Conventional treatments for the condition exhibit only moderate efficacy, underscoring the urgent need for novel therapeutic approaches. Thus, our study was designed to identify new biomarkers associated with AA progression. We analyzed a comprehensive dataset comprising 1708 lncRNAs and 17,326 mRNAs, identifying 427 overlapping DERs across AAP, AU, AT, and NC. Notably, these DERs were markedly enriched in biological processes linked to inflammatory and adaptive immune responses, as well as in KEGG signaling pathways such as chemokine and cytokine-cytokine receptor interaction. Furthermore, our investigation revealed significant associations between AA and activated CD8 T cells, effector memory CD8 T cells, regulatory T cells, as well as plasmacytoid dendritic cells. Lastly, we identified various genes – including CXCL9, CXCL10, MIR155HG, TSPOAP1-AS1, CCL13, and IL-21R – that exhibited significant correlations with the disease.
Traditionally, AA has been attributed to cell-mediated immune responses [22]. Prior studies have explored various strategies for treating AA, such as stem cell educator therapy, though their precise roles in AA remain unclear [23]. Our findings indicated a correlation between AA and the activation of CD8 T cells, effector memory CD8 T cells, regulatory T cells, and plasmacytoid dendritic cells. Extensive research has elucidated the involvement of diverse T cell subsets in AA pathogenesis. For instance, Czarnowicki et al. demonstrated a relationship between the activation of T-helper 2 cells and disease severity, with IFN-γ levels impacting disease chronicity [24]. Similarly, Elela et al. identified Th17 cells as synergistically involved in AA pathogenesis [25]. Furthermore, our analysis revealed significant enrichment of DERs in biological processes associated with inflammatory and adaptive immune responses, as well as in KEGG signaling pathways such as chemokine and cytokine-cytokine receptor interaction. Notably, elevated levels of IFN-γ, known to play a pivotal role in AA pathogenesis, have been observed in AA patients [26]. Consistent with our findings, prior evidence suggests that CD8+ T cell infiltration and associated cytokines are essential for AA induction [27]. In summary, our data support the characterization of AA as a T cell-mediated autoimmune disease.
The chemokines CXCL9 and CXCL10, known for their role as chemoattractants for lymphocytes, have been reported to exhibit significant elevation in the early stages of AA [28]. They have been identified as valuable biomarkers for both diagnosing and treating AA [29]. In our study, we found a significant association between CXCL9 and CXCL10 and AA, with elevated levels in lesional samples of AA patients. CXCL10, induced by IFN-γ, is known to amplify polarized Th1 responses, which are critical in the pathogenesis of AA [30]. The accumulation of lymphocytes around hair bulbs is widely recognized as a hallmark pathological change in AA [2]. Our findings suggest that CXCL9 and CXCL10 contribute to AA development through the chemokine interaction pathway. Previous studies have shown that CXCL10 levels correlate with AA severity, supporting our results [28]. Moreover, molecular inhibition of CXCL9 and CXCL10 has been proposed as a potential therapeutic approach, which aligns with our findings [29]. These chemokines may serve as both biomarkers and therapeutic targets in AA, emphasizing their dual role in disease pathogenesis and management.
Recent studies have further elucidated the role of CXCL9 and CXCL10 in autoimmune conditions other than AA. For example, their involvement in the pathophysiology of diseases such as systemic lupus erythematosus and rheumatoid arthritis has been well documented, highlighting their broader significance in autoimmune disease mechanisms [31, 32]. This broader context underscores the importance of our findings and suggests potential cross-disease therapeutic strategies targeting these chemokines.
Additionally, our analysis highlighted two other lncRNAs, MIR155HG and TSPOAP1-AS1, along with two genes, CCL13 and IL21R, as significant factors in AA progression. Previous studies have indicated the involvement of numerous immune-related genes and various cell types, including cytotoxic lymphocytes, T cells, and myeloid dendritic cells, in the functions of CCL13 and IL21R, suggesting their significant roles in AA risk [33]. Notably, our findings revealed associations between the expression levels of CXCL9 and CXCL10 and the lncRNAs MIR155HG and TSPOAP1-AS1. Although no direct evidence currently supports the involvement of MIR155HG and TSPOAP1-AS1 in AA development, our results suggest their potential implication in AA pathogenesis.
Recent literature has also highlighted contrasting findings regarding the role of lncRNAs in autoimmune diseases. Some studies suggest that other lncRNAs may play a more significant role in disease mechanisms, indicating a need for further exploration and validation of our findings in different cohorts and with additional biomarkers [34, 35].
Furthermore, recent research has provided more insights into the immune mechanisms involved in AA. For instance, Kim et al. (2022) investigated the ex vivo treatment of peripheral blood mononuclear cells from AA patients with allogenic mesenchymal stem cells, targeting dysregulated T cells and promoting immunotolerance [36]. Similarly, Waśkiel-Burnat et al. (2021) examined the role of serum Th1, Th2, and Th17 cytokines in AA patients, offering clinical implications for these cytokine profiles in disease management [37].
However, it is essential to acknowledge certain limitations. Our assessment of these genes’ roles in AA was based on statistical analyses, and while this approach has been validated by numerous researchers, it is imperative to verify our bioinformatics predictions through clinical experiments. Future studies should focus on longitudinal data and functional assays to confirm the clinical relevance of these biomarkers in AA.
Our findings underscore the potential of identified biomarkers such as CXCL9, CXCL10, MIR155HG, TSPOAP1-AS1, CCL13, and IL-21R to serve not only as diagnostic indicators but also as therapeutic targets. Integrating these biomarkers into clinical practice could enhance the precision of AA diagnosis, facilitate personalized treatment approaches, and potentially lead to more effective management strategies for patients.
In conclusion, our study provides a comprehensive analysis of immune-related biomarkers associated with different AA subtypes. The inclusion of recent studies has further strengthened our findings, highlighting the importance of CXCL9, CXCL10, MIR155HG, TSPOAP1-AS1, CCL13, and IL-21R in AA pathogenesis. These biomarkers offer promising targets for future therapeutic strategies, potentially improving the management and treatment of AA. The integration of these biomarkers into clinical practice could significantly enhance diagnostic accuracy and therapeutic efficacy, thereby improving patient outcomes in AA.
Future research should focus on validating these biomarkers in larger, independent cohorts to confirm their diagnostic and prognostic utility. Additionally, functional studies are needed to elucidate the precise mechanisms through which these biomarkers influence AA pathogenesis. Investigating the potential of these biomarkers in guiding personalized treatment approaches and their role in other autoimmune diseases could provide valuable insights. Finally, clinical trials assessing the efficacy of targeted therapies against these biomarkers will be crucial in translating our findings into clinical practice.