Introduction
Tethered cord syndrome (TCS) is a complex neurological condition that presents numerous challenges for both research and clinical management [1]. The condition is characterized by the spinal cord’s abnormal fixation, leading to a variety of symptoms including urinary and defecation dysfunction, sensory disturbances, and pain [2–4]. While surgical intervention, such as tethered cord release (TCR), remains the primary treatment approach, there is a growing interest in exploring alternative and complementary therapies, particularly in the realm of traditional medicine [5].
Paeoniflorin (PF), a principal active constituent extracted from the peony root, has garnered significant attention due to its diverse pharmacological activities [6]. With established effects such as anti-inflammation, antioxidant properties, antispasmodic action, and immunomodulation [7], PF presents a promising candidate for the treatment of neurological disorders, including TCS [8, 9].
The anti-inflammatory effect of PF can be particularly beneficial in TCS, where inflammation can exacerbate nerve damage and contribute to the condition’s progression. The antispasmodic effect of PF is crucial in alleviating the muscle spasms and abnormal neuronal excitability often seen in TCS patients. By reducing these symptoms, PF could improve the quality of life for individuals affected by the condition. Furthermore, the immunomodulatory effects of PF could help regulate the immune system’s response, thereby reducing inflammation and tissue damage.
Research has begun to uncover the specific mechanisms by which PF may exert its neuroprotective effects in TCS.
The development of accurate animal models is essential for advancing our understanding of TCS and for testing the efficacy of potential treatments such as PF. While various methods have been employed to create tethered spinal cord animal models, there is a need for models that closely mimic the clinical presentation of TCS [10]. By establishing evaluation standards that reflect the actual symptoms and outcomes of TCS, researchers can better assess the impact of treatments such as PF on the neurological function of affected animals.
In summary, while surgical treatment remains the cornerstone of TCS management, the exploration of traditional Chinese medicine, particularly the use of PF, offers a promising avenue for potential therapeutic advancements. The multifaceted pharmacological activities of PF, combined with its neuroprotective properties, make it a compelling candidate for further research into the treatment of TCS. With continued investigation into the mechanisms of action and the development of more accurate animal models, the potential of PF in the management of TCS can be fully realized, offering new hope for patients suffering from this complex neurological condition.
Material and methods
Experimental subjects
All experiments in this study were approved by the Ethics Committee of Shanghai University of Traditional Chinese Medicine (PZSHUTCM220627035) and were conducted in accordance with the approval guidelines. Sixty healthy male SD rats were selected, each with a growth age of about 6 to 8 weeks and 200 to 220 g. The rats were kept in cages with a constant temperature of 23 ±2°C and a prescribed 12-hour light/dark cycle. We provided special food for SD rats and sufficient clean drinking water. All experiments were conducted in accordance with the Guidelines for the Care and Use of Laboratory Animals (2006, Ministry of Science and Technology of China). All animal experiments conducted by the Animal Protection Committee of Shanghai University of Traditional Chinese Medicine are in compliance with the International Association for the Study of Pain Animal Research Guidelines as well.
Experimental animal grouping
SD rats were randomly divided into 3 groups: 6 rats in the control group Sham + Vehicle (physiological saline) and 6 rats in Sham + PF 25 mg/kg; the modeling group was divided into 12 rats in the control group TCS + Vehicle (physiological saline) and the treatment group TCS + PF 25 mg/kg, TCS + PF 50 mg/kg, TCS + PF 100 mg/kg).
Behavioral test
According to the weight of the rat, different concentrations of PF were prepared and dissolved in 0.9% physiological saline. The injection solution volume was 2 ml. It was placed in a 2 ml syringe for intraperitoneal injection, applied for 14 consecutive days. Neurological function scores (Tarlov score, Basso-Beattie-Bresnahan (BBB) score) were determined on days 1, 3, 7, 11, and 14. After 14 days, the rats in the four groups of TCS models were sacrificed and histological examination was performed.
Experimental drugs
Different doses of paeoniflorin were dissolved in 2 ml of 0.9% normal saline and injected into the abdominal cavity of rats with a 2 ml syringe. According to preliminary experiments and preliminary research results, PF (25 mg/kg, 50 mg/kg, 100 mg/kg) is the optimal dosage and has a concentration gradient effect. Starting on the first day after TCS modeling, PF or vehicle (physiological saline) was injected intraperitoneally once a day for 14 consecutive days.
Neurological function score
Referring to the method described by Safavi-Abbasi et al. [11], the hindlimb motor function was recorded and scored using the Tarlov scoring standard on days 1, 3, 7, 11, and 14 after TCS modeling in the control group and TCS modeling respectively, and the BBB scoring system was used to evaluate the later recovery (see Supplements). (The spinal nerve function of rats in each group was assessed. The data were collected in a blinded manner, in triplicate.) A supplementary righting reflex test and foot failure test were used to evaluate the sensory function of the lower limbs of rats. The righting reflex test was performed on days 1, 3, 7, 11, and 14. The rats were placed supine, and the time (s) for them to completely turn over and return to their natural position was recorded. The foot failure test was performed on days 1, 3, 7, 11, and 14. The rats were placed on the elevated grid surface, and the ratio of the number of footstep failures that occurred within 60 s was recorded.
Histological testing
The rats were sacrificed 14 days after TCS. The rat spinal cord tissue specimens were taken. The end of the filum terminale of the spinal cord was taken for pathology. The spine was taken out. A 5 ml syringe was inserted into the spinal canal to blow out the spinal cord and filum terminale tissue. Hematoxylin and eosin (HE) and Nissl staining was performed, and Western blotting and immunohistochemistry techniques were used to detect spinal cord tissue.
Specimen collection
After the nerve injury of the rat, the score was completed and the rat was euthanized. The spinal cord tissue was extracted at the end of the conus spinal cord, washed, and subjected to routine dehydration, transparency, paraffin embedding, sectioning, and baking, and then fixed with 4% paraformaldehyde for 96 h, washed with PBS and sealed in the refrigerator.
HE staining of rat spinal cord tissue
Rat spinal cord tissue was collected (the sample site included the tethered center), dewaxed with xylene and ethanol, stained with hematoxylin for 10 min, rinsed with tap water for 5 min, differentiated with 1% hydrochloric acid alcohol, rinsed with tap water for 1 min, and 1% ammonia water to return to blue, rinsed with tap water for 1 min, then stained with eosin stain for 1 min, rinsed with tap water for 1 min and then cleared with ethanol and xylene. After sealing with neutral gum, an optical microscope was used for histopathological observation.
Nissl staining
Samples were taken from TCS model rats (the sample site included the entire tethering center), and the frozen sections were located at 3 mm from the tethering center and close to the tail of the spinal cord, with a thickness of 20 µm. The frozen sections were air-dried at room temperature and then immersed in a mixed liquid (absolute ethanol : chloroform = 1 : 1) at room temperature overnight in a dark place. The next day, the tissues were placed in absolute ethanol, 95% alcohol, 70% alcohol and triple distilled water in sequence. Afterwards, it was stained with 0.05% tar violet, followed by 95% alcohol differentiation, 100% alcohol dehydration and xylene transparency treatment. Finally, it was sealed with neutral gum and the morphology and the number of Nissl bodies was observed under a microscope.
Western blot detection
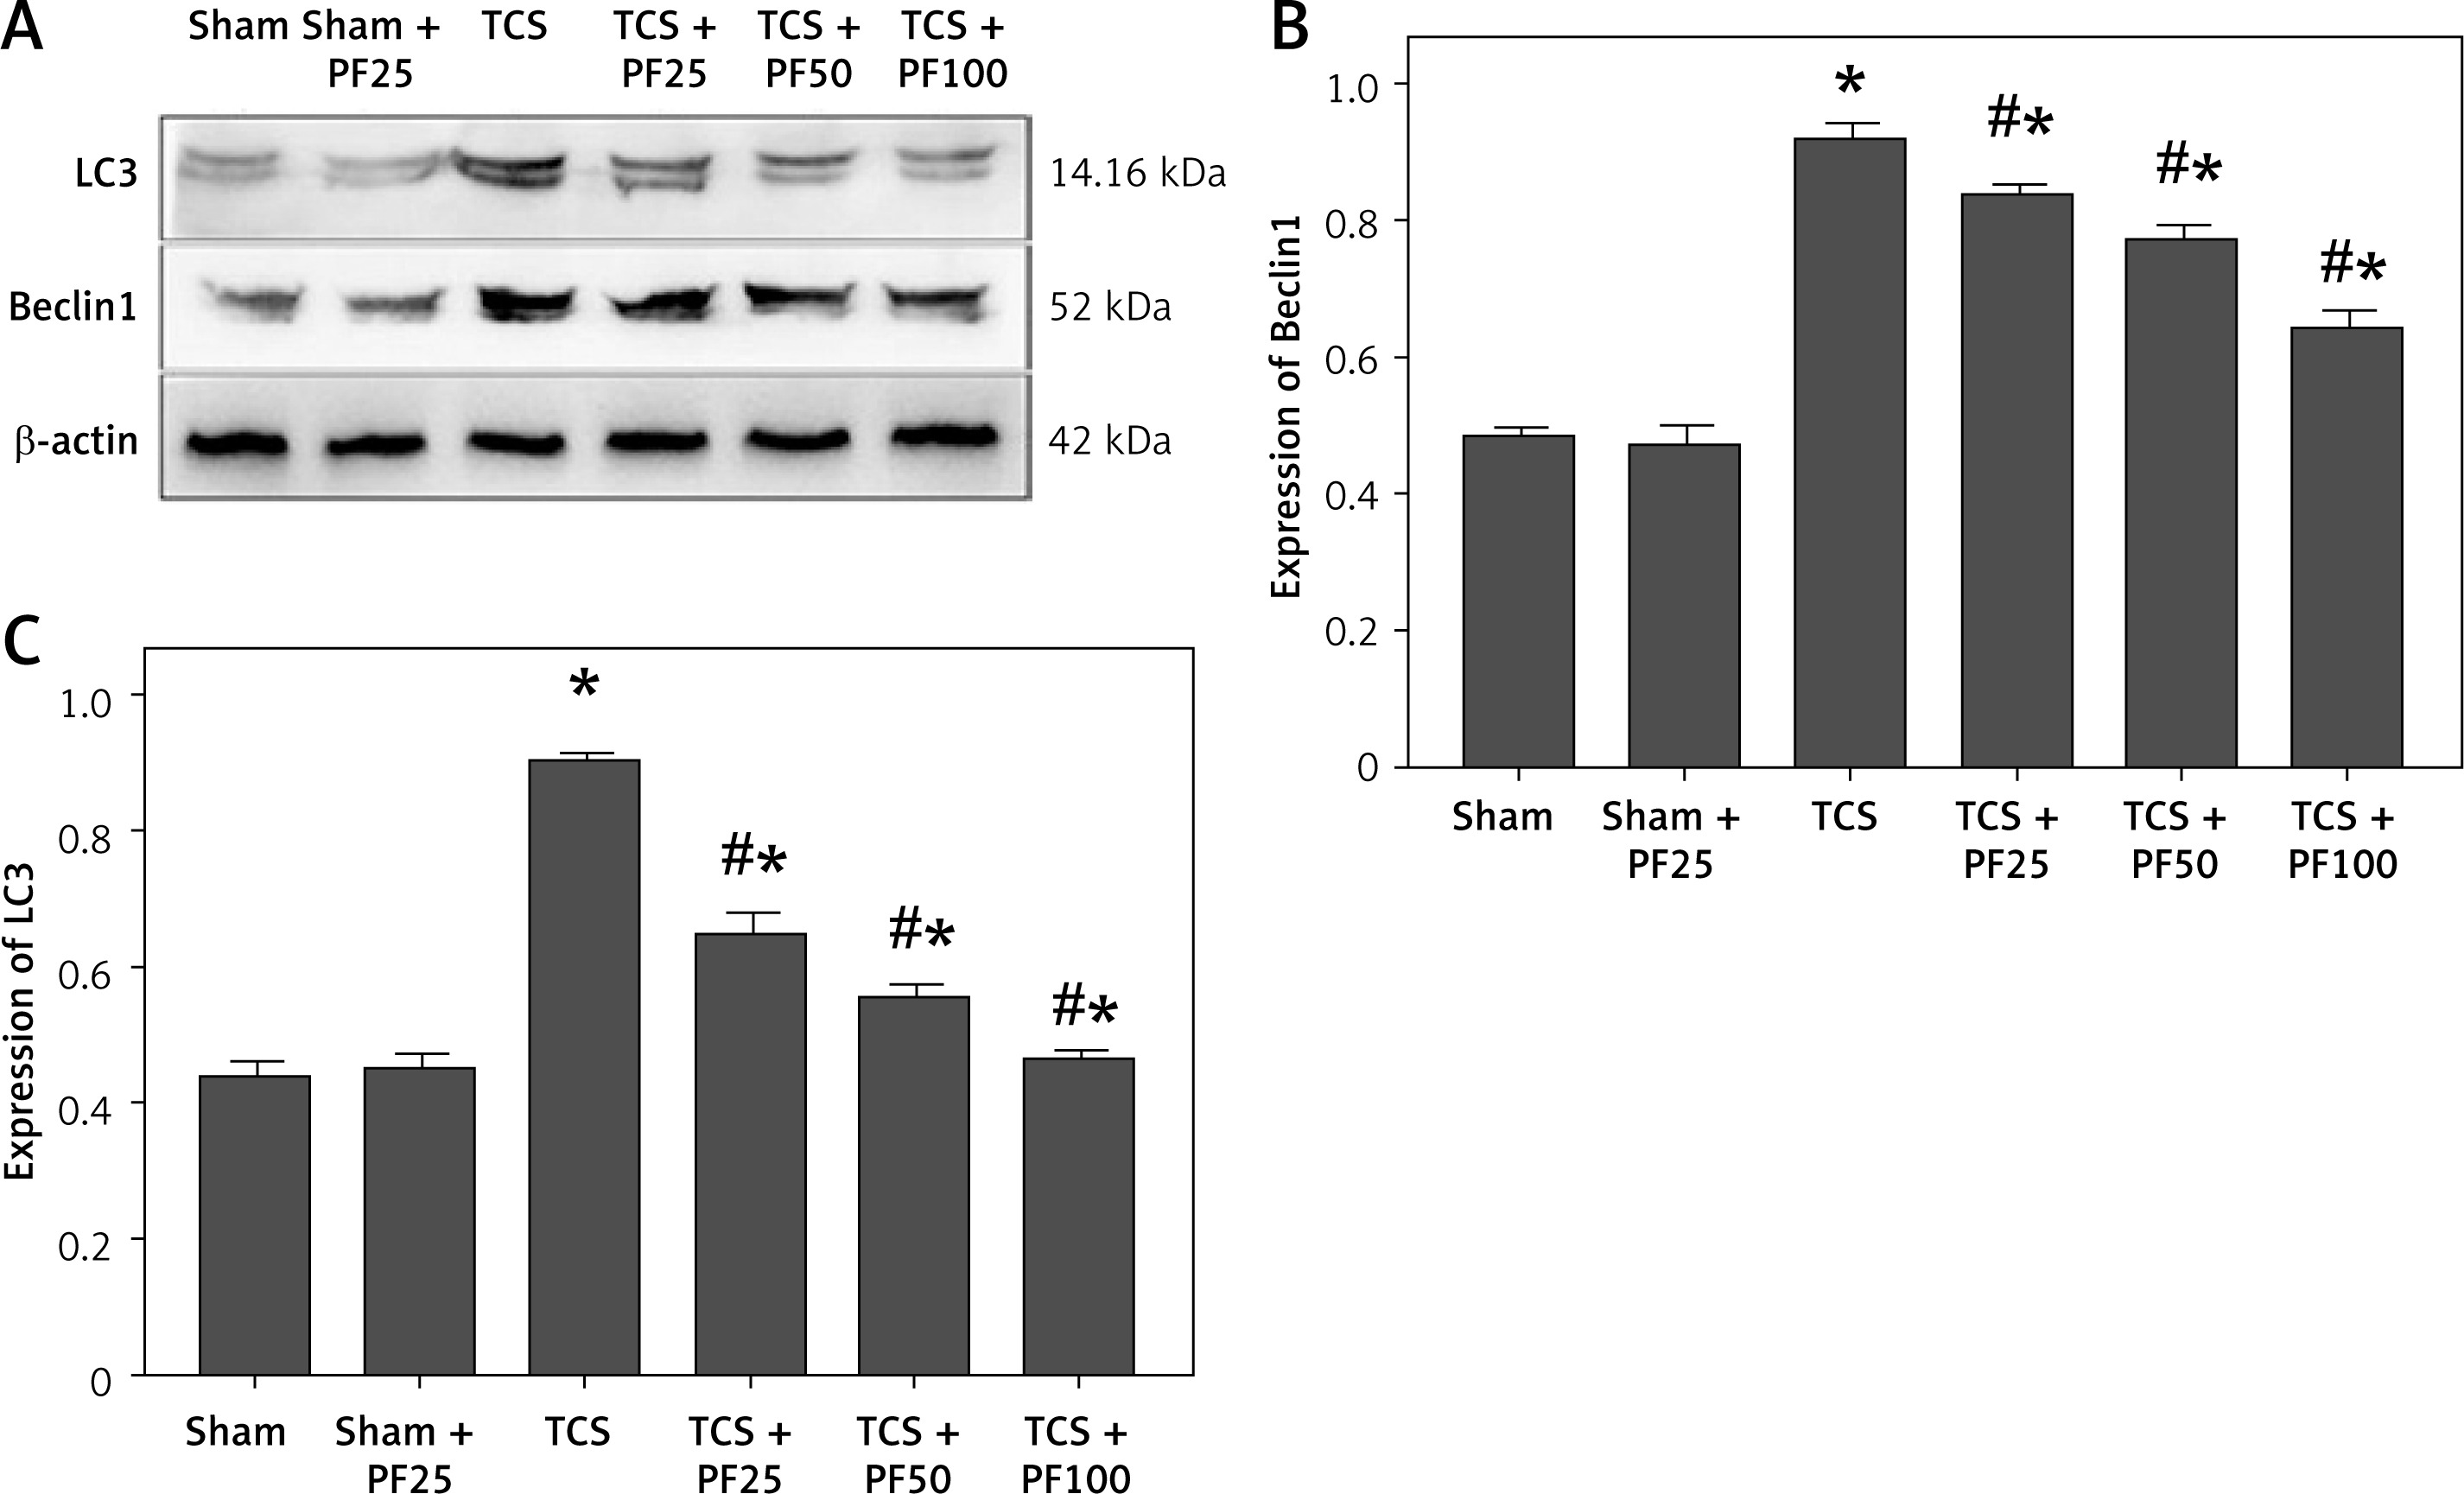
Reagents for protein analysis were bought from Beyotime Biotechnology (Shanghai, China) except where specified. Detection of autophagy-related protein levels in rat spinal cord tissue: Western blotting method was used to detect the protein expression levels of LC3 and Beclin1 (Santa Cruz, China). The spinal cord filum terminale tissue from each group was washed and minced, then 1 ml of RIPA lysis solution was added and ground into homogenate, and then homogenized on ice. It was fully lysed for 10 min, centrifuged for 30 min at 4°C and 12,000 r/min, and then the supernatant was taken and measured with the BCA method. First, the supernatant of equal concentration was taken and an equal volume of loading buffer added, and it was bathed in boiling water for 3 min, and the separation gel was configured at the same time. After completion, electrophoresis was carried out with an electrophoresis instrument. It ended when the bromophenol blue reached the edge of the gel. Then the membrane was transferred for 1.5 h. After washing the membrane, it was blocked for 2 h. Then LC3 and Beclin1 were diluted according to the ratio of 1 : 1000. Diluted primary antibody was added and incubated at 4°C overnight. After washing the membrane, horseradish peroxidase secondary antibody diluted at 1 : 5000 was added and incubated at 37°C for 2 h at room temperature with gentle shaking; after washing the membrane, an ECL fluorescence kit was used to measure and calculate the relative expression levels of LC3 and Beclin1 proteins by calculating the ratio with β-actin.
Immunofluorescence detection
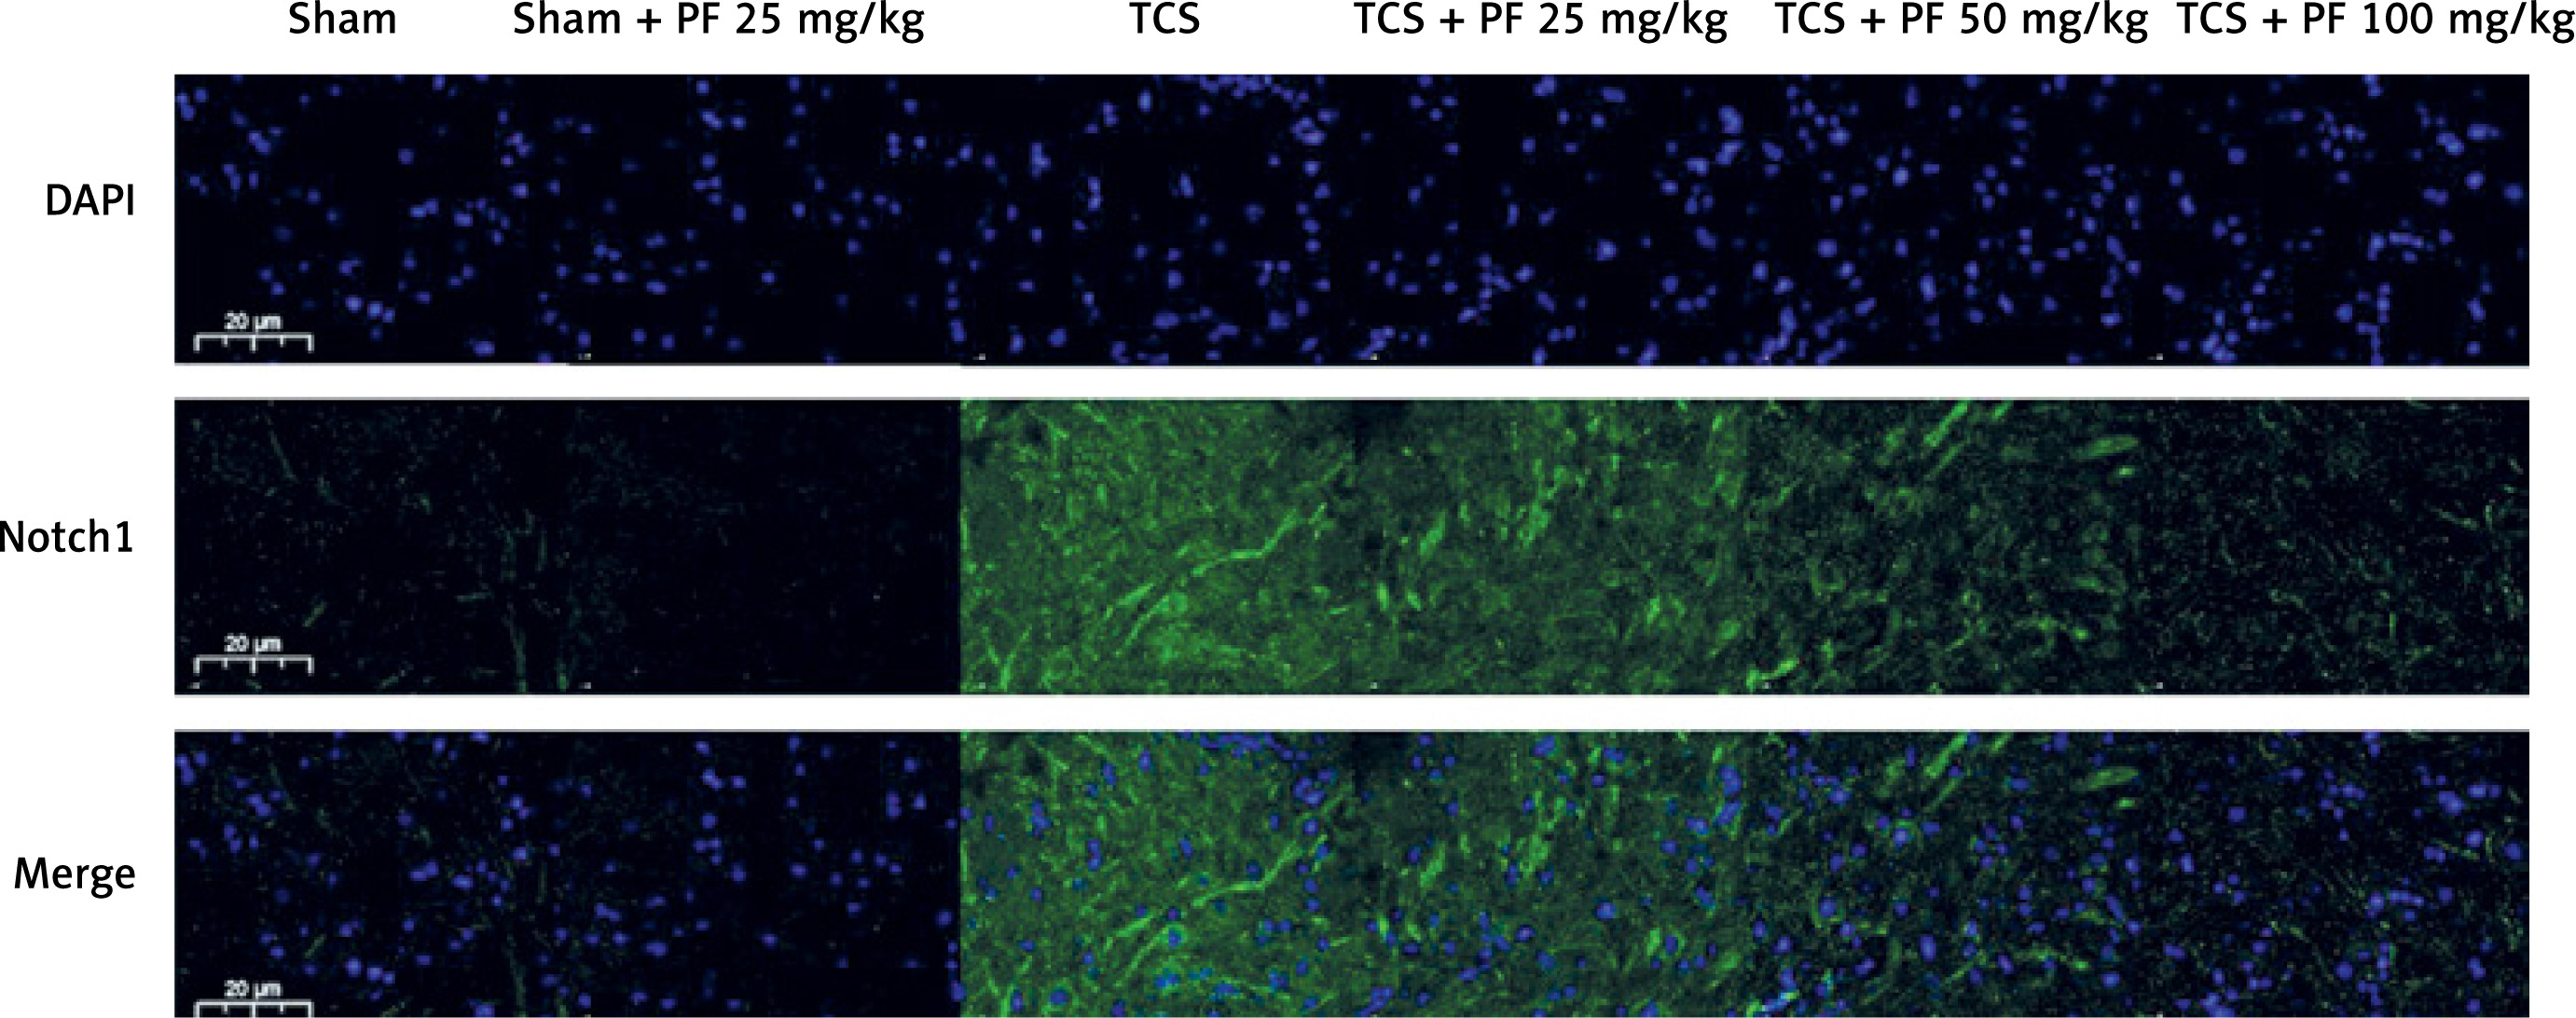
Detection of Notch protein expression levels in rat spinal cord tissue: immunohistochemistry was used. Spinal cord tissue from each group was first taken, dewaxed for 1 h, hydrated with ethanol gradient, washed 3 times with phosphate buffered saline (PBS), and then sodium citrate was added. It was put into a microwave oven for tissue antigen repair. The temperature of the microwave oven was 900°C, the heat was 60 and the repair time was 10 min. After cooling in the greenhouse, it was washed with PBS 3 times. 3% hydrogen peroxide methanol solution was added, it was incubated in the dark for 30 min then washed with PBS 3 times. Then diluted primary antibody (1 : 100) was added, it was incubated at 4°C overnight, washed 3 times with PBS and after warming, biotin-labeled secondary antibody (1 : 500) was added, it was incubated at room temperature for 60 min, washed 3 times with PBS, diluted with the third antibody (1 : 500), added, washed 3 times with PBS, developed with a DAPI kit for 10 min, washed 3 times with tap water, dehydrated with graded ethanol, transparentized with xylene, sealed with center gum and observed under a microscope.
Statistical analysis
All data are expressed as mean ± standard deviation. SPSS25.0 (IBM, USA) was used for data statistical analysis. One-way analysis of variance was used for comparison between two groups in the control group and among multiple groups in the TCS group. P < 0.05 and p < 0.01 were used as the criteria for significant and extremely significant differences respectively.
Results
TCS modeling results
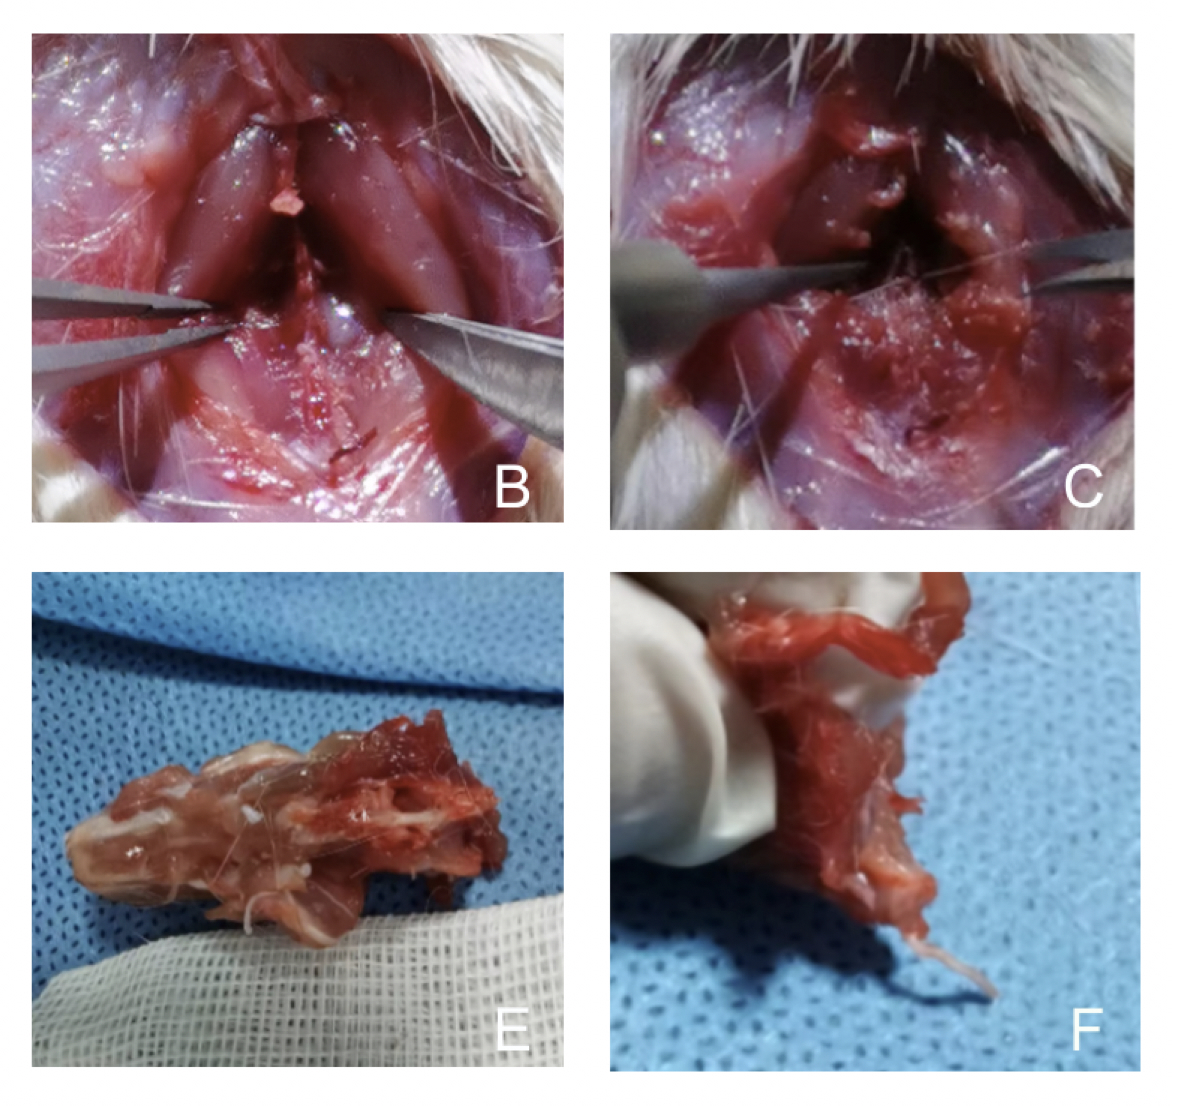
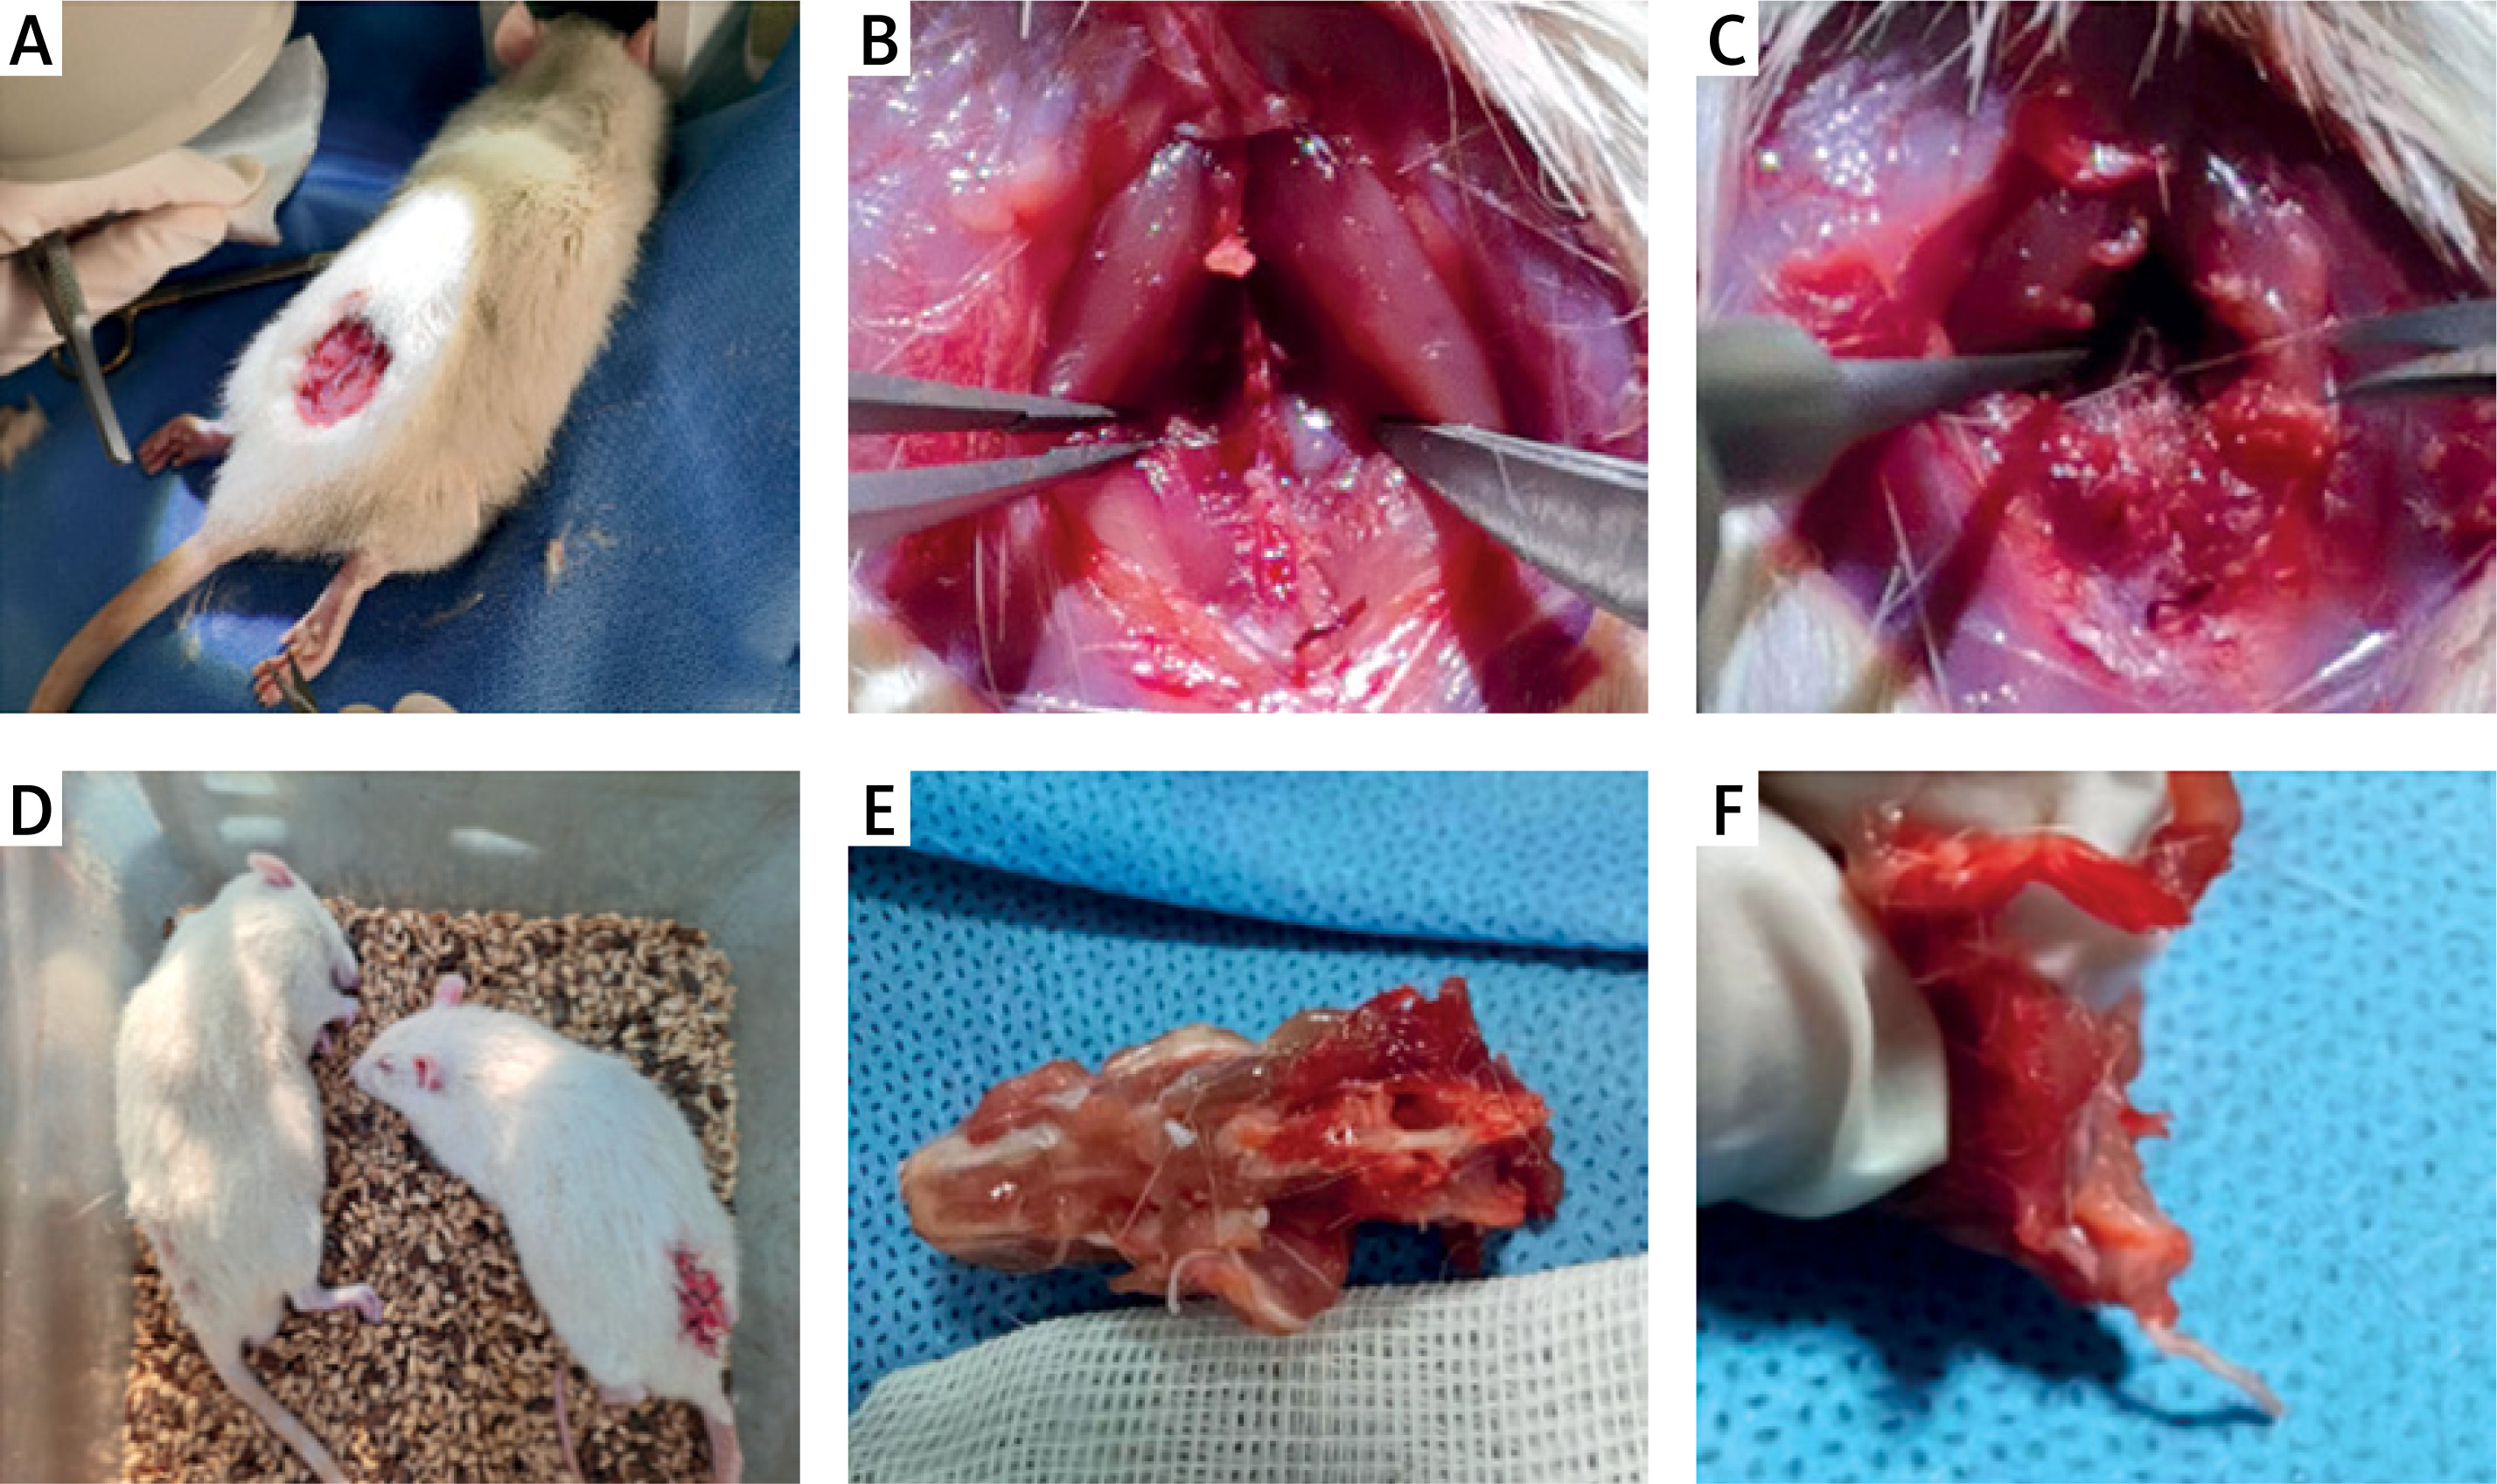
Finally, 48 rats were successfully modeled and randomly divided into four groups (12 rats with TCS + Vehicle, 12 rats with TCS + PF 25 mg/kg, 12 rats with TCS + PF 50 mg/kg, and 12 rats with TCS + PF 100 mg/kg). During the modeling process, no rats died in the last 14 days (Figure 1). After the rats woke up from anesthesia and went through a 1-day pain adaptation period, the spinal cord function was evaluated 24 h later with a Tarlov score of 2 to 4, which belonged to TCS.
Nervous function score of lower limbs in rats after TCS modeling
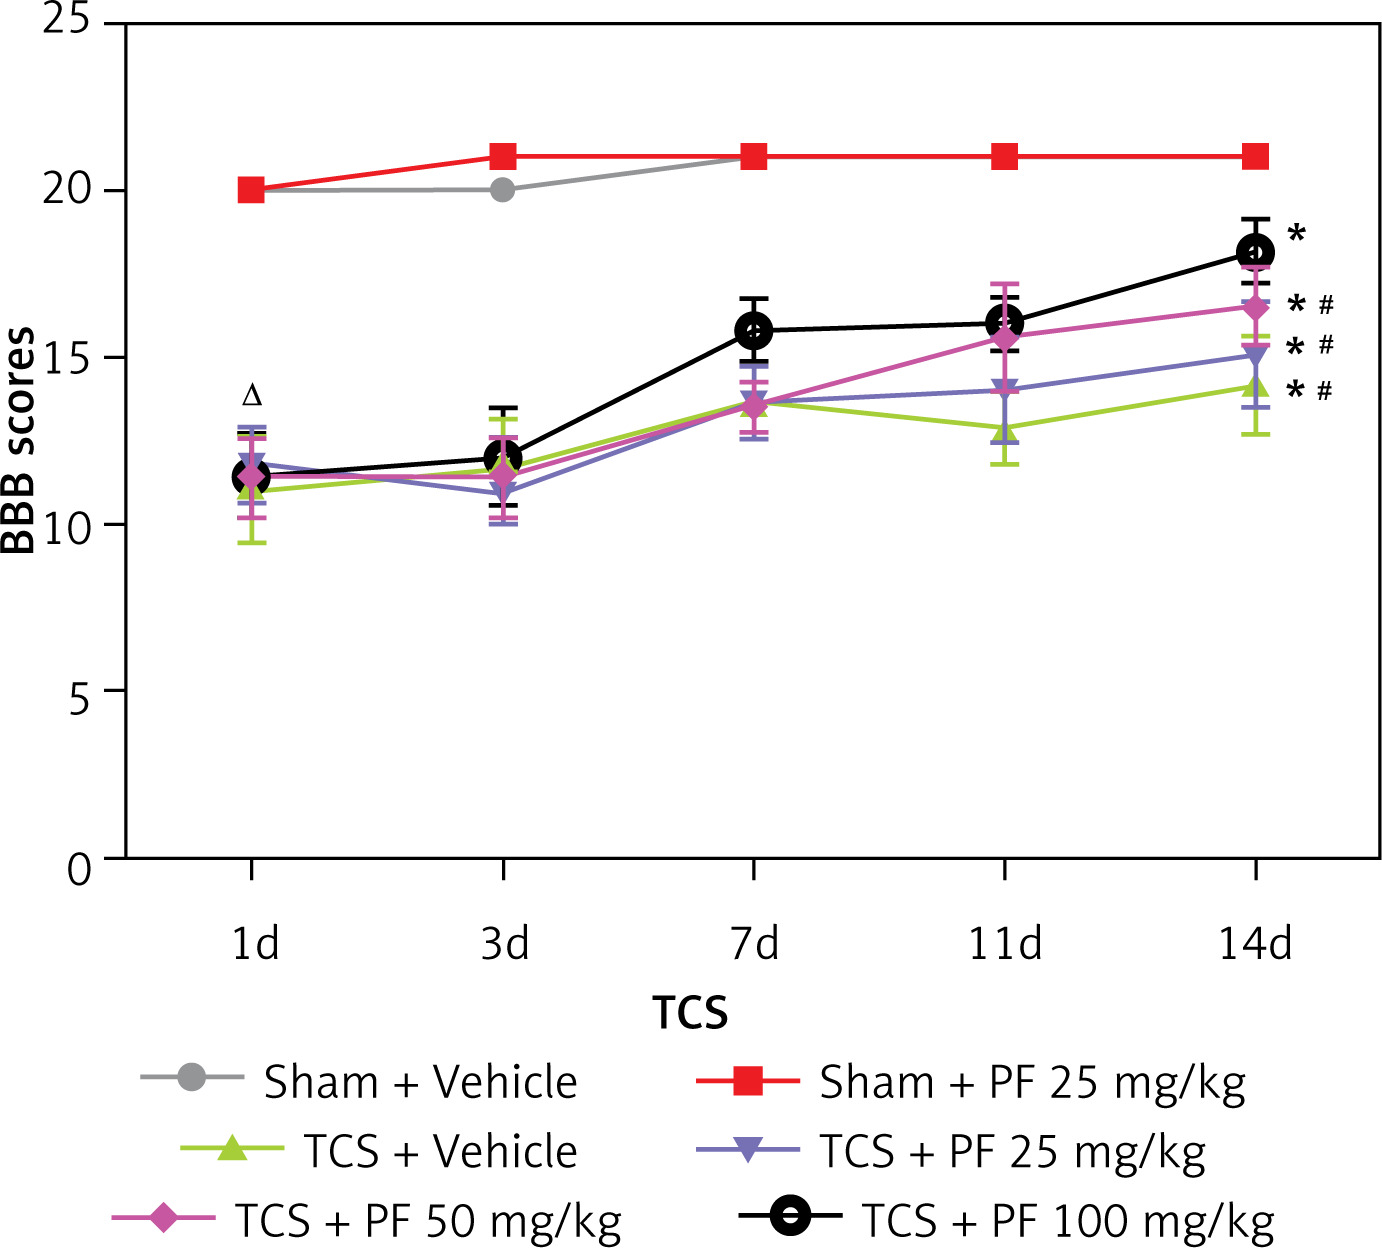
In the control group, there was no significant difference between preoperative and postoperative Tarlov (Table I) and BBB (Table II) scores (p > 0.05); however, in the modeling group, the Tarlov score 1 day after surgery ranged from 2.40 ±0.47 to 2.5 ±0.50, which is lower than the control group (*p < 0.05). The BBB score 1 day after surgery in the modeling group ranged from 11.00 ±1.58 to 11.75 ±1.16, which was lower than that of the control group (*p < 0.05). There was no significant difference between the groups within the modeling group (Δp > 0.05). As the experiment progressed, we observed that the Tarlov and BBB scores of rats in the TCS group gradually recovered (#p < 0.05). In addition, the comparison between the TCS + PF groups of different concentrations in the modeling group showed concentration dependence; that is, the higher the concentration of PF given to the rats, the more obvious was the recovery of their lower limb nerve functions (Figures 2, 3).
Table I
Tarlov score after control group and TCS modeling (
| Time | Sham + Vehicle (n = 6) | Sham + PF 25 mg/kg (n = 6) | TCS + Vehicle (n = 12) | TCS + PF 25 mg/kg (n = 12) | TCS + PF 50 mg/kg (n = 12) | TCS + PF 100 mg/kg (n = 12) |
|---|---|---|---|---|---|---|
| 1d | 5.00 ±0.00 | 5.00 ±0.00 | 2.50 ±0.50∆ | 2.40 ±0.47∆ | 2.40 ±0.47∆ | 2.50 ±0.50∆ |
| 3d | 5.00 ±0.00 | 5.00 ±0.00 | 2.6 ±0.49* | 2.70 ±0.47*# | 2.80 ±0.37*# | 3.20 ±0.69*# |
| 7d | 5.00 ±0.00 | 5.00 ±0.00 | 2.90 ±0.76* | 3.10 ±0.76*# | 3.20 ±0.69*# | 3.50 ±0.87*# |
| 11d | 5.00 ±0.00 | 5.00 ±0.00 | 3.17 ±0.37* | 3.17 ±0.69*# | 3.67 ±1.04*# | 4.25 ±0.72*# |
| 14d | 5.00 ±0.00 | 5.00 ±0.00 | 3.65 ±0.94* | 3.70 ±0.94*# | 3.90 ±1.04*# | 4.33 ±0.75*# |
Table II
BBB scores after control group and TCS modeling (
| Time | Sham + Vehicle (n = 6) | Sham + PF 25 mg/kg (n = 6) | TCS + Vehicle (n = 12) | TCS + PF 25 mg/kg (n = 12) | TCS + PF 50 mg/kg (n = 12) | TCS + PF 100 mg/kg (n = 12) |
|---|---|---|---|---|---|---|
| 1d | 20.00 ±0.00 | 20.00 ±0.00 | 11.00 ±1.58∆ | 11.75 ±1.16∆ | 11.42 ±1.18∆ | 11.42 ±1.26∆ |
| 3d | 20.00 ±0.00 | 21.00 ±0.00 | 11.67 ±1.49* | 10.94 ±0.91*# | 11.42 ±1.19*# | 12.00 ±1.46*# |
| 7d | 21.00 ±0.00 | 21.00 ±0.00 | 13.67 ±1.11* | 13.64 ±1.11*# | 13.50 ±0.76*# | 15.83 ±0.95*# |
| 11d | 21.00 ±0.00 | 21.00 ±0.00 | 12.92 ±1.11* | 14.00 ±1.55*# | 15.60 ±1.61*# | 16.00 ±0.80*# |
| 14d | 21.00 ±0.00 | 21.00 ±0.00 | 14.17 ±1.49* | 15.08 ±1.55*# | 16.50 ±1.18*# | 18.17 ±0.99*# |
Figure 2
Comparison of the mean and variance of Tarlov scores of SD rats in two non-surgical groups and four modeling groups 1, 3, 7, 11, and 14 days after treatment
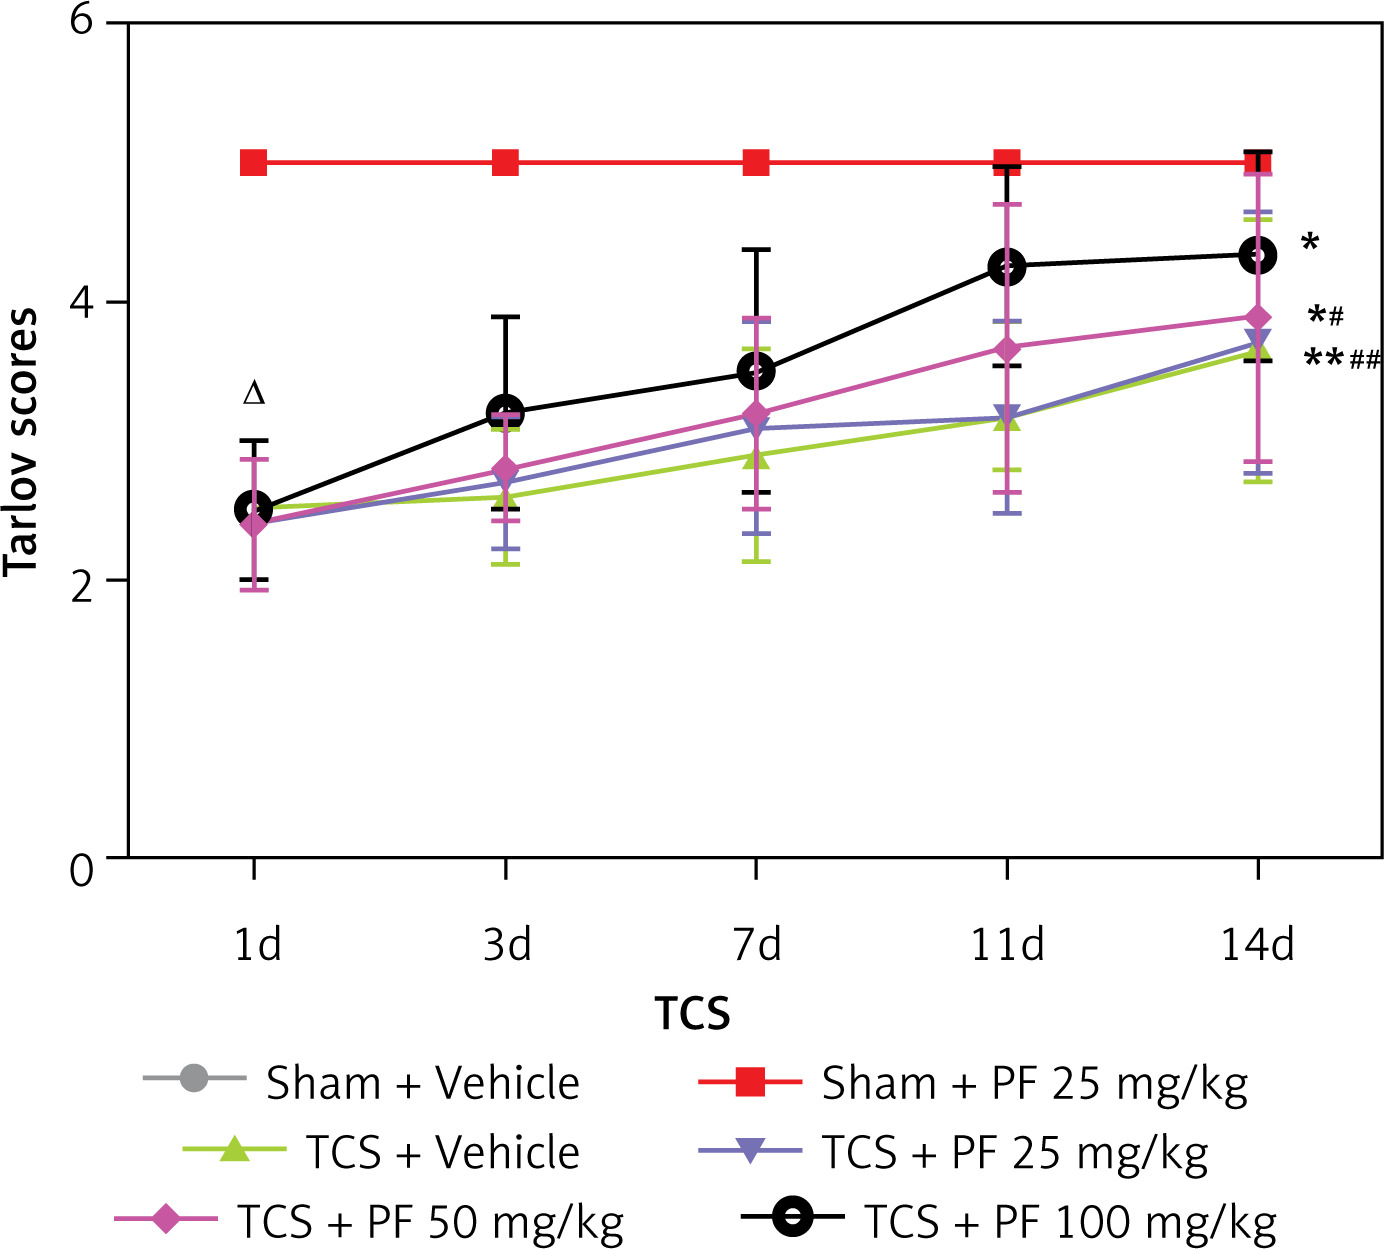
Figure 3
Comparison of the mean and variance of BBB scores of two non-surgical groups and four modeling groups of SD rats 1, 3, 7, 11, and 14 days after treatment
In the supplementary experiment, 3 rats from each group were selected for the righting reflex test and foot failure test on days 1, 3, 7, 11, and 14. Table III shows that there was no significant difference between the preoperative and postoperative righting reflex test of the control group and the righting reflex test of the control group 1 day after surgery (p > 0.05).
Table III
Correction time after surgery in the control group and TCS modeling (
| Time | Sham + Vehicle (n = 3) | Sham + PF 25 mg/kg (n = 3) | TCS + Vehicle (n = 3) | TCS + PF 25 mg/kg (n = 3) | TCS + PF 50 mg/kg (n = 3) | TCS + PF 100 mg/kg (n = 3) |
|---|---|---|---|---|---|---|
| 1d | 1.50 ±0.08 | 1.51 ±0.09 | 11.27 ±0.95∆ | 11.40 ±0.34∆ | 11.32 ±0.87∆ | 11.15 ±0.92∆ |
| 3d | 1.50 ±0.08 | 1.48 ±0.08 | 10.23 ±0.34*# | 9.8 ±0.59*# | 8.03 ±0.22* | 5.80 ±0.71*# |
| 7d | 1.53 ±0.10 | 1.50 ±0.09 | 9.5 ±0.74*# | 8.6 ±0.43*# | 5.00 ±0.44* | 3.12 ±0.62*# |
| 11d | 1.49 ±0.09 | 1.53 ±0.09 | 7.55 ±0.73*# | 6.95 ±0.64*# | 4.32 ±0.43* | 2.18 ±0.43*# |
| 14d | 1.52 ±0.10 | 1.51 ±0.10 | 6.9 ±0.74*# | 6.15 ±0.58*# | 3.95 ±0.33* | 2.03 ±0.26*# |
In the modeling group, the righting reflex test one day after surgery ranged from 11.15 ±0.92 to 11.40 ±0.34, which was higher than that of the control group (p < 0.05). There was no significant difference between the modeling groups on the 1st day after surgery (Δp > 0.05). As the experiment progressed, we observed that the righting reflex test time of the control group rats in the TCS group gradually shortened (p < 0.05). There were statistically significant differences between the four modeling groups and the drug administration group on days 3, 7, 11, and 14 (*p < 0.05). In the modeling group, there was a significant difference between the TCS + Vehicle and TCS + PF groups #p < 0.05. Similarly, in Table IV, in the control group, the rate of rat footstep errors before and after surgery, and after surgery. There was no significant difference in the footstep error rate of rats in the control group on day 1 (p > 0.05), indicating that PF had no effect on the movement sensation of rats in the control group.
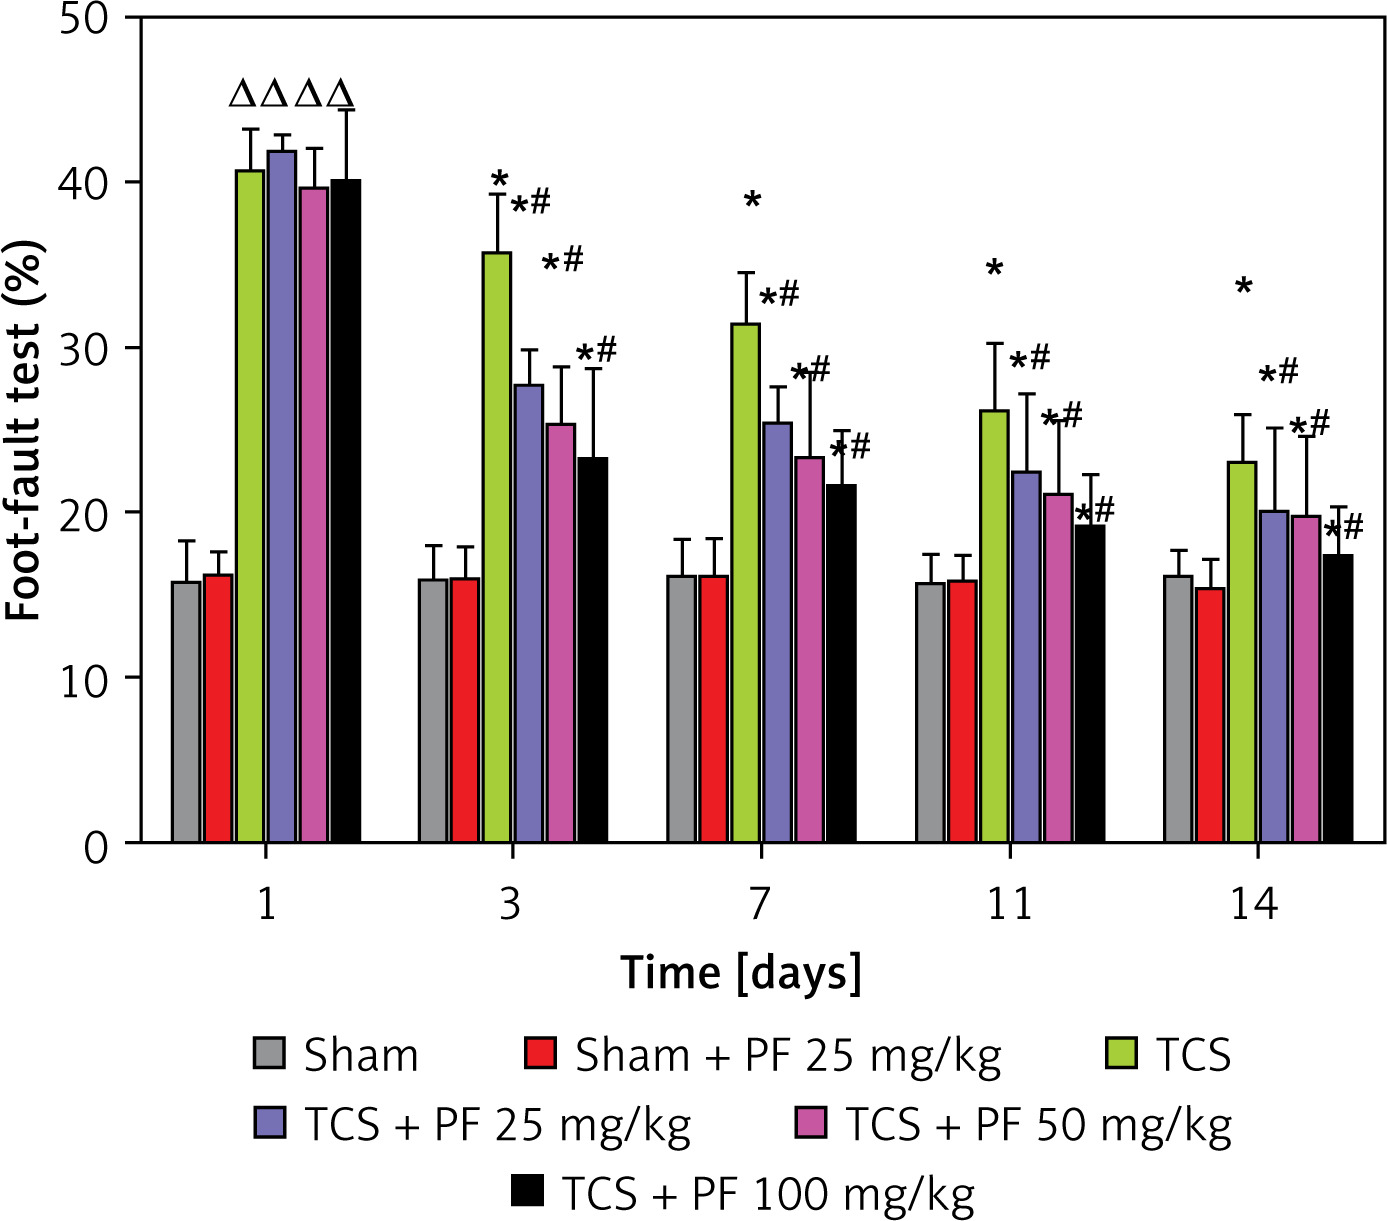
Table IV
Footstep error rates in the control group and after TCS modeling (
| Time | Sham + Vehicle (n = 3) | Sham + PF 25 mg/kg (n = 3) | TCS + Vehicle (n = 3) | TCS + PF 25 mg/kg (n = 3) | TCS + PF 50 mg/kg (n = 3) | TCS + PF 100 mg/kg (n = 3) |
|---|---|---|---|---|---|---|
| 1d | 16.23 ±1.34 | 15.76 ±2.47 | 40.81 ±2.29∆ | 41.96 ±0.87∆ | 39.69 ±2.38∆ | 40.12 ±1.23∆ |
| 3d | 16.04 ±1.78 | 15.97 ±1.95 | 35.76 ±3.51* | 27.80 ±2.00*# | 25.62 ±3.56*# | 23.32 ±5.43*# |
| 7d | 16.19 ±2.23 | 16.19 ±2.15 | 31.49 ±3.11* | 25.55 ±2.06*# | 23.27 ±5.26*# | 21.70 ±3.28*# |
| 11d | 15.90 ±1.46 | 15.74 ±1.75 | 26.14 ±4.01* | 22.45 ±4.75*# | 21.27 ±4.27*# | 19.23 ±3.12*# |
| 14d | 15.34 ±1.76 | 16.12 ±1.53 | 23.12 ±2.85* | 20.20 ±4.69*# | 19.76 ±4.75*# | 17.53 ±2.78*# |
In the modeling group, the righting reflex test one day after surgery ranged from 11.15 ±0.92 to 11.40 ±0.34, which was higher than that of the control group (p < 0.05). This shows that the nerve function of the lower limbs of rats is damaged to a certain extent after TCS modeling. As the experiment progressed, we observed that the rate of footstep errors in the control group of rats in the TCS group gradually decreased (p < 0.05). There were statistically significant differences between the four modeling groups and the drug administration group on days 3, 7, 11, and 14 (*p < 0.05). In the modeling group, there was a significant difference between the three groups of TCS + Vehicle and TCS + PF #p < 0.05 (Figures 4, 5).
Figure 4
Comparison of the mean and variance of the righting time of SD rats in two non-surgical groups and four modeling groups on days 1, 3, 7, 11, and 14 after treatment. Note: Comparison of the righting time (s) of the control group and the modeling group on days 1, 3, 7, 11, and 14: comparison of the modeling group on days 1, 3, 7, 11, and 14 with the control group *p < 0.05; modeling comparison between TCS + Vehicle and TCS + PF administration groups, #p < 0.05
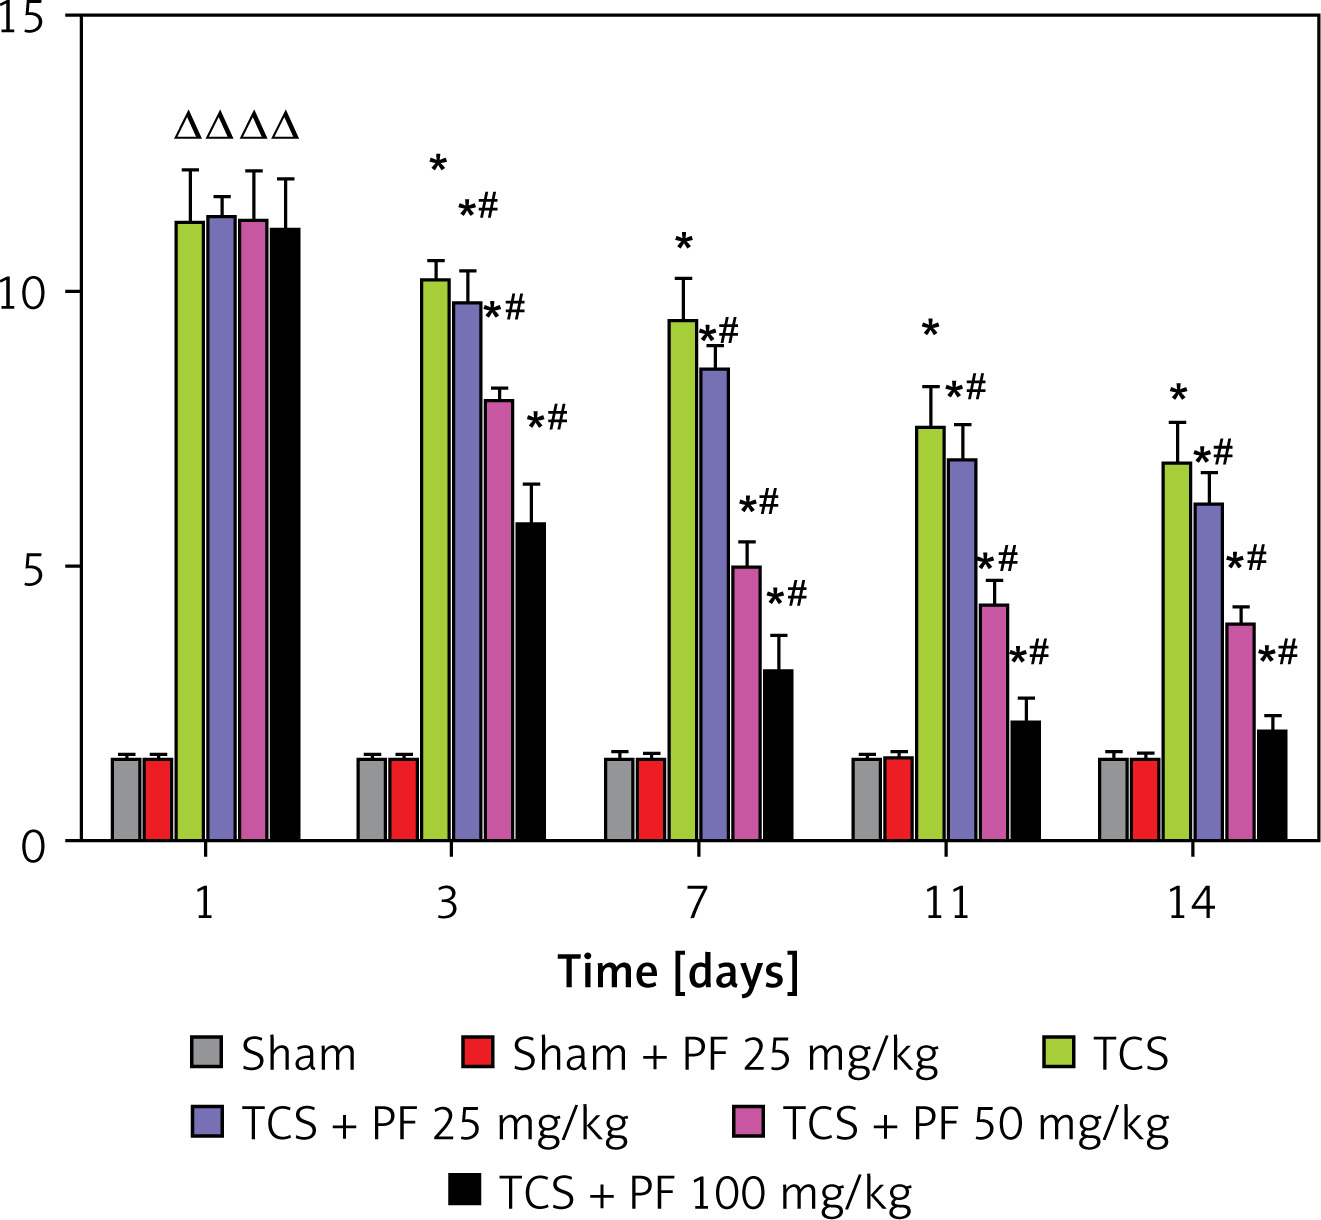
Figure 5
Comparison of the mean and variance of the righting time of SD rats in two non-surgical groups and four modeling groups 1, 3, 7, 11, and 14 days after treatment. Note: Comparison of the righting time (s) of the control group and the modeling group on days 1, 3, 7, 11, and 14: comparison of the modeling group on days 1, 3, 7, 11, and 14 with the control group *p < 0.05; modeling comparison between TCS + Vehicle and TCS + PF administration groups, #p < 0.05
Pathological changes
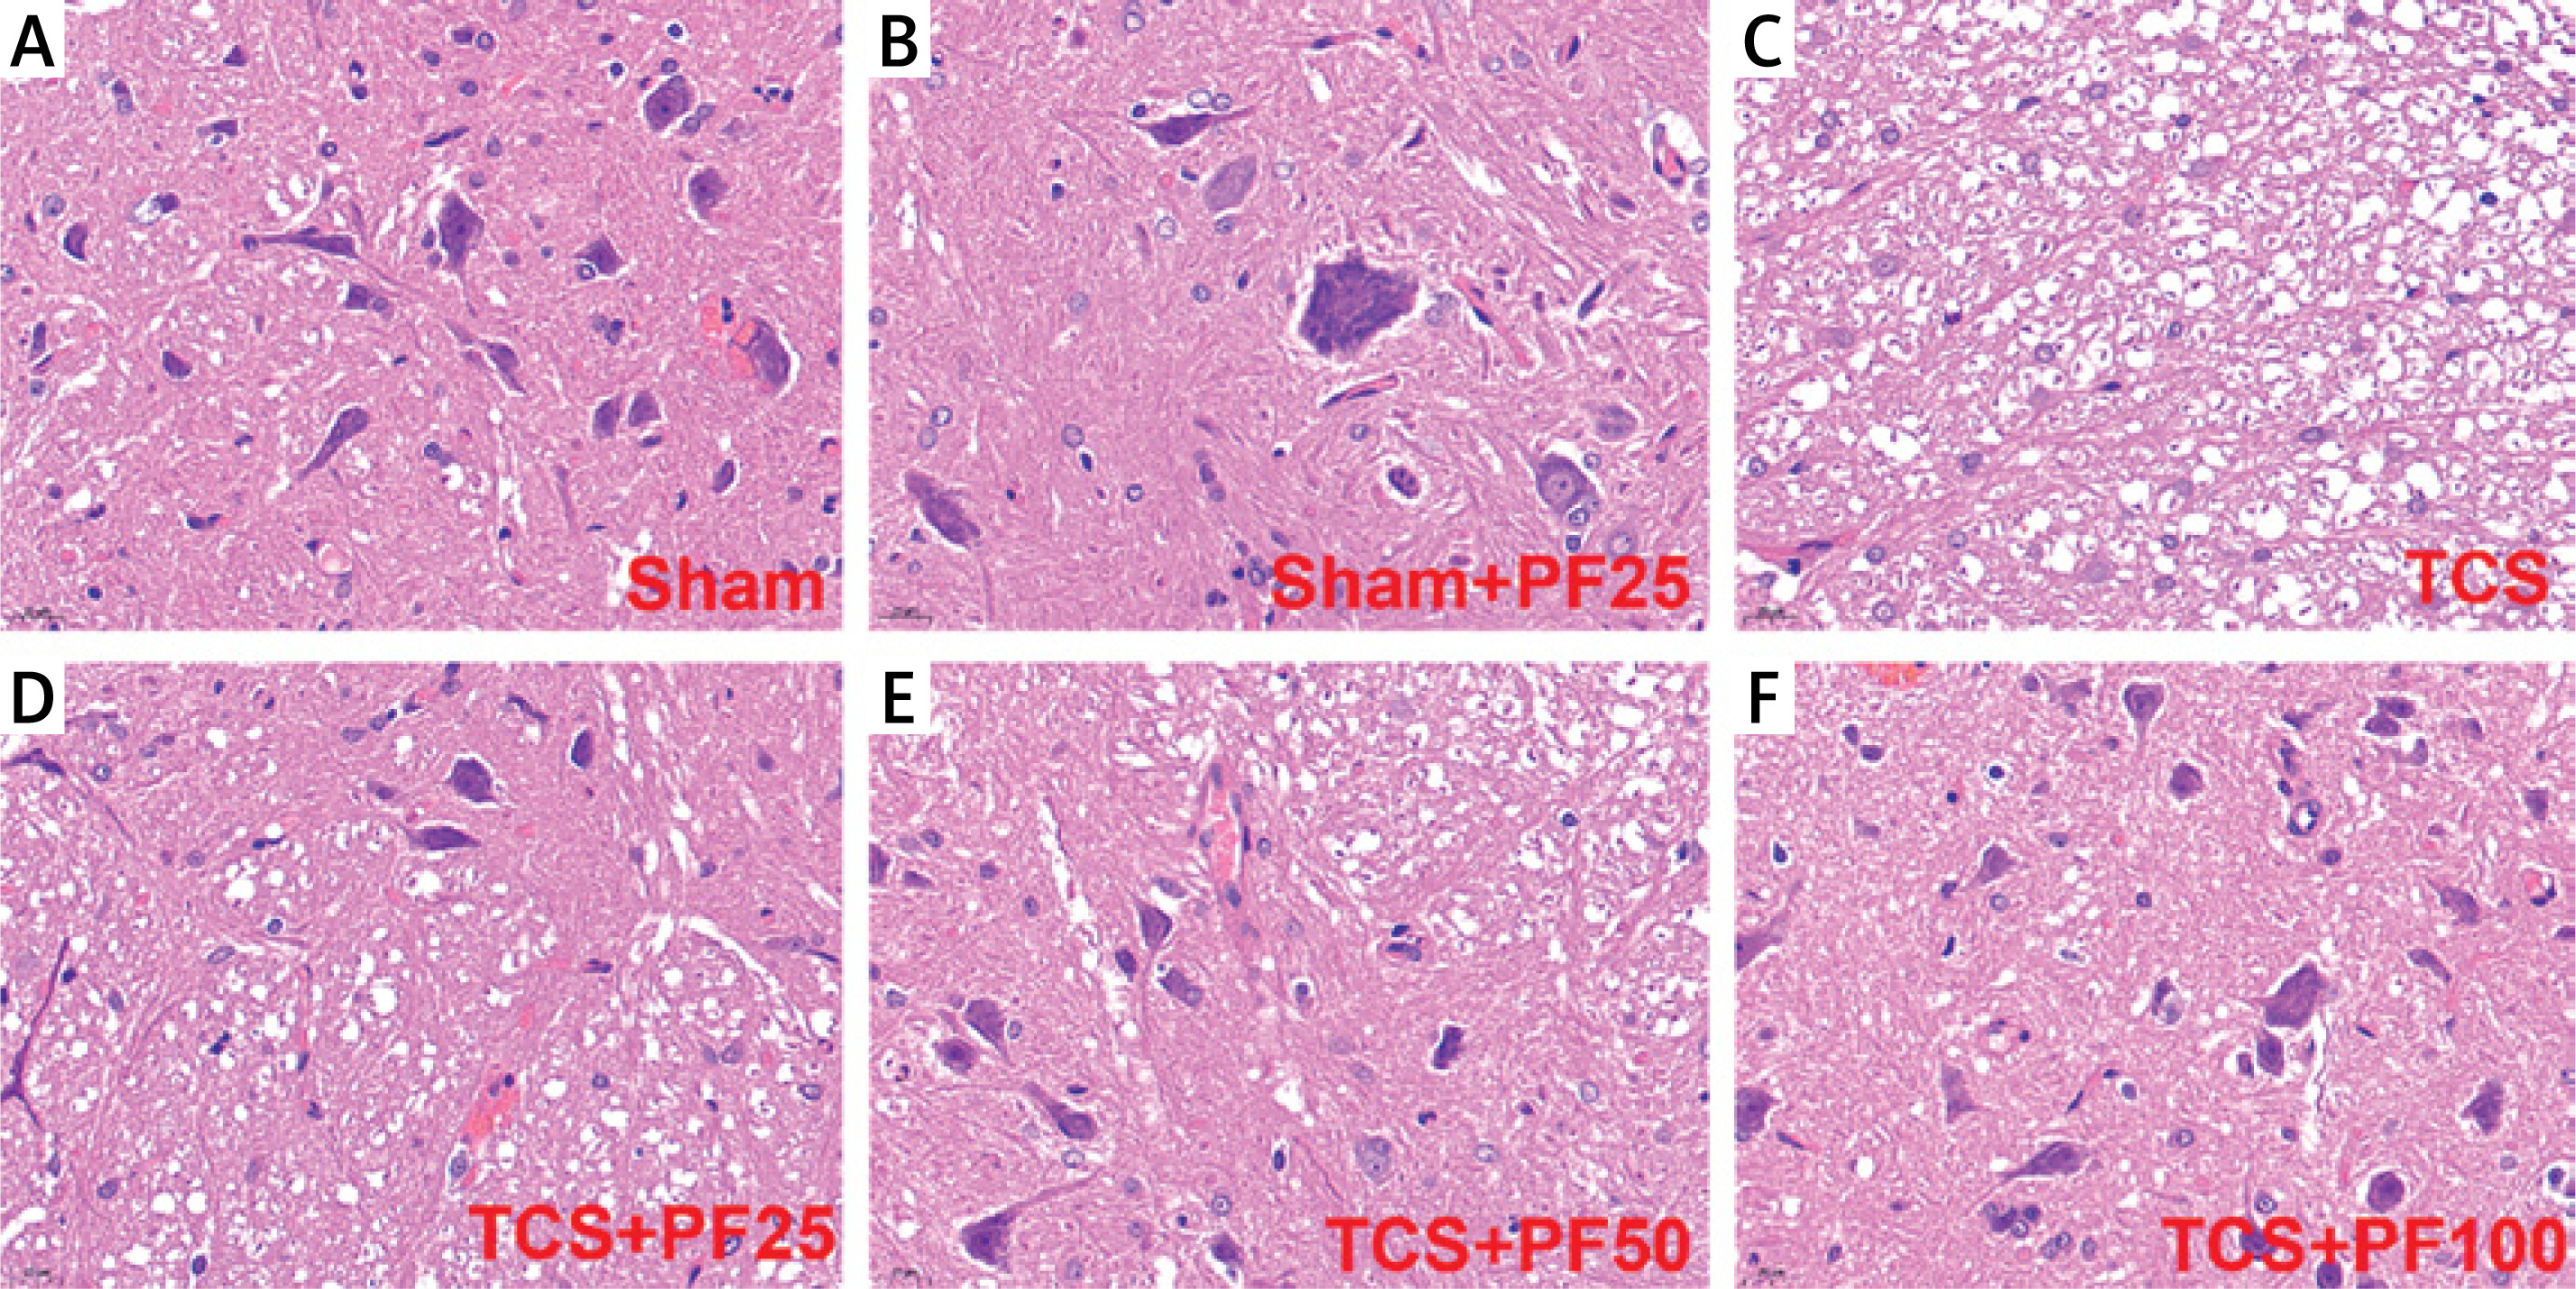
HE staining: In the control group, the structure of spinal cord nerve cells is intact, the morphology of the cell nuclei is normal and complete, the nucleoli are clear and neatly arranged, and there is no edema in the spaces around the cells; in the TCS group and TCS + PF treatment group, the spinal cord tissue and cortical structure are basically intact; the cell arrangement is slightly disordered, the nucleolar structure is partially intact, and fragmented cell cytoplasm can be seen (Figure 6).
Figure 6
HE staining of spinal cord tissue (*400×): A – the control group, B – the TCS group, C – the TCS + PF treatment group, D – the control group, E – the TCS group, F – the TCS + PF treatment group
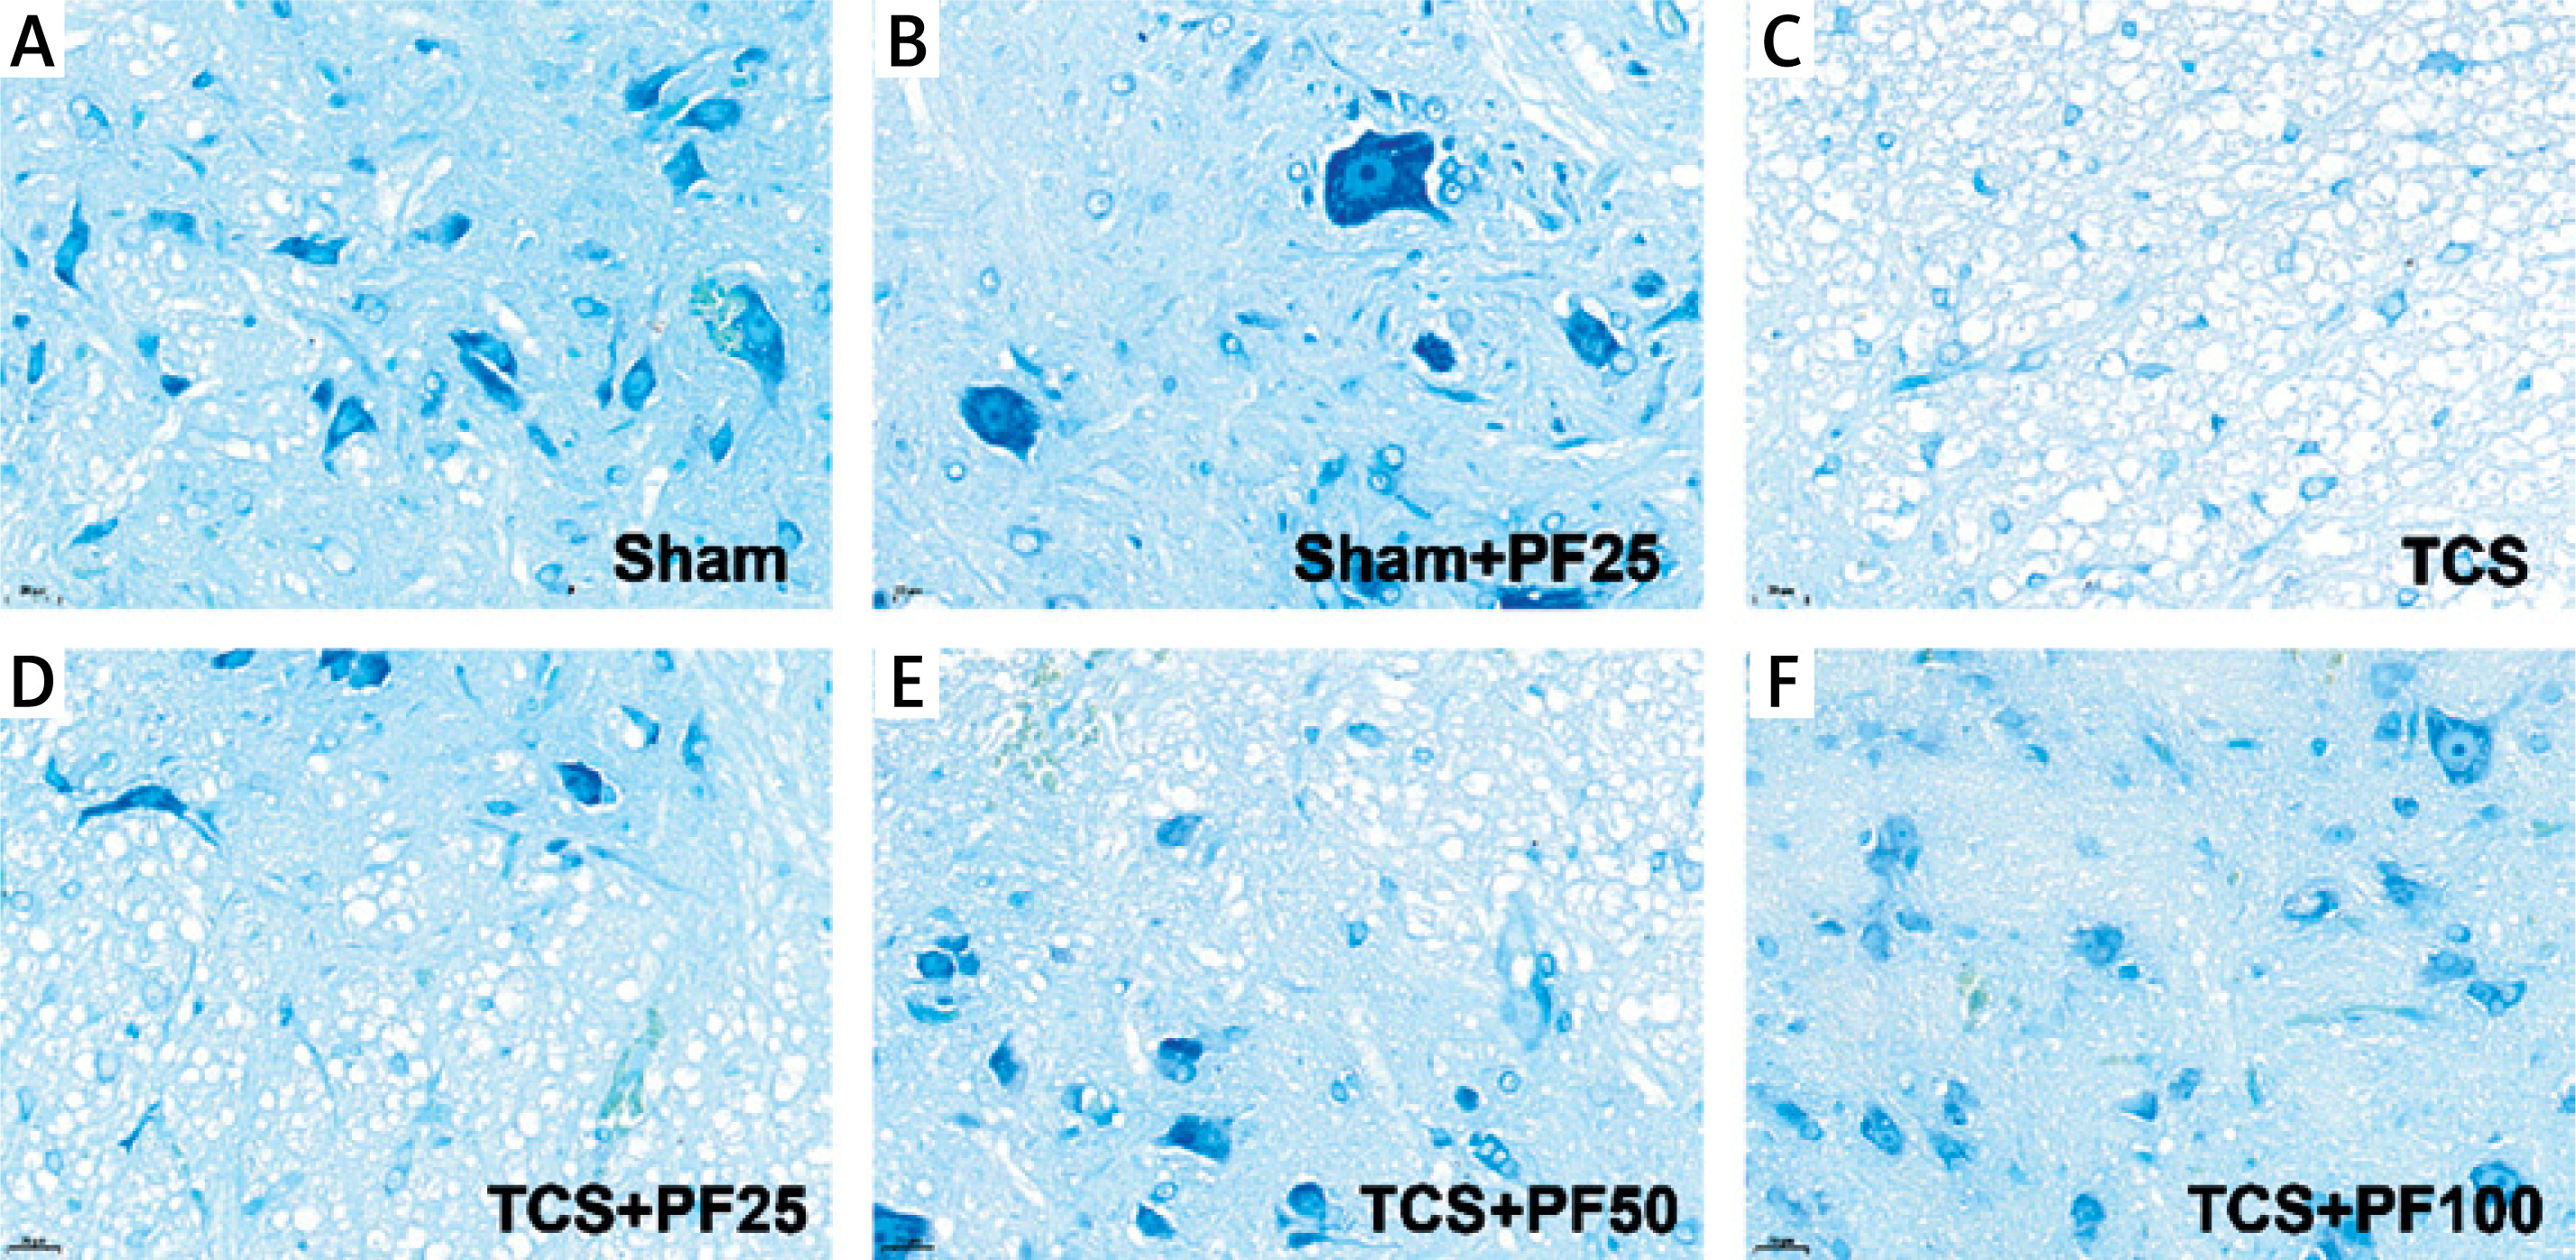
Nissle staining: Nissl bodies were larger and more numerous in the control group. Nissl bodies were smaller in size and fewer in number in the TCS group and TCS + PF treatment group. Mild damage to spinal cord nerve cells was found in the control group and TCS + PF treatment group, but there was little pathological difference between the modeling groups (Figure 7).
Western blot results
According to the relative expression content of LC3 (total amount of LC3I and LC3II) and Beclin1 protein, there was no significant difference between the control group and the intra-group comparison of the TCS modeling group. Compared with the TCS group, the TCS + PF 25 mg/kg group, TCS + PF 50 mg/kg group, and TCS + PF 100 mg/kg group, the relative expression levels of LC3 and Beclin1 proteins decreased and were significantly different (#p < 0.05). Compared with the control group, the TCS group, TCS + PF 25 mg/kg group, TCS + PF 50 mg/kg group, and TCS + PF 100 mg/kg group, the average protein expression content increased and there was a significant difference (*p < 0.05). Comparison between TCS treatment groups found that with the increase of PF dose, the protein expression of LC3 and Beclin1 in rat spinal cord tissue gradually decreased (Table V–VII, Figure 8).
Table V
Grayscale reference values of LC3, Beclin1 and β-actin protein expression in tissue Western blot
Table VI
Expression ratio of LC3, Beclin1 and β-actin proteins in WB (%)
Table VII
LC3, Beclin1, β-actin protein expression ratio (
Immunofluorescence results
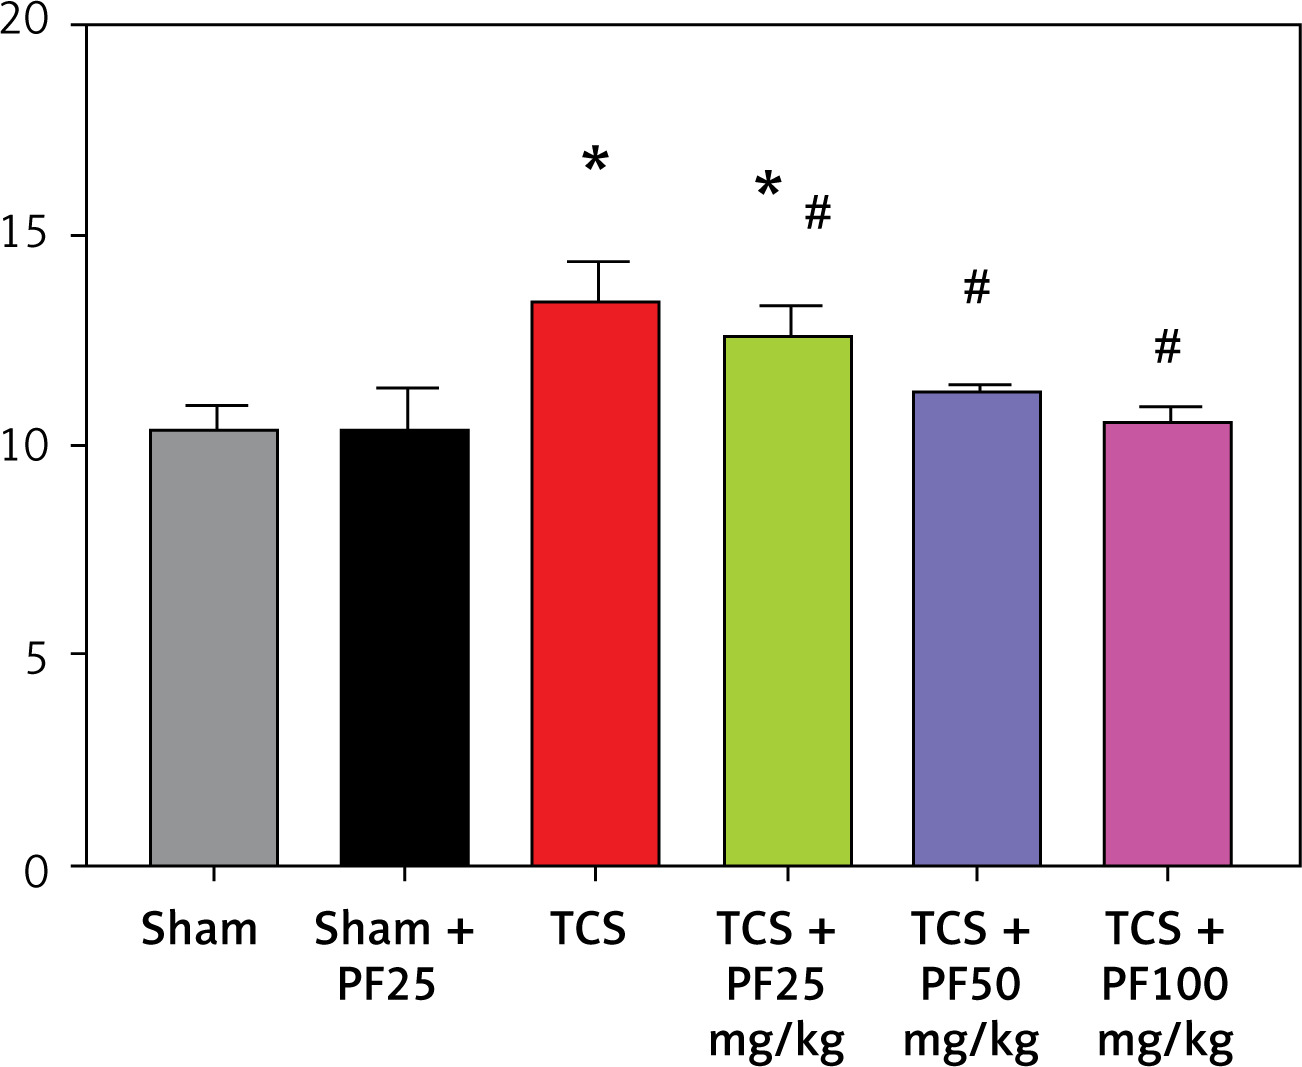
Compared with the TCS group, the apoptosis in the TCS + PF 25 mg/kg group, TCS + PF 50 mg/kg group, and TCS + PF 100 mg/kg group showed a decreasing trend and significant difference (#p < 0.05). Compared with the control group, both the TCS group and TCS + PF 25 mg/kg group were statistically significantly different (*p < 0.05). In the TCS modeling group, the nuclei of the cells were fragmented. The crack was incomplete, and the expression of Notch protein around the spinal cord tissue of rats in the TCS model groups (TCS group, TCS + PF 25 mg/kg group, TCS + PF 50 mg/kg group, TCS + PF 100 mg/kg group) increased significantly. In the Sham + PF 25 mg/kg group, the expression of Notch protein around the spinal cord cells was not obvious. However, when compared with the TCS model groups, the expression of Notch in the TCS + Vehicle group was mostly obvious. As the concentration of PF increased, the expression of Notch protein around the nucleus of spinal cord cells in the model group significantly decreased, indicating that PF had a significant inhibitory effect on Notch in the spinal cord tissue of TCS rats, and the higher the concentration of PF, the greater was the inhibitory effect on Notch protein (Figures 9, 10).
Discussion
Pathophysiology of tethered cord syndrome
Tethered cord syndrome (TCS) is a complex condition characterized by a constellation of neurological, urological, musculoskeletal, and gastrointestinal symptoms, with an incidence estimated at 0.25 per 1,000 individuals [12]. TCS onset is often triggered by a threshold of mechanical tension or by the cumulative effects of repetitive, transient strains [1]. Progressively, spinal cord blood flow diminishes due to ischemic injury, and the dysfunction of neuronal mitochondrial terminal oxidase ensues [13], culminating in disruptions to mitochondrial oxidative phosphorylation and electrophysiological homeostasis [14, 15]. According to Yamada’s research, a malfunction in the electron transport chain of neuronal mitochondrial terminal oxidase impairs efficient adenosine triphosphate (ATP) generation, which may contribute to cellular dysfunction in both human and experimental TCS models [16]. Hence, the development of a rat model of spinal cord tethering is anticipated to mimic chronic spinal cord traction injuries [17–19].
Pharmacological properties of paeoniflorin
Paeoniflorin (PF) is a bioactive compound extracted from the traditional Chinese herb Paeonia lactiflora. Its pharmacological attributes include: 1) anti-inflammatory activity: PF exhibits potent anti-inflammatory properties, inhibiting the production of inflammatory mediators such as TNF-α, IL-1β, and IL-6 [7]; 2) antioxidant properties: PF demonstrates significant antioxidant activity, scavenging free radicals, and attenuating oxidative stress-induced cellular damage [8]; 3) anti-spasmodic effects: PF can mitigate epileptic seizures by modulating neurotransmitter release and ion channel activity, thus dampening aberrant neural excitability [6]; 4) analgesic effects: PF shows potential in treating inflammatory pain by reducing the production of inflammatory mediators and neurotransmitter release [9]; 5) immunomodulatory actions: PF suppresses immune cell activation and inflammatory factor production, thereby modulating immune response balance and reducing immune-mediated inflammation and tissue damage [7].
Analysis of Western blot results
Our analysis revealed that, compared to the control group, the expression levels of autophagy-related proteins LC3 and Beclin1 were significantly elevated in the spinal cord tissue of SD rats with induced TCS (p < 0.05). This suggests successful TCS modeling and a resultant increase in autophagy protein markers [20]. Treatment with various doses of PF resulted in a dose-dependent decrease in LC3 and Beclin1 expression (p < 0.05), indicating that PF can mitigate autophagy-related protein upregulation and alleviate inflammation in spinal cord tissue [21, 22].
Immunofluorescence Notch protein expression analysis
Preliminary experiments indicated that PF’s therapeutic effects in TCS might involve inhibition of the Notch signaling pathway. Following TCS induction, Notch1 protein expression was significantly elevated in rat spinal cord tissue. PF treatment led to a concentration-dependent decrease in Notch protein expression. Given that Notch signaling can impede neurological repair and exacerbate post-injury symptoms, PF’s ability to reduce Notch protein expression suggests its potential role in inhibiting neuronal apoptosis and promoting neurological function recovery by modulating this pathway.
In conclusion, this study successfully established a rat model of spinal cord tethering and investigated the intervention effects of paeoniflorin. The results indicate that PF can inhibit neuronal autophagy-related proteins and apoptosis in spinal cord tissue, suggesting its neuroprotective role. Rat models demonstrated improved lower limb neurological function, supporting PF’s efficacy in ameliorating symptoms of tethered spinal cord syndrome and highlighting the Notch pathway as a theoretical basis for the application of traditional Chinese medicine constituents in TCS treatment.