Introduction
Diabetes mellitus is a chronic, progressive, metabolic disease characterized by hyperglycemia [1]. Patients with impaired glucose tolerance (IGT) have significantly increased incidence of diabetes [2] and cardiovascular disease [3]. Measurement of fasting plasma glucose (FPG) and postprandial plasma glucose plays an important role in diagnosis and control of diabetes [4]. However, fasting hyperglycemia is not sensitive enough for the early diagnosis of type 2 diabetes [5]. In clinical practice, a 75-gram oral glucose tolerance test (OGTT) has been used as the gold standard test for diagnosis of diabetes. Plasma glucose concentration is measured 2 h after a 75 g oral glucose load [6]. IGT was identified by OGTT when the 2-h PG fell between 140 and 199 mg/dl, accompanied by impaired fasting glucose or not [7]. Diabetes is diagnosed if the FPG ≥ 126 mg/dl and 2-h PG ≥ 200 mg/dl [6].
Routinely, the OGTT is administered only at two measurement points, but currently the American Diabetes Association allows measurement at more points [8]. After a standard glucose load, blood samples are collected at 0, 15, 30, 60 and 120 min to measure the glucose and insulin concentrations. Compared with FPG, the OGTT has a better sensitivity to diagnose diabetes [9], because it is hard to infer it from plasma glucose measured at a single time point [10]. Furthermore, several studies indicated the shape of the glucose curve during the OGTT associated with insulin resistance and β-cell dysfunction [11, 12]. In subjects with IGT, the shape of the OGTT curve has a more gradual initial increase in plasma glucose concentration, which continues to rise after 60 min and at 2 h remains markedly increased [13]. The area under the curve (AUC) is the geometric mean value to quantify the total increased blood glucose during an OGTT [14]. A clinical study indicated that the AUC increased significantly in the IGT compared with the normal glucose tolerant subjects [15]. In animal research, the OGTT is frequently used to assess the degree of diabetes and also to test drugs on the body’s ability to process glucose [16]. Glucose tolerance is also considerably changed in mutant mice compared with their wild-type littermates [17].
On the other hand, the incremental area under curve (iAUC) has been developed to minimize the variations in fasting plasma glucose or baseline blood glucose. In the calculations of iAUC, the baseline measures are subtracted from all subsequent readings before the AUC is calculated and is referred to as the ‘incremental area’ [18]. The iAUC can been used to calculate the glycemic index in nutrition [19]. However, the sensitivity and specificity of the iAUC are still debated [20], either in the mathematical view [21] or from the clinical report [22], because by the iAUC method it is possible to obtain a negative area, and a negative value for area logically contradicts the concept of area in the physical sense [21].
A recent report has demonstrated that iAUC seems more suitable for the patients receiving acute treatment [23], but direct evidence to support this view is still insufficient. Therefore, the present study was designed to investigate the relationship between the total AUC (tAUC) and iAUC during the OGTT and the metabolic effects of various antidiabetic agents among different diabetic models. The anti-diabetic agents were metformin, dapagliflozin and insulin. The diabetic models were the streptozotocin (STZ)-induced type 1 diabetic model, the high-fat diet (HFD)-fed and STZ-treated rat model, STZ-nicotinamide-induced rat model, and the low dose STZ-induced rat model. This study will provide some new insight into the pathogenesis of diabetes mellitus and the role of antidiabetic agents in management of diabetes.
Material and methods
Materials
Insulin injection was commercially obtained (Actrapid, Novo Nordisk, Bagsvaerd, Denmark). Dapagliflozin was also purchased (AstraZeneca, Mölndal, Sweden). All other chemicals and reagents used were of analytical grade and were obtained from Sigma Chemical Company (St Louis, Mo., USA).
Experimental animals
Male Sprague-Dawley (SD) rats weighing 260 to 290 g were purchased from the National Laboratory Animal Center (Taipei, Taiwan). They were housed individually in plastic cages under standard laboratory conditions. Animals under anesthesia with sodium pentobarbital (35 mg/kg, i.p.) were used in all experiments to minimize suffering. The experimental protocols were approved by the Institutional Animal Ethics Committee (2017-047) of China Medical University. All experiments conformed to the Guide for the Care and Use of Laboratory Animals as well as the guidelines of the Animal Welfare Act.
Induction of type 1 diabetes model (T1DM) by injection of STZ
To investigate the changes of AUC during the OGTT after the antidiabetic drug treatment, the STZ-induced T1DM model was constructed. The rats were fasted overnight and then received an injection of STZ (60 mg/kg, i.p.) in citrate buffered saline (pH 4.5) [24]. One week later, the levels of glucose and insulin were measured in blood samples collected from the tail vein. Hyperglycemia and hypoinsulinemia were measured to identify the success of this model [24], and no mortality was observed during this induction.
Induction of type 2 diabetes model (T2DM) by HFD and low-dose STZ treatment
The HFD and STZ-induced T2DM rat model was used to evaluate whether the anti-hyperglycemic effects of drugs were dependent of the OGTT. The rats were fed with normal chow diet or HFD for a period of 4 weeks. The HFD provided 5.1 kcal/g, with 61.6% of calories from fat, 18.1% from protein and 20.3% from carbohydrate (TestDiet, Richmond, IN, USA). After 4 weeks of dietary manipulation, the rats were injected with a low dose of STZ (35 mg/kg, i.p.) [25]. One week after STZ injection, rats with diabetes showing hyperglycemia (blood glucose over 300 mg/dl) were used for the experiment. A total of 85% of the rats treated with HFD/STZ achieved this cut-off glycemic value. Diabetic rats were allowed to feed on the HFD continuously during the study.
Induction of T2DM by injection of STZ and nicotinamide
The STZ-nicotinamide model is based on protective effects of nicotinamide against cytotoxic effects of STZ. It is a good model for studies of diabetic complications [26]. As described in a previous report [27] with some modifications, 230 mg/kg of nicotinamide was injected intraperitoneally 15 min before the administration of STZ (60 mg/kg, i.p.) in the overnight fasting rats. One week after diabetes induction, blood samples from the tail vein were collected to assay the glucose and insulin levels to indicate the stability and effectiveness of the diabetes induction.
Induction of T2DM by injection of streptozotocin at low dose
To investigate the antidiabetic effects of pharmacological compounds in the early stage of diabetes, the freshly prepared solution of STZ (45 mg/kg, i.p.) was injected into the fasted rats at a volume of 1 ml/kg. The rats received a low dose of STZ which may partially impair the β cells of the pancreas [28]. After 48 h of STZ administration, rats with moderate hyperglycemia (blood glucose over 250 mg/dl) were used for the experiment. No mortality was observed during this induction.
Drug treatment
To evaluate the acute plasma glucose changes in different diabetic models, fasted rats received a single dose of vehicle or the three antidiabetic agents respectively. Half an hour after drug administration in all the groups of rats the OGTT was performed [29]. Moreover, the effects of multi-dose treatment with the antidiabetic agents on the metabolic profile of the rats were evaluated after 1 week of treatment. Rats were injected with insulin (1 IU/kg, i.p.; Actrapid, Novo Nordisk, Bagsvaerd, Denmark) or an equivalent volume of saline once daily for 7 days. Oral administration of vehicle or drugs (metformin 200 mg/kg [30]; dapagliflozin 1 mg/kg [31]) was also performed daily in the experimental groups. The OGTT was conducted with rats 1 day after the last administration of vehicle or drugs. At the end of the experimental period, animals were sacrificed and the liver tissues were collected and weighed. The samples were stored at –80°C for further analysis. Additionally, blood glucose reduction rate after treatment for 7 days was calculated as follows [32]: blood glucose reduction rate (%) = [1 – (plasma glucose after treatment/plasma glucose before treatment)] × 100%.
Oral glucose tolerance test
The rats were administered with glucose solution (2 g/kg b.w.) by oral gavage following the overnight fast [33]. Blood samples were obtained from the lateral tail vein of rats at 0, 30, 60, 90, and 120 min after glucose load. The rats were maintained under pentobarbital anesthesia (30 mg/kg, i.p.) throughout the experiments. The plasma glucose concentrations were measured using the glucose assay kit (Biosystems S.A., Barcelona, Spain). The AUC and iAUC during the OGTT were calculated using GraphPad Prism 6.0 software (La Jolla, CA, USA).
Effects of chronic medication on signals in diabetic rats
We also investigated the effects of each antidiabetic agent on the signals in diabetic rats. Similar to the chronic treatment as mentioned above, diabetic rats were treated with each agent daily for 1 week. Without the OGTT, we sacrificed the rats to isolate the tissues for assay of signals. Changes in signal by each agent were then compared.
Real-time reverse transcription polymerase chain reaction (RT-PCR)
Elevated levels of inflammatory markers in liver, including interleukin 6 (IL-6) and tumor necrosis factor α (TNF-α), are believed to be associated with diabetes progression [34, 35]. Therefore, the expression levels of IL-6 and TNF-α in liver in HFD/STZ rats were measured using RT-PCR. The total RNA in liver was isolated using TRIzol (Thermo Fisher, Carlsbad, CA, USA) followed by 1-bromo-3-chloropropane (Sigma-Aldrich, St. Louis, Mo, USA) extraction. The extracted messenger RNA (2 µg per sample) was reverse transcribed into cDNA using the Transcriptor First Strand cDNA Synthesis Kit (Roche, Basel, Switzerland) according to the manufacturer’s instructions. RT-PCR was performed using TaqMan assay primer/probe (Roche) on a LightCycler 480 system. The signal intensity was normalized to β-actin. The primers used in this study are shown below.
Western blotting analysis
To determine the effect of antidiabetic drugs on glucose and lipid metabolism in diabetic models, the protein expression levels of PEPCK and TGR5 were measured [36]. Total proteins (30 µg) prepared from tissue homogenates were separated through SDS/polyacrylamide gel electrophoresis (10% acrylamide gel) using the Bio-Rad Mini-Protein II System. Proteins were transferred to expanded polyvinylidene difluoride membranes (Millipore, Burlington, MA, USA). Following blocking, the membrane was probed with the primary antibodies. After removal of the primary antibody, the blots were incubated for 1 h at room temperature with the appropriate peroxidase-conjugated secondary antibody and then developed using the ECL-Western Blotting System (Amersham International, Buckinghamshire, UK). Antibodies used for immunoblotting were anti-PEPCK (62 kDa, Santa Cruz Biotechnology, Dallas, Tx, USA) and anti-TGR5 receptor protein (32 kDa, Abcam, Cambridge, MA, USA). Anti-β-actin (43 kDa, Sigma-Aldrich, St. Louis, MO, USA) was used as a loading control.
Assay of glycogen in liver
To investigate the effect of antidiabetic drugs on glycogen synthesis in diabetic rats, the liver glycogen level in rats was measured. A total of 50 mg of liver tissue was homogenized and extracted following the assay protocol. Liver glycogen was determined using a glycogen assay kit (Abcam, Cambridge, MA, USA).
Compliance with ethical standards
All the experimental procedures performed in studies involving animals were approved by the Local Ethics Commission for Animal Experiments of (2017-047) of China Medical University and were in accordance with the 1996 NIH Guide for the Care and Use of Laboratory Animals.
Results
Changes of AUC in type-1 diabetic rats
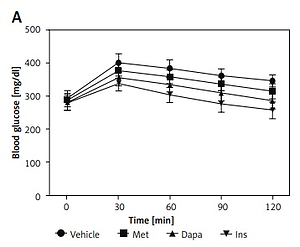
After 7 days of drug administration, the plasma glucose level in the insulin treatment group was significantly reduced compared with that before treatment. The blood glucose reduction in all treatment groups was significantly greater than that of the vehicle treated group (insulin treatment group 37.6%, p < 0.05; dapagliflozin treatment group 26.5%, p < 0.05; metformin treatment group 8.1%, p < 0.05). Three agents also attenuated the elevation of OGTT values in the same manner, as shown in Figure 1 A. Additionally, changes in values from the OGTT were used to calculate the AUC and iAUC. Undoubtedly, a reduction of AUC by three agents was observed in the same order (Figure 1 B). However, insulin was no more potent than dapagliflozin when compared with iAUC (Figure 1 C), showing a change in potency. These results are consistent with the changes in protein levels of PEPCK in the liver, as shown in Figure 1 D.
Figure 1
Effects of antidiabetic agents on changes in the oral glucose tolerance test (OGTT) using type-1 diabetic rats receiving 7 days of medication. Insulin (Ins) at 1 IU/kg was intraperitoneally (i.p.) injected into rats once daily. Oral administration of metformin (Met) at 200 mg/kg or dapagliflozin (Dapa) at 1 mg/kg was also performed daily. After 1 week, all diabetic rats received the OGTT. A – Changes in OGTT (n = 8), B – calculated AUC (n = 8), C – calculated iAUC (n = 8), *P < 0.05 vs. vehicle-treated control group. #P < 0.05 vs. Dapa-treated group. D – changes in hepatic PEPCK levels (n = 4), *P < 0.05 vs. control group. #P < 0.05 vs. vehicle-treated control group
Changes of AUC in rats with T2DM induced by injection of streptozotocin with nicotinamide
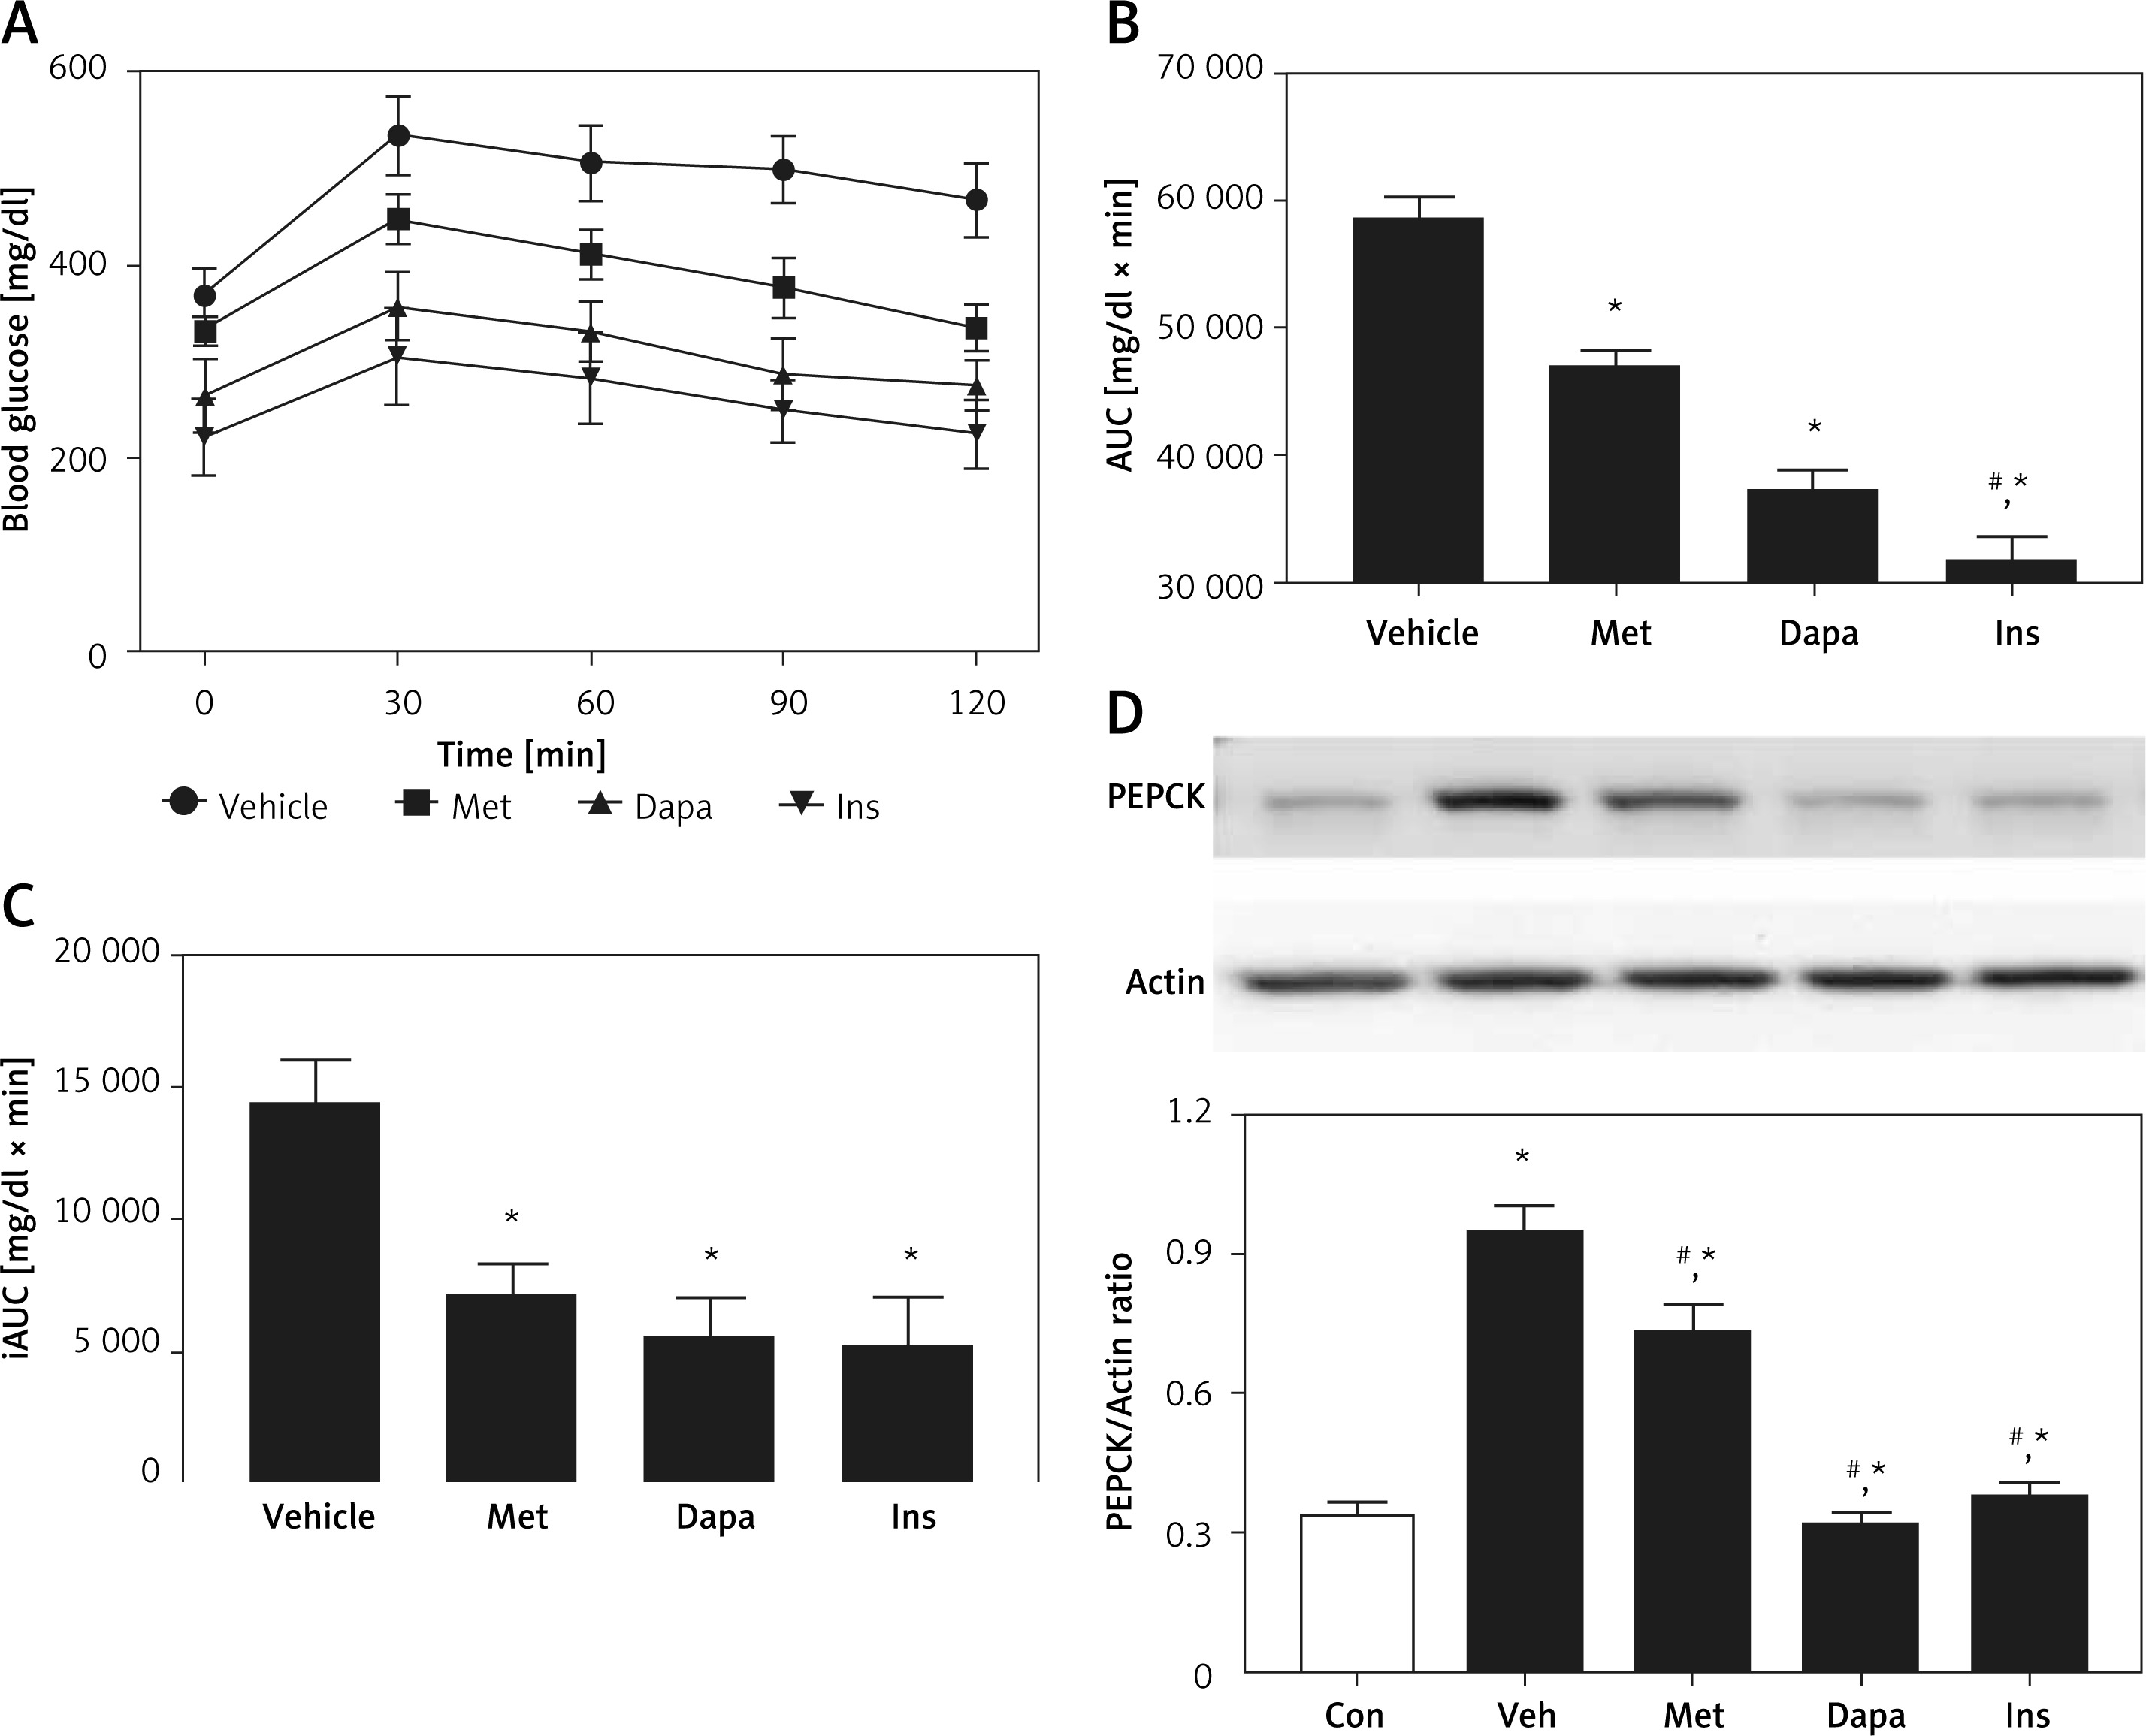
In T2DM, we compared the potency of three agents in a model induced by nicotinamide and STZ [27]. Three antidiabetic agents reduced the fasting plasma glucose after 7 days of medication. Insulin was the most potent, producing 18.3% blood glucose reduction. Dapagliflozin (1 mg/kg), showing 11.7% blood glucose reduction, was the second most potent, while metformin was less effective, inducing 6.3% blood glucose reduction. However, metformin was still more marked (p < 0.05) than those in the vehicle-treated group, showing 0.8% blood glucose reduction. Three agents also attenuated the OGTT in the same manner, as shown in Figure 2 A. Additionally, reduction of the calculated AUC by three agents was observed in the same order (Figure 2 B). However, insulin was no more potent than dapagliflozin when compared with iAUC (Figure 2 C), showing the change in potency also. These results are consistent with the changes in glycogen levels in the liver [37–39], as shown in Figure 2 D.
Figure 2
Effects of antidiabetic agents on changes in the oral glucose tolerance test (OGTT) using streptozotocin and nicotinamide-induced type-2 diabetic rats that received 7 days of medication. Insulin (Ins) at 1 IU/kg was intraperitoneally (i.p.) injected into rats once daily. Oral administration of metformin (Met) at 200 mg/kg or dapagliflozin (Dapa) at 1 mg/kg was also performed daily. After 1 week, all diabetic rats received the OGTT. A – Changes in OGTT (n = 8), B – calculated AUC (n = 8), C – calculated iAUC (n = 8), *P < 0.05 vs. vehicle-treated control group. #P < 0.05 vs. Dapa-treated group. D – changes in hepatic glycogen levels (n = 4), *P < 0.05 vs. control group. #P < 0.05 vs. vehicle-treated control group
Changes of AUC in rats with T2DM induced by streptozotocin at low dose
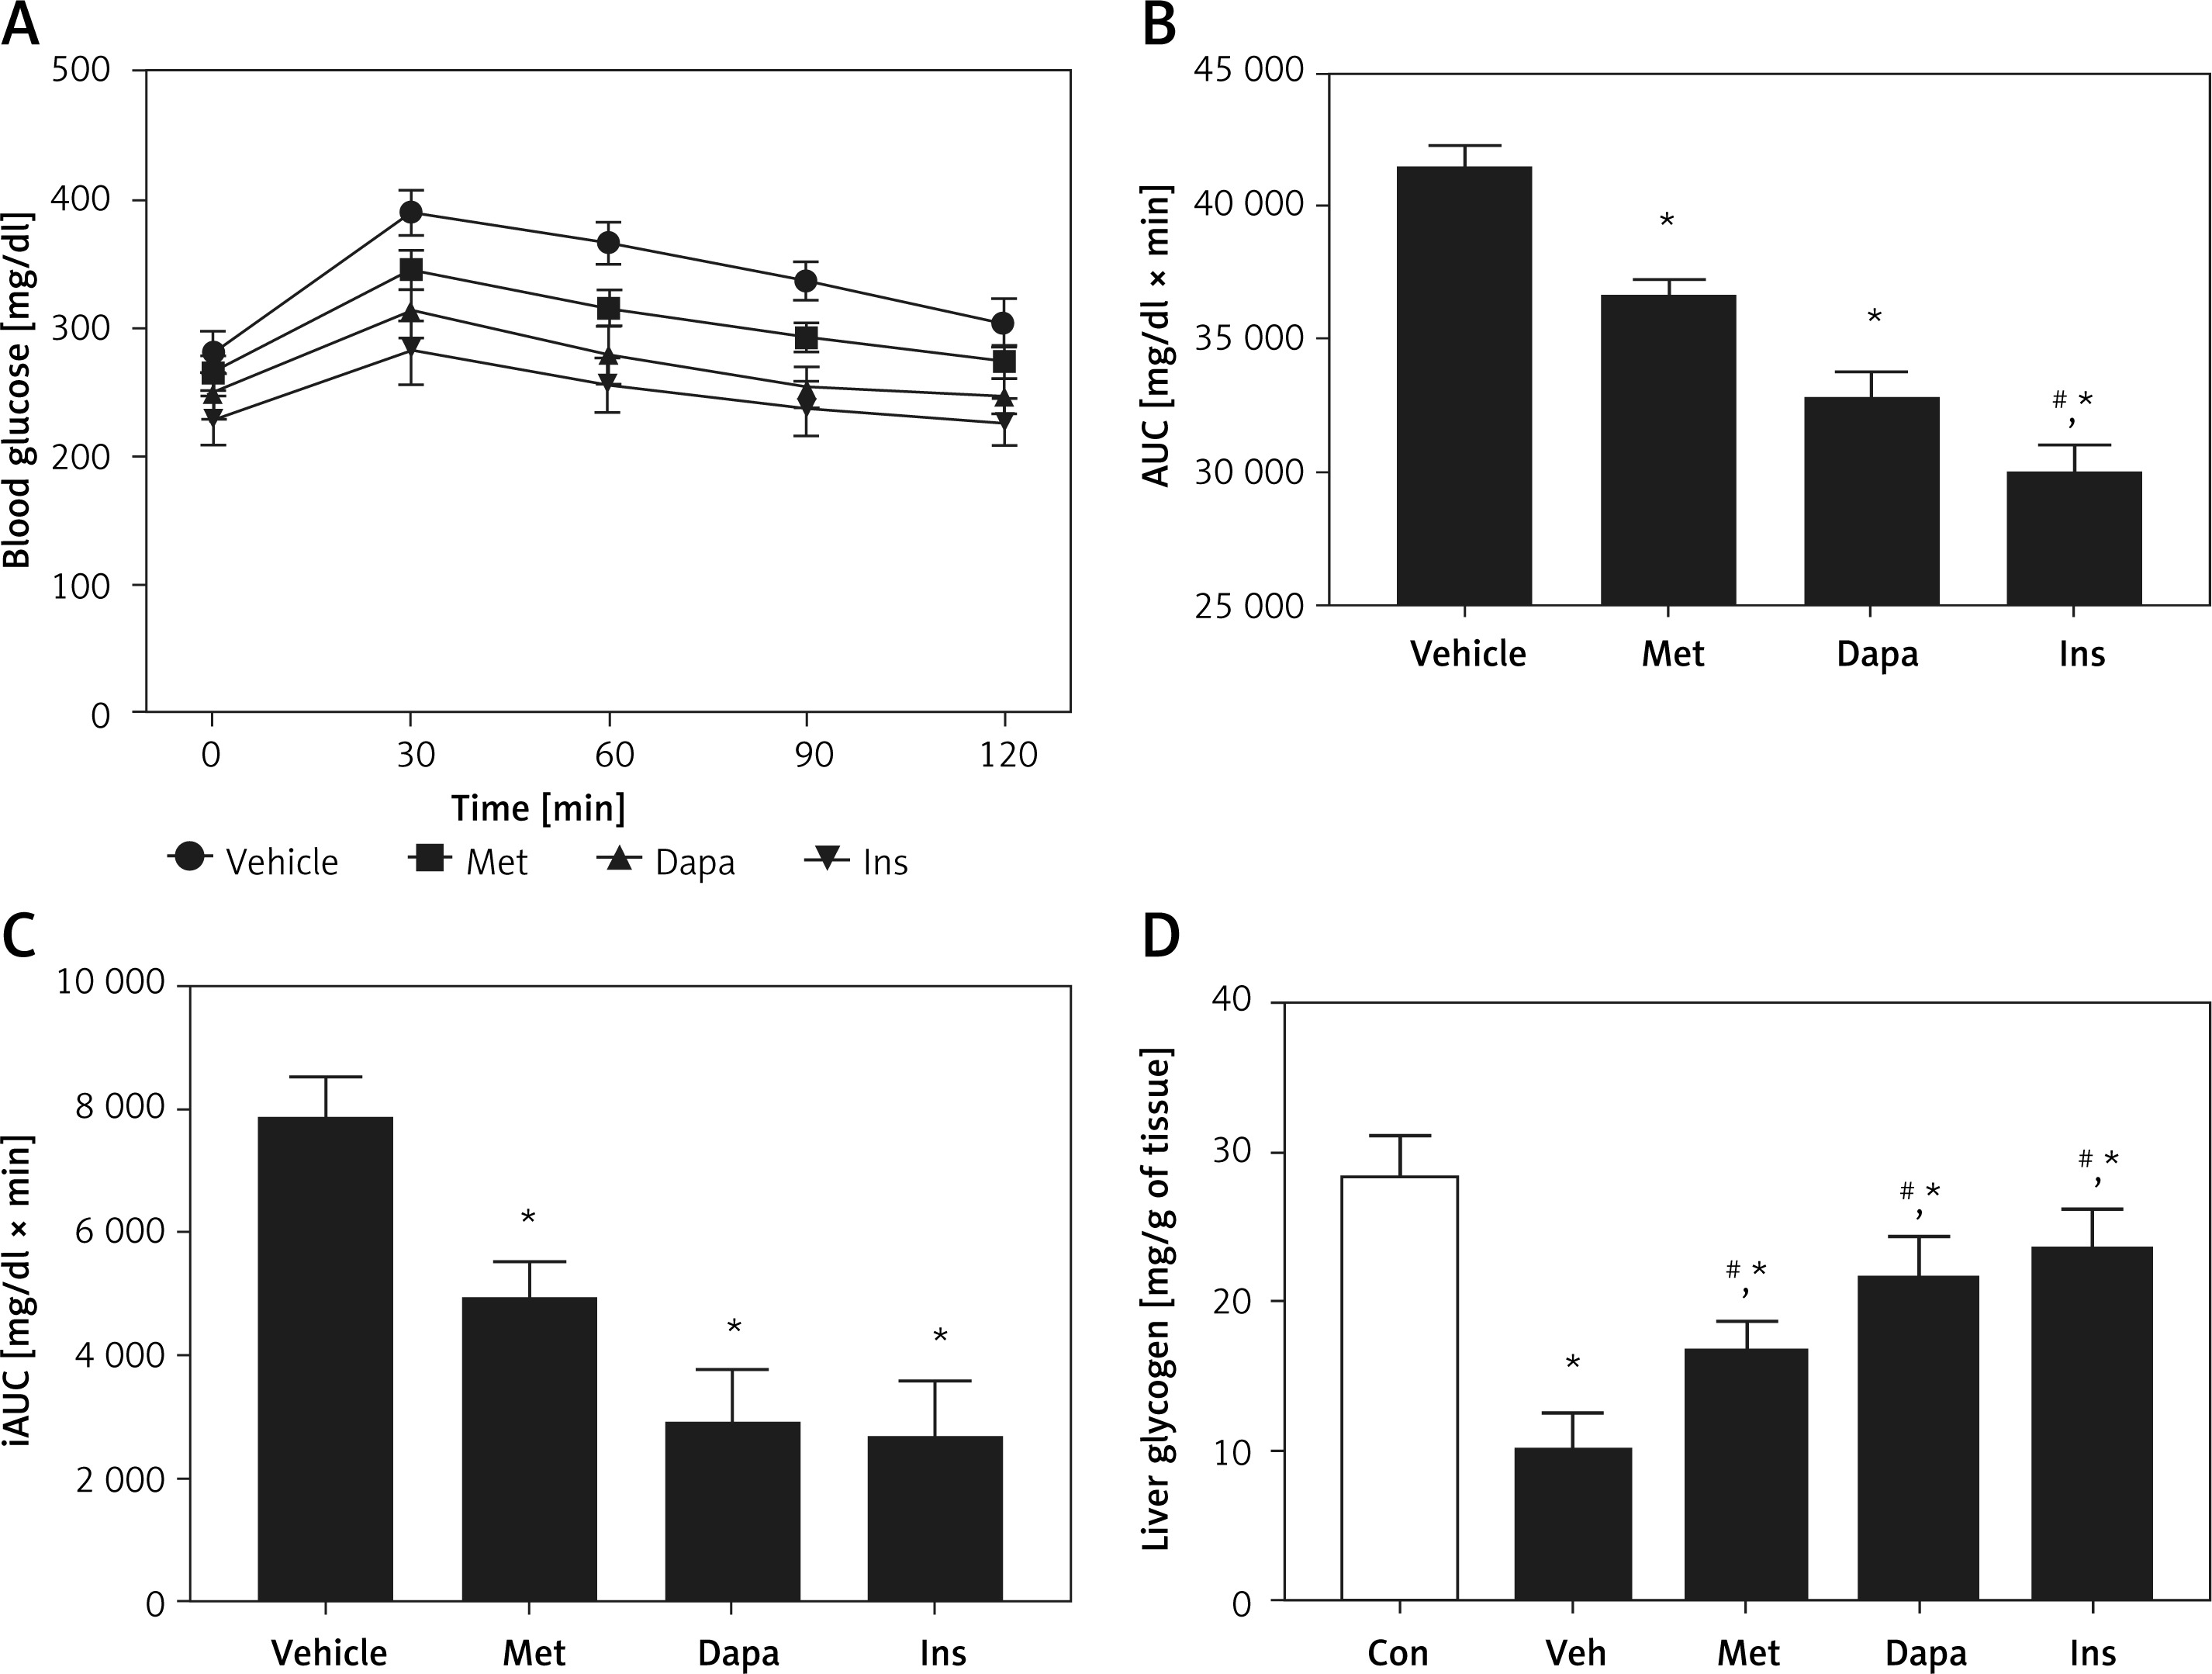
Moreover, effects of the three anti-diabetic agents were compared in another T2DM model induced by low dosing of STZ [28]. The antidiabetic agent decreased the fasting plasma glucose after 7 days of medication. Insulin was most potent, showing 18.3% blood glucose reduction, followed by dapagliflozin (1 mg/kg), which produced 11.9% blood glucose reduction. Metformin was less effective, and it showed 6.3% blood glucose reduction However, effectiveness of metformin was still more marked (p < 0.05) than the vehicle-treated group, showing no change in the blood glucose reduction (0.9%). The three agents also modified the changes of OGTT, as shown in Figure 3 A. Similarly, the three agents decreased the calculated AUC in the same order (Figure 3 B). However, insulin was no more potent than dapagliflozin when compared with the calculated iAUC (Figure 3 C), showing the change in potency. These results are consistent with the changes in expression levels of TGR5 receptor in the liver, as shown in Figure 3 D.
Figure 3
Effects of antidiabetic agents on changes in the oral glucose tolerance test (OGTT) using low dose of streptozotocin-induced type-2 diabetic rats that received 7 days of medication. Insulin (Ins) at 1 IU/kg was intraperitoneally (i.p.) injected into rats once daily. Oral administration of metformin (Met) at 200 mg/kg or dapagliflozin (Dapa) at 1 mg/kg was also performed daily. After 1 week, all diabetic rats received OGTT. A – Changes in OGTT (n = 8), B – calculated AUC (n = 8), C – calculated iAUC (n = 8), *P < 0.05 vs. vehicle-treated control group. #P < 0.05 vs. Dapa-treated group. D – changes in hepatic TGR5 levels (n = 4), *P < 0.05 vs. control group. #P < 0.05 vs. vehicle-treated control group
Changes of AUC in rats with T2DM induced by high-fat diet (HFD) and streptozotocin at low dose (HFD/STZ rats)
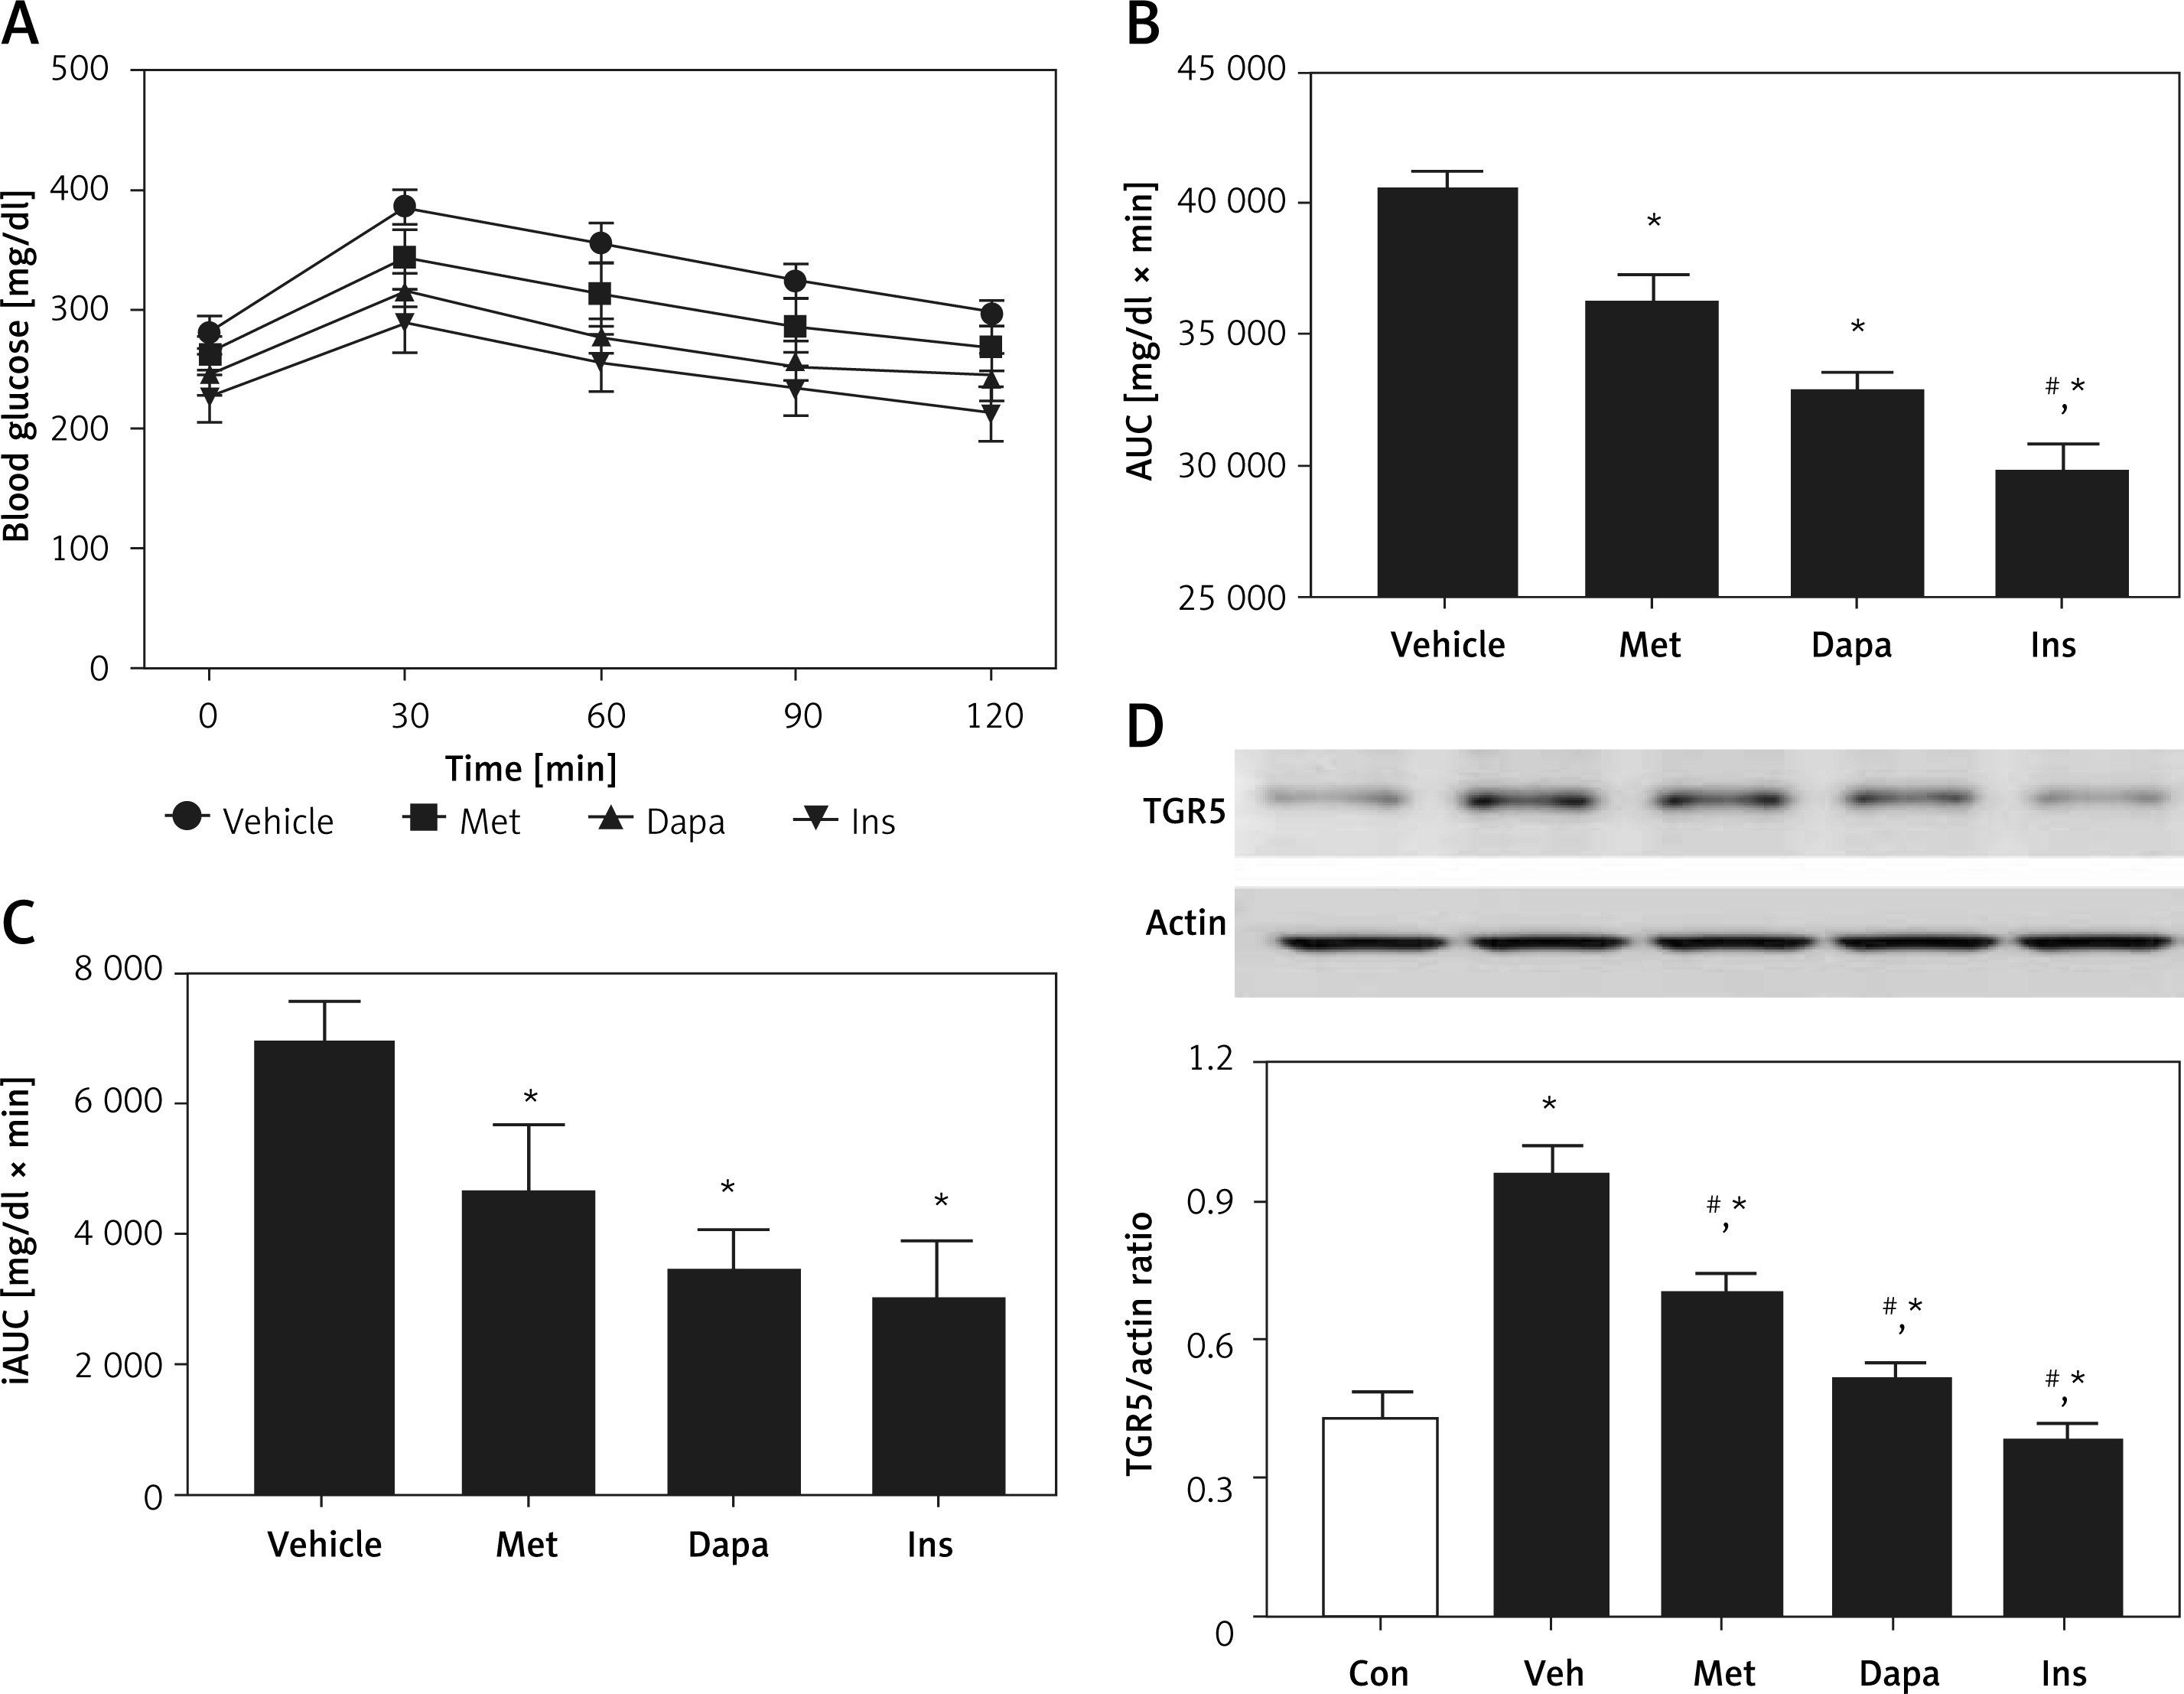
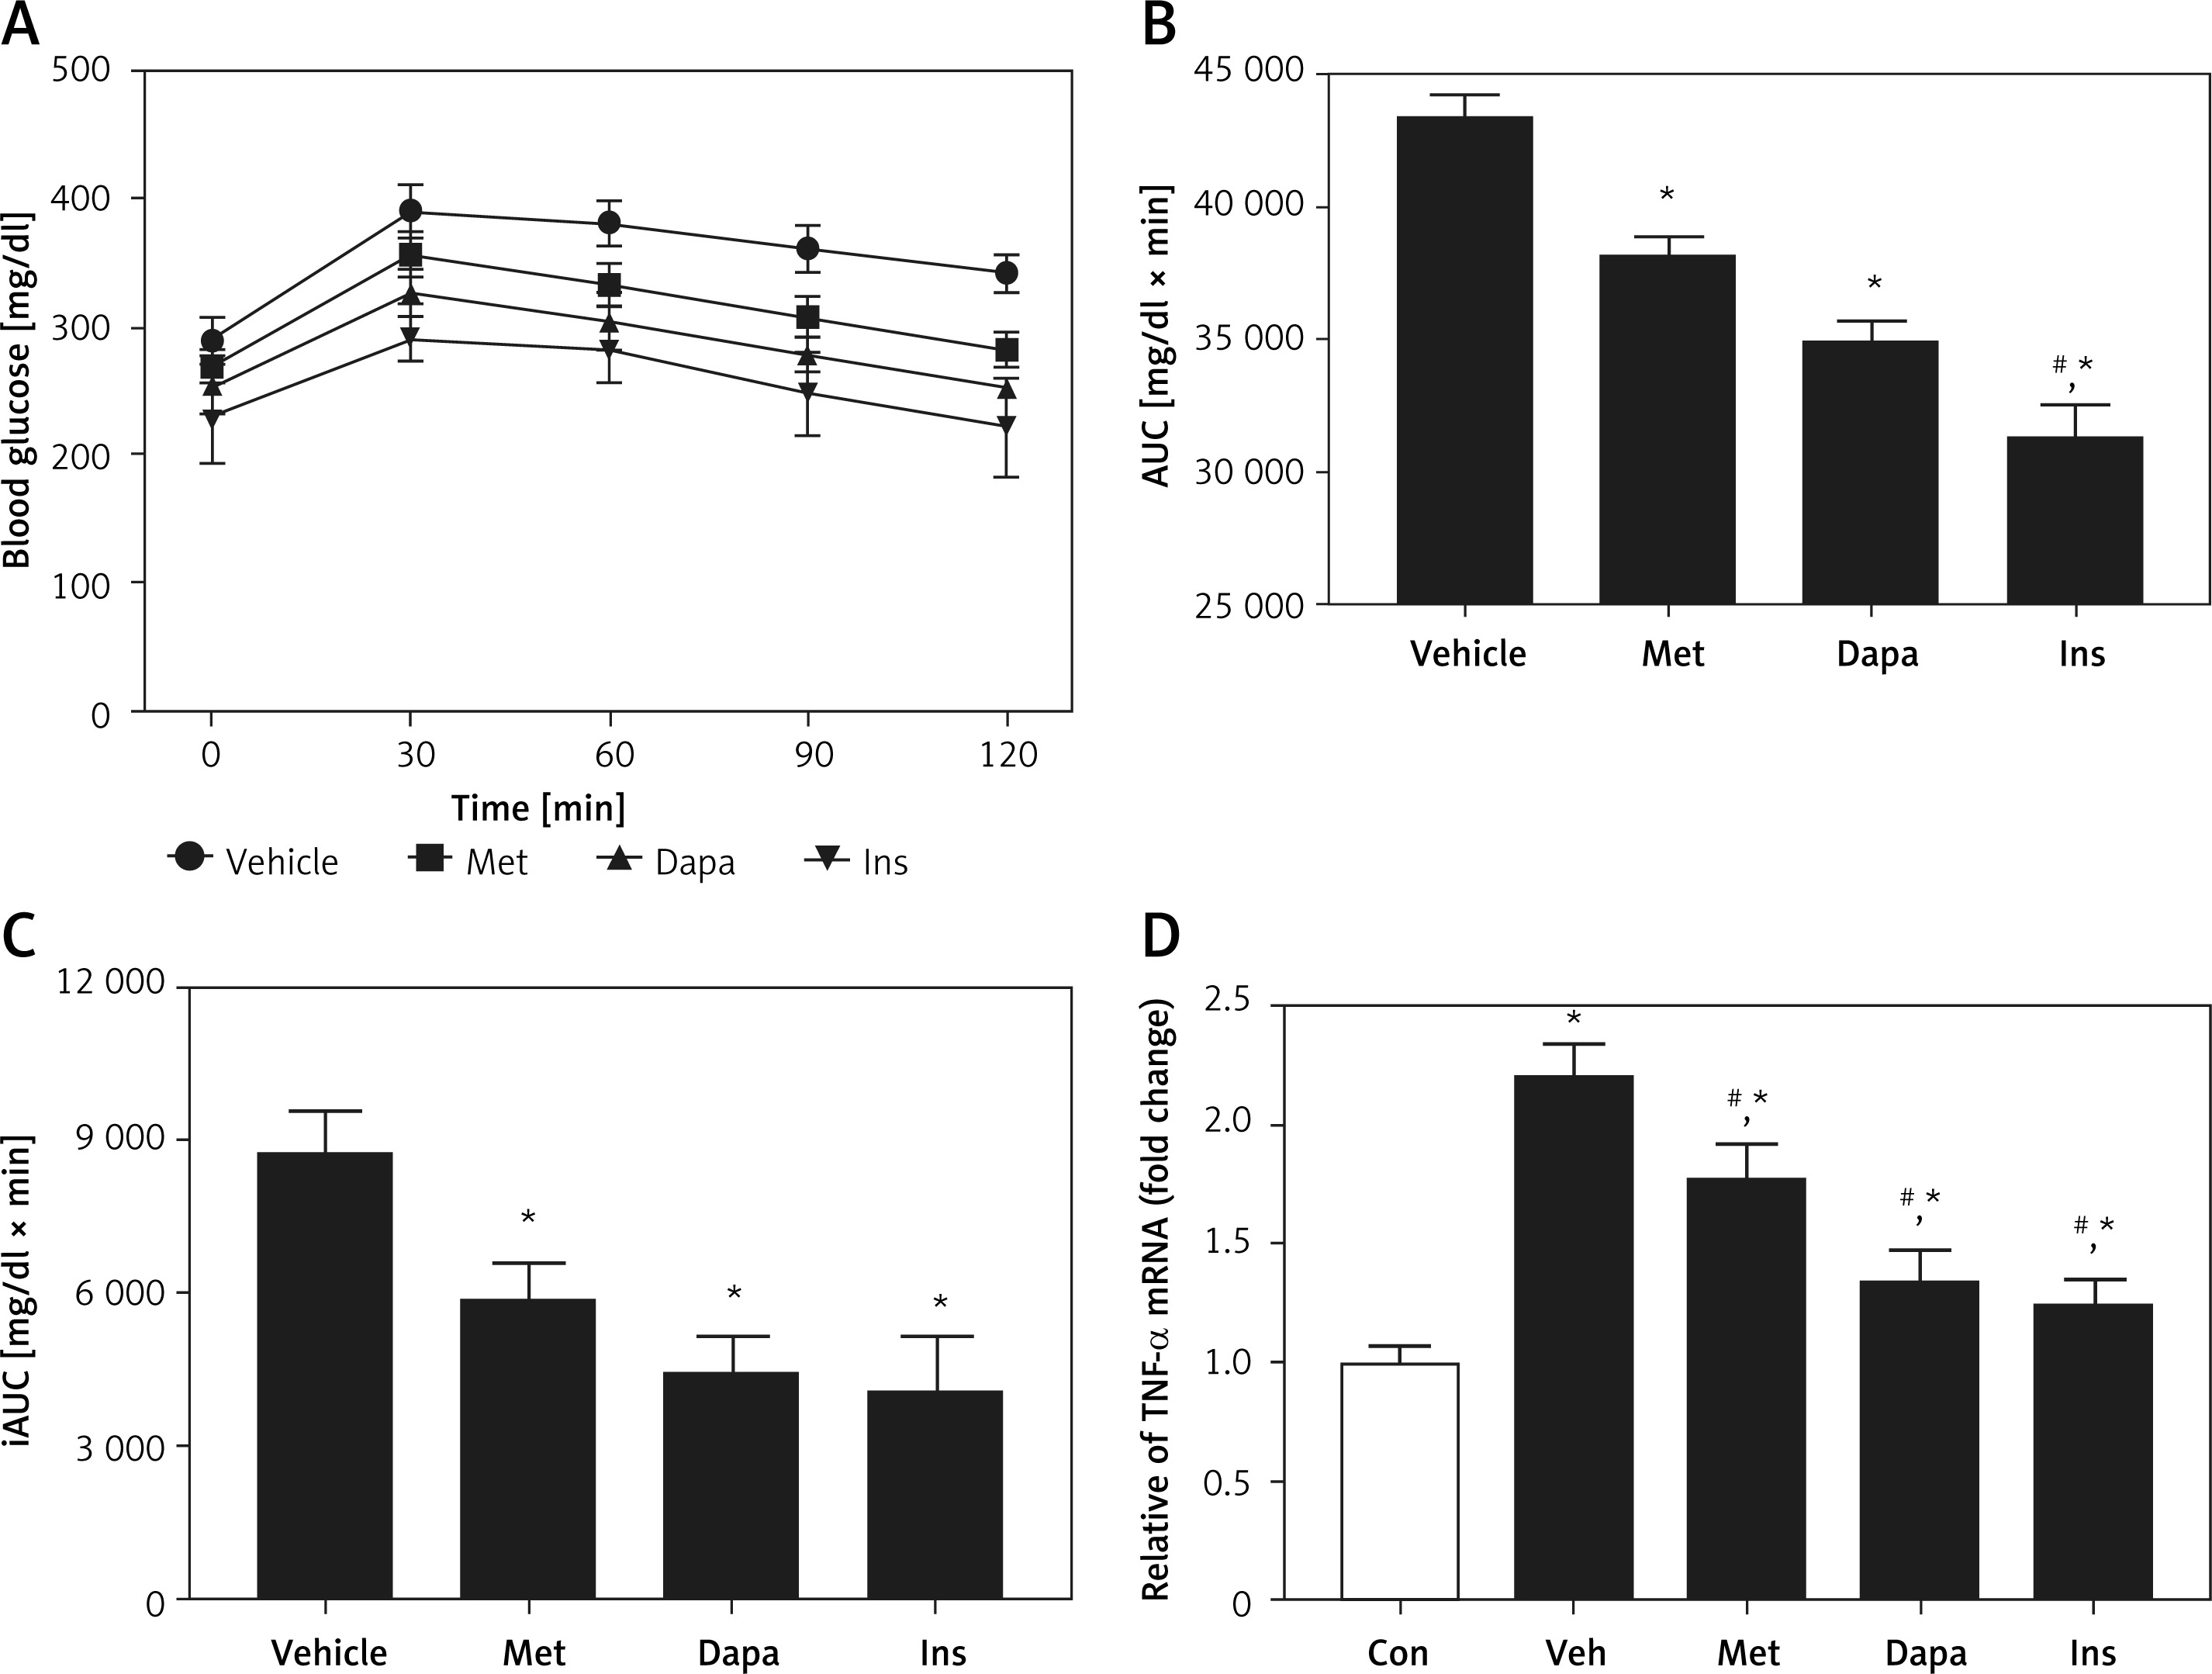
Effects of three anti-diabetic agents were investigated in the widely used T2DM model induced by HFD and STZ [25]. The antidiabetic agents reduced the fasting plasma glucose after 7 days of medication. Insulin was most potent, showing 19.1% blood glucose reduction. It was followed by dapagliflozin (1 mg/kg), which produced 13.5% blood glucose reduction. Metformin was less effective, and it showed 7.8% blood glucose reduction. However, the effectiveness of metformin was still more marked (p < 0.05) than the vehicle-treated group, showing no change in the blood glucose reduction. Three agents also modified the changes in OGTT as shown in Figure 4 A. Similarly, the three agents decreased the calculated AUC in the same order (Figure 4 B). However, insulin was no more potent than dapagliflozin when compared with the calculated iAUC (Figure 4 C), showing the change in potency. The change of AUC was in accordance with the changes in cytokines in the liver, as shown in Figure 4 D.
Figure 4
Effects of antidiabetic agents on changes in the oral glucose tolerance test (OGTT) using high-fat diet-fed and streptozotocin-induced type-2 diabetic rats that received 7 days of medication. Insulin (Ins) at 1 IU/kg was intraperitoneally (i.p.) injected into rats once daily. Oral administration of metformin (Met) at 200 mg/kg or dapagliflozin (Dapa) at 1 mg/kg was also performed daily. After 1 week, all diabetic rats received the OGTT. A – Changes in OGTT (n = 8), B – calculated AUC (n = 8), *P < 0.05 vs. vehicle-treated control group. #P < 0.05 vs. Dapa-treated group. C – calculated iAUC (n = 8), D – expression of TNF-α in liver (n = 4), *P < 0.05 vs. control group. #P < 0.05 vs. vehicle-treated control group
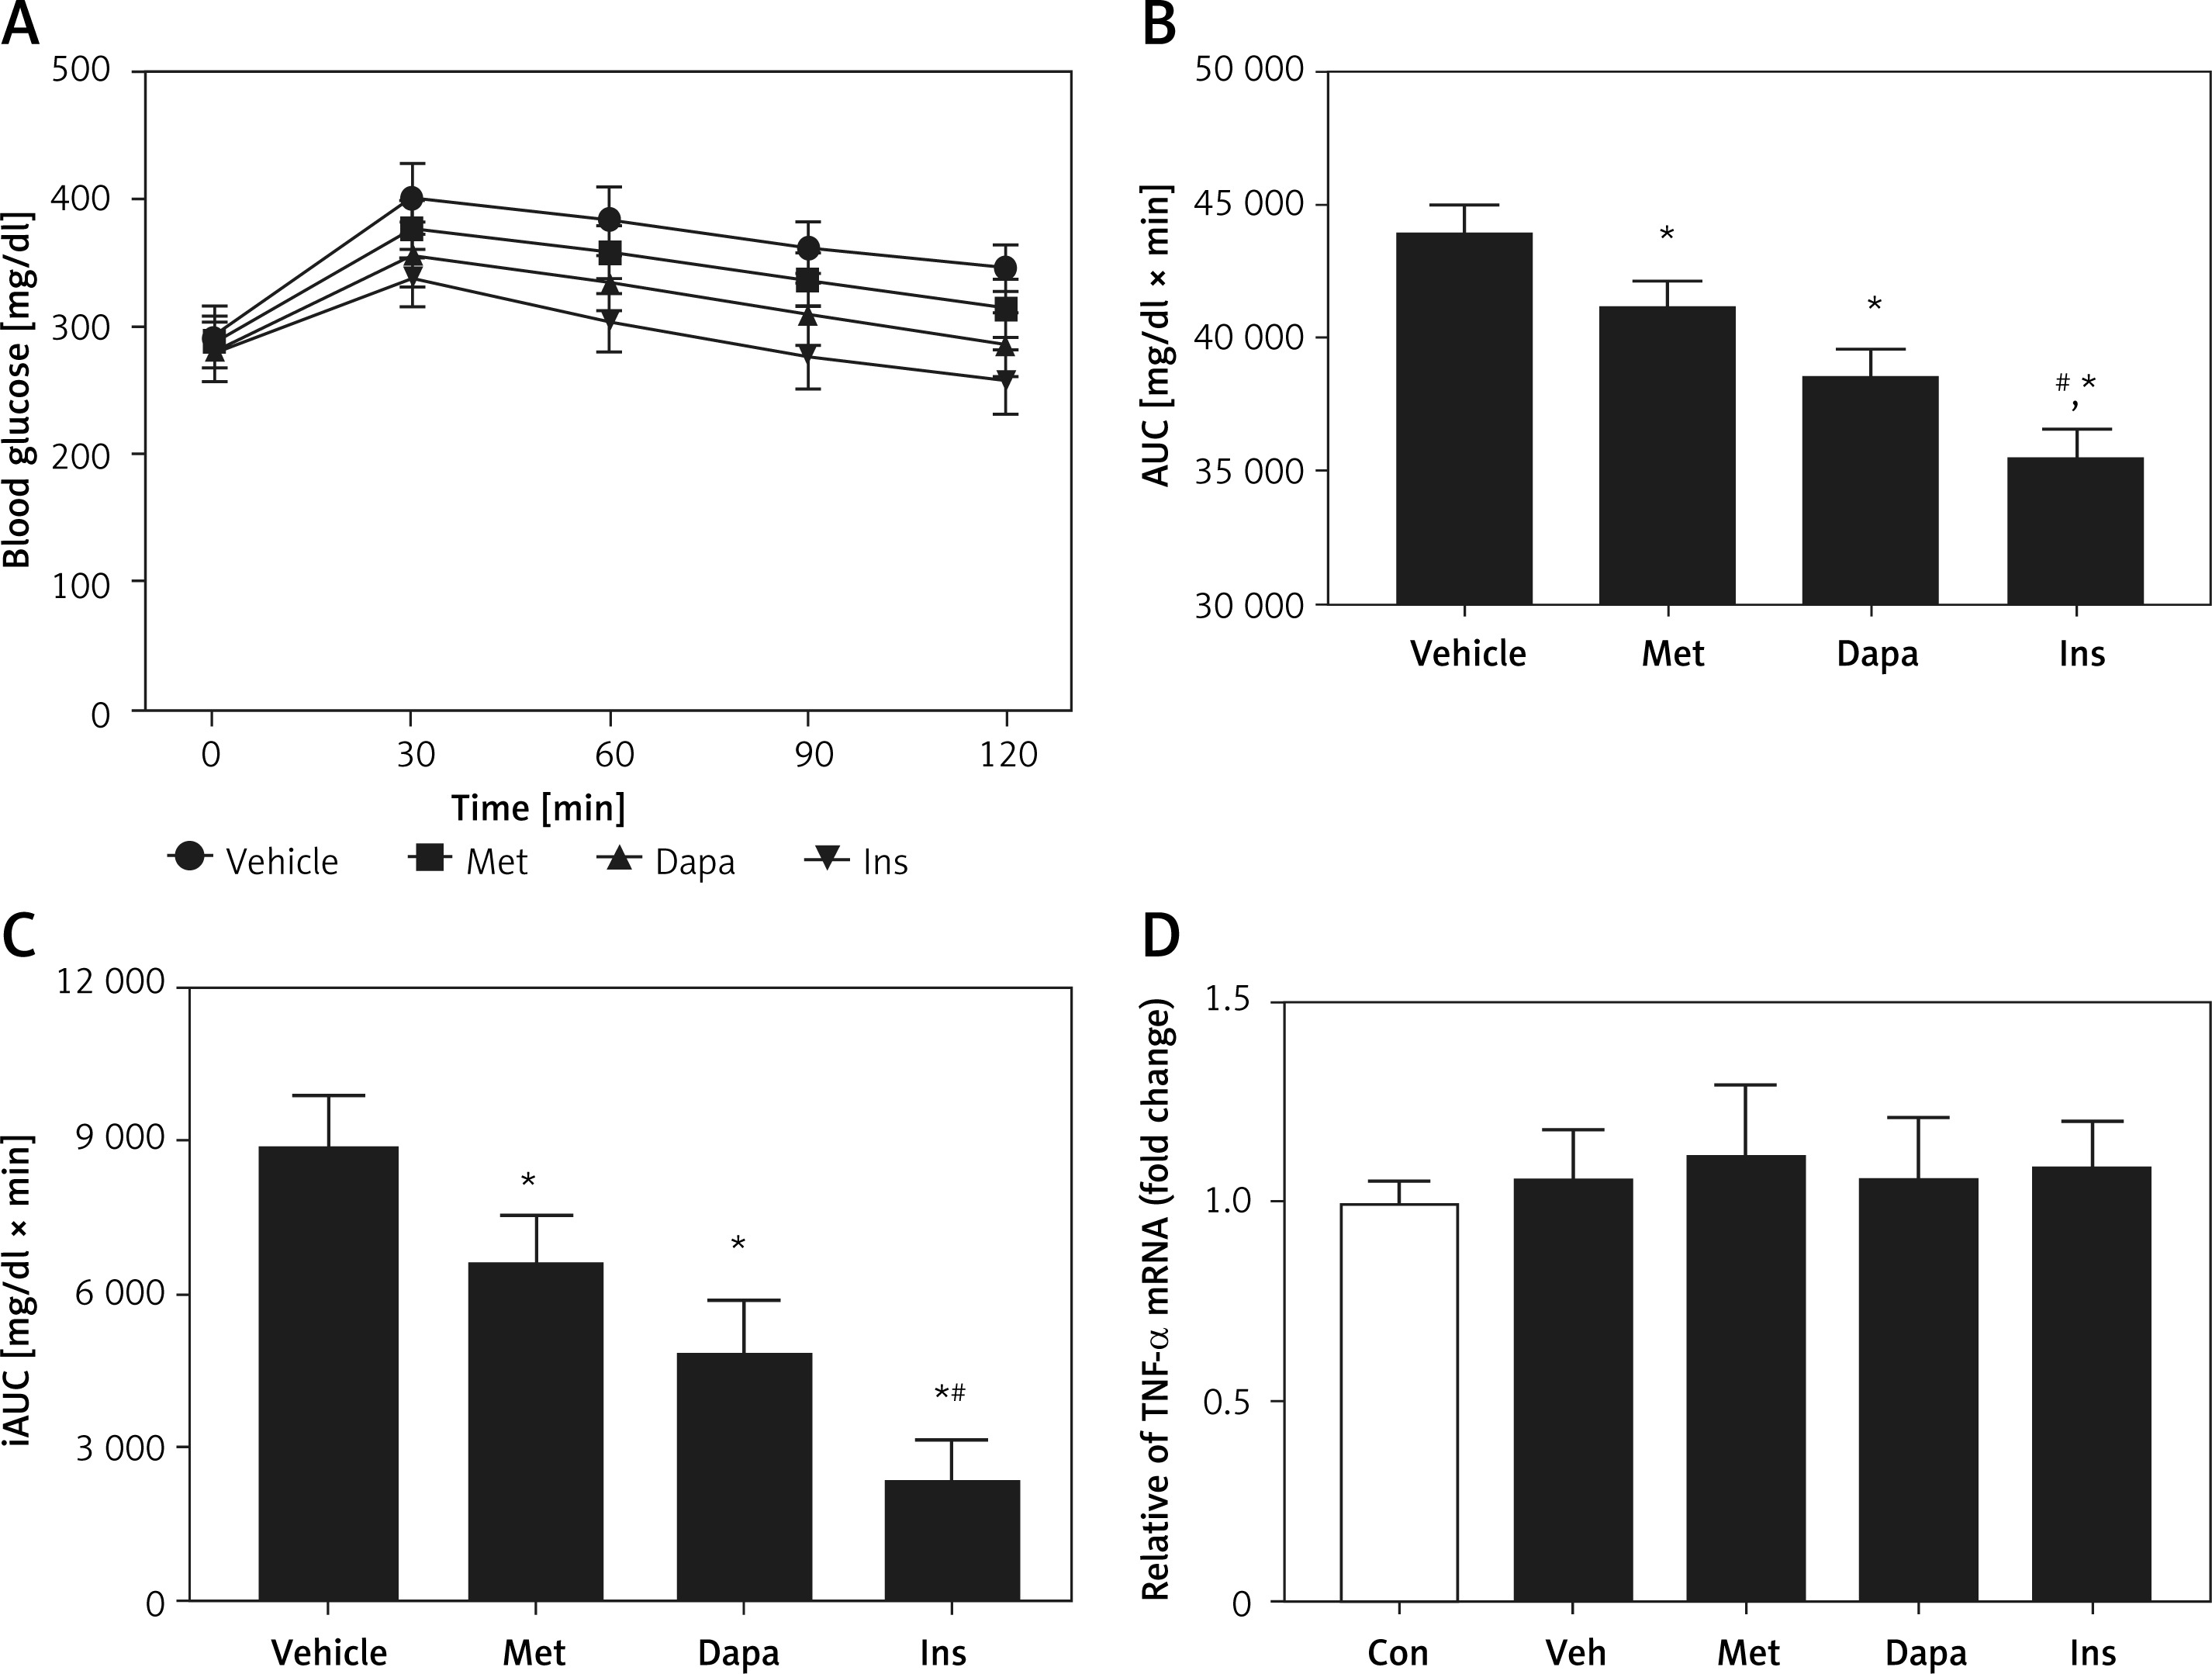
Next, we compared the potency of the three agents in the same model using acute treatment. The antidiabetic agents did not modify the fasting plasma glucose during acute medication. Fasting plasma glucose changed from 291.4 ±8.2 mg/dl to 285.1 ±6.8 mg/dl in insulin-treated rats (p < 0.05). Dapagliflozin (1 mg/kg) changed it from 286.3 ±7.6 mg/dl to 289.2 ±6.2 mg/dl. Metformin was also not effective and changed it from 289.6 ±9.7 mg/dl to 287.9 ±7.3 mg/dl, which was comparable (p > 0.05) to changes seen in the vehicle-treated group from 288.6 ±9.5 mg/dl to 290.4 ±7.5 mg/dl. However, as shown in Figure 5 A, each agent modified the changes in OGTT. Three agents decreased the AUC in the same order (Figure 5 B). Moreover, this remained consistent during comparison with the calculated iAUC (Figure 5 C), showing similar potency as that of AUC. Additionally, as shown in Figure 5 D, they did not influence the changes in hepatic inflammatory cytokine, TNF-α.
Figure 5
Effects of antidiabetic agents on changes in the oral glucose tolerance test (OGTT) using high-fat diet-fed and streptozotocin-induced type-2 diabetic rats receiving acute treatment. Insulin (Ins) at 1 IU/kg was intraperitoneally (i.p.) injected into diabetic rats. Oral administration of metformin (Met) at 200 mg/kg or dapagliflozin (Dapa) at 1 mg/kg was also performed on each group of rats. After 30 min, all diabetic rats received the OGTT. A – Changes in OGTT (n = 8), B – calculated AUC (n = 8), C – calculated iAUC (n = 8), D – expression of TNF-α in liver (n = 4)
*P < 0.05 vs. vehicle-treated control group. #P < 0.05 vs. Dapa-treated group.
Discussion
The present study was carried out to investigate the glucose-lowering effect of acutely or long-term administered antidiabetic agents in different kinds of animal models. To quantify OGTT, the tAUC method suggested the improvement for glycemic control in both the single and multiple dose treatment. However, the iAUC method failed to reflect the changes of OGTT after the single dose treatment. The results proved that AUC but not iAUC was an efficient parameter for evaluating whether an intervention was effective.
We applied three drugs used clinically for the treatment of diabetic disorders. Metformin is known to ameliorate diabetes mainly through activation of AMP kinase (AMPK) over time [40]. However, metformin is also associated with higher plasma GLP-1 level in patients with diabetes [41] and increased plasma opioids in type-1 diabetic rats [36]. Additionally, metformin may interact with the gut microbiota [42], which may also contribute to diabetes pathogenesis. Therefore, the influence of metformin unrelated to AMPK is widely introduced as pleiotropic effects. A recent study demonstrated that acute administration of metformin was effective at lowering blood glucose levels and improving glycemic control in diabetic mice, but it did not significantly affect major insulin-sensitive tissues [43]. It indicated that the glucoregulatory influence of acute metformin treatment resulted from inhibition of intestinal glucose transport [43]. On the other hand, dapagliflozin is known to inhibit SGLT2, resulting in higher excretion of glucose in the urine [44]. However, dapagliflozin may protect the heart and other tissues without the presence of SGLT2 [45], indicating the pleiotropic effect of dapagliflozin. Moreover, insulin as an endogenous hormone is known to improve diabetes after binding with a specific receptor to induce well-known insulin-signaling [46]. Effects on memory in humans [47] may also be a pleiotropic effect of insulin. Taken together, the three drugs applied in the current study all possess the ability to produce native and pleiotropic effects.
AUC is known to be derived from the OGTT, which is widely used to diagnose IGT in clinical practice. In clinical settings, variations in fasting plasma glucose among patients with diabetes are widely observed. Thus, the cut-off baseline values (iAUC) are developed for application in clinical practice. However, the iAUC determined from subtracting the baseline value of fasting plasma glucose has been criticized as being problematic [18]. Additionally, diabetic disorders are known to be progressive [48]. Therefore, fasting plasma glucose varies mainly due to diabetic disease progression. The difference depends on both between- and within-person variability. Additionally, it has been documented that AUC expressed the closest correlation with the 2-hour glucose level of OGTT and the total glucose response was represented more accurately by the AUC than iAUC in clinical practice [49].
In the present study, we applied three clinically used agents to investigate the effects on OGTT in type-1 diabetic rats and three different type-2 diabetic rat models. After daily medication for 7 days, the data indicated that AUC was more suitable than iAUC in each model. Regarding the improvement in IGT, calculated from AUC, it showed drug potency of insulin > dapagliflozin > metformin observed in all four diabetic rat models. However, the order changed when calculated using iAUC, which showed a higher potency of dapagliflozin. Similar results failed to be produced in diabetic rats receiving acute treatment. Therefore, iAUC seems unsuitable for cases receiving repeated treatment.
In each model of diabetic rats, we investigated the changes in associated signals before OGTT. In type-1 diabetic rats, three drugs modified the protein levels of PEPCK in livers after daily treatment for 1 week, indicating mediation of the pleiotropic effect. Additionally, signals in type-2 diabetic rats in three different models were also influenced by each drug through a pleiotropic effect, probably due to the changes in glycemic regulation. This indicates that repeated treatment of medicine may result in reduction of hyperglycemia (basal fasting plasma glucose) as shown in the diabetic rats before the OGTT. The results were due to multiple factors that could not be removed or ignored during the calculation of AUC. This view was observed in all models of diabetic rats receiving repeated medication. Moreover, iAUC was similar as AUC in diabetic rats that received acute treatment of three drugs before the OGTT, indicating that the variations were mainly due to the repeated treatment or long-term medication. Repeated medication may modify the glucose homeostasis through multiple factors and it needs further investigations in the future. In addition, the long-term safety and efficacy of antidiabetic agents need to be further assessed.
Taken together, we suggest that iAUC is not suitable for application in animals receiving chronic medication before the OGTT. Therefore, AUC seems sufficient to distinguish the variations from the OGTT.