Introduction
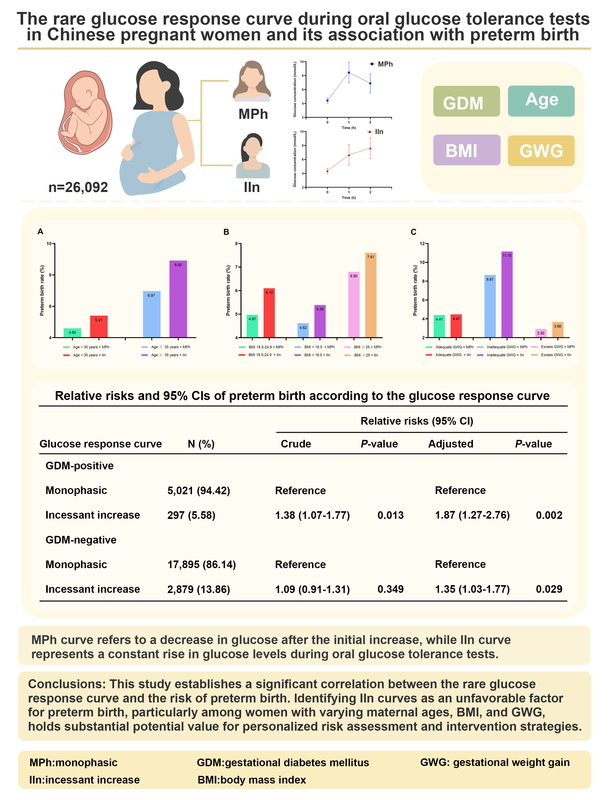
Gestational diabetes mellitus (GDM) is the most prevalent metabolic disorder during pregnancy, associated with significant short- and long-term maternal and fetal complications [1, 2]. Screening for GDM during pregnancy is essential to prevent or reduce adverse obstetric outcomes and future effects on various organ systems. Currently, in China the gold standard for diagnosing GDM is the administration of a 75-gram oral glucose tolerance test (OGTT) between 24 and 28 weeks of gestation [3]. However, previous GDM screening trials primarily focused on glycemic outcomes without considering OGTT response curve shapes. Recent studies have demonstrated that OGTT response curves can not only indicate β-cell function but also differentiate diabetes risk [4–10]. In China, response curve shapes of OGTTs during pregnancy are mainly classified as incessant increase (IIn) and monophasic (MPh). An IIn curve refers to a continuous gradual rise in plasma glucose levels during the 2-hour duration of the OGTT without a decrease of ≥ 0.25 mmol/l [11, 12]. An MPh curve indicates a gradual increase in plasma glucose until reaching its peak followed by a subsequent decline of ≥ 0.25 mmol/l [11, 12]. Among these patterns, the MPh curve is the most common while the IIn mode is relatively rare [12, 13].
Preterm birth, defined as childbirth occurring before 37 weeks of gestation [14], is the primary cause of neonatal mortality and can lead to various lifelong morbidities [15, 16]. Globally, approximately 15 million infants are born preterm each year. Out of these births, around one million babies die due to prematurity [17]. Therefore, gaining an understanding of this condition and its associated risks may contribute to better prevention strategies for preterm birth and improved pregnancy outcomes. A study showed that β cell function during pregnancy was involved in the occurrence of preterm birth and lower insulin resistance, and better insulin function during pregnancy may ultimately lead to a better outcome for preterm birth [18]. However, it remains unclear whether the IIn curve, which is believed to indicate poor β cell function, is associated with preterm birth.
Hence, this study aimed to investigate this rare glucose response curve – the IIn curve – among pregnant Chinese women and its association with preterm birth.
Material and methods
Study design and subjects
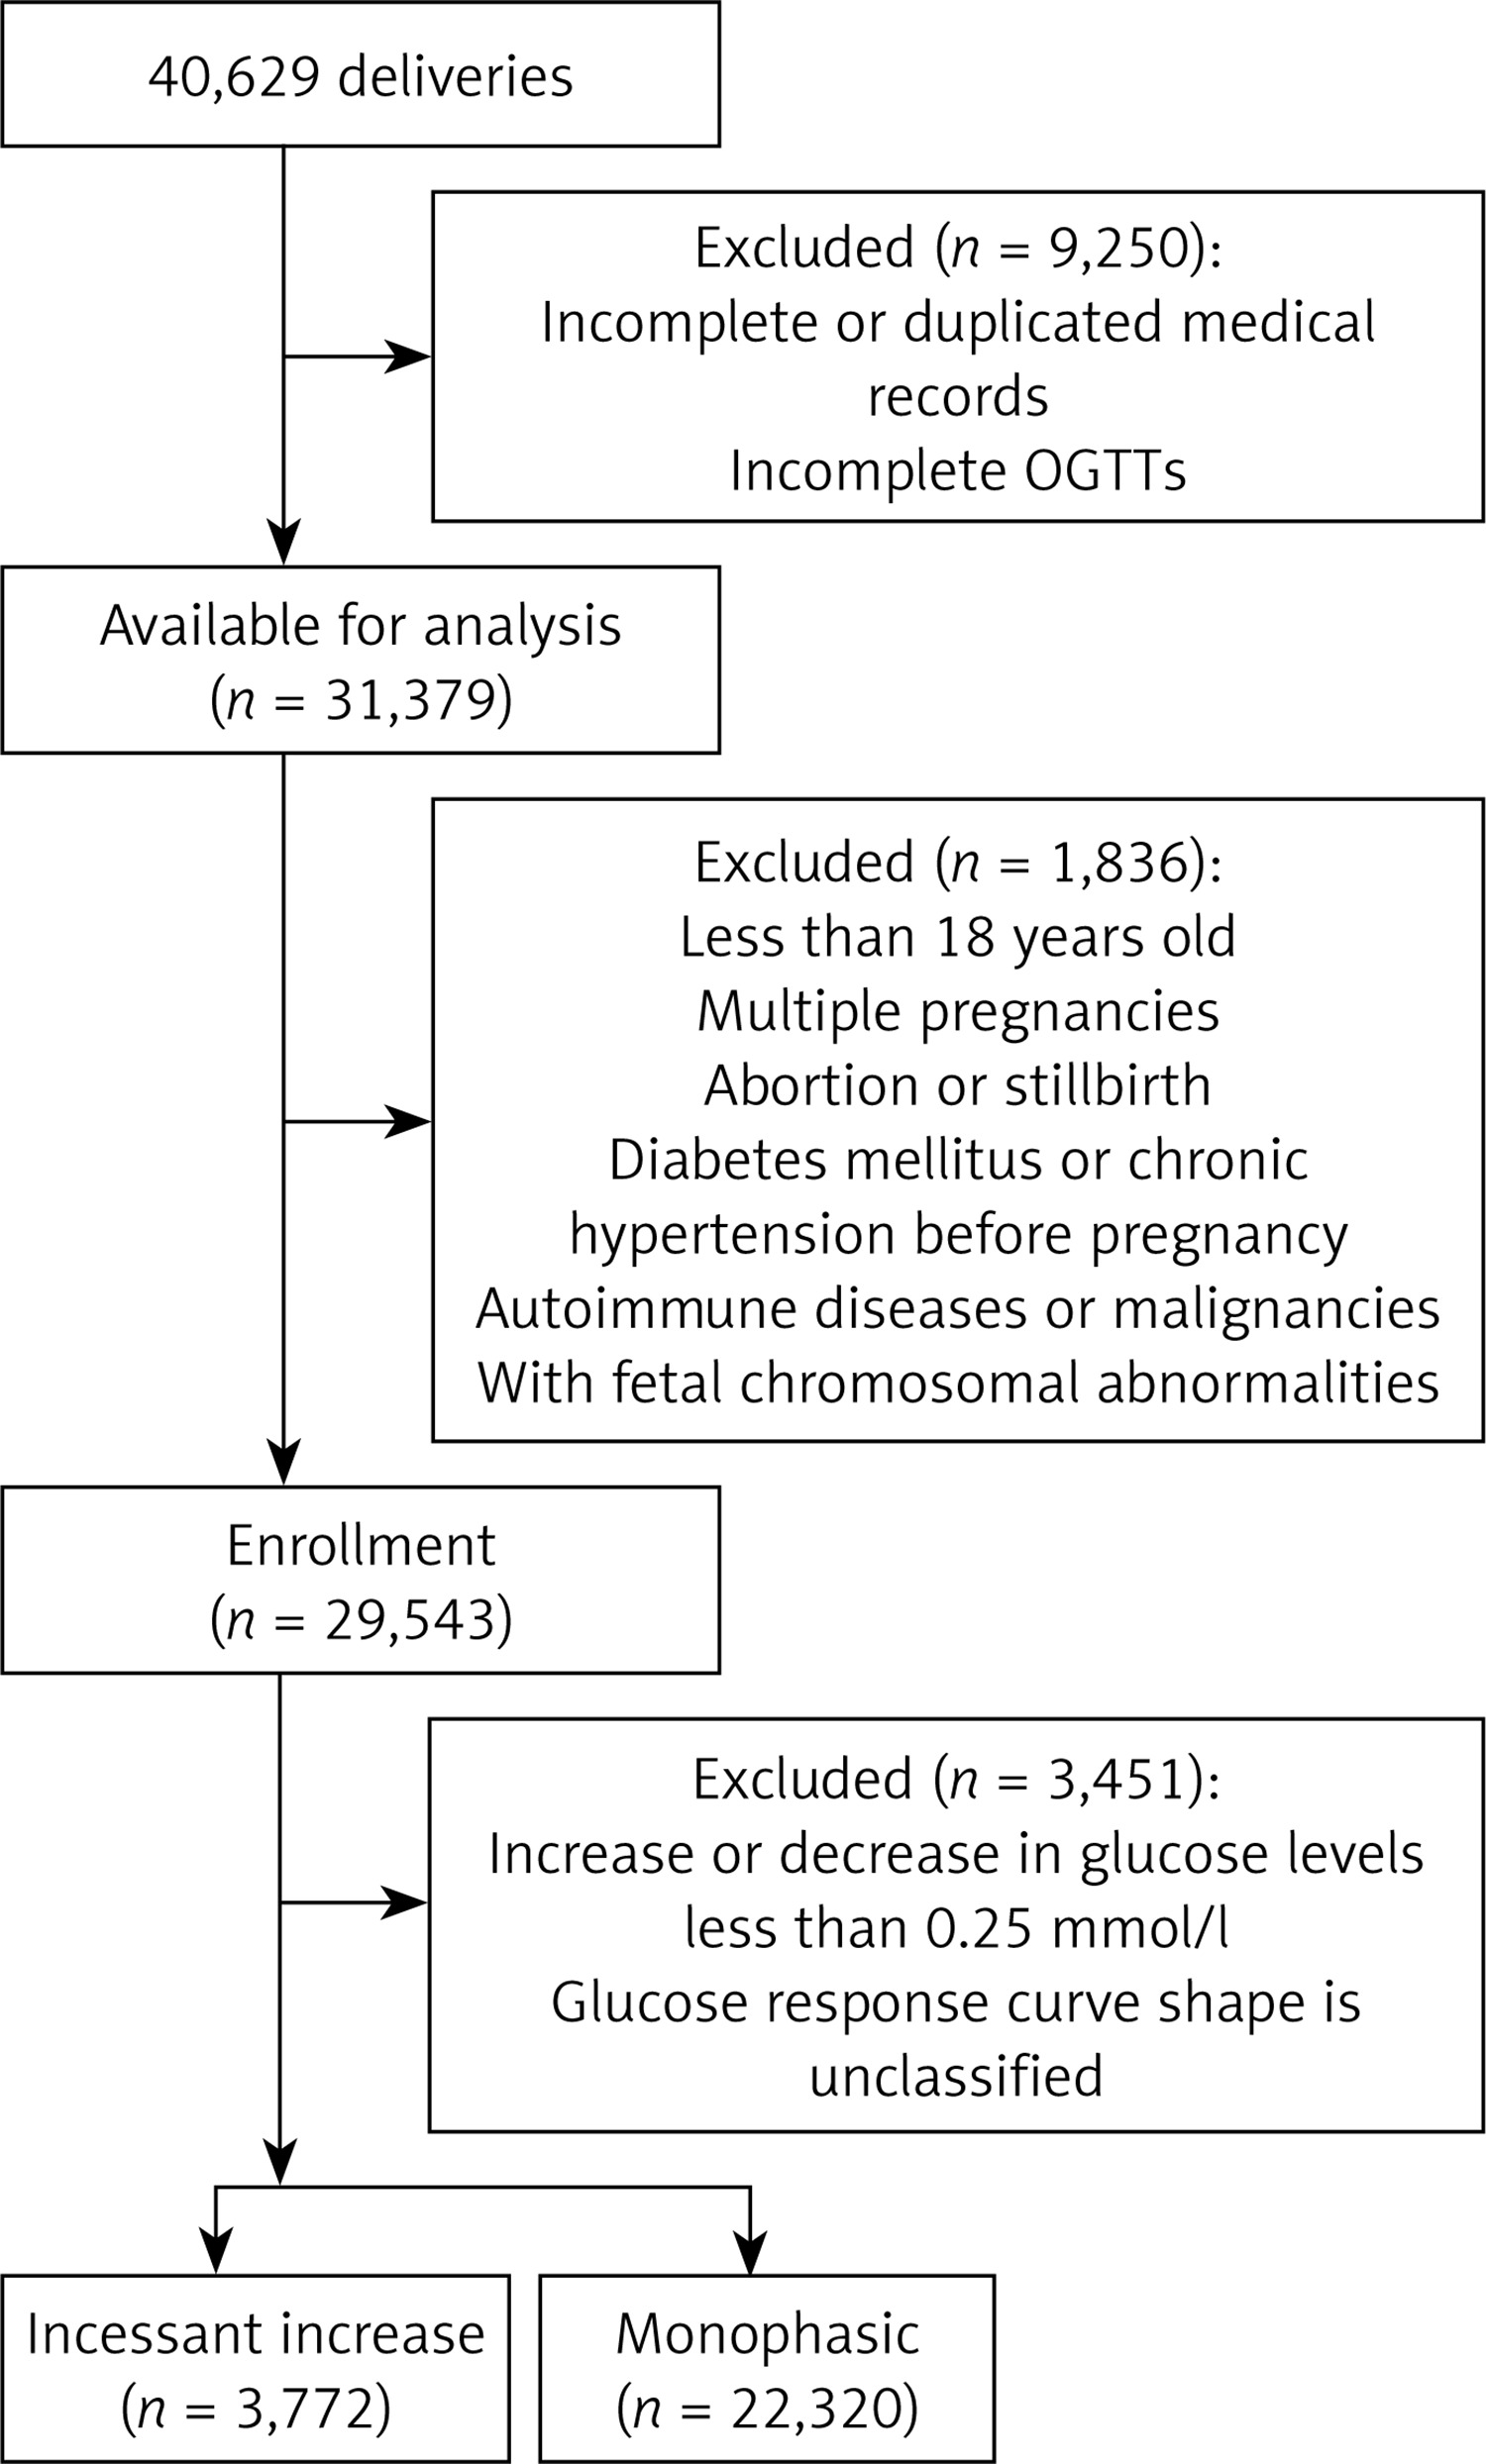
A retrospective cohort study was conducted on a total of 40,629 women who received perinatal care and delivered between January 2018 and December 2019 at the Women’s Hospital, Zhejiang University School of Medicine. The study protocol was approved by the hospital ethics committee (approval number: IRB-20240021-R; approval date: January 22, 2024), and an informed consent exemption was granted due to the use of anonymous patient records. However, certain individuals who met any of the following criteria were excluded: (1) incomplete or duplicated medical records; (2) incomplete OGTTs; (3) under 18 years of age; (4) multiple pregnancies; (5) abortion or stillbirth; (6) diabetes mellitus or chronic hypertension before pregnancy; (7) autoimmune diseases or malignancies; (8) with fetal chromosomal abnormalities; (9) OGTT results with an increase or decrease in glucose levels less than 0.25 mmol/l; and finally, shapes of the OGTT curve that could not be classified. The screening details for the participants are illustrated in Figure 1.
Definitions
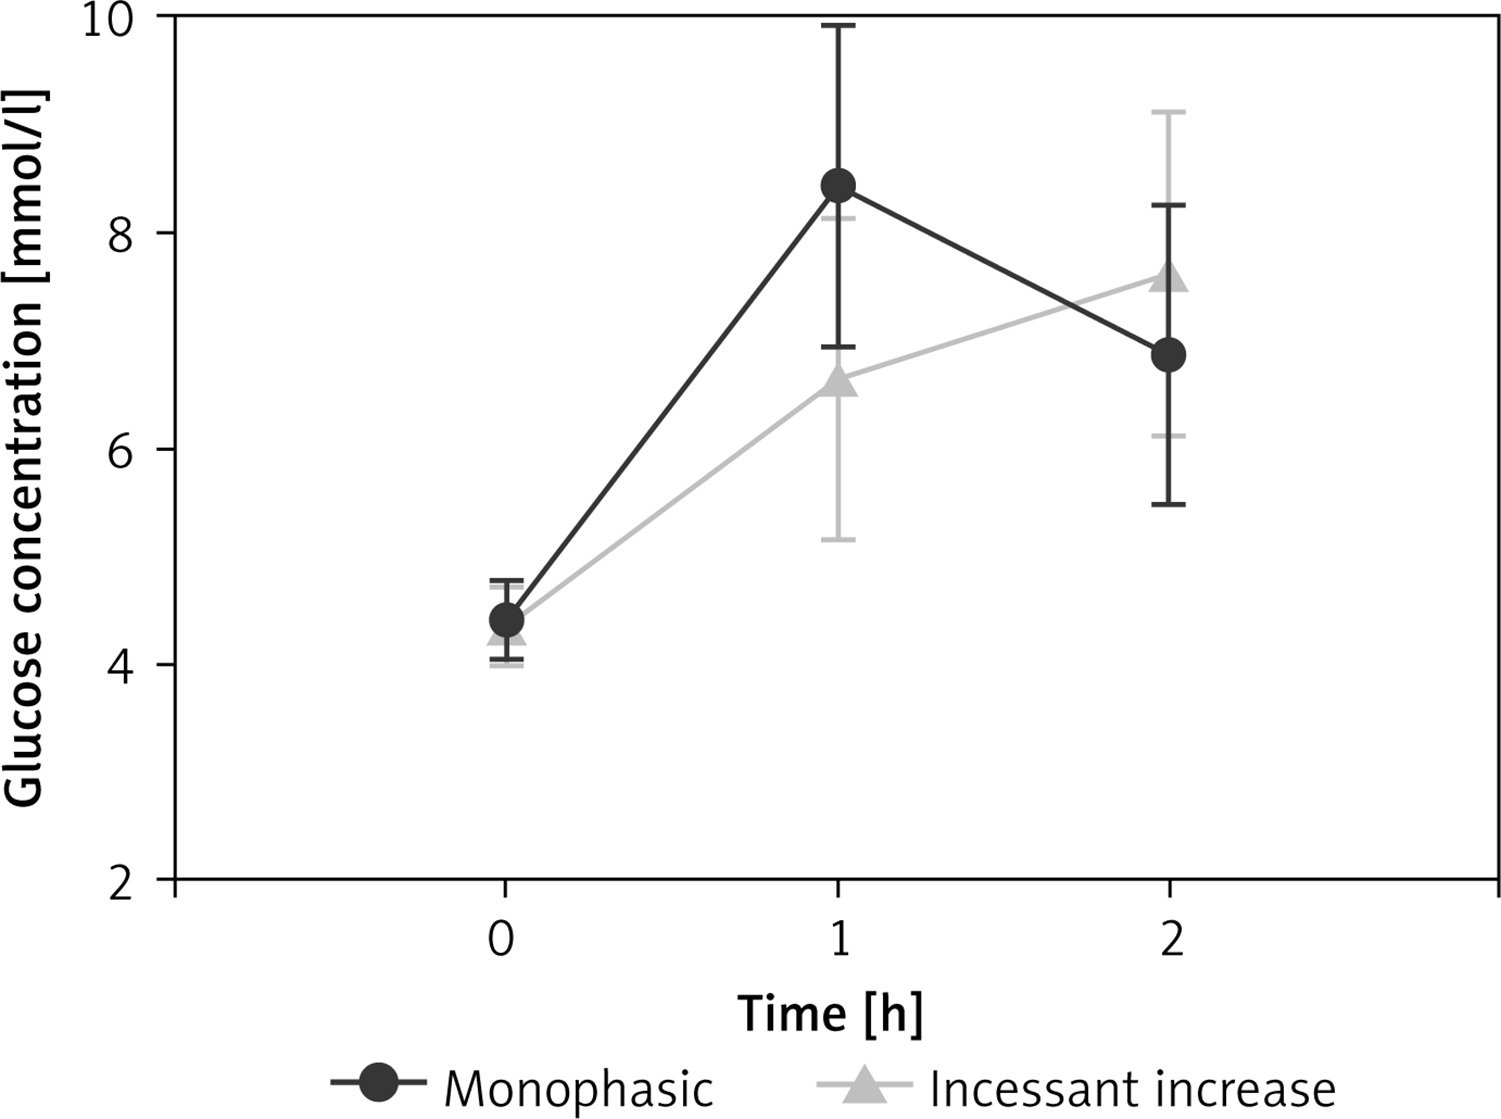
The incessant increase curve is defined as a consecutive increase in glucose concentration, with each increment being ≥ 0.25 mmol/l. The monophasic curve is characterized by a gradual increase in glucose concentration until it reaches a peak at 1 h (increase ≥ 0.25 mmol/l), followed by a subsequent decrease in glucose of ≥ 0.25 mmol/l. We adopted the previous practice [11, 12] of using a plasma glucose threshold of 0.25 mmol/l to minimize fluctuations in glucose concentrations caused by the method of glucose analysis rather than physiological reasons.
The diagnosis of GDM used the IADPSG/WHO criteria that one or more 75 g OGTT had glucose values equal to or above the following thresholds: fasting plasma glucose (FPG) 5.1 mmol/l, 1-h plasma glucose (1-h PG) 10.0 mmol/l, and 2-h plasma glucose (2-h PG) 8.5 mmol/l [19].
Preterm birth refers to births occurring before the completion of 37 weeks of gestation, according to the World Health Organization [14].
Body mass index (BMI) is calculated as weight (kg) divided by height squared (m2). BMI was categorized as underweight, normal weight, overweight, or obese, corresponding to < 18.5, 18.5–23.9, 24–28, and > 28 kg/m2, respectively [20].
The gestational weight gain (GWG) refers to the difference between pre-delivery and preconception weight. According to the 2009 guidelines of the Institute of Medicine [21], adequate GWG ranges were defined as follows: 12.5–18.0 kg for underweight individuals, 11.5–16.0 kg for those with normal weight, 7.0–11.5 kg for overweight individuals, and 5.0–9.0 kg for individuals with obesity, respectively. Inadequate GWG was defined when falling below these thresholds, while excess GWG was defined when exceeding them.
Gestational hypertension is characterized by a systolic blood pressure exceeding 140 mm Hg and/or diastolic blood pressure surpassing 90 mm Hg at ≥ 20 weeks of gestation in a previously normotensive woman [22].
Preeclampsia is defined as the presence of one or more of the following conditions, based on the diagnosis of gestational hypertension: proteinuria or new end-organ dysfunction [22].
Maternal infections associated with preterm birth encompass human immunodeficiency virus, bacterial vaginosis, chlamydia trachomatis, chorioamnionitis, urinary tract infections, hepatitis C, malaria, and syphilis [23].
OGTT
The 75-gram OGTT with venous plasma glucose measurements was conducted on all subjects between 24 and 28 weeks of gestation during outpatient visits. The test was performed after an overnight fast, and venous blood samples were collected at 0, 1, and 2 h.
Clinical data and biochemical indicators
The demographic information of the participants was obtained from the hospital information system, which included data on maternal age, preconception weight, height, ethnicity, parity, gravidity, in vitro fertilization (IVF), GWG, gestational age, and comorbidities. The laboratory information system provided measurements of FPG, 1h-PG, and 2h-PG. Plasma samples were analyzed for glucose using a hexokinase method on the Architect C16000 chemistry analyzer (Abbott, USA) in the clinical laboratory department of the hospital.
Statistical analysis
Statistical analyses were performed using IBM SPSS 20.0 (New York, USA) for data analysis, while GraphPad Prism 8.0 (California, USA) was used to generate figures. The mean ± standard deviation (SD) was used to present measurement data. Incidence data were presented as numbers and frequencies [n (%)]. The independent-sample t-test was used for comparisons between two groups. The χ2 test was utilized to compare categorical variables across groups. Logistic regression analyses were conducted to determine the relative risks (RRs) and 95% confidence intervals (CIs) for each model, with or without adjustments for potential covariates. A significance level of p < 0.05 was considered statistically significant.
Results
Baseline characteristics according to the glucose response curve
A total of 14.46% of subjects exhibited an IIn pattern in the glucose response curve, while 85.54% displayed an MPh curve (Table I). Figure 2 illustrates the average glucose levels during OGTT for each group, and further analysis was conducted on the baseline characteristics of both groups. Compared to the MPh group, individuals in the IIn group had significantly lower age and BMI values, a lower rate of IVF, higher levels of 2h-PG but lower FPG and 1h-PG levels, as well as a higher incidence of GDM (all p < 0.05). Additionally, there were significant differences in parity and gravidity between the two groups (all p < 0.05). Moreover, the IIn group exhibited a significantly lower incidence of gestational hypertension and preeclampsia, while demonstrating a higher rate of abnormal uterine structure compared to the MPh group (all p < 0.05). No significant differences were observed regarding ethnicity, GWG, and maternal infection rate (all p > 0.05). Importantly, women with an IIn curve had a higher prevalence of preterm birth (6.10%) compared to those with an MPh curve (5.13%) (p < 0.05).
Table I
Baseline characteristics of participants with incessant increase versus monophasic glucose response curves during an OGTT test
[i] Continuous variables are presented as mean ± standard deviation. Categorical data are presented as frequency (percentage). OGTT – oral glucose tolerance test, BMI – body mass index, IVF – in vitro fertilization, FPG – fasting plasma glucose, 1h-PG – 1-hour plasma glucose, 2h-PG – 2-hour plasma glucose, GDM – gestational diabetes mellitus.
Baseline characteristics according to preterm birth status
The demographic characteristics of participants, stratified by preterm birth status and categorized based on the presence or absence of GDM, are presented in Table II. The prevalence of preterm birth among participants was 5.27% (1,376/26,092). Furthermore, both the GDM-positive group and the GDM-negative group with preterm birth exhibited a higher proportion of inadequate GWG, a lower proportion of inadequate and excess GWG, a higher rate of IVF, gestational hypertension, preeclampsia, maternal infection, and abnormal uterus structure compared to the term birth group (all p < 0.01). Additionally, the proportion of elderly pregnant women was higher in the GDM-associated preterm birth group, while it was lower in the GDM-negative group (all p < 0.001). Moreover, overweight and obese pregnant women were more prevalent among those with preterm birth complicated by GDM (all p < 0.01). Significant differences were also observed between the two groups regarding parity and gravidity (all p < 0.001), while no statistically significant difference was found in terms of ethnicity (p > 0.05). In relation to OGTT results, participants in the preterm birth group had significantly lower FPG and 1h-PG levels but higher levels at 2 h after glucose load compared to those in the term birth group among women with GDM-positive status (all p < 0.001). Additionally, participants in the preterm birth group showed significantly higher levels at 1 h and 2 h after glucose load compared to those in term births among women without GDM (all p < 0.01).
Table II
Baseline characteristics of participants stratified by preterm birth status
[i] Continuous variables are presented as mean ± standard deviation. Categorical data are presented as frequency (percentage). GDM – gestational diabetes mellitus, BMI – body mass index, IVF – in vitro fertilization, OGTT – oral glucose tolerance test, FPG – fasting plasma glucose, 1h-PG – 1-hour plasma glucose, 2h-PG – 2-hour plasma glucose.
Relative risks of preterm birth according to the glucose response curve
The risk of preterm birth was assessed among individuals with different glucose response curves in varying GDM statuses, using individuals exhibiting an MPh curve as the reference group. Logistic regression analysis was employed to evaluate these risks (Table III). In the crude model, prior to any adjustments being made, individuals with an IIn curve demonstrated a higher risk of preterm birth compared to those in the MPh group among GDM-positive women, yielding a corresponding RR and 95% CI of 1.38 (1.07–1.77) (p < 0.05). After adjusting for covariates including maternal age, preconception BMI, ethnicity, parity, gravidity, IVF, GWG, FPG, 1h-PG, 2h-PG, gestational hypertension, preeclampsia, maternal infection and abnormal uterus structure in the adjusted model, both GDM-positive [adjusted RR = 1.87 (1.27–2.76), p < 0.01] and GDM-negative women [adjusted RR = 1.35 (1.03–1.77), p < 0.05] still demonstrated an elevated adjusted risk of preterm birth among individuals with IIn curves.
Table III
Relative risks and 95% CIs of preterm birth according to the glucose response curve
| Glucose response curve | N (%) | Relative risk (95% CI) | |||
|---|---|---|---|---|---|
| Crudea | P-value | Adjustedb | P-value | ||
| GDM-positive | |||||
| Monophasic | 5,021 (94.42) | Reference | Reference | ||
| Incessant increase | 297 (5.58) | 1.38 (1.07–1.77) | 0.013 | 1.87 (1.27–2.76) | 0.002 |
| GDM-negative | |||||
| Monophasic | 17,895 (86.14) | Reference | Reference | ||
| Incessant increase | 2,879 (13.86) | 1.09 (0.91–1.31) | 0.349 | 1.35 (1.03–1.77) | 0.029 |
b adjusted for maternal age, preconception body mass index, ethnicity, parity, gravidity, in vitro fertilization, gestational weight gain, fasting plasma glucose, 1-hour plasma glucose, 2-hour plasma glucose, gestational hypertension, preeclampsia, maternal infection and abnormal uterus structure. CI – confidence interval, GDM – gestational diabetes mellitus.
The relationship between two glucose response curves and preterm birth in women with varying demographic parameters
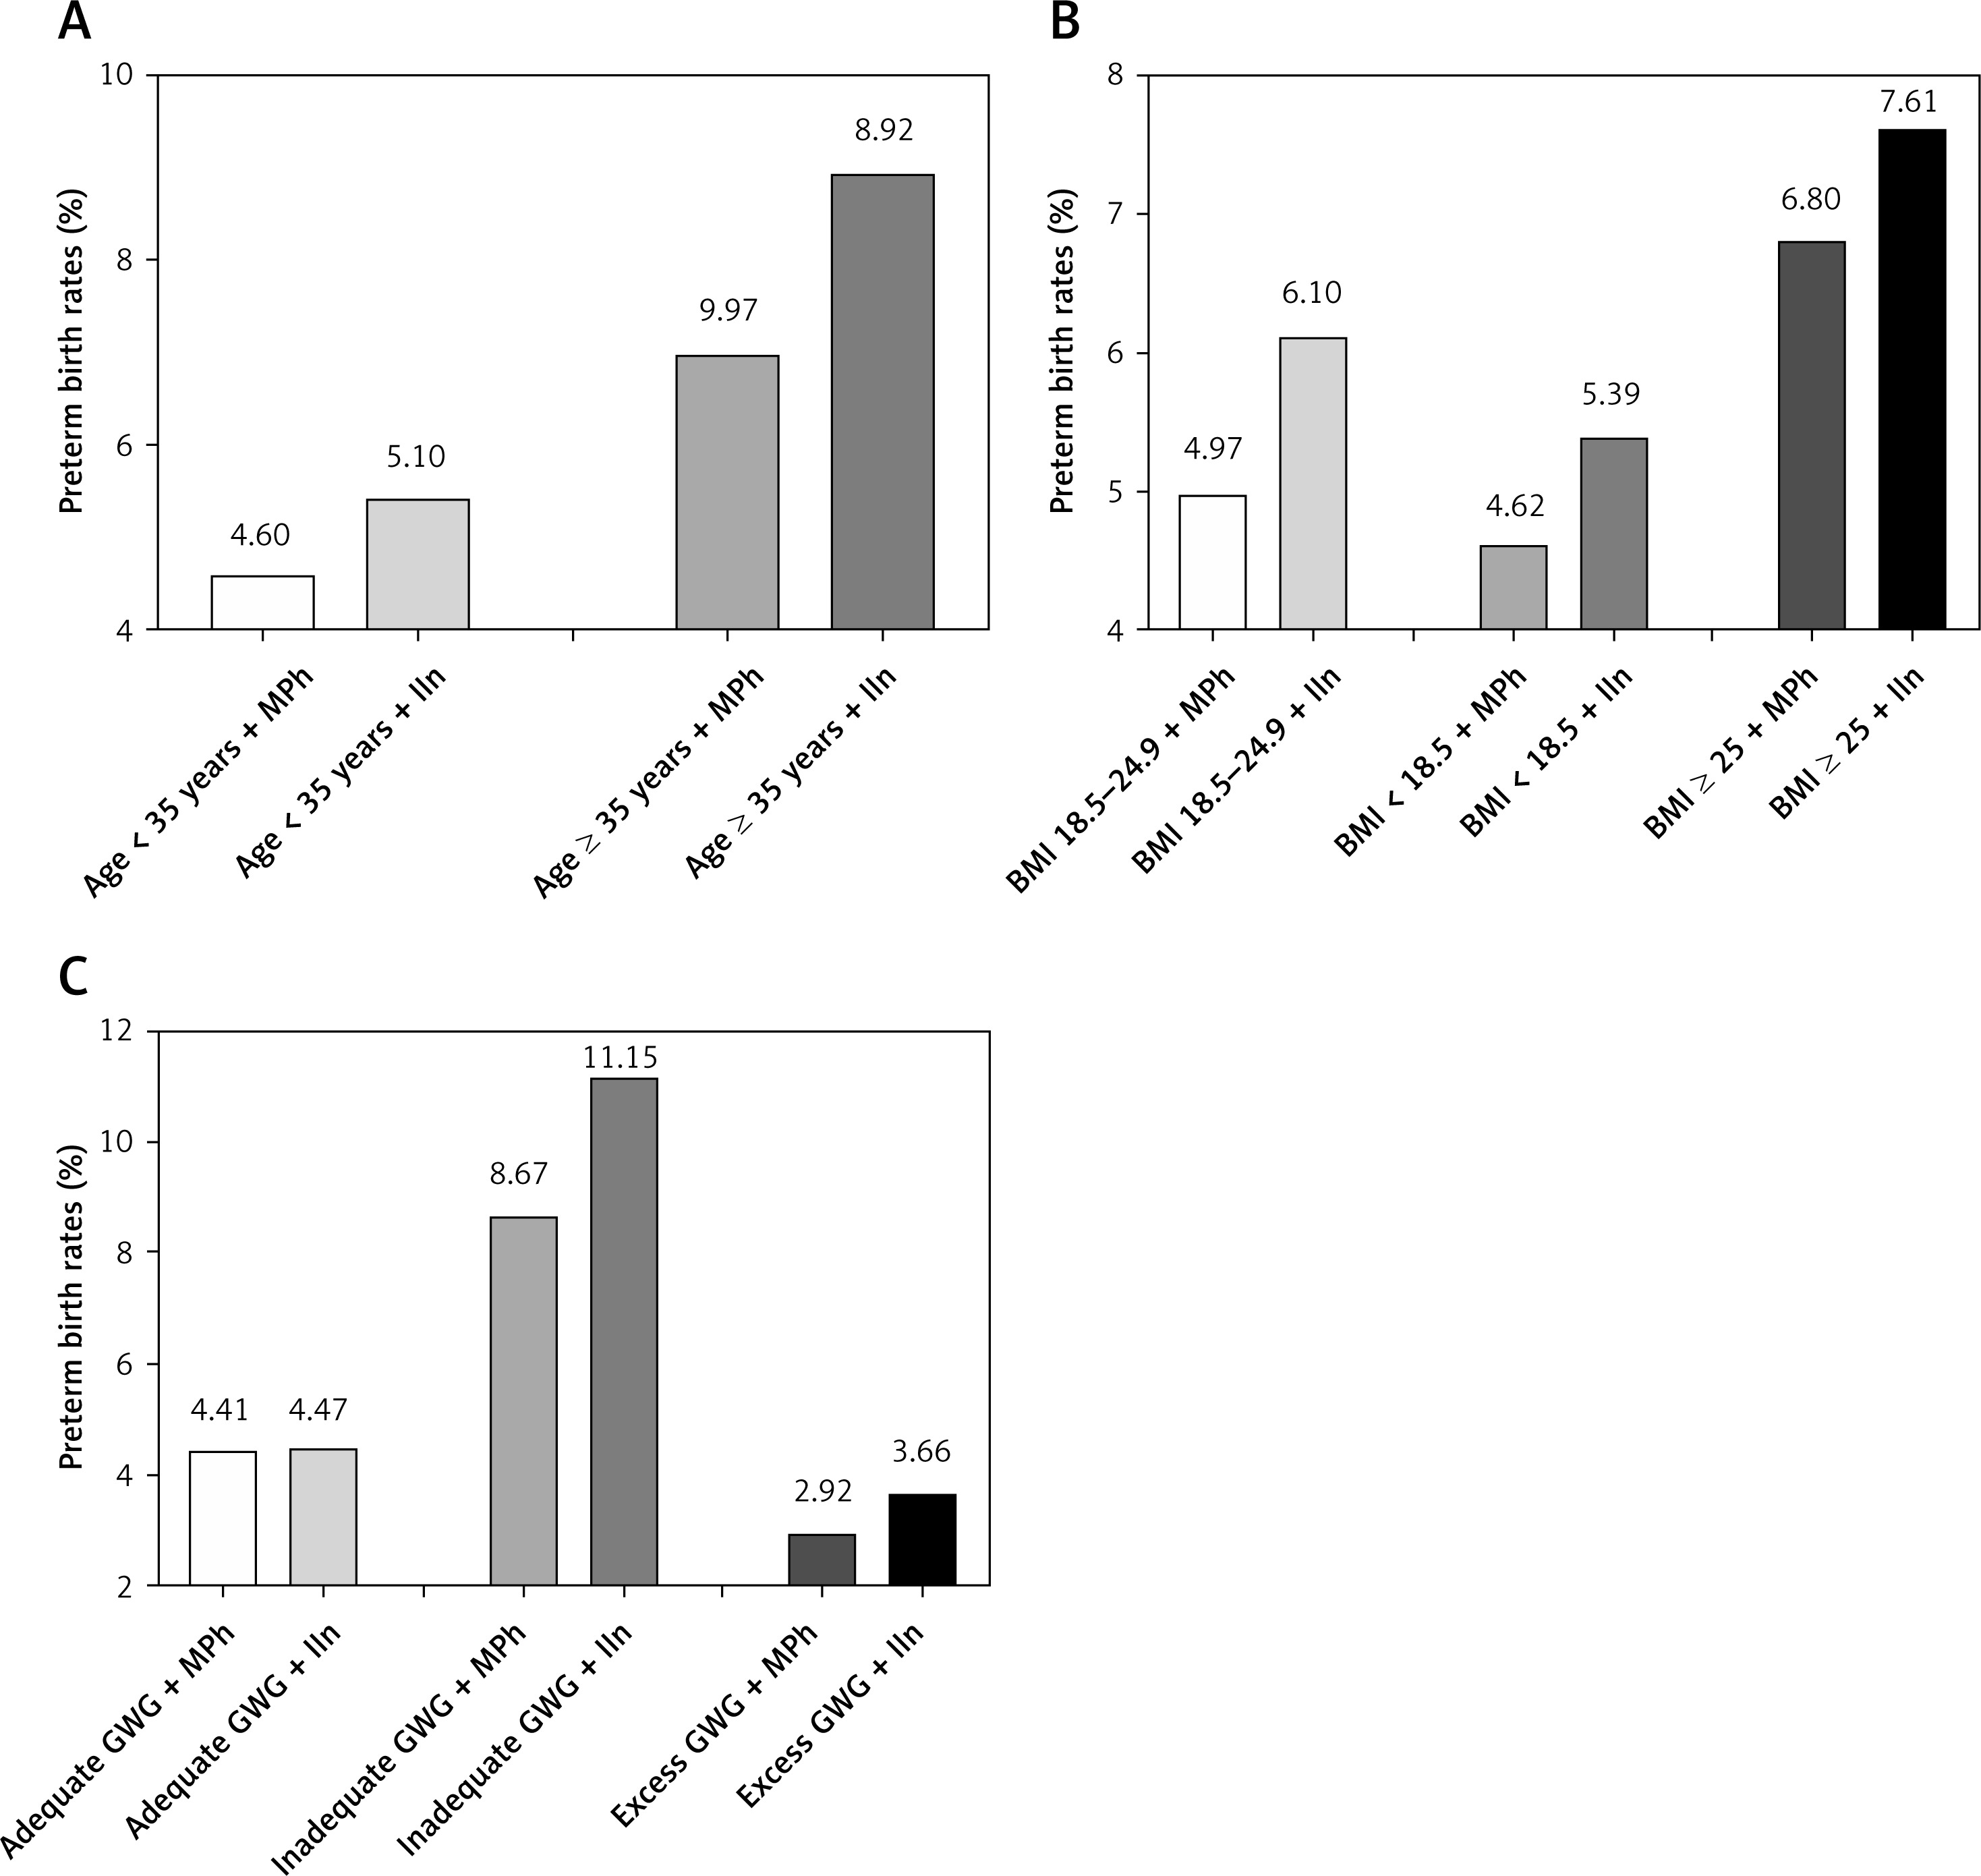
Factors such as maternal age, BMI, and GWG are commonly associated with preterm birth. We categorized these factors and examined whether there were still disparities between two different glucose response curves. Maternal age was divided into two groups: ≥ 35 years and < 35 years; BMI was classified as normal weight (BMI: 18.5–24.9 kg/m2), underweight (BMI < 18.5 kg/m2), and overweight/obese (≥ 25 kg/m2); GWG was divided into adequate GWG, inadequate GWG, and excess GWG. Furthermore, we further subdivided these groups into IIn and MPh subgroups. In comparison to the MPh group, all IIn subgroups exhibited a numerically higher incidence of preterm birth (Figure 3).
Figure 3
Preterm birth rates in pregnant women with different demographic parameters in the monophasic and incessant increase groups. A – Preterm birth rates in two shapes of glucose response curve in different maternal ages. B – Preterm birth rates in two shapes of glucose response curve in different preconception BMI classifications. C – Preterm birth rates in two shapes of glucose response curve in different GWG classifications
MPh – monophasic, IIn – incessant increase, BMI – body mass index, GWG – gestational weight gain.
Relative risks of preterm birth based on the glucose response curve in women with varying demographic parameters
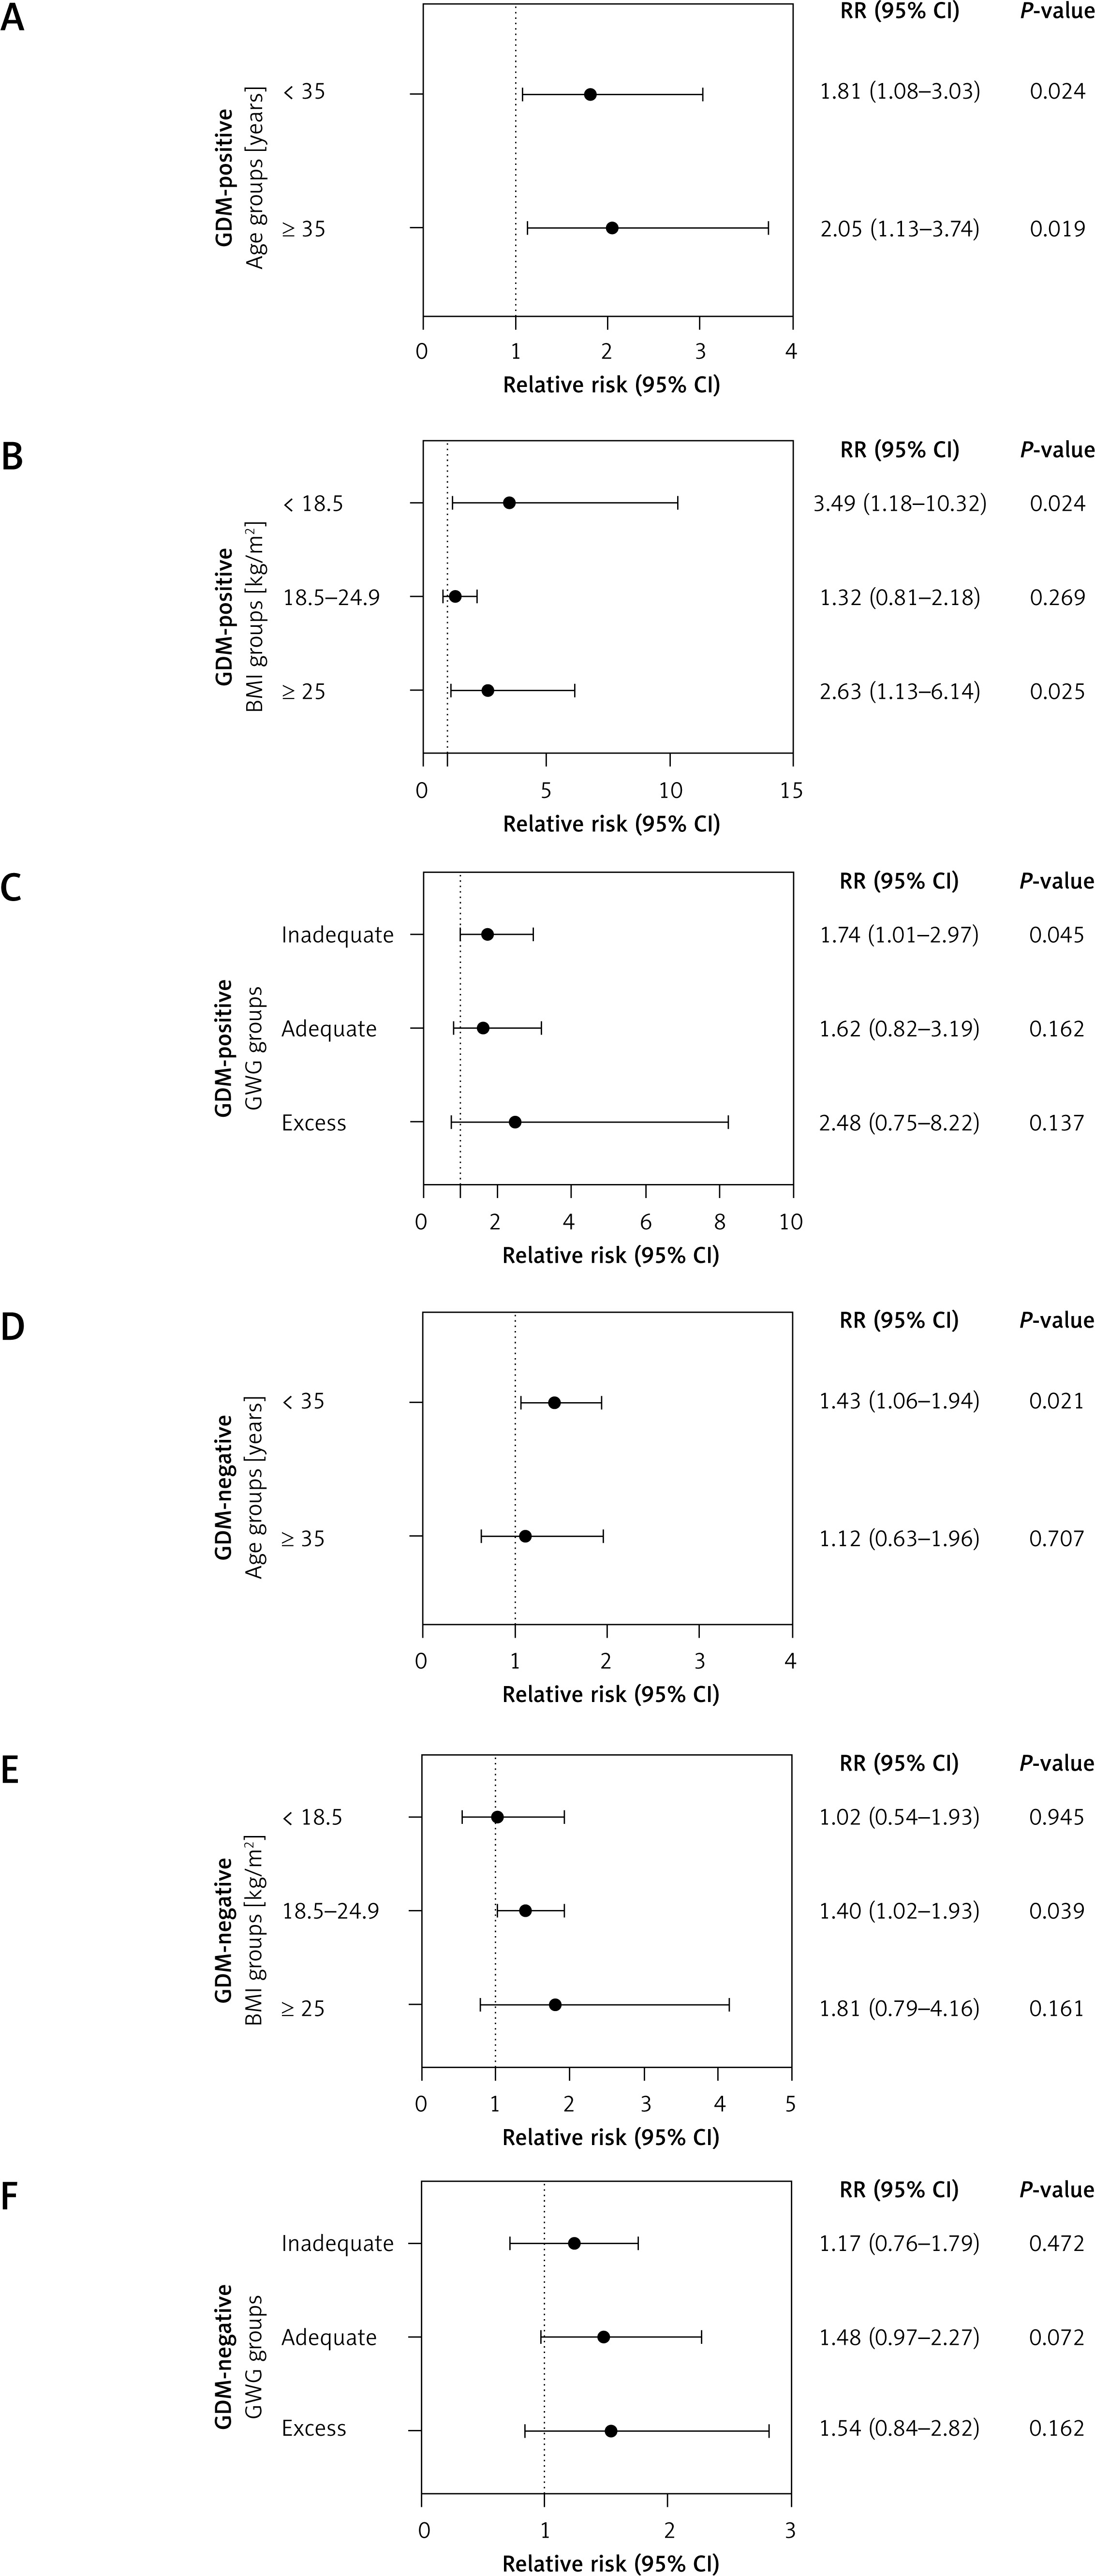
Afterward, we proceeded to discuss the relative risk of preterm birth in the IIn group compared to the MPh group among different subgroups with varying GDM status and demographic factors such as maternal age, BMI, and GWG (Tables IV, V and Figure 4). The findings revealed that individuals in the IIn group exhibited a significantly higher adjusted risk for preterm birth among women aged < 35 years both in the presence of GDM [adjusted RR = 1.81 (1.08–3.03), p < 0.05] (Figure 4 A) and in its absence [adjusted RR = 1.43 (1.06–1.94), p < 0.05] (Figure 4 D). Furthermore, it was observed that individuals in the IIn group had a significantly higher adjusted risk for preterm birth among underweight women [adjusted RR = 3.49 (1.18–10.32), p < 0.05] and overweight/obese women [adjusted RR = 2.63 (1.13–6.14), p < 0.05] in those with GDM-positive status (Figure 4 B) and among those with normal weight without GDM [adjusted RR = 1.40 (1.02–1.93), p < 0.05] (Figure 4 E). Lastly, the results indicated that individuals in the IIn group with GDM exhibited a significantly elevated adjusted risk for preterm birth among those who experienced inadequate GWG [adjusted RR = 1.74 (1.01–2.97), p < 0.05] (Figure 4 C). However, in the GDM-negative population, no significant correlation was observed between different GWG groups in glucose response curve and preterm birth (Figure 4 F).
Table IV
Relative risks and 95% CIs of preterm birth risk based on the glucose response curve in GDM-positive women with varying demographic parameters
| Groups | N (%) | Adjusted relative riska | P-value |
|---|---|---|---|
| Age + glucose response curve | |||
| Age < 35 years + MPh | 2,986 (56.15) | Reference | |
| Age < 35 years + IIn | 610 (11.47) | 1.81 (1.08–3.03) | 0.024 |
| Age ≥ 35 years + MPh | 1,439 (27.06) | Reference | |
| Age ≥ 35 years + IIn | 283 (5.32) | 2.05 (1.13–3.74) | 0.057 |
| BMI + glucose response curve | |||
| BMI 18.5–24.9 kg/m2 + MPh | 2,966 (55.78) | Reference | |
| BMI 18.5–24.9 kg/m2 + IIn | 623 (11.71) | 1.32 (0.81–2.18) | 0.269 |
| BMI < 18.5 kg/m2 + MPh | 576 (10.83) | Reference | |
| BMI < 18.5 kg/m2 + IIn | 141 (2.65) | 3.49 (1.18–10.32) | 0.024 |
| BMI ≥ 25 kg/m2 + MPh | 883 (16.60) | Reference | |
| BMI ≥ 25 kg/m2 + IIn | 129 (2.43) | 2.63 (1.13–6.14) | 0.025 |
| GWG + glucose response curve | |||
| Adequate GWG + MPh | 1,827 (34.36) | Reference | |
| Adequate GWG + IIn | 350 (6.58) | 1.62 (0.82–3.19) | 0.162 |
| Inadequate GWG + MPh | 1,673 (31.46) | Reference | |
| Inadequate GWG + IIn | 385 (7.24) | 1.74 (1.01–2.97) | 0.045 |
| Excess GWG + MPh | 925 (17.39) | Reference | |
| Excess GWG + IIn | 158 (2.97) | 2.48 (0.75–8.22) | 0.137 |
a Adjusted for maternal age, preconception body mass index, ethnicity, parity, gravidity, in vitro fertilization, gestational weight gain, fasting plasma glucose, 1-hour plasma glucose, 2-hour plasma glucose, gestational hypertension, preeclampsia, maternal infection and abnormal uterus structure. The relative risks of preterm birth were evaluated among individuals in two response glucose curves, where those displaying a monophasic curve are considered as the reference group. CI – confidence interval, GDM – gestational diabetes mellitus, MPh – monophasic, IIn – incessant increase, BMI – body mass index, GWG – gestational weight gain.
Table V
Relative risks and 95% CIs of preterm birth risk based on the glucose response curve in GDM-negative women with varying demographic parameters
| Groups | N (%) | Adjusted relative riska | P-value |
|---|---|---|---|
| Age + glucose response curve | |||
| Age < 35 years + MPh | 14,325 (68.96) | Reference | |
| Age < 35 years + IIn | 2,422 (11.66) | 1.43 (1.06–1.94) | 0.021 |
| Age ≥ 35 years + MPh | 3,570 (17.18) | Reference | |
| Age ≥ 35 years + IIn | 457 (2.20) | 1.12 (0.63–1.96) | 0.707 |
| BMI + glucose response curve | |||
| BMI 18.5–24.9 kg/m2 + MPh | 12,488 (60.12) | Reference | |
| BMI 18.5–24.9 kg/m2 + IIn | 2,002 (9.64) | 1.40 (1.02–1.93) | 0.039 |
| BMI < 18.5 kg/m2 + MPh | 3,497 (16.83) | Reference | |
| BMI < 18.5 kg/m2 + IIn | 638 (3.07) | 1.02 (0.54–1.93) | 0.945 |
| BMI ≥ 25 kg/m2 + MPh | 1,910 (9.19) | Reference | |
| BMI ≥ 25 kg/m2 + IIn | 239 (1.15) | 1.81 (0.79–4.16) | 0.161 |
| GWG + glucose response curve | |||
| Adequate GWG + MPh | 8,191 (39.43) | Reference | |
| Adequate GWG + IIn | 1,306 (6.29) | 1.48 (0.97–2.27) | 0.072 |
| Inadequate GWG + MPh | 4,323 (20.81) | Reference | |
| Inadequate GWG + IIn | 664 (3.19) | 1.17 (0.76–1.79) | 0.472 |
| Excess GWG + MPh | 5,381 (25.90) | Reference | |
| Excess GWG + IIn | 909 (4.38) | 1.54 (0.84–2.82) | 0.162 |
a Adjusted for maternal age, preconception body mass index, ethnicity, parity, gravidity, in vitro fertilization, gestational weight gain, fasting plasma glucose, 1-hour plasma glucose, 2-hour plasma glucose, gestational hypertension, preeclampsia, maternal infection and abnormal uterus structure. The relative risks of preterm birth were evaluated among individuals in two response glucose curves, where those displaying a monophasic curve are considered as the reference group. CI – confidence interval, GDM – gestational diabetes mellitus, MPh – monophasic, IIn – incessant increase, BMI – body mass index, GWG – gestational weight gain.
Figure 4
Relative risks of preterm birth in pregnant women with different demographic parameters in the monophasic and incessant increase groups with different GDM status. The relative risks of preterm birth are evaluated among individuals in two response glucose curves, where those displaying a monophasic curve are considered as the reference group. A – Relative risks of preterm birth in two shapes of glucose response curve in GDM-positive women of different maternal ages. B – Relative risks of preterm birth in two shapes of glucose response curve in GDM-positive women of different preconception BMI classifications. C – Relative risks of preterm birth in two shapes of glucose response curve in GDM-positive women of different GWG classifications. D – Relative risks of preterm birth in two shapes of glucose response curve in GDM-negative women of different maternal ages. E – Relative risks of preterm birth in two shapes of glucose response curve in GDM-negative women of different preconception BMI classifications. F – Relative risks of preterm birth in two shapes of glucose response curve in GDM-negative women of different GWG classifications
GDM – gestational diabetes mellitus, RR – relative risk, CI – confidence interval, BMI – body mass index, GWG – gestational weight gain
Discussion
In this study, our objective was to assess the prevalence and characteristics of participants presenting with different OGTT glucose response curves and investigate the potential association between the rare OGTT shape and preterm birth. Our findings indicated that monophasic (85.54%) and incessant increase (14.46%) were the predominant OGTT curve shapes observed in pregnant Chinese women. Furthermore, logistic regression analysis revealed a significantly higher risk of preterm birth among individuals in the IIn group compared to those in the MPh group after adjusting for various confounding factors, regardless of GDM status. Interestingly, in comparison with the MPh group, the IIn group showed numerically higher incidence of preterm birth across different demographic factors such as maternal age, preconception BMI and GWG. Additionally, the adjusted risks of preterm birth varied depending on these demographic factors.
The occurrence of preterm birth has significant consequences and is characterized by a complex and multifactorial pathogenesis, with numerous established or hypothesized risk factors associated with its development. However, many cases occur in women without any identifiable risk factors. Therefore, there is an urgent need for effective approaches to accurately identify individuals at high risk for preterm birth, as this will have significant clinical implications for preventing disease progression. Previous studies have primarily focused on monophasic, biphasic, or triphasic patterns in relation to the various characteristics of OGTT shapes and their association with different outcomes. In contrast, our study specifically examined FPG, 1h-PG, and 2h-PG analyses commonly employed during prenatal check-ups for pregnant women in China, where obtaining monophasic, biphasic, or triphasic results is not possible. Among pregnant Chinese women participating in our study, the predominant OGTT curve shapes identified were monophasic and incessant increase. Similar to our findings, previous studies conducted on non-diabetic individuals have also reported that the monophasic response curve is the most common phenotype [7, 8, 24–26]. In the TODAY cohort study, which focused on younger individuals with diabetes, an incessant increase curve was observed in up to 21.7% of participants, while a monophasic pattern accounted for 68.6% [11]. Another study conducted in Japan examined OGTT curves among elderly adults with diabetes mellitus and found that monophasic curves were prevalent in 66.7% of cases, whereas incessant increase patterns were observed in 20.0% [27]. It is worth noting that some studies exclude participants with incessant increase curves and categorize them as having “anomalous” [28] or “unclassified” shape [6, 10], resulting in limited information regarding the distributional characteristics of normal populations exhibiting incessant increase curves. To date, only a few studies have reported on incessant increase glucose response curves; however, none have specifically investigated this phenomenon among pregnant women. Therefore, it remains unknown how the incessant increase response curve correlates with pathophysiological changes during pregnancy and its association with preterm birth.
Several studies have demonstrated a correlation between the IIn curves and glucose tolerance, insulin sensitivity, and pancreatic β-cell function [7, 10, 24, 29]. The essential feature of the IIn pattern is, in fact, the time delay in reaching peak glucose levels. The profiles for insulin and C peptide indicate a sluggish response to glucose in individuals with an IIn glucose response curve [30]. The rise in glucose concentration that triggers insulin secretion also appears to be somewhat delayed; one possible explanation for this delay could be delayed gastric emptying or glucose absorption [30]. Wang et al.’s research revealed that a delayed time to reach peak glucose indicated decreased insulin sensitivity and secretion, while slower rates of decrease in glucose levels and increased in insulin suggest impaired pancreatic β-cell function and aggravated insulin resistance [31]. Kramer et al. similarly pointed out that a delayed timing of post-challenge peak glucose level was linked to declining β-cell function and worsening glucose tolerance over time [32]. Furthermore, research has shown that as the delay in reaching peak glucose increases, there is an escalation in the severity of glucose toxicity [33, 34], and this postprandial hyperglycemia state can lead to inflammation, oxidative stress, and endothelial dysfunction [35, 36], which are key mechanisms underlying preterm birth [37–41]. These factors may partially account for the increased risk of preterm birth observed in participants with an incessant increase curve during pregnancy, potentially involving aforementioned mechanisms such as inflammation, oxidative stress, and endothelial dysfunction.
Given the potential association between IIn curve and preterm birth, as well as the existing research gaps in this area, our study aimed to address this gap by examining the correlation between OGTT shape and preterm birth. Our findings revealed significantly higher rates of preterm birth and elevated risks among individuals in the rare incessant increase group compared to those in the majority of the monophasic group. Importantly, this heightened risk persisted even after adjusting for various confounding factors. Fortunately, previous studies have demonstrated that intensive treatment can modify peak OGTT glucose levels in individuals with early-stage diabetes while simultaneously reversing β-cell dysfunction. This improvement ultimately leads to remission of diabetic symptoms [42]. Furthermore, considering that a significant number of individuals display an IIn pattern and are at higher risk for preterm birth, it would be intriguing and clinically valuable to investigate whether it is possible to modify the pattern of OGTT curves through various interventions such as lifestyle modifications or insulin therapy, with the ultimate aim being reversal or prevention of adverse outcomes associated with preterm birth.
To date, numerous risk factors have been identified in association with preterm birth, including advanced maternal age, obesity and GWG [43–47]. However, due to the lack of studies examining the relationship between OGTT shapes and preterm birth in conjunction with these important risk factors, further research is needed. Therefore, we conducted a stratified analysis based on maternal age, preconception BMI and GWG. When compared with the monophasic group, all different classifications of demographic factors (maternal age, preconception BMI, and GWG) showed a higher incidence of preterm birth; moreover, the risk of preterm birth in the IIn group varied according to different demographic parameters. Combining OGTT shapes with well-established risk factors such as maternal age, BMI, GDM status, and GWG can help identify pregnant women at high risk for developing preterm birth early on so that timely intervention can be taken to safeguard maternal and infant health. Moreover, intriguingly, this study yielded a thought-provoking and contradictory finding. Not only did we discover an elevated risk of preterm birth in women with IIn curves, but we also observed an increased incidence of GDM. However, it is noteworthy that the population with IIn curves was characterized by a younger age and lower BMI, which challenges the traditional concept that older age and higher BMI are risk factors for preterm birth and GDM. Thus, there may be other influential factors at play in these specific pathophysiological conditions. It was observed that the fasting plasma ghrelin levels were significantly lower in the IIn curve group compared to the MPh curve group, while the incremental ghrelin at 2 h was significantly higher in the IIn curve group. Enriched insulin receptors were observed in ghrelin secretion cells, and insulin exerted an inhibitory effect on ghrelin secretion. In individuals with an IIn profile, impaired insulin secretion weakens its inhibitory effect on ghrelin, leading to abnormal levels of this hormone. This disruption interferes with normal blood glucose regulation and results in a sustained increase in blood glucose levels [13]. Gut hormones play a crucial role in regulating the gastric emptying rate, which subsequently affects the rate of glucose entry into the bloodstream and influences the blood glucose response curve. If gastric emptying is too rapid, there can be a swift rise in blood glucose levels; conversely, delayed or slowed gastric emptying may lead to a slower increase in blood glucose [48]. There are complex interactions among various hormones that collectively impact glycemic profiles, potentially outweighing any opposing effects caused by age and BMI alone. Ultimately, women with IIn profiles may have higher rates of preterm birth and GDM. However, identifying the underlying mechanism responsible for the phenomenon requires further investigation.
This study possesses several strengths that contribute to its significance. Firstly, unlike previous studies that focused on non-pregnant populations such as middle-aged or young adults and concentrated solely on monophasic, biphasic, or multiphasic curves, our study specifically examined the distribution of OGTT curve shapes and corresponding clinical features in pregnant Chinese women. It provided evidence of a potential association between the shape of the OGTT curve and preterm birth risk in this population, which had not been previously reported in pregnant women. Secondly, maternal age, preconception BMI, and GWG should be taken into consideration when determining the relationship between the OGTT shape and preterm birth. Lastly, our study boasted a large sample size for research conducted on this topic, thus increasing confidence in the outcomes.
However, there are limitations to this study. Firstly, the analysis is limited to a single center, which poses challenges for generalizing the results. Secondly, due to its retrospective nature, we were unable to gather data on lifestyle interventions or treatments received by these women or evaluate their therapeutic efficacy. Thirdly, there is a lack of information regarding insulin sensitivity and β-cell function in these pregnant women – parameters typically excluded from routine examinations. Fourthly, certain residual confounders, such as dietary nutrition, drinking status, smoking habits, exercise, and other potential variables, could not be collected, potentially influencing outcomes. Lastly, in our study population there was a limited number of individuals exhibiting valley-shaped OGTT curves. However, due to the small sample size we have concerns regarding potential result bias; therefore, after careful consideration we refrained from analyzing this subgroup.
In conclusion, our study demonstrates that the utilization of OGTT as a well-implemented prenatal diagnostic test not only enables the identification of women with GDM but also facilitates the detection of women at an increased risk of preterm birth strongly associated with the IIn curve. Importantly, when evaluating the association between OGTT shapes and preterm birth, it is crucial to consider maternal age, preconception BMI, and GWG. The identification of this previously unrecognized high-risk group allows for more rigorous follow-up during pregnancy and has the potential to reduce adverse complications from preterm birth in high-risk women. Although the proportion of individuals exhibiting an incessant increase curve is relatively small compared to those with monophasic patterns, its overall count remains significant, necessitating additional attention from clinicians.