Introduction
β-thalassemia is an autosomal recessive disorder caused by a quantitative defect in β-globin synthesis, leading to impaired hemoglobin production and ineffective erythropoiesis with varying degrees of anemia [1]. Globally, over 30,000 new cases of β-thalassemia cases are reported each year, with the majority occurring in developing countries [2]. Classification of β-thalassemia is based on either the level of β-globin reduction [3] or the necessity for regular blood transfusions [1]. Gene expression and epigenetic regulation play crucial roles in the production of hemoglobin chains, with distinct regulatory mechanisms influencing the pathogenesis of β-thalassemia which exacerbate thalassemia severity and associated complications such as ineffective erythropoiesis and iron overload [1, 4]. Additional contributors to these complications include abnormal regulation of iron metabolism markers like ferritin [5] and hepcidin [6], and erythropoietic regulators such as erythropoietin (EPO) [7], growth differentiation factor 15 (GDF-15) [8], and erythroferrone (ERFE) [9, 10].
Long non-coding RNAs (LncRNAs) are emerging as critical regulators in various biological processes, including hematopoiesis. Disruption in LncRNA expression has been linked to impaired hemoglobin synthesis and anemia [11]. Recent studies have identified several LncRNAs as potential biomarkers or contributors to the pathology of cardiovascular, metabolic, thalassemia and neoplastic diseases. These include antisense non-coding RNA in the INK4 locus (ANRIL) [12, 13], growth arrest-specific 5 (GAS5) [14], H19 [15], Metastasis associated lung adenocarcinoma transcript 1 (MALAT1) [16], nuclear-enriched abundant transcript 1 (NEAT1) [17], and maternally expressed gene 3 (MEG3) [18]. Additional LncRNAs including LINC0133, SNGH20, and urothelial carcinoma associated 1 (UCA1) are implicated in gene expression regulation in hematological disorders [19]. Despite this growing body of research, the role of LncRNAs in regulating iron metabolism and erythropoiesis in β-thalassemia remains underexplored. To the best of our knowledge, this is the first study to investigate the expression of LncRNAs and their correlation with iron and erythropoiesis regulatory proteins in patients with transfusion-dependent-β-thalassemia (TDβ-T). These findings may offer novel insights into disease mechanisms and uncover potential therapeutic targets.
Material and methods
Study design and sample collection
This study was conducted from September 2022 to December 2023 and included 80 participants: 60 patients with TDβ-T and 20 healthy controls. Participants, aged 7–35 years and of both sexes, were recruited from the Department of Thalassemia and Hemophilia at Al-Zarqa Public Hospital, Jordan. Written informed consent was obtained from all participants, and the study was approved by the Institutional Review Board (IRB) of the Ministry of Health, Amman, Jordan.
From each participant, 10 ml of whole blood was collected and divided equally into EDTA and plain tubes. Clinical records were also obtained for all patients with TDβ-T. Blood samples from patients with thalassemia were collected immediately prior to their scheduled blood transfusions.
Quantitation of serum levels of hepcidin, GDF-15, erythropoietin and erythroferrone
Serum levels of hepcidin (Cat. MBS2700551, MyBioSource, USA), GDF-15 (Cat. BMS2258, ThermoFisher Scientific, USA), erythropoietin (Cat. BMS2035-2, ThermoFisher Scientific, USA), and erythroferrone (Cat. EH1681-HS, FineTest Biotech Inc., USA) were quantified using ELISA kits, following the manufacturer’s instructions.
Total RNA extraction and cDNA synthesis
Total RNA was extracted from the collected whole blood samples using the Direct-zol RNA Purification Kit (Zymo Research, USA) according to the manufacturer’s protocol. RNA purity and concentration were assessed using a NABI spectrophotometer (MicroDigital, Korea). Complementary DNA (cDNA) was synthesized using the PrimeScript™ RT Master Mix Kit (Takara, Japan) following the manufacturer’s instructions.
Quantitative real-time polymerase chain reaction (qRT-PCR)
Gene expression was quantified using a QuantGene 9600 thermal cycler (Bioer Technology, Japan) and TB Green® Premix Ex Taq™ _II (Tli RNase H Plus, Japan). Primers were sourced from Integrated DNA Technologies (IDT, Coralville, IA, USA) (Table I). Each qRT-PCR reaction was performed in a 20 µl final volume, containing 2 µl (60 ng) of cDNA, 10 µl of master TB green mix, 2 µl of (10 pmol/µl) primers, and 6 µl of nuclease free water. The thermal cycling conditions consisted of an initial denaturation at 95°C for 10 min, followed by 40 cycles of denaturation at 95°C for 30 s, annealing at 60°C for 30 s, and extension at 72°C for 30 s.
Table I
Sequences of the qRT-PCR primers
Statistical analysis
Continuous variables were expressed as mean ± standard deviation or median (min.–max.), depending on data distribution. Categorical variables were presented as frequencies (percentages). Fold changes relative to control mean were calculated using the delta-delta Ct method (2–ΔΔCt) and subsequently log2-transformed to get log2 fold changes. Differences between patients and controls were assessed using Welch’s two-sample t-test to account for unequal variances and sample sizes, or the Wilcoxon rank sum test for non-normal distributions. Correlation between log2 fold changes and other patient clinical parameters was assessed using Spearman correlation. The ability of the differentially expressed LncRNAs to distinguish between patients and controls was evaluated using receiver operating characteristic (ROC) curves. Additionally, DeLong test was used to assess if the area under the ROC curve was significantly different from 0.5. All analyses were conducted in R version 4.3.3 (2024-02-29 ucrt).
Results
Demographic characteristics, clinical parameters, and iron metabolism indices of the study population
The mean age and body mass index (BMI) were comparable between groups. Hematological parameters showed significant differences in mean values between the TDβ-T group/patients and controls, except for MCHC (Table II). Furthermore, mean liver enzyme levels were significantly increased in the TDβ-T group/patients compared to controls (p < 0.0001). Additionally, the mean urea level was significantly higher (p = 0.004), while the mean creatinine level was significantly lower (p < 0.0001) in the TDβ-T group (Table II).
Table II
Demographic, clinical, iron metabolism and erythropoiesis regulatory protein parameters for the study population
| Parameters | Control (N = 20) | TDβ-T (N = 60) | P-value |
|---|---|---|---|
| Demographic | |||
| Age [years] | 19.1 ±7 | 20.2 ±6.9 | 0.27 |
| BMI [kg/m2] | 21.2 ±1.3 | 21.5 ±2.6 | 0.31 |
| Gender: | |||
| Female, n (%) | 11 (55) | 30 (50) | – |
| Male, n (%) | 9 (45) | 30 (50) | – |
| Hematological | |||
| Hb [g/dl] | 13.5 ±1.6 | 8.6 ±0.9 | ***< 0.001 |
| RBC [106/µl] | 4.7 ±0.5 | 3.2 ±0.5 | ***< 0.001 |
| PCV (%) | 38.4 ±3.7 | 24.6 ±2.6 | ***< 0.001 |
| RDW (%) | 13.4 ±1.6 | 20.1 ±5.3 | ***< 0.001 |
| MCV [fl] | 81.7 ±6.1 | 77.4 ±6.2 | **< 0.01 |
| MCH [pg/l] | 28.7 ±3.0 | 27.0 ±2.8 | *< 0.05 |
| MCHC [g/dl] | 35.0 ±1.5 | 34.9 ±1.7 | 0.672 |
| WBC [103/µl] | 7.5 ±2.5 | 15.4 ±6.6 | ****< 0.0001 |
| Platelets [103/µl] | 291.1 ±78.9 | 618.9 ±78.9 | ****< 0.0001 |
| Biochemical | |||
| ALT [U/l] | 12.0 ±4.0 | 48.2 ±29.6 | ****< 0.0001 |
| AST [U/l] | 18.8 ±6.4 | 49.7 ±25.3 | ****< 0.0001 |
| ALP [U/l] | 83.6 ±24.1 | 163.5 ±79.5 | ****< 0.0001 |
| Urea [mg/l] | 22 ±5.4 | 29.4 ±15.3 | **0.004 |
| Creatinine [mg/l] | 0.6 ±0.2 | 0.4 ±0.3 | ****< 0.0001 |
| Iron metabolism variable | |||
| Ferritin [ng/ml] | 36.1 (17.7–165) | 2719 (160.0–14658) | ***< 0.001 |
| Iron [mg/dl] | 84.3 ±22.2 | 222 ±58.8 | ***< 0.001 |
| log2 ∆HAMP | –0.0 ±1.5 | 0.7 ±1.6 | 0.160 |
| log2 ∆GDF-15 | 0.0 ±0.9 | 4.4 ±2.1 | **< 0.01 |
| log2 ∆FAM132B | 0.0 ±1.2 | 0.9 ±1.5 | *< 0.05 |
| log2 ∆SLC40A1 | 0.0 ±1.3 | 0.8 ±1.3 | *< 0.05 |
| Hepcidin (pg/mL) | 133 (83.1–539) | 135 (29.2–337) | 0.645 |
| Erythropoiesis regulatory proteins | |||
| GDF-15 [pg/ml] | 135 (31–350) | 3907 (1276–7090) | ***< 0.001 |
| ERFF [pg/ml] | 317 (208–1108) | 628 (216–1518) | ***< 0.001 |
| EPO [mUI/ml] | 5.6 (0–27.8) | 156 (25.1–667) | ***< 0.001 |
Numeric variables are summarized as mean ± standard deviation or median (min-max), depending on normality. p-values indicate significance, as determined by Welch’s two-sample t-test. Significance levels are represented as follows:
**** p < 0.0001. TDβ-T – transfusion-dependent β-thalassemia, BMI – body mass index, WBC – white blood cells, RBC – red blood cells, PCV – packed cell volume, MCV – mean corpuscular volume, MCH – mean corpuscular hemoglobin, MCHC – mean corpuscular hemoglobin concentration, Hb – hemoglobin, RDW – red cell distribution width, ALT – alanine transaminase, AST – aspartate transaminase, ALP – alkaline phosphates, GDF-15 – growth differentiation factor 15, ERFF – erythroferrone, EPO – erythropoietin.
Iron-related parameters, including ferritin and serum iron levels, were markedly elevated (p < 0.001) in the TDβ-T group/patients compared to controls. No significant difference was observed in the log2 fold change of HAMP expression (p = 0.16). In contrast, GDF-15 expression was significantly upregulated (p < 0.01) in TDβ-T, as were FAM132B and SLC40A1 (p < 0.05). Hepcidin protein levels did not differ significantly (p = 0.645) between patients with TDβ-T and controls. However, the median protein concentrations of GDF-15, ERFF, and EPO were significantly elevated (p < 0.001) in the TDβ-T group/patients (Table II).
Differential expression of long non-coding RNAs of the study population
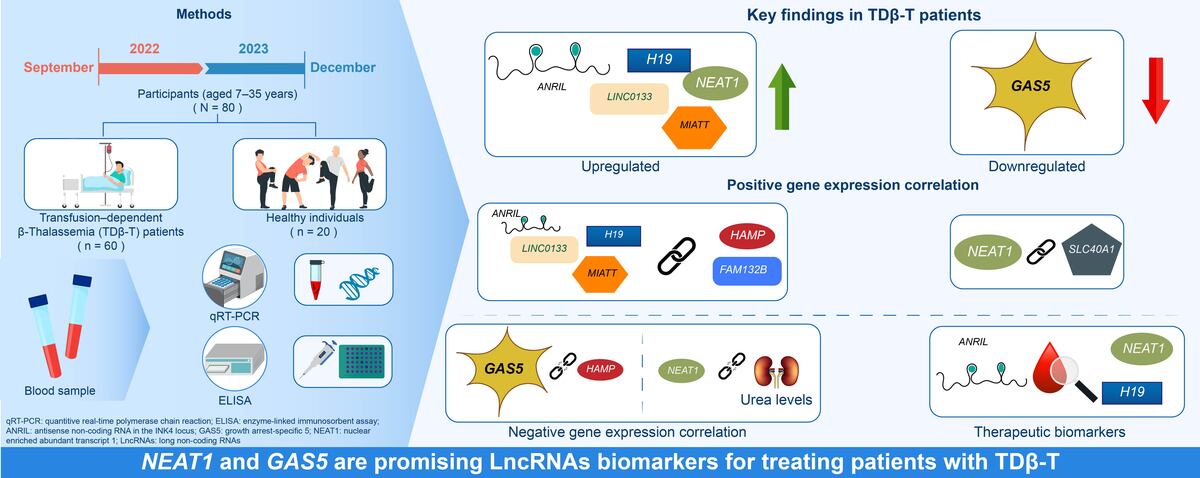
LncRNAs ANRIL (p = 0.044), H19 (p = 0.049), LINC0133 (p = 0.047), MIAT (p = 0.046), and NEAT1 (p < 0.001) were upregulated on average in patients with TDβ-T compared to controls except for LncRNA GAS5, which had a significant (p < 0.001) fold downregulation (Table III).
Table III
Mean log2 fold change of long non-coding RNAs expression for the study population
| LncRNAs | Mean log2 fold change relative to controls | Mean fold change relative to controls | P-value | |
|---|---|---|---|---|
| Control (N = 20) | TDβ-T (N = 60) | |||
| ANRIL | 3.85 × 10⁻³ ±1.4 | 1 ±1.4 | 3.4 ±4.7 | 0.044* |
| GAS5 | –2.75 × 10⁻³ ±1.0 | –2.7 ±4.9 | 0.6 ±0.8 | 2. 10–4 |
| H19 | 6.15 × 10⁻¹¹ ±1.2 | 1.0 ±1.7 | 3.6 ±4.1 | 0.049* |
| LASER | –2.55 × 10⁻¹⁰ ±1.6 | 0.6 ±1.6 | 2.9 ±3.9 | 0.174 |
| LINC0133 | –2.55 × 10⁻¹⁰ ±1.2 | 0.8 ±1.4 | 2.9 ±3.8 | 0.047* |
| MALAT1 | –9.55 × 10⁻⁴ ±1.5 | 0.6 ±1.7 | 2.8 ±3.2 | 0.157 |
| MEG3 | –9.75 × 10⁻⁴ ±1.2 | 0.7 ±1.3 | 2.5 ±3.5 | 0.095 |
| MIAT | –1.45 × 10⁻³ ±0.8 | 0.8 ±1.8 | 4.3 ±8.9 | 0.046* |
| NEAT1 | –3.95 × 10⁻¹¹ ±1.0 | 3.0 ±1.7 | 15.3 ±21.6 | < 0.001* |
| SNGH20 | –2.95 × 10⁻¹⁰ ±1.3 | 1.1 ±1.6 | 3.5 ±3.9 | 0.093 |
| UCA1 | 0.02 ±1.3 | 0.1 ±1.4 | 1.8 ±2.8 | 0.891 |
Receiver operating characteristic (ROC) curve analysis
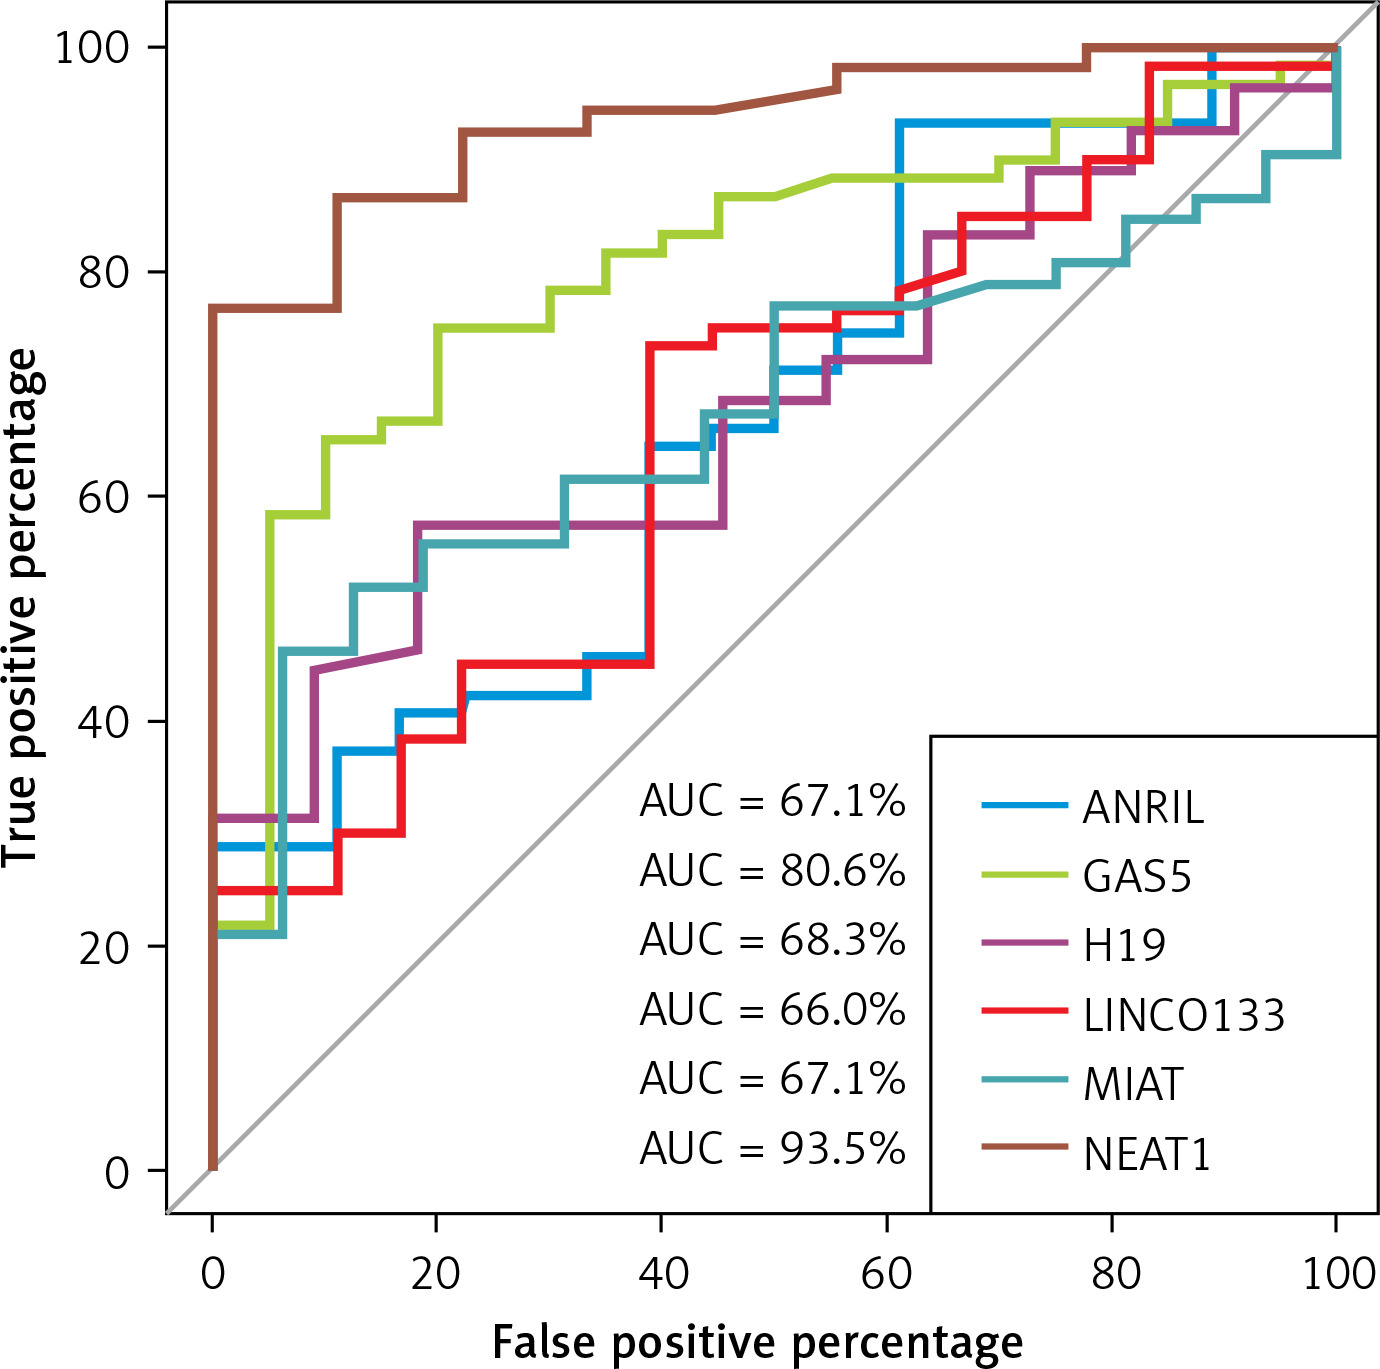
LncRNA NEAT1 and GAS5 exhibited the highest diagnostic performance with area under the receiver operating characteristic (ROC) curve of 93.5%, and 80.6% respectively, compared to other LncRNAs (Table IV, Figure 1).
Table IV
Diagnostic performance of long non-coding RNAs among transfusion-dependent β-thalassemia
| log2∆ Target LncRNAs | AUC (95% CI) | P-value | Specificity | Sensitivity |
|---|---|---|---|---|
| ANRIL | 67.1% (53–81.3%) | 0.020* | 38.9% | 93.2% |
| GAS5 | 80.6% (70.3–91%) | < 0.0001*** | 80% | 75% |
| H19 | 68.3% (53.3–83.3%) | 0.020* | 82% | 57% |
| LINC0133 | 66% (51.8–80.1%) | 0.030* | 61% | 73% |
| MIAT | 67.1% (54–80.3%) | 0.013** | 93.8% | 46.2% |
| NEAT1 | 93.5% (87–100%) | < 0.0001*** | 100% | 76.9% |
Association between long non-coding RNAs and iron regulatory proteins in transfusion-dependent β-thalassemia
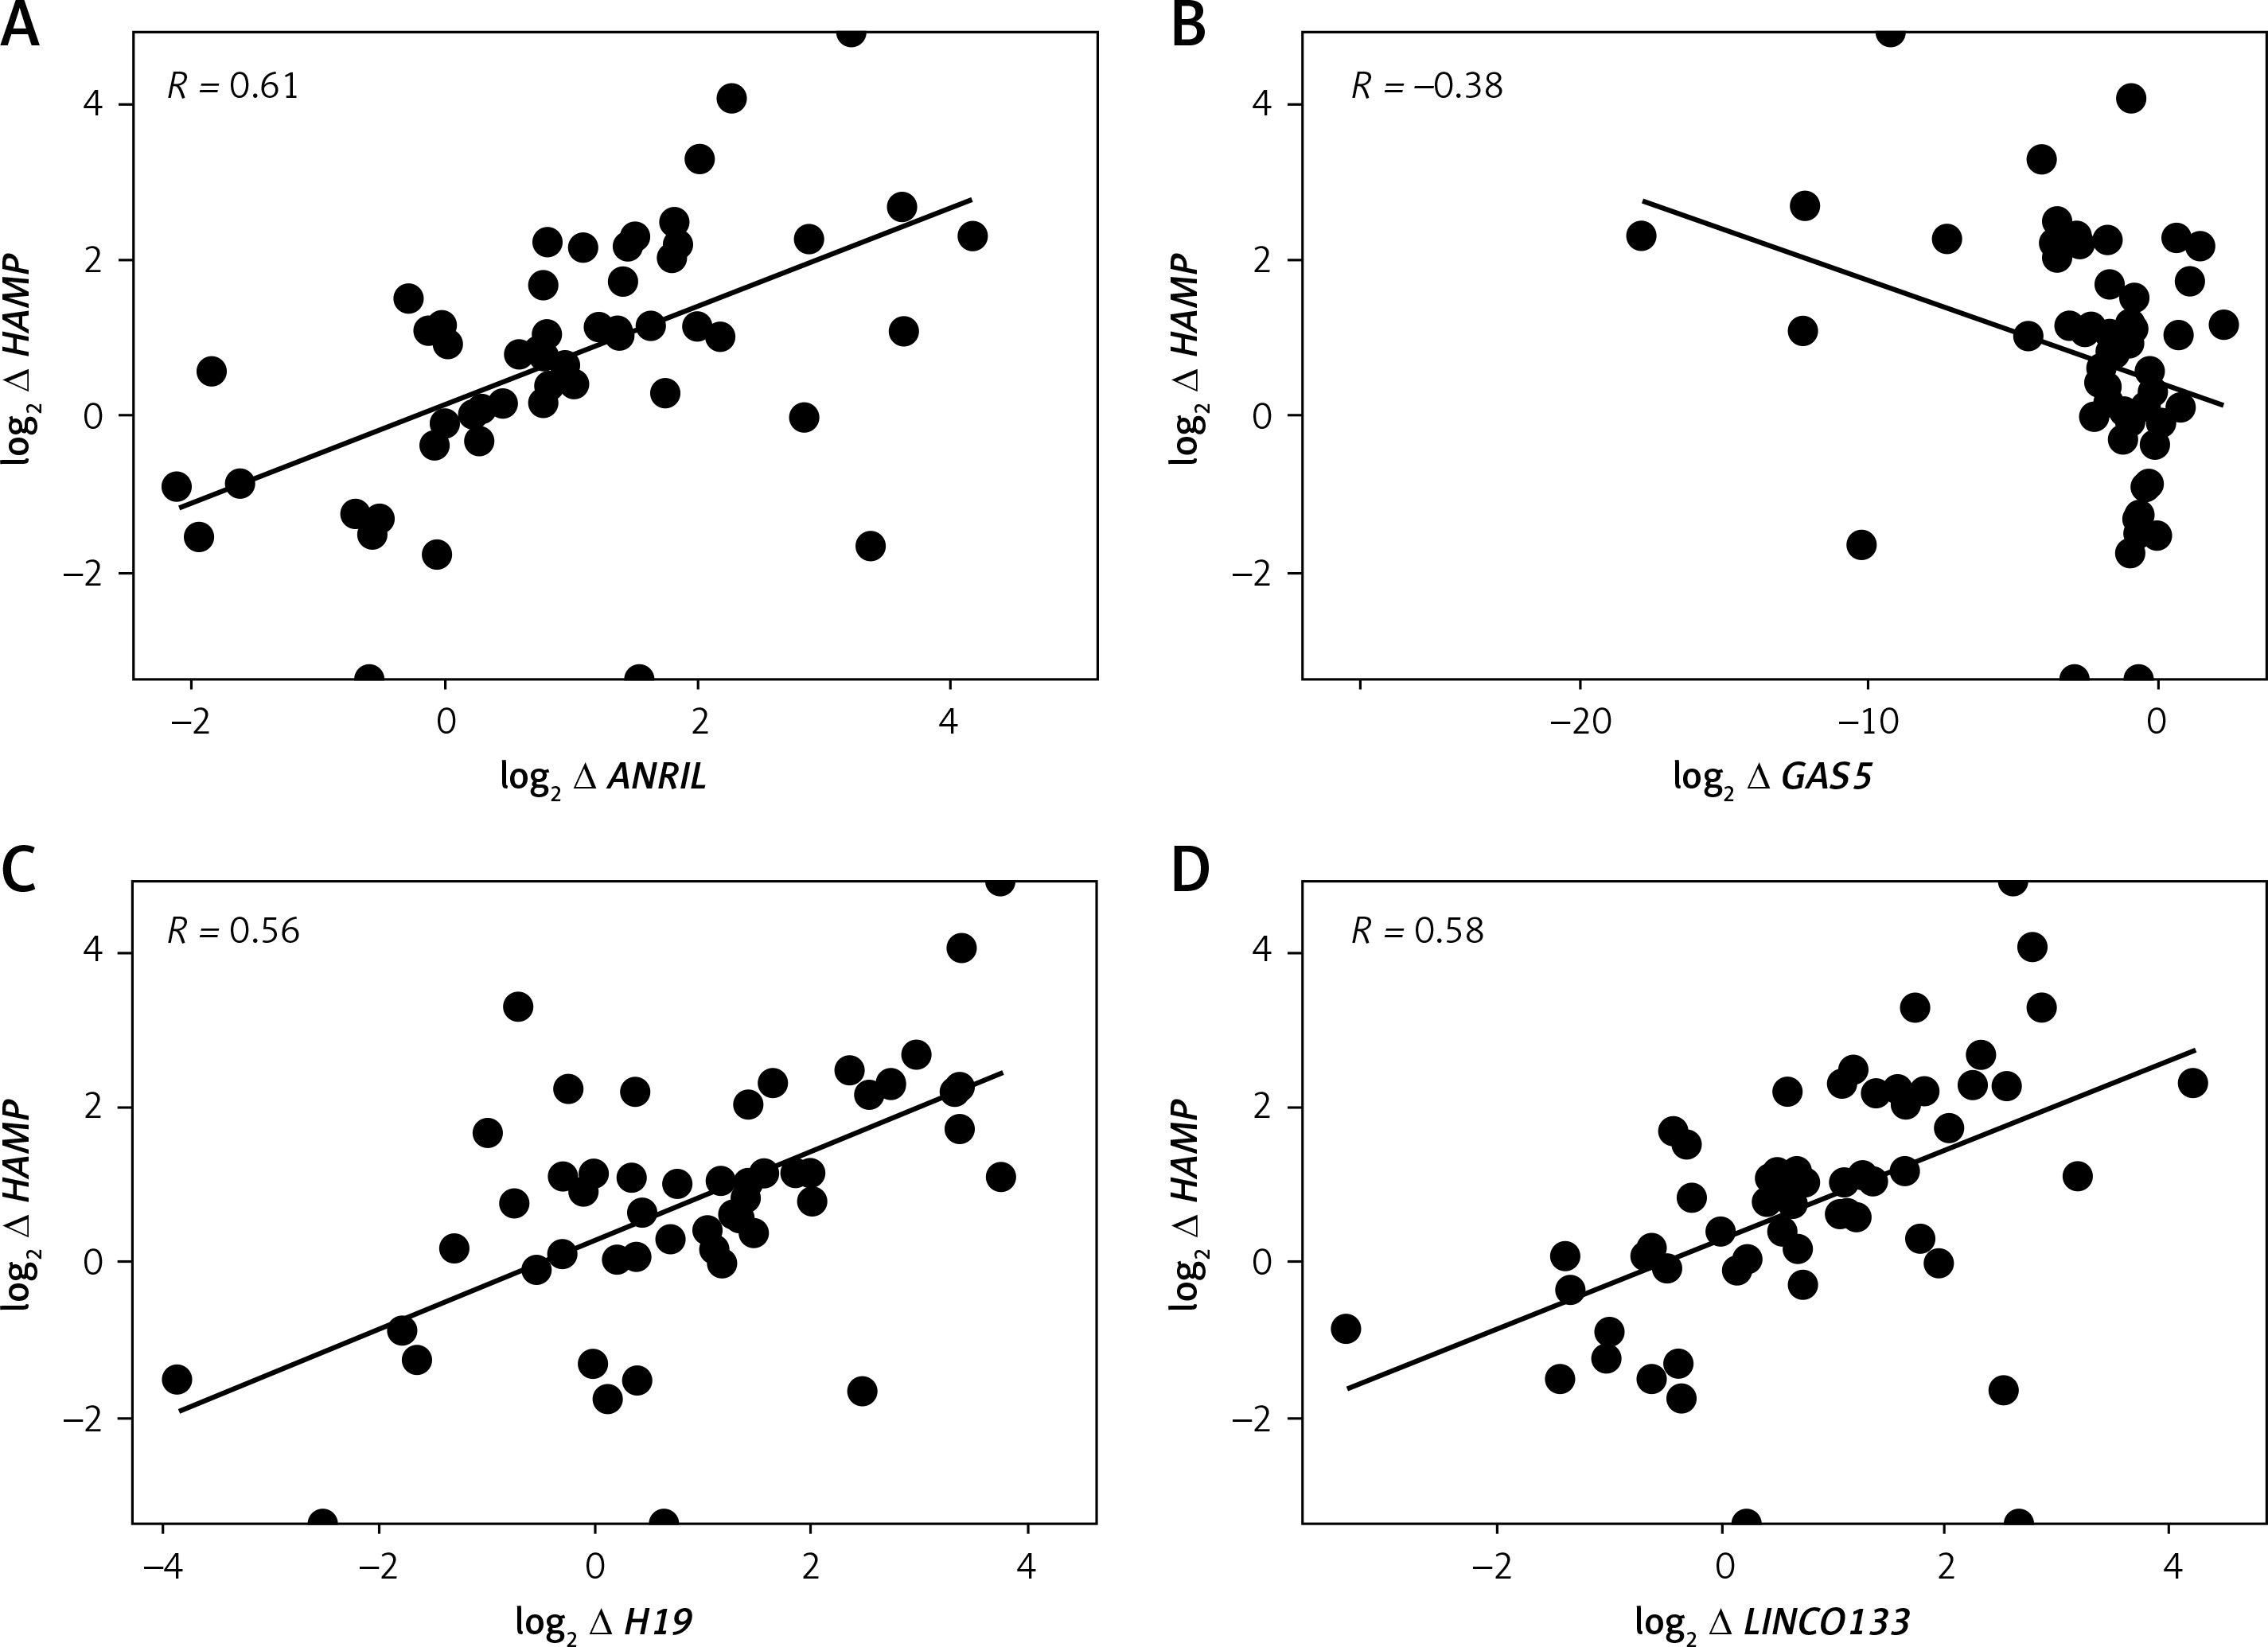
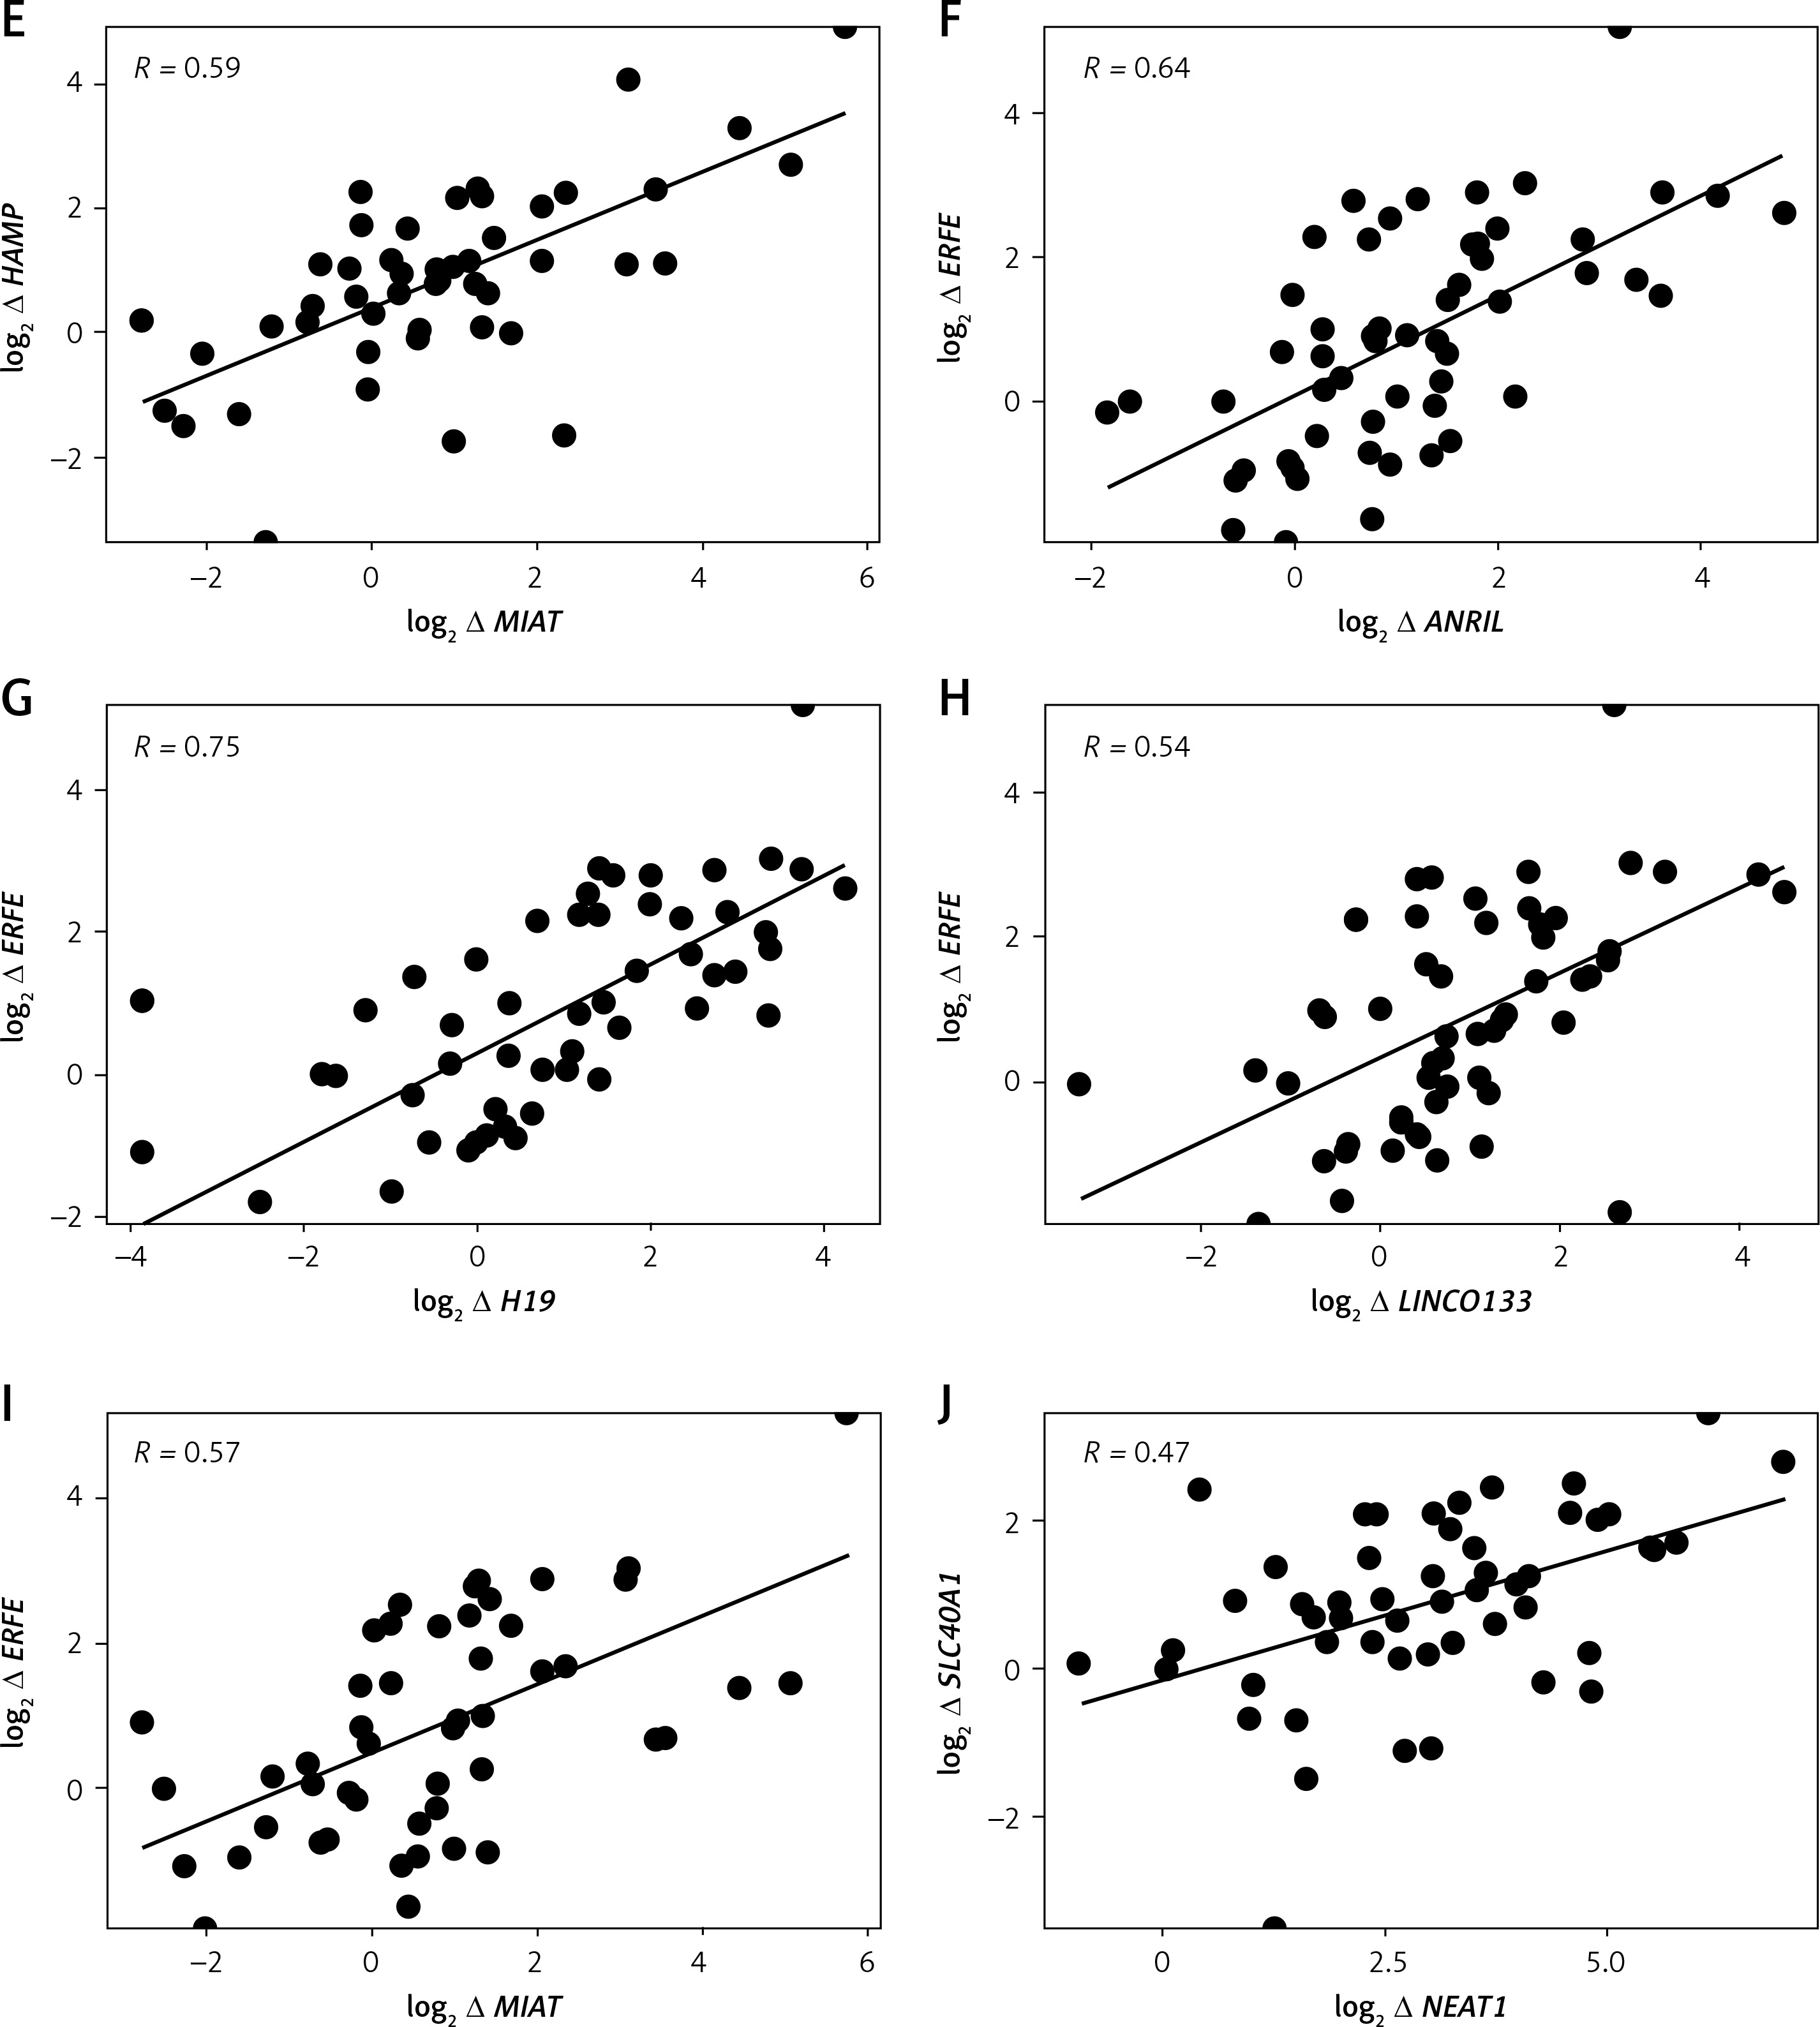
Log2 fold changes in HAMP and FAM132B were strongly and significantly correlated (p < 0.0001) with LncRNA ANRIL, LncRNA H19, LncRNA LINCO133, and LncRNA MIAT (Table V, Figures 2 A, C–I). In contrast, GAS5 expression exhibited a significant negative correlation (p < 0.05) with HAMP expression (Table V, Figure 2 B). Furthermore, log2 fold change in SLC40A1 (encoding ferroportin) positively and markedly (p < 0.001) correlated with log2 fold change in LncRNA NEAT1 (Table V, Figure 2 J). No significant correlations were observed between the differentially expressed LncRNAs and the iron/erythropoiesis regulatory proteins in the control group (data not shown).
Table V
Correlation between the expression of long non-coding RNAs with iron and erythropoiesis regulatory genes and proteins among transfusion-dependent β-thalassemia
| log2 ∆ LncRNAs | ANRIL | GAS5 | H19 | LINCO133 | MIAT | NEAT1 |
|---|---|---|---|---|---|---|
| Measured parameters | ||||||
| Ferritin [ng/ml] | 0.02 | –0.12 | 0.06 | 0.08 | –0.04 | 0.25 |
| Iron [mg/dl] | 0.08 | –0.02 | –0.07 | 0.16 | 0.05 | 0.04 |
| log2 ∆ HAMP | 0.61**** | –0.38* | 0.56**** | 0.58**** | 0.59**** | 0.12 |
| log2 ∆ GDF-15 | –0.21 | 0.25 | –0.19 | –0.28 | –0.13 | 0.27 |
| log2∆ FAM132B | 0.64**** | –0.36 | 0.75**** | 0.54**** | 0.57**** | 0.17 |
| log2 ∆ SLC40A1 | 0.09 | 0.03 | 0.04 | 0.09 | 0.03 | 0.47*** |
| Hepcidin [pg/ml] | –0.09 | 0.18 | –0.02 | –0.02 | –0.10 | –0.10 |
| GDF-15 [pg/ml] | –0.22 | 0.20 | –0.19 | –0.13 | –0.05 | 0.22 |
| ERFF [pg/ml] | –0.12 | 0.11 | 0.00 | –0.01 | 0.03 | 0.22 |
| EPO [mUI/ml] | –0.06 | 0.06 | –0.19 | –0.04 | –0.06 | 0.05 |
Correlation between long non-coding RNAs expression, ferritin, and liver/kidney function parameters in transfusion-dependent β-thalassemia
Serum AST and ALT were strongly (rho of 0.55) correlated with ferritin. However, they were not correlated with LncRNA GAS5 and LncRNA NEAT1 log2 fold change/log2 fold change in LncRNA GAS5 and LncRNA NEAT1 except for urea, which was negatively (rho of –0.3) correlated with log2 fold change of LncRNA NEAT1 (Table VI).
Table VI
Correlation of long non-coding RNAs expression and ferritin with liver and kidney functions parameters in transfusion-dependent β-thalassemia
| Biochemical parameters | log2 ∆ LncRNA GAS5 | log2 ∆ LncRNA NEAT1 | Ferritin [ng/ml] |
|---|---|---|---|
| AST [U/l]) | –0.11 | 0.24 | 0.55**** |
| ALT [U/l] | –0.13 | 0.25 | 0.55**** |
| Creatinine [mg/l] | 0.07 | –0.18 | –0.06 |
| Urea [mg/l] | 0.17 | –0.30* | –0.15 |
Discussion
β-thalassemia is a quantitative impairment of β-globin chain biosynthesis caused by genetic and epigenetic aberrations, characterized by ineffective erythropoiesis and a high susceptibility to iron overload [20]. Although few studies have investigated LncRNA expression in β-thalassemia [21, 22], none have directly linked these RNAs to their distinguishing clinical features. Our study identified a notable reduction in hematological parameters and a significant increase in biochemical markers in patients with TDβ-T compared to controls, consistent with previous findings [23, 24].
We observed a significant (p < 0.05) upregulation of genes involved in iron level regulation ‒ GDF-15, ERFE, and SLC40A1 ‒ in patients with TDβ-T. Protein levels of GDF-15, ERFF, EPO, ferritin, and serum iron were also significantly (p < 0.0001) elevated. Elevated EPO levels stimulate erythropoiesis by promoting the production of ERFE and GDF-15, which subsequently suppresses hepcidin, thereby enhancing iron availability for erythropoiesis [25, 26]. However, we observed no significant difference in hepcidin levels or HAMP expression between TDβ-T patients and controls, consistent with some studies [27, 28] but contrasting with findings by Camaschella et al. [26]. This discrepancy may be attributed to variability in transfusion frequency [29], use and type of iron-chelators [30], genetic factors, or inflammatory states. Genetic mutations can worsen or mitigate iron overload, influencing disease severity [31].
LncRNAs are known to disrupt hematopoiesis [19, 32] and hemoglobin production in thalassemia [33]. We observed significant upregulation of LncRNAs ANRIL, MIAT1, and NEAT1, consistent with Fakhr-Eldeen et al. [34], and for the first time, we report the downregulation of LncRNA GAS5 and upregulation of LICN0133 and H19 in TDβ-T patients. ROC analysis identified LncRNAs NEAT1 and GAS5 as strong diagnostic biomarkers.
Interestingly, none of the measured proteins‒ferritin, hepcidin, GDF-15, ERFE, EPO, or serum iron‒correlated significantly with LncRNA expression in TDβ-T patients. However, we found strong correlations between TDβ-T HAMP and FAM132B and LncRNAs ANRIL, H19, LINCO133, and MIAT, representing novel findings. ANRIL is known to influence gene expression involved in metabolic pathways [35], and limited empirical data regarding the roles of LncRNA H19, LncRNA LINC0133, and LncRNA MIAT hampers firm conclusions regarding their roles. Nevertheless, we are at the forefront of research in this area as we are documenting compelling evidence that indicates a robust significant (p < 0.001) correlation between HAMP and FAM132B and LncRNAs: ANRIL, H19, LINC0133, and MIAT.
Another pioneering result for this current study was the significant (p < 0.001) positive correlation between LncRNA NEAT1 and SLC40A1 (encoding ferroportin). While the current body of literature does not explicitly establish a direct association between LncRNA NEAT1 and SLC40A1, the evidenced regulatory functions of LncRNA NEAT1 within the contexts of oncogenesis and immune system modulation imply that it may exert influence over, or exhibit a correlation with various genes that participate in interconnected biological pathways [36, 37]. Additionally, we are the first to document a significant (p < 0.05) negative correlation between LncRNA GAS5 and HAMP expression. This observed inverse relationship can be contextualized within the broader framework of gene expression regulation, while also reflecting the underlying biological implications that negative correlations may signify in various molecular interactions across different pathological conditions, for example, its relationship with HMGB1 in sepsis [38] and with IL-18 in rheumatoid arthritis [39].
Our results showed a robust and significant (p < 0.001) correlation between serum AST/ALT and ferritin, aligning with other reports [40, 41]. This reinforces the notion that increased ferritin levels may serve as a biomarker for liver dysfunction specifically among patients with TD-βT. While GAS5 and NEAT1 expression showed no significant correlation with liver/kidney function overall, a noteworthy exception was the negative correlation between NEAT1 and urea levels (p < 0.05), which may suggest metabolic regulation, as discussed by Moreno et al. [42].
This study has some limitations including a small sample size, lack of analysis across different β-thalassemia phenotypes, and absence of post-transfusion LncRNA expression data. Nevertheless, our findings offer novel insights into the molecular landscape of TDβ-T.
In conclusion, to the best of our knowledge, this is the first study to report LncRNA alterations in TDβ-T, with NEAT1 and GAS5 emerging as promising diagnostic biomarkers. Moreover, the observed association between LncRNAs and iron-regulatory and erythropoiesis-related genes warrants further investigation.