Introduction
At present, histopathology is one of the most important methods to evaluate the degree of cartilage wear in knee osteoarthritis (OA). However, histopathology cannot be performed before total knee arthroplasty (TKA). Recently, relevant studies [1–8] indicated that magnetic resonance imaging (MRI) T1 rho/T2 mapping imaging could be used for preoperative detection. A positive association between the severity of cartilage degeneration and T1 rho/T2 mapping relaxation times was reported recently [1–8]. Some studies [9–11] highlighted that T1 rho/T2 mapping could be used to distinguish early OA and late OA. However, the cutoff point of the T1 rho/T2 mapping value has not been determined yet.
Therefore, in this study, 88 samples were obtained from 22 patients who underwent TKA. MRI T1 rho/T2 mapping sequences were performed preoperatively. The Osteoarthritis Research Society International (OARSI) grading system was employed post-operatively. After excluding OARSI grade 5 and grade 6, eighty samples were collected for further evaluation. The OARSI grading system was applied to distinguish early-stage OA (OARSI grade 0-1) and advanced OA (OARSI grade 2–4). Eighty samples were divided into four femoral condyles: the medial femoral posterior condyle (MFPC), the lateral femoral posterior condyle (LFPC), the medial femoral distal condyle (MFDC), and the lateral femoral distal condyle (LFDC).
Material and methods
Patients
Twenty-two knee osteoarthritis (OA) patients were recruited before total knee arthroplasty. This research was approved and then supervised by the Ethical Committee of Zhujiang Hospital (trial register number: 2017-GJGBK-001).
Magnetic resonance imaging (MRI)
Before total knee arthroplasty, MRI was performed with a 3.0-T Achieva unit (Philips Healthcare, Eindhoven, The Netherlands). Fast spin-echo proton density-weighted fat suppression image (FSE PDFs) was performed based on the following parameters: repetition time = 1800 ms, echo time = 35 ms, layer thickness = 4 mm, field of view = 180 mm, matrix size = 320 × 56, excitation times = 2, scanning layers = 20, scanning time = 2 min 30 s. The sagittal T1rho sequence was performed as follows: repetition time = 5.3 ms, echo time = 0 ms, optional locking time = 0/10/40/80 ms, slice thickness = 4 mm, slice thickness = 0.5 mm, scanning layers = 18, field of view = 160 mm, matrix size = 256 × 128, excitation times = 1, scanning time = 7 min 7 s. The sagittal T2 mapping sequence was performed as follows: repetition time = 1000 ms, echo time = 0 ms, optional locking time = 9.5/19.1/28.6/38.1/47.6/57.2/66.7/76.2 ms, slice thickness = 4 mm, slice thickness = 0.5 mm, scanning layers = 20 layers, field of view = 160 mm, matrix size = 320 × 256, excitation times = 1, scanning time = 8 min 46 s. The following three-dimensional fat suppression (3D FSE cube) sequence was employed: TR time = 1500 ms, repetition time = 25 ms, slice thickness = 1.6 mm, field of view = 160 mm, matrix size = 256 × 256, excitation times = 1, scanning time = 4 min 28 s. T1 rho and T2 mapping relaxation times, whose units are millisecond (ms), were calculated while T2 mapping relaxation times were obtained.
Total knee arthroplasty
After 22 patients signed the consent form and completed the MRI scanning, total knee replacement was performed according to the general operating procedure. All condyles were resected into four groups: MFPC, LFPC, MFDC, and LFDC. All 88 samples were examined histologically.
Histopathology
Four kinds of femoral condyles (MFPC, LFPC, MFDC, and LFDC) were fixed in 4% polymethyl alcohol, decalcified with Rapid Bone Decalcifier (American Master Tech Inc., Lodi, CA, USA) for 48 h, then embedded in paraffin. The femoral condyles were sagittally cut into slices with a thickness of 8 µm. All sections were stained with hematoxylin-eosin (HE) and safranin-fast green. Two pathologists (Songwen Ou and Chao Xie) performed a routine histopathological evaluation of each section based on the OARSI osteoarthritis cartilage assessment system [12]. If different assessments were obtained, the results were discussed with a third pathologist (Zhaowei Lin) to reach a consensus and determine the final pathological grade.
Image analysis
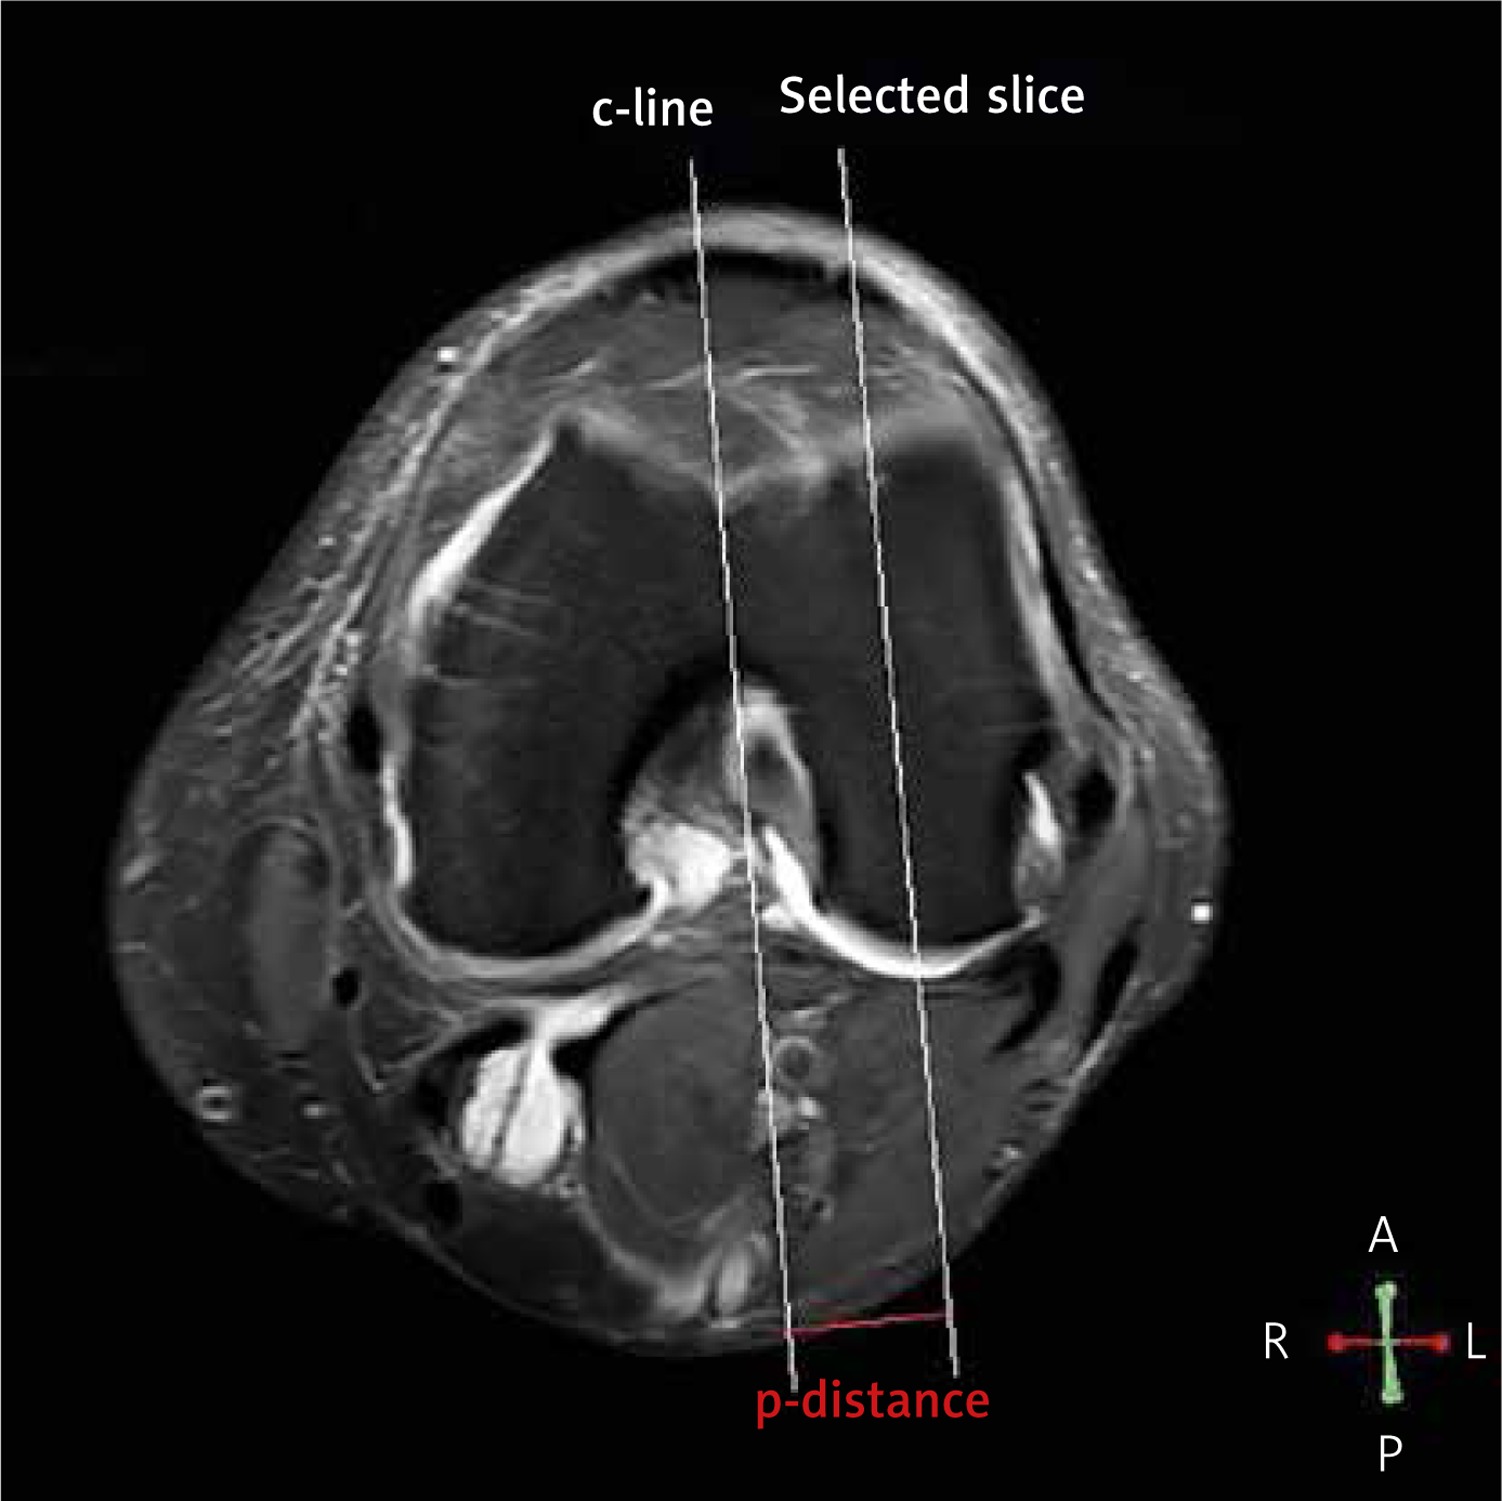
All images were analyzed in a Philips DICOM Viewer R3.0-SP13 (Philips, Best, the Netherlands). The regions of interest (ROI) were drawn by a single radiologist (Minning Zhao) using each relaxation map. In sagittal images, each condyle was divided into four ROI parts: MFDC, LFDC, MFPC, and LFPC. The posterior edge of the anterior meniscal horn and the posterior edge of the posterior meniscal horn were used to segment the femoral distal condyle (FDC). The femoral posterior condyle was posterior to the posterior edge of the posterior meniscal horn (Figure 1). Among all sagittal images of the same ROI part from one sample, the image with the highest signal-to-noise ratio was selected for analysis [13]. T1 rho and T2 mapping relaxation time values are the average values of pixels (ms) in that selected ROI which reflected the relaxation times of T1 rho and T2 mapping. In horizontal images, the center reference line (c-line) was drawn through the deepest point of the groove and the femoral notch. The perpendicular distance (p-distance) between selected images and the c-line was calculated by the number of slices in between (Figure 2). All MRI analyses were acquired before surgery.
Figure 1
T1 rho/T2 mapping and ROIs. A – Sagittal T1rho sequence was performed. B – The regions of interest (ROI) were drawn. The posterior edge of the anterior meniscal horn was used to separate the edge of ROI. C – ROI of condyles was divided into two parts: the femoral distal condyle and the femoral posterior condyle. The posterior edge of the posterior meniscal horn was used to segment the femoral distal condyle. D – T2 Fast spin-echo proton density-weighted fat suppression imaging (FSE PDFs) was performed. E – ROI of T2 was drawn. F – A sagittal T2 mapping sequence was performed. G – T2 images were merged with the ROI of T2 mapping images. H – The femoral distal condyle and the femoral posterior condyle were outlined
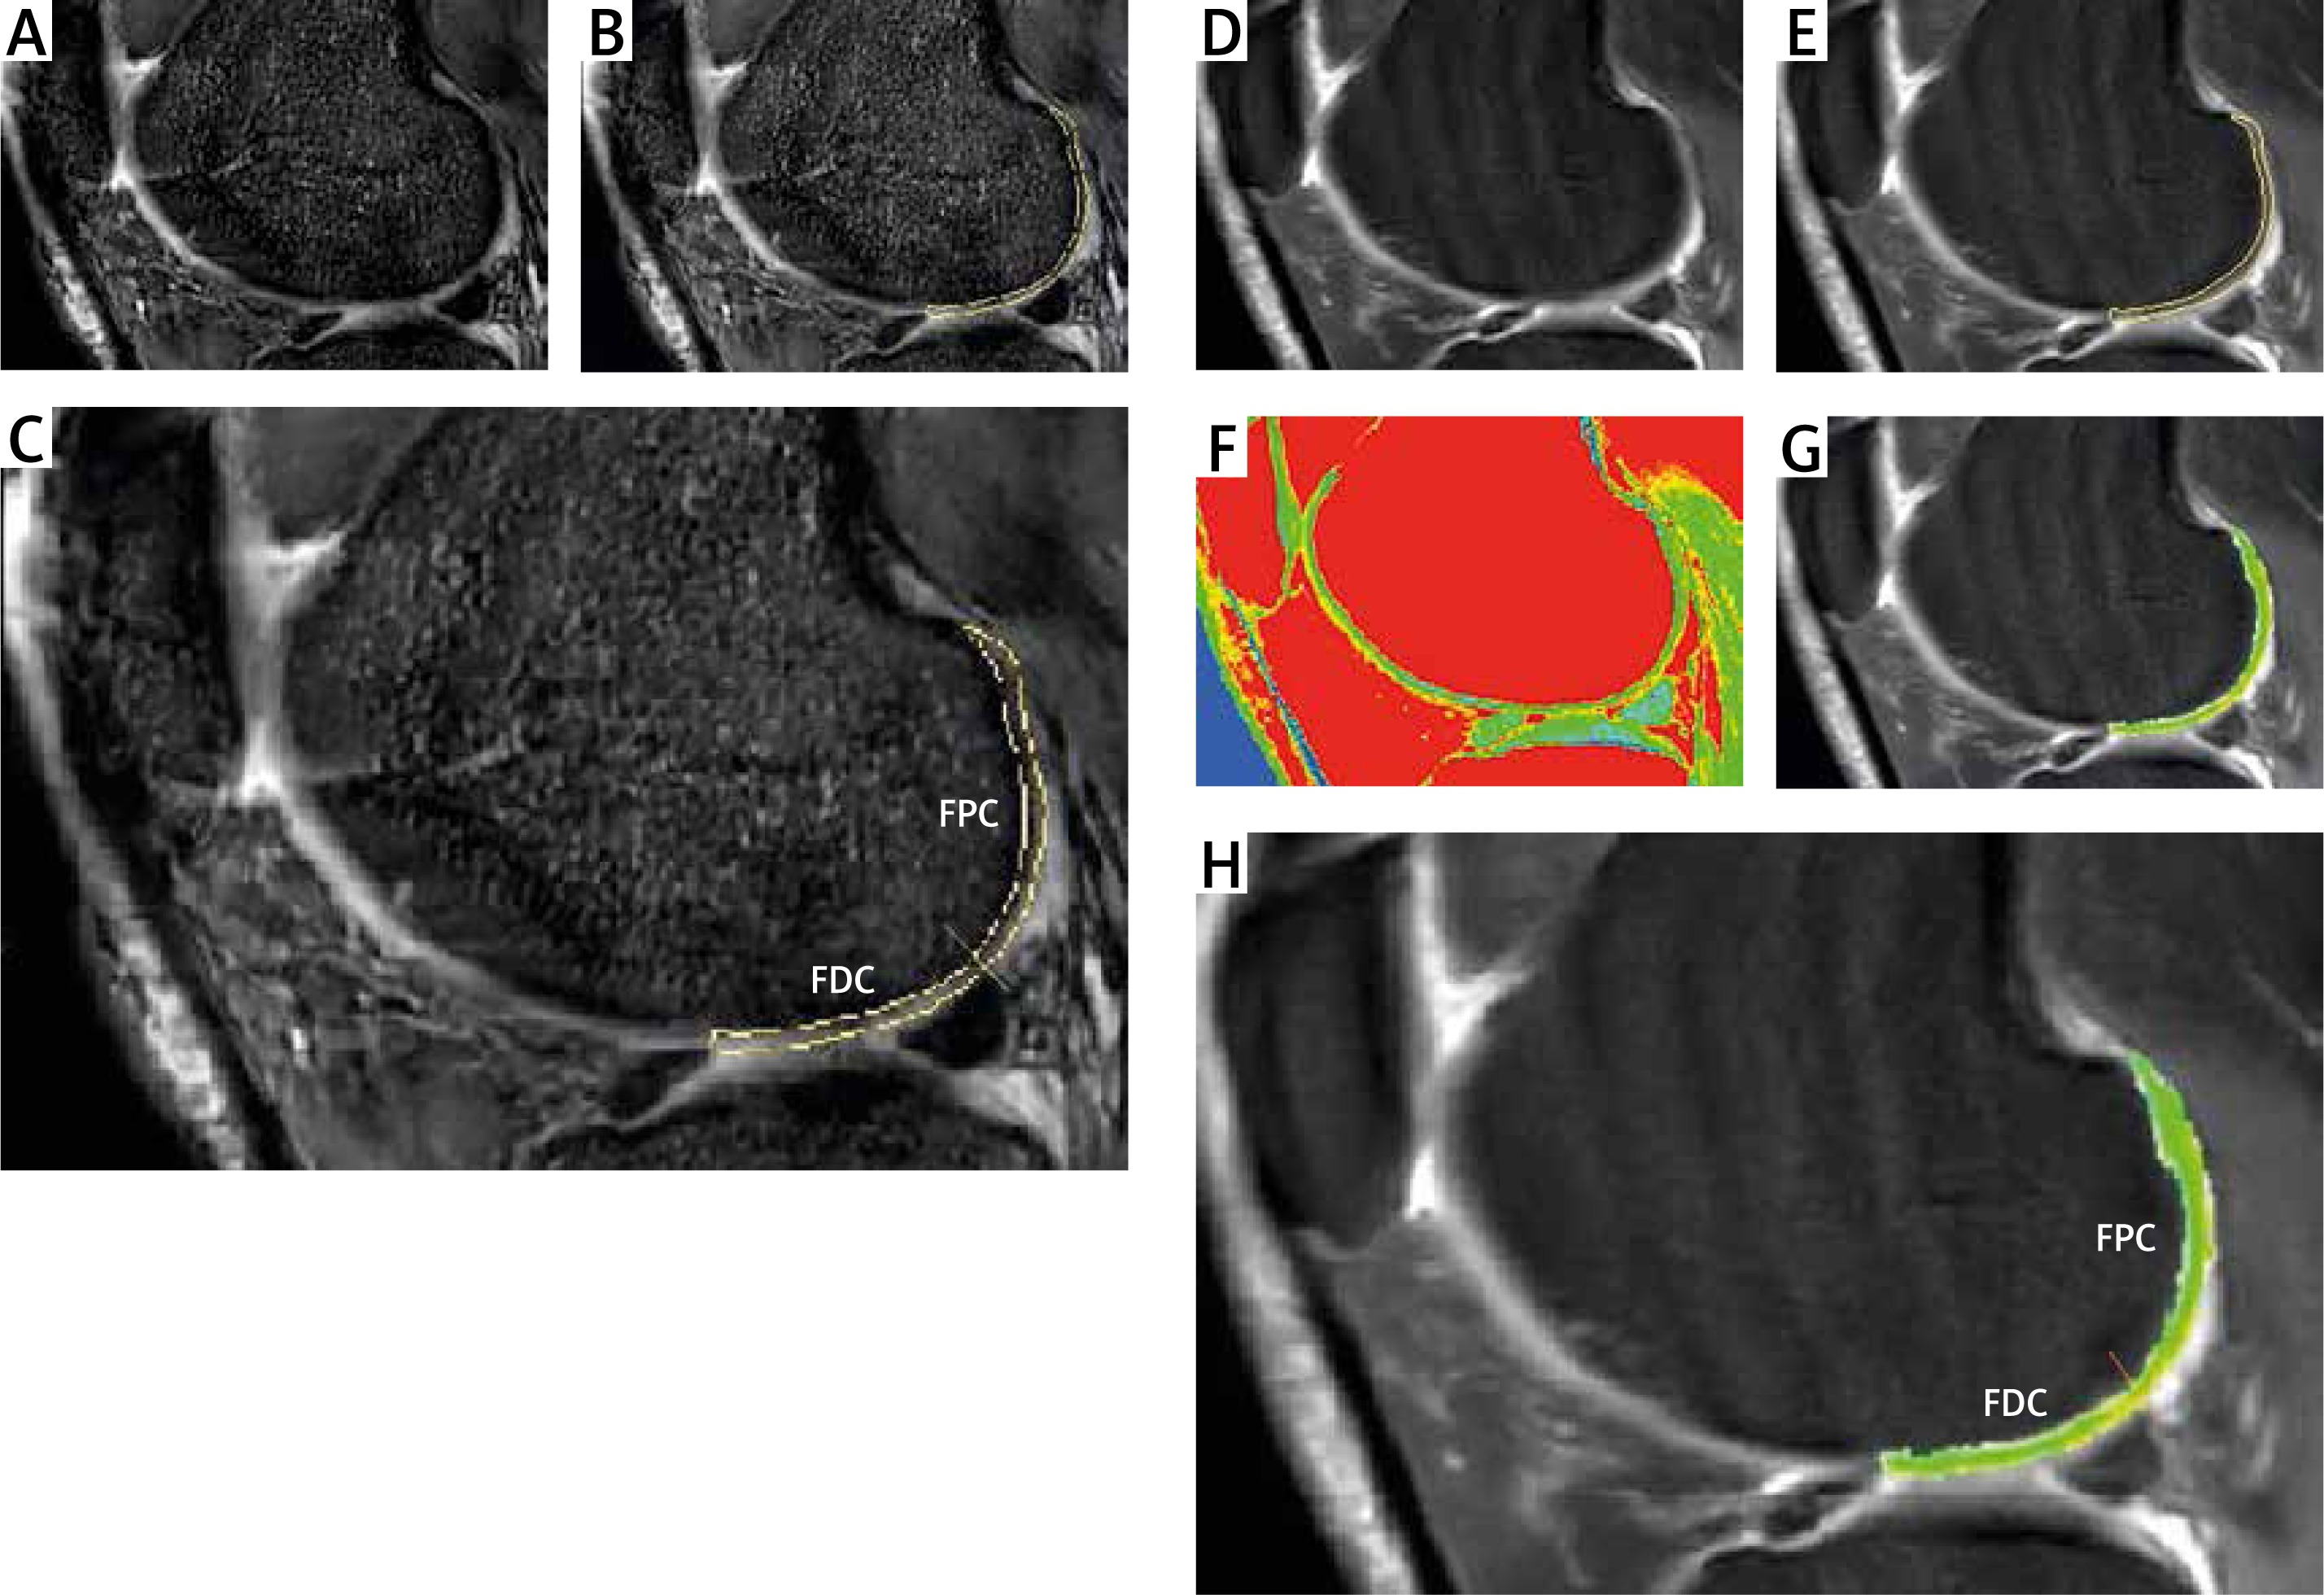
Figure 2
Reference lines were drawn in horizontal images. In horizontal MRI images, the center reference line (c-line) was drawn through the deepest point of the groove and the deepest point of the femoral notch. The reconstructed sagittal slices were parallel to the c-line. The perpendicular distance (p-distance) between the selected slice (sagittal images) and c-line was calculated by multiplying the slice thickness by the number of slices in between
ROIs of histopathology match ROIs of MRI
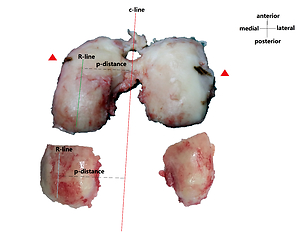
The c-line of the condyle was drawn during surgery for surgery consideration. The ROI (R-line) of histopathology was drawn parallel to the c-line. P-distance was applied to determine the interval between the c-line and the R-line. The ROI was obtained and marked by the surgeon during surgery. Histopathological staining was employed post-operatively (Figure 3). Samples that were OARSI grade 5 or grade 6 were excluded since rare cartilage existed for MRI detection. Of 88 samples, 8 samples were OARSI grade 5 or grade 6. Through the above method [14], ROIs of histopathology were matched with ROIs of MRI theoretically (Figure 4). Eighty samples were obtained after excluding OARSI grade 5/6.
Figure 3
Reference lines were drawn in condyles. The center reference line (c-line) was drawn during surgery for surgery consideration. The ROI (R-line) of histopathology was drawn parallel to the c-line. P-distance was applied to determine the interval between the c-line and the R-line. The ROI was obtained and marked by the surgeon during surgery. Histopathological staining was employed in ROIs
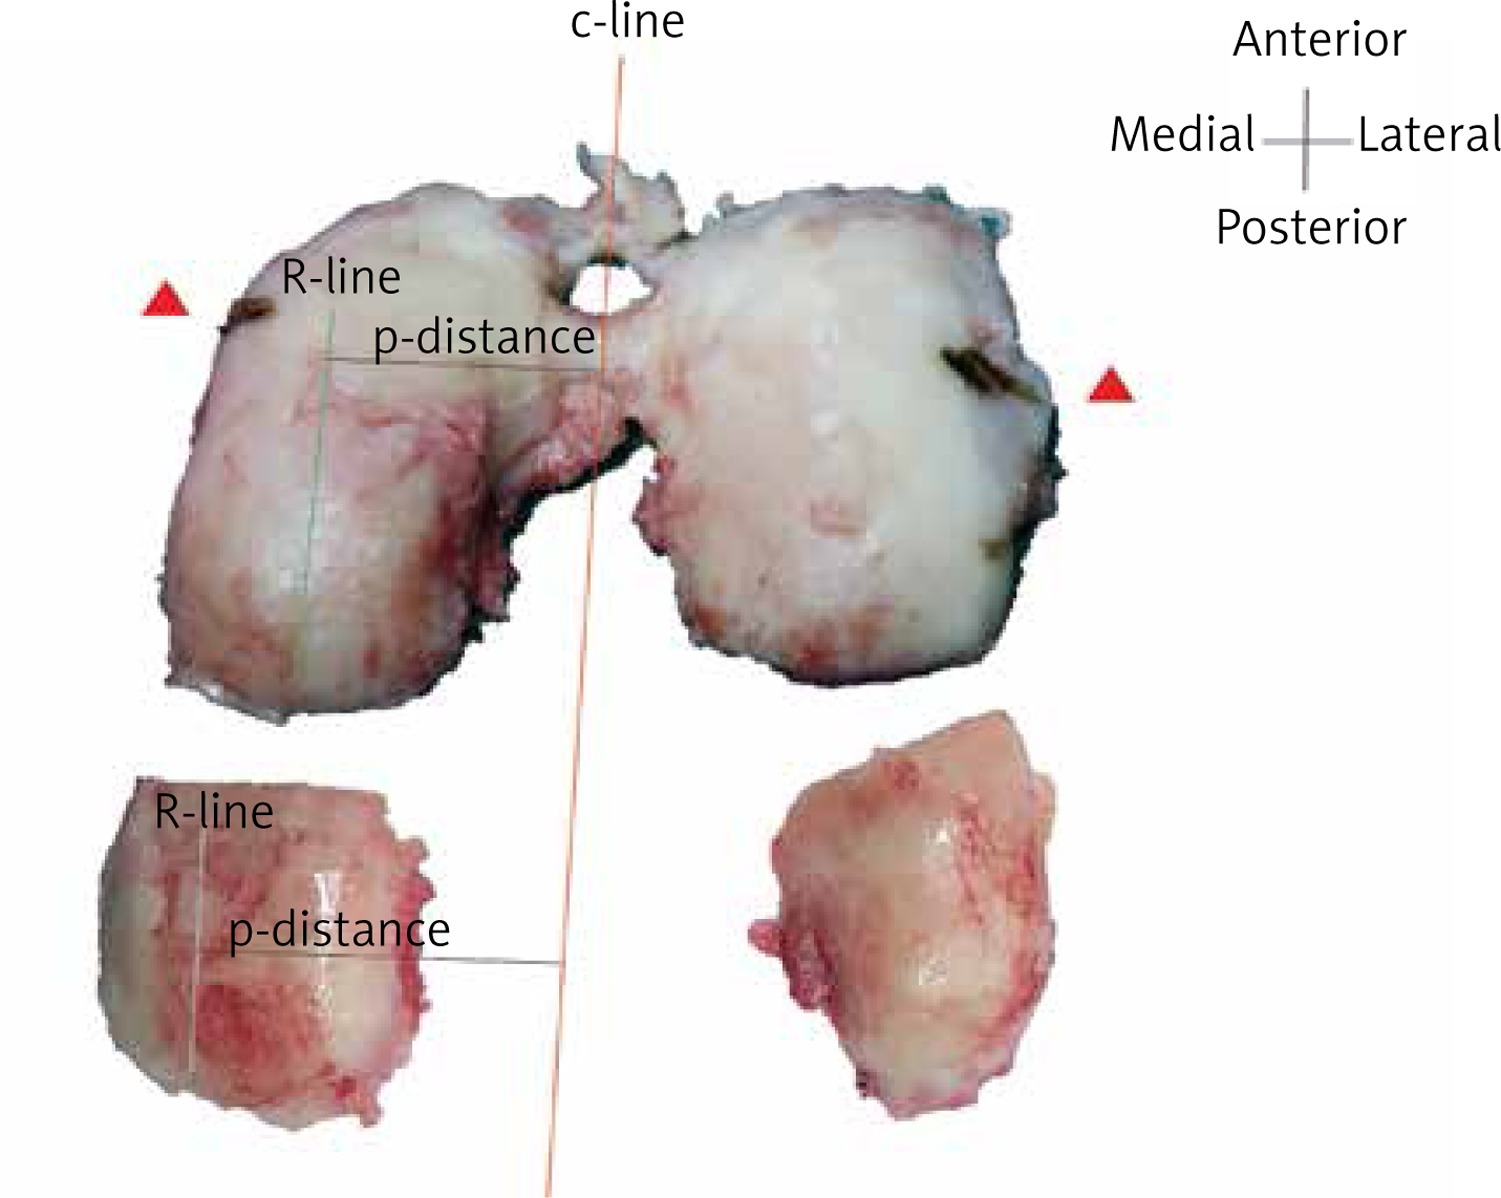
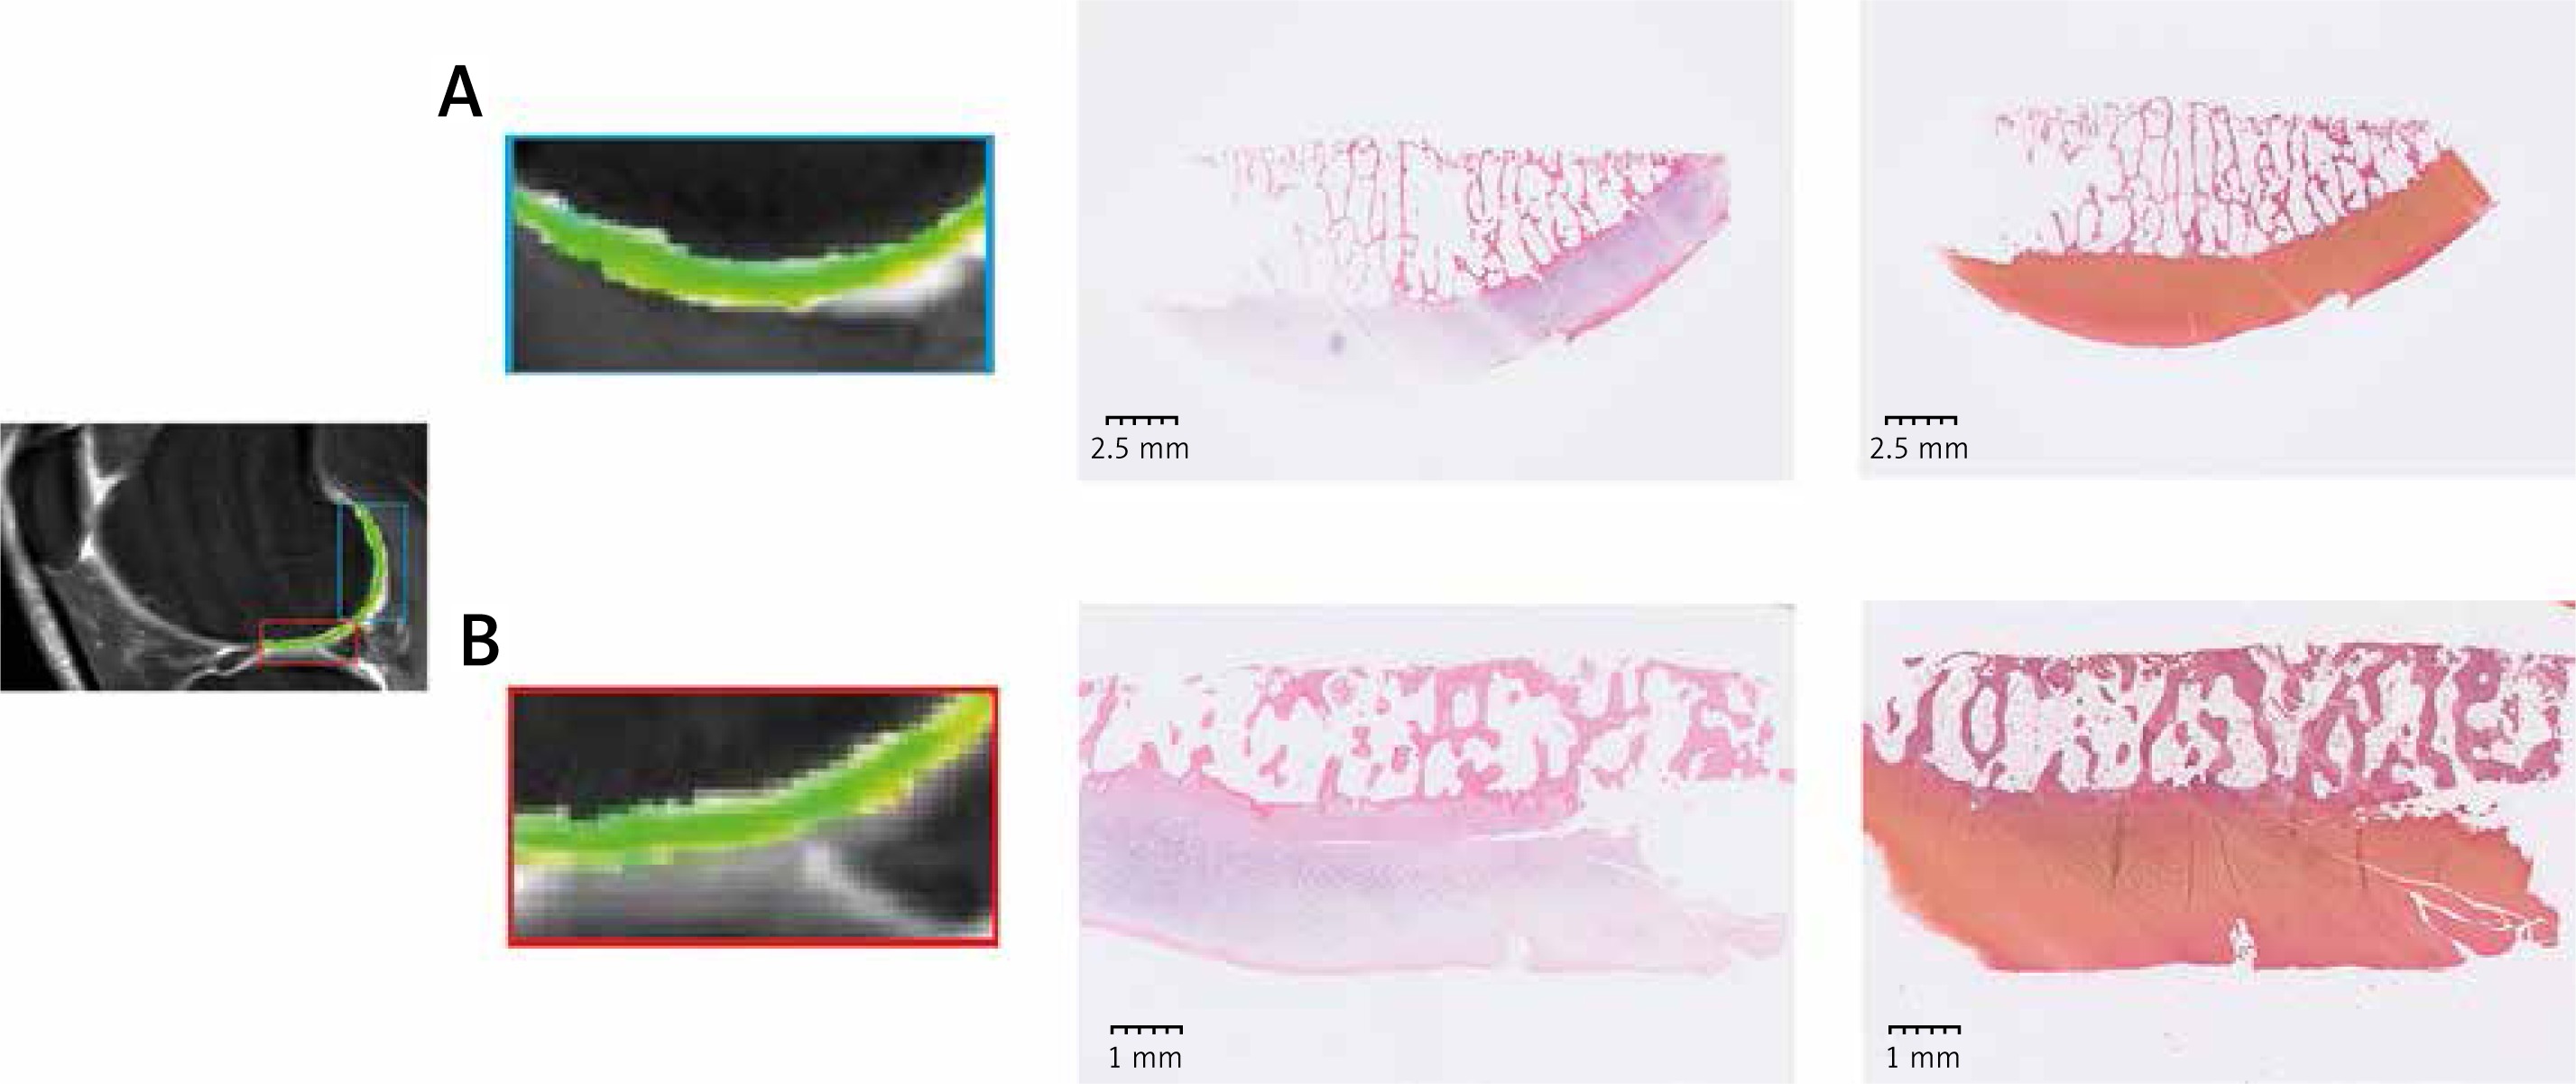
Figure 4
HE and safranin-fast green staining. A – The ROI showed the T2 mapping images of the femoral posterior condyle. HE staining and safranin-fast green staining were shown simultaneously. B – T2 mapping images, HE staining, and safranin-fast green staining of the femoral distal condyle were employed
Statistical analysis
All 80 samples were included for statistical analysis using MedCalc (MedCalc Software, Ostend, Belgium). Mean T1 rho and T2 mapping relaxation times (ms) with standard error (SE) were compared between early OA and advanced OA. The significance level was set as p < 0.05. Receiver operating characteristic (ROC) analysis, area under the curve (AUC), potential cutoff points, sensitivity, specificity and their 95% confidence interval (95% CI), interactive dot diagrams, Youden index, misclassification-cost term (MCT) plot, and precision-recall (PR) curves were all described. In the ROC analysis, the area enclosed with the coordinate axes was 1.00. The area enclosed with the coordinate axis under the ROC curve was defined as AUC. The closer the AUC was to 1.00, the higher the authenticity of the detection method. The certain accuracy level was set as AUC > 0.9; the larger the AUC, the higher the diagnostic accuracy. The cutoff point of sensitivity-specificity curves provided a potential optimal diagnostic index for distinguishing between early-stage and advanced OA. The sensitivity and specificity and their 95% CI were described as percentages. A potential cutoff point (ms) for distinguishing between early-stage OA and advanced OA was determined as the junction point of the sensitivity–specificity curve. The optimal criterion line was demonstrated in the interactive dot diagrams. The Youden index is the sum of sensitivity and specificity minus 1 (Youden index = sensitivity + specificity – 1). The highest point of the Youden index and the lowest point of the MCT curve were determined to further verify the reliability of the cutoff point (the junction point of the sensitivity-specificity curve). The bootstrap simulation was obtained using SPSS version 22 (IBM SPSS Software, Chicago, Illinois, USA). Based on the bootstrap simulation, the relaxation time data of T1 rho/T2 mapping were used for 10000 resampling simulations. After simulation, 95% CIs of AUC, Youden index, and cutoff points were estimated. The PR curves of T1 rho and T2 mapping were analyzed together using the bootstrap simulation.
Results
T1 rho and T2 mapping values of ROIs between early and advanced OA
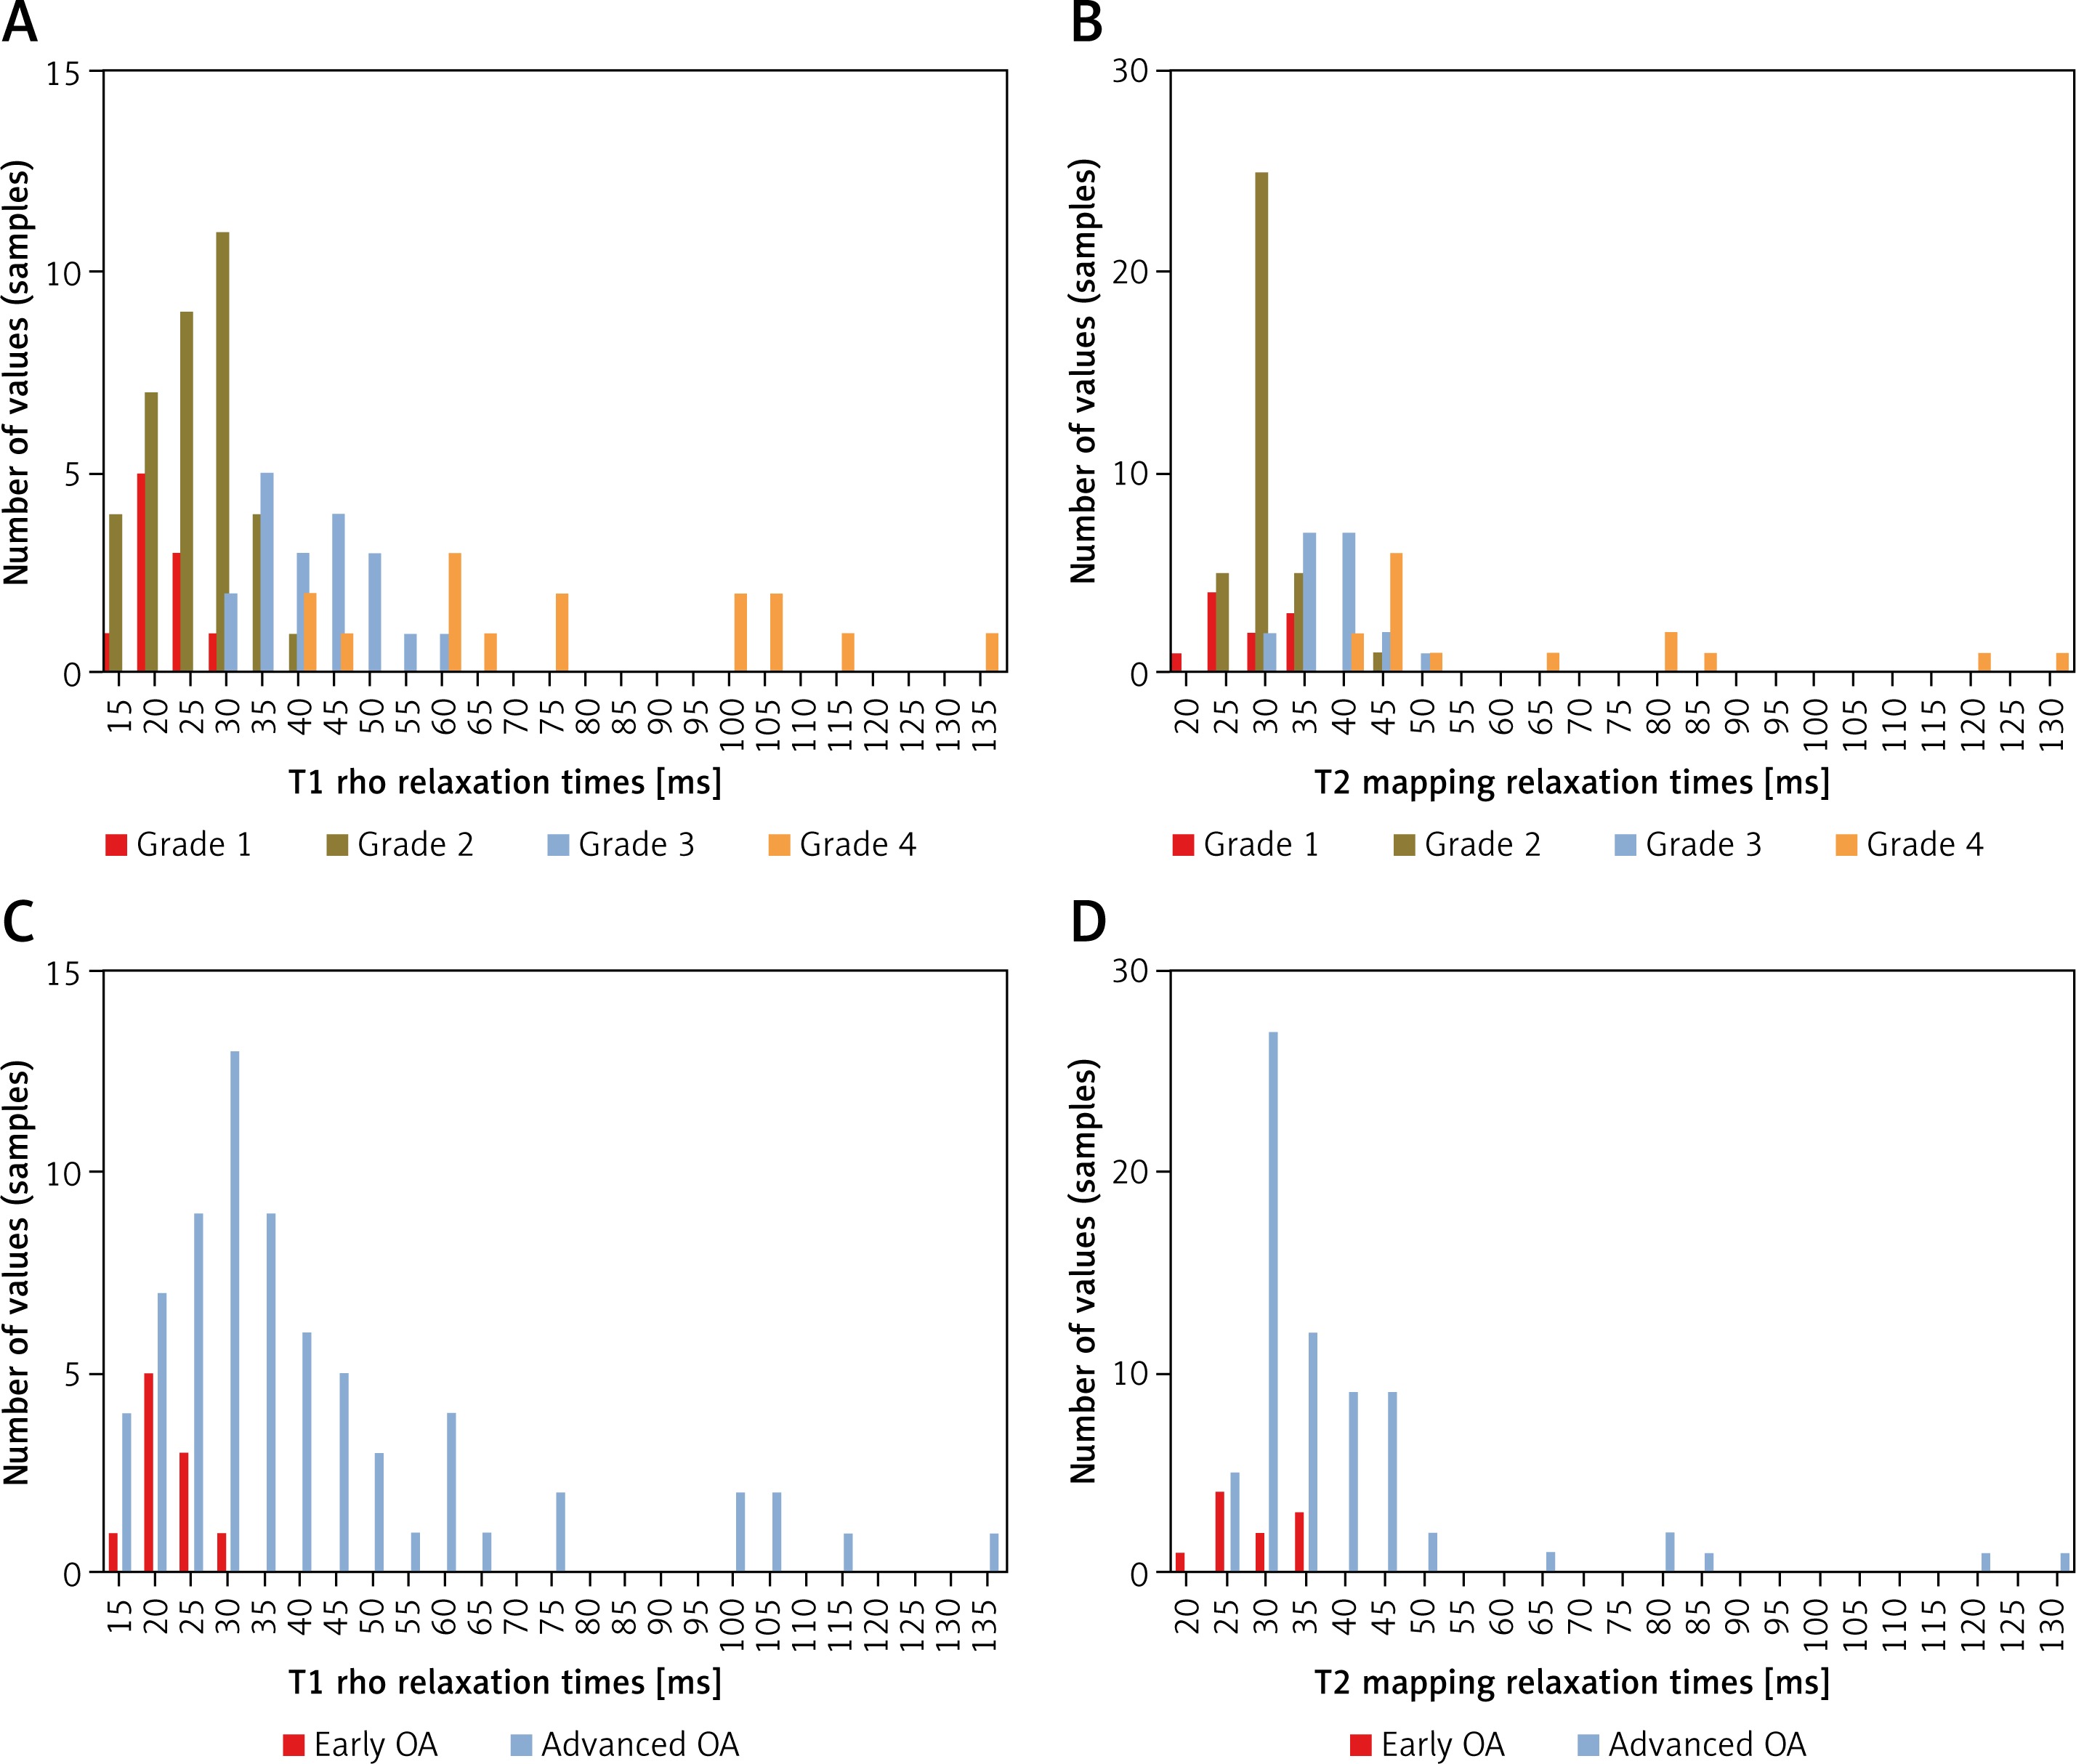
Of the 80 samples, 46 were early-stage OA, whereas the remainder had advanced OA. The sagittal T1 rho sequence was performed (Figure 1 A) and the ROI were drawn (Figure 1 B). The T2 image (FSE PDFs) and ROI of T2 were performed (Figures 1 D, E). The sagittal T2 mapping sequence was also performed (Figure 1 F) and T2 images were merged with the ROI of T2 mapping images (Figure 1 G). The femoral distal condyle and the femoral posterior condyle were outlined separately in T1 rho images (Figure 1 C) and T2 mapping images (Figure 1 H). For the whole sample, the mean T1 rho relaxation time of 80 samples was 39.17 ms (95% CI: 33.72–44.62) while the mean T2 mapping relaxation time of all samples was 37.98 ms (95% CI: 33.99–41.97). A significant difference was found in T1 rho/T2 mapping values between early-stage and advanced OA (p < 0.001) (Table I, Figure 5). Histograms of T1 rho/T2 mapping values classified as OARSI grades (grade 1–4) or early/advanced OA are shown in Figure 6.
Table I
T1 rho and T2 mapping values of ROIs between early and advanced OA
| Variable | T1 rho relaxation times [ms] | T2 mapping relaxation times [ms] |
|---|---|---|
| 80 samples | 39.17 ±2.74 | 37.98 ±2.00 |
| Early-stage OA | 25.20 ±0.87 | 29.81 ±0.52 |
| Advanced OA | 58.08 ±4.69 | 49.03 ±3.96 |
Figure 5
Mean relaxation times between early OA and advanced OA. A – T1 rho relaxation time values (ms) of 80 samples were divided into early OA and advanced OA. A significant difference was found between early-stage and advanced OA (p < 0.001). B – T2 mapping relaxation time values (ms) of 80 samples were divided into early OA and advanced OA. A significant difference was found between early and advanced OA (p < 0.001)
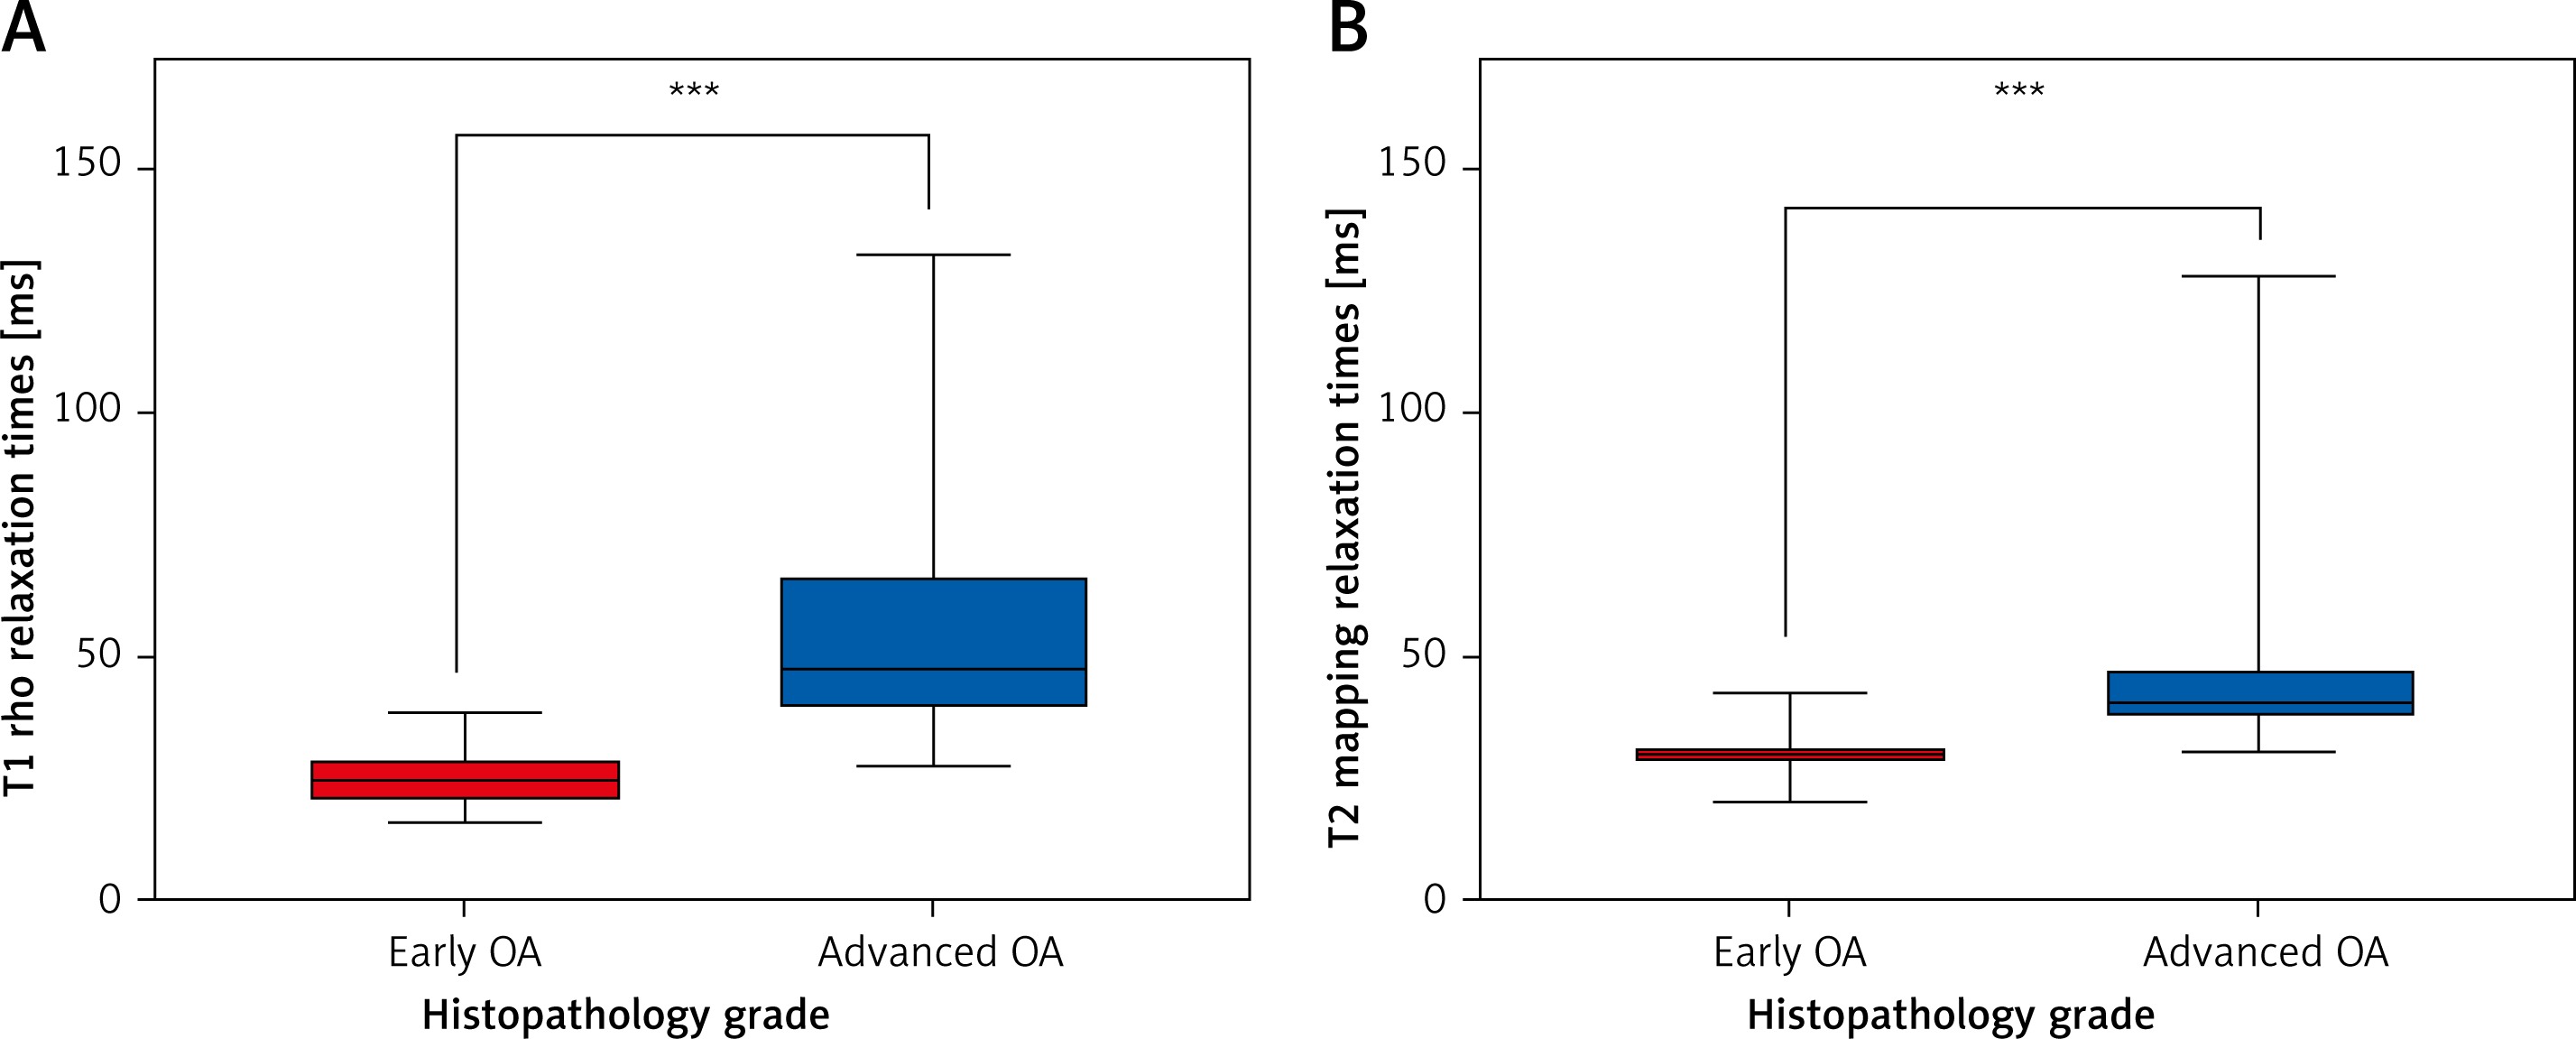
Figure 6
Histograms of relaxation times of different histopathology. A – Histograms of T1 rho relaxation times values (ms) were classified based on OARSI grades. B – Histograms of T2 mapping relaxation times values (ms) were classified based on OARSI grades. C – Histograms of T1 rho relaxation times values (ms) were divided into early OA and advanced OA. D – Histograms of T2 mapping relaxation time values (ms) were divided into early OA and advanced OA
ROC curves and cutoff points
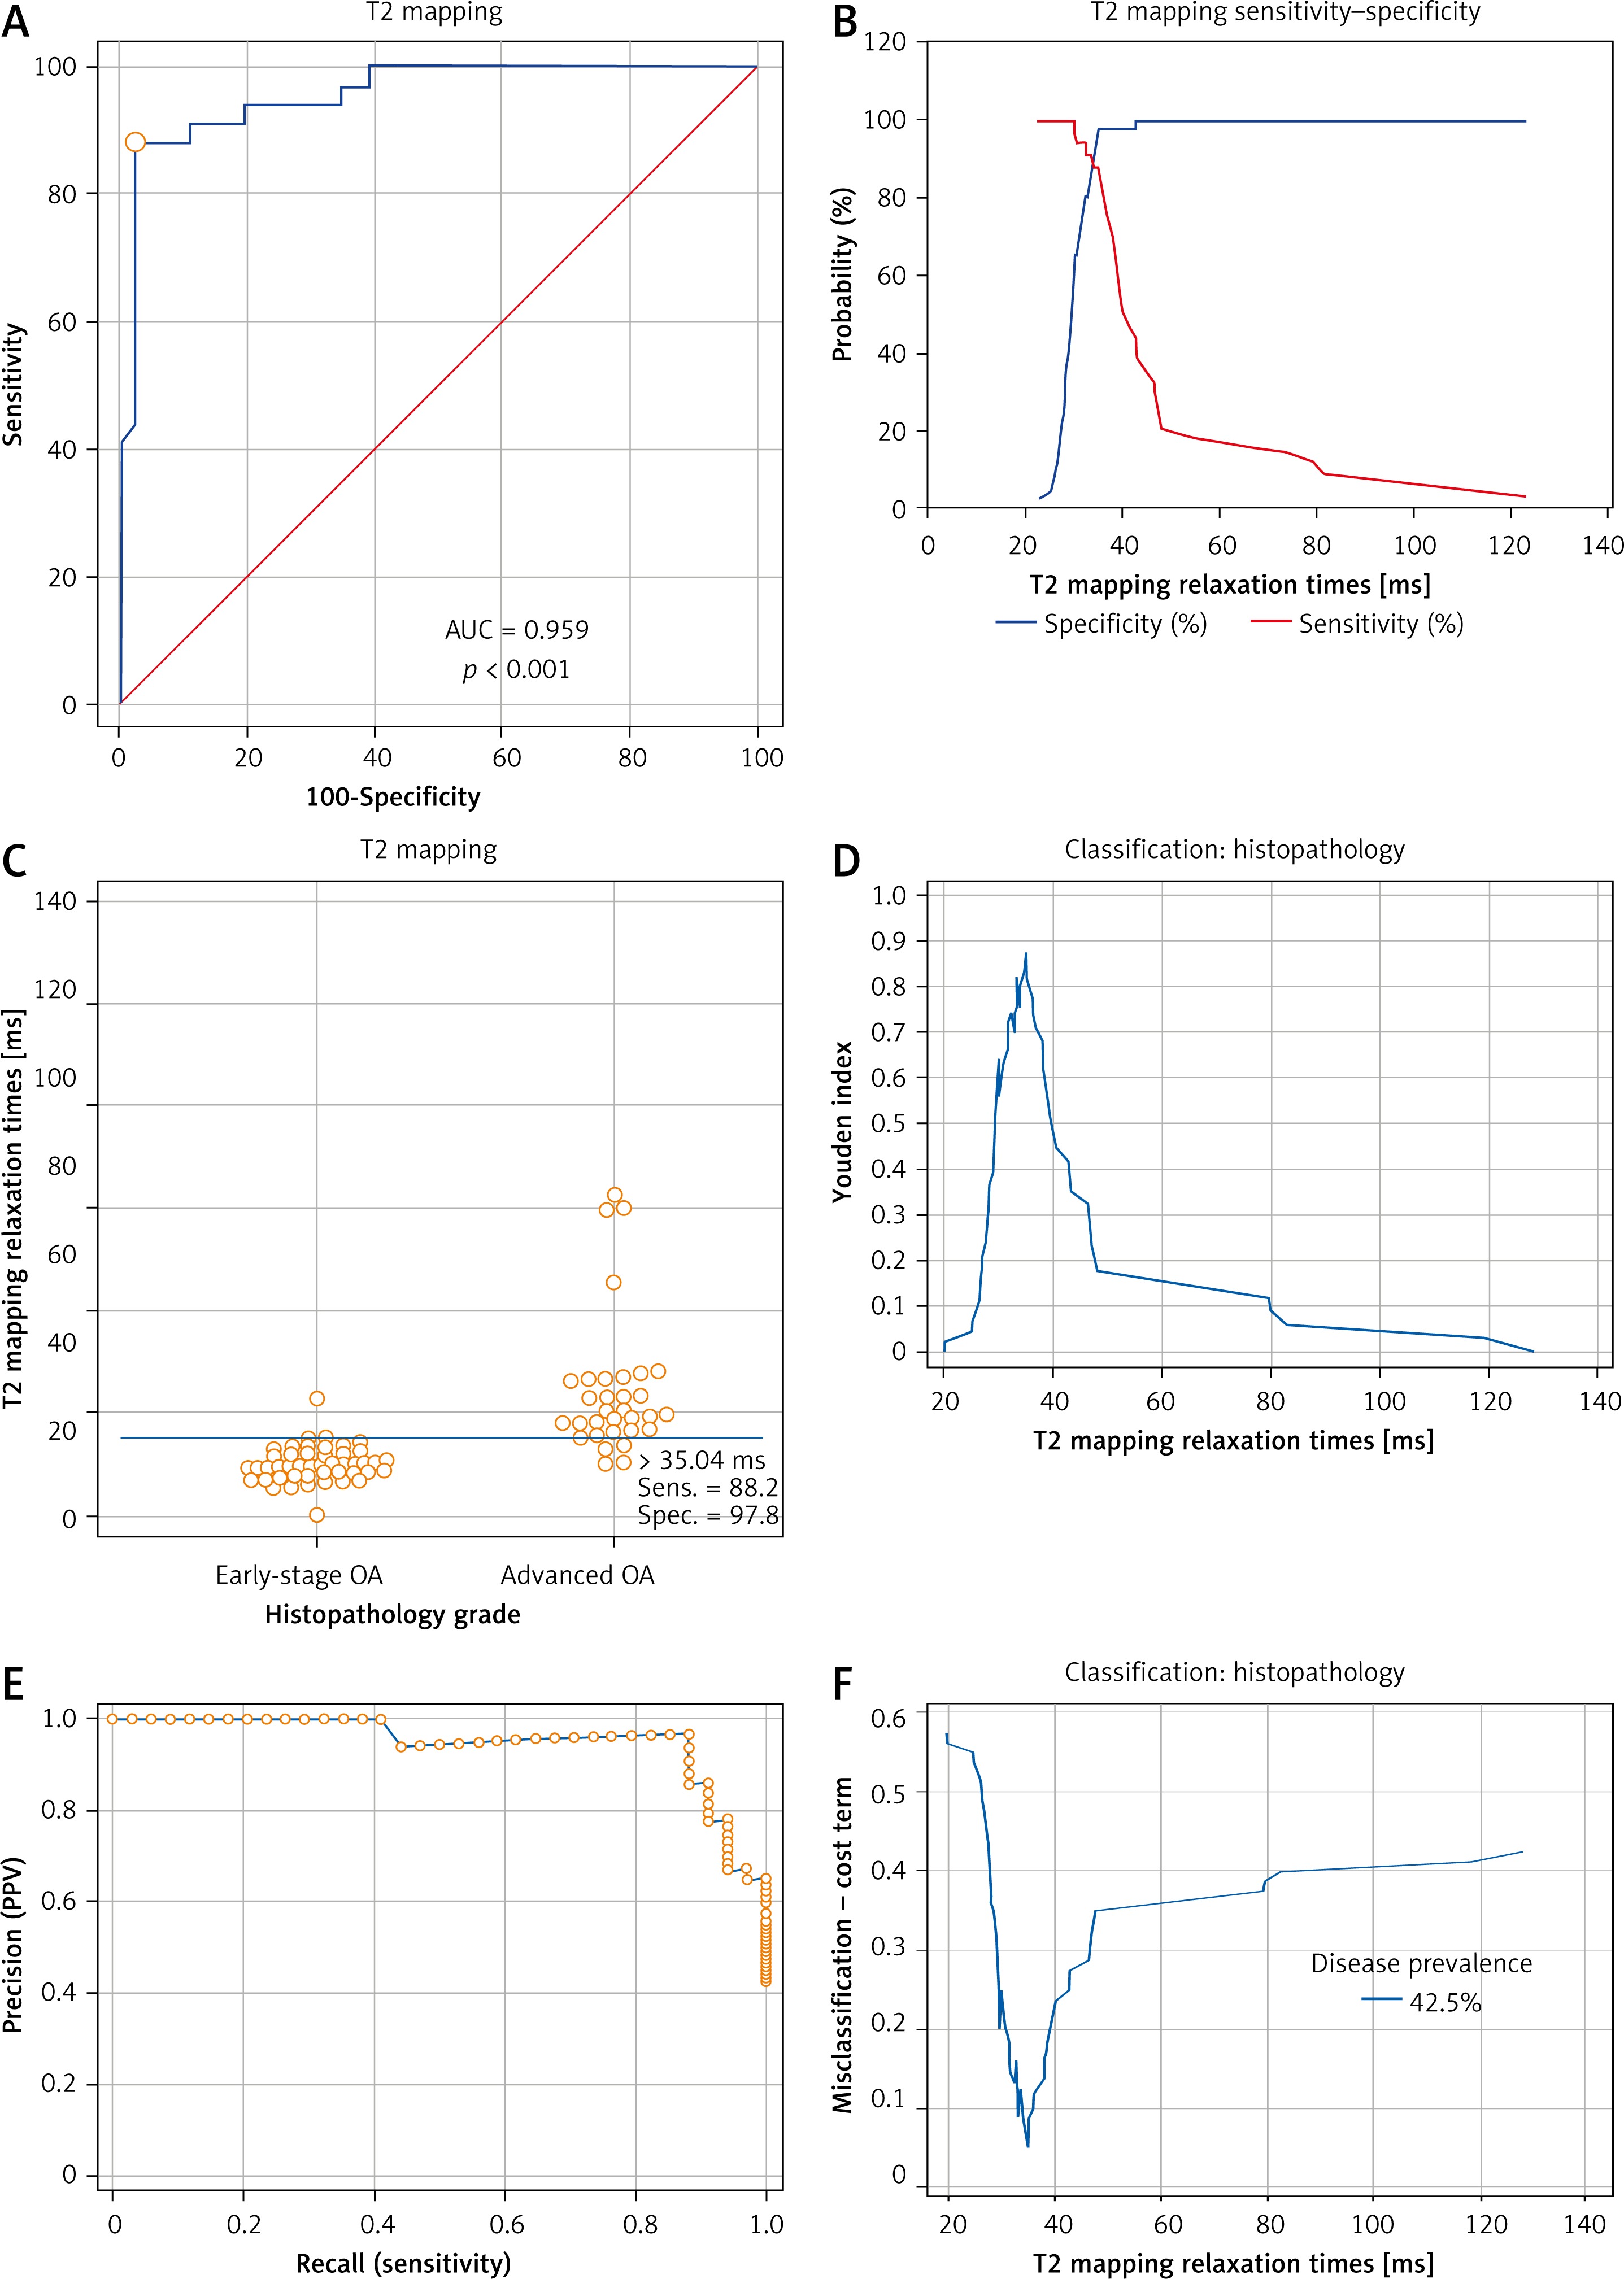
Figure 7 A and 8 A display the ROC curves which were used to distinguish between early OA and advanced OA. In Figure 7 A or 8 A, the area below the ROC curve (the blue curve) was defined as AUC. AUCs of these two ROC curves were both > 0.9 (Tables II and III). Figures 7 B and 8 B show the overlapping sensitivity–specificity curves. The point of intersection was suggested as the optimal criterion for differentiating early-stage and advanced OA. Interactive dot diagrams of early-stage OA and advanced OA are shown with each optimal criterion line (Figures 7 C, 8 C). Additionally, the Youden index was estimated (Figures 7 D, 8 D). The non-parametric method suggested a cutoff point at 33 ms for T1 rho with the sensitivity of 94.12 (95% CI: 80.3–99.3) and specificity of 91.30 (95% CI: 79.2–97.6) (Table II). The cutoff point for T2 mapping was 35.04 ms with a sensitivity of 88.24 (95%CI: 72.5–96.7) and specificity of 97.83 (95% CI: 88.5–99.9) (Table III). Precision recall (PR) curves of T1 rho and T2 mapping are also shown in Figures 7 E and 8 E. Figures 7 F and 8 F show the MCT plot with the lowest point on this curve corresponding to the optimal criterion. The highest point of the Youden index (Figures 7 D, 8 D) was at the same optimal criterion.
Table II
Area under the ROC curve (AUC) and Youden index of T1 rho
| Parameter | Value |
|---|---|
| Area under the ROC curve (AUC) | 0.976 |
| Standard errora | 0.0139 |
| 95% Confidence intervalb | 0.914–0.997 |
| z statistic | 34.296 |
| Significance level P (area = 0.5) | < 0.0001 |
| Youden index J | 0.8542 |
| Associated criterion [ms] | >33 |
| Sensitivity | 94.12 |
| Specificity | 91.30 |
Table III
Area under the ROC curve (AUC) and Youden index of T2 mapping
| Parameter | Value |
|---|---|
| Area under the ROC curve (AUC) | 0.959 |
| Standard errora | 0.0206 |
| 95% Confidence intervalb | 0.890 to 0.991 |
| z statistic | 22.267 |
| Significance level P (area = 0.5) | < 0.0001 |
| Youden index J | 0.8606 |
| Associated criterion [ms] | > 35.04 |
| Sensitivity | 88.24 |
| Specificity | 97.83 |
Figure 7
Receiver operating characteristic (ROC) curve and analysis of T1 rho. A – ROC curve of T1 rho relaxation times was established to find out the optimal criterion to distinguish mild OA and severe OA. Area under curve (AUC) was 0.976 (95% CI: 0.914–0.997, SE = 0.0139, p < 0.001). B – Sensitivity curve and specificity curve were intersected. The point of intersection was suggested as the optimal criterion to distinguish early OA and advanced OA. C – Interactive dot diagrams of early-stage OA and advanced OA were displayed with optimal criterion lines. D – Youden index was estimated. The highest point of the Youden index was at the same optimal criterion as the intersection point of the sensitivity-specificity curve. E – Precision recall (PR) curves of T1 rho relaxation times (ms) of 80 samples were also shown. F – The misclassification-cost term (MCT) plot showed that the lowest point corresponded to the optimal criterion
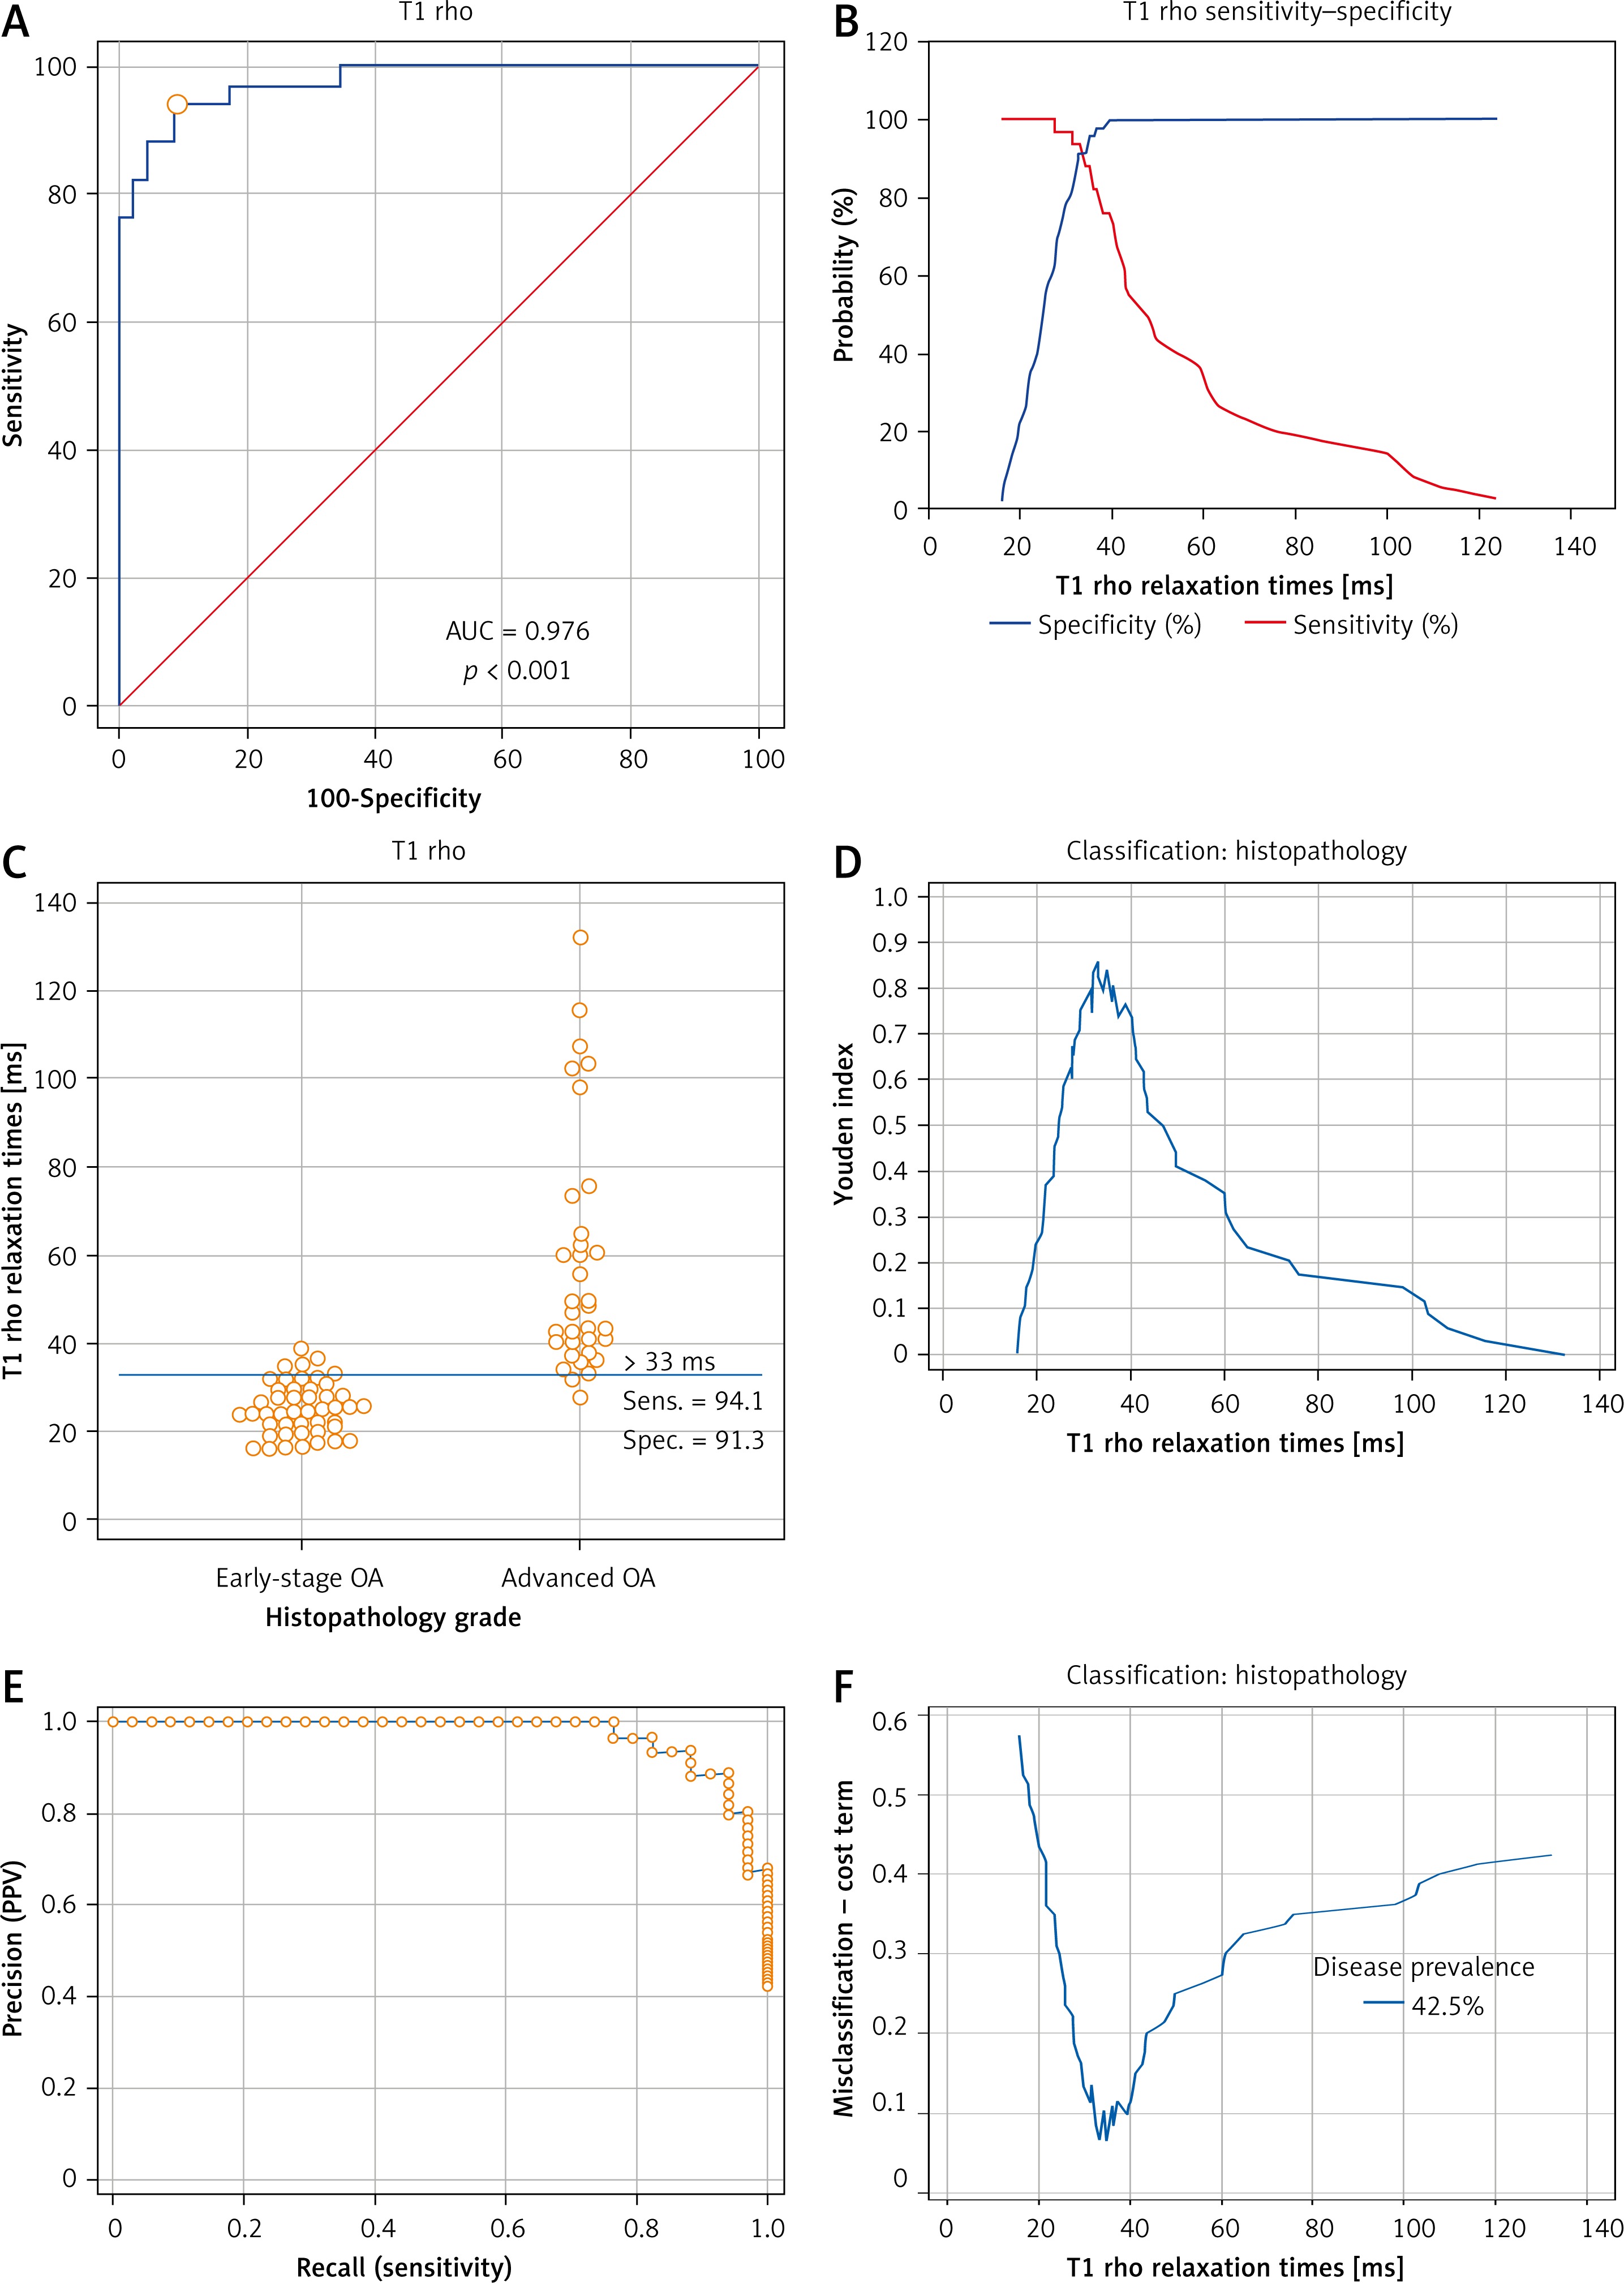
Figure 8
Receiver operating characteristic (ROC) curve and analysis of T2 mapping. A – ROC curve of T2 mapping was used to determine the distinguishing criterion between early-stage OA and advanced OA. AUC of ROC curve was 0.959 (95% CI: 0.890–0.991, SE = 0.0206, p < 0.001). B – The sensitivity curve and specificity curves are displayed for estimation of the optimal criterion of the ROC curve which was the intersection point of the sensitivity-specificity curve. C – Interactive dot diagrams of early OA and advanced OA are displayed with optimal criterion lines. D – The highest point of the Youden index was at the same optimal criterion. E – Precision recall (PR) curves of T2 mapping are also shown. F – The lowest point of the misclassification-cost term (MCT) plot was estimated at the same point as the optimal criterion
Bootstrap simulation
The bootstrap method was used to simulate ROC analysis which would determine the variable estimation of the ROC cutoff point. Ten thousand resamples, which were all different random number seeds, were simulated from original data of T1 rho and T2 mapping. After simulation, the 95% CI of T1 rho/T2 mapping AUC was suggested in Tables IV and V. The 95% CI of T1 rho/T2 mapping Youden index was also analyzed (Tables IV and V). After bootstrap simulation, the 95% CI of the T1 rho cutoff point was estimated as 29.36 to 36.32 ms and the 95% CI of the T2 mapping cutoff point was estimated as 34.8 to 35.04 ms.
Table IV
Area under the ROC curve (AUC), Youden index and optimal criterion of T1 rho
| Parameter | Value |
|---|---|
| Area under the ROC curve (AUC) | 0.976 |
| Standard errora | 0.0137 |
| 95% Confidence intervalb | 0.914–0.997 |
| 95% Bootstrap CIc | 0.928 to 0.993 |
| z statistic | 34.818 |
| Significance level P (area = 0.5) | < 0.0001 |
| Youden index J | 0.8542 |
| 95% Confidence intervala | 0.6995–0.9271 |
| Associated criterion [ms] | > 33 |
| 95% Confidence intervala | > 28.78178319 to > 36.32 |
| Sensitivity | 94.12 |
| Specificity | 91.30 |
| Optimal criteriond [ms] | > 33 |
| 95% Confidence intervalb [ms] | > 29.36 to > 36.32 |
| Sensitivity | 94.12 |
| Specificity | 91.30 |
Table V
Area under the ROC curve (AUC), Youden index and optimal criterion of T2 mapping
| Parameter | Value |
|---|---|
| Area under the ROC curve (AUC) | 0.959 |
| Standard errora | 0.0205 |
| 95% Confidence intervalb | 0.890–0.991 |
| 95% Bootstrap CIc | 0.898 to 0.988 |
| z statistic | 22.363 |
| Significance level P (area = 0.5) | < 0.0001 |
| Youden index J | 0.8606 |
| 95% Confidence intervala | 0.7136–0.9488 |
| Associated criterion [ms] | > 35.04 |
| 95% Confidence intervala | > 34.8 to > 35.04 |
| Sensitivity | 88.24 |
| Specificity | 97.83 |
| Optimal criteriond [ms] | > 35.04 |
| 95% Confidence intervalb [ms] | > 34.8 to > 35.04 |
| Sensitivity | 88.24 |
| Specificity | 97.83 |
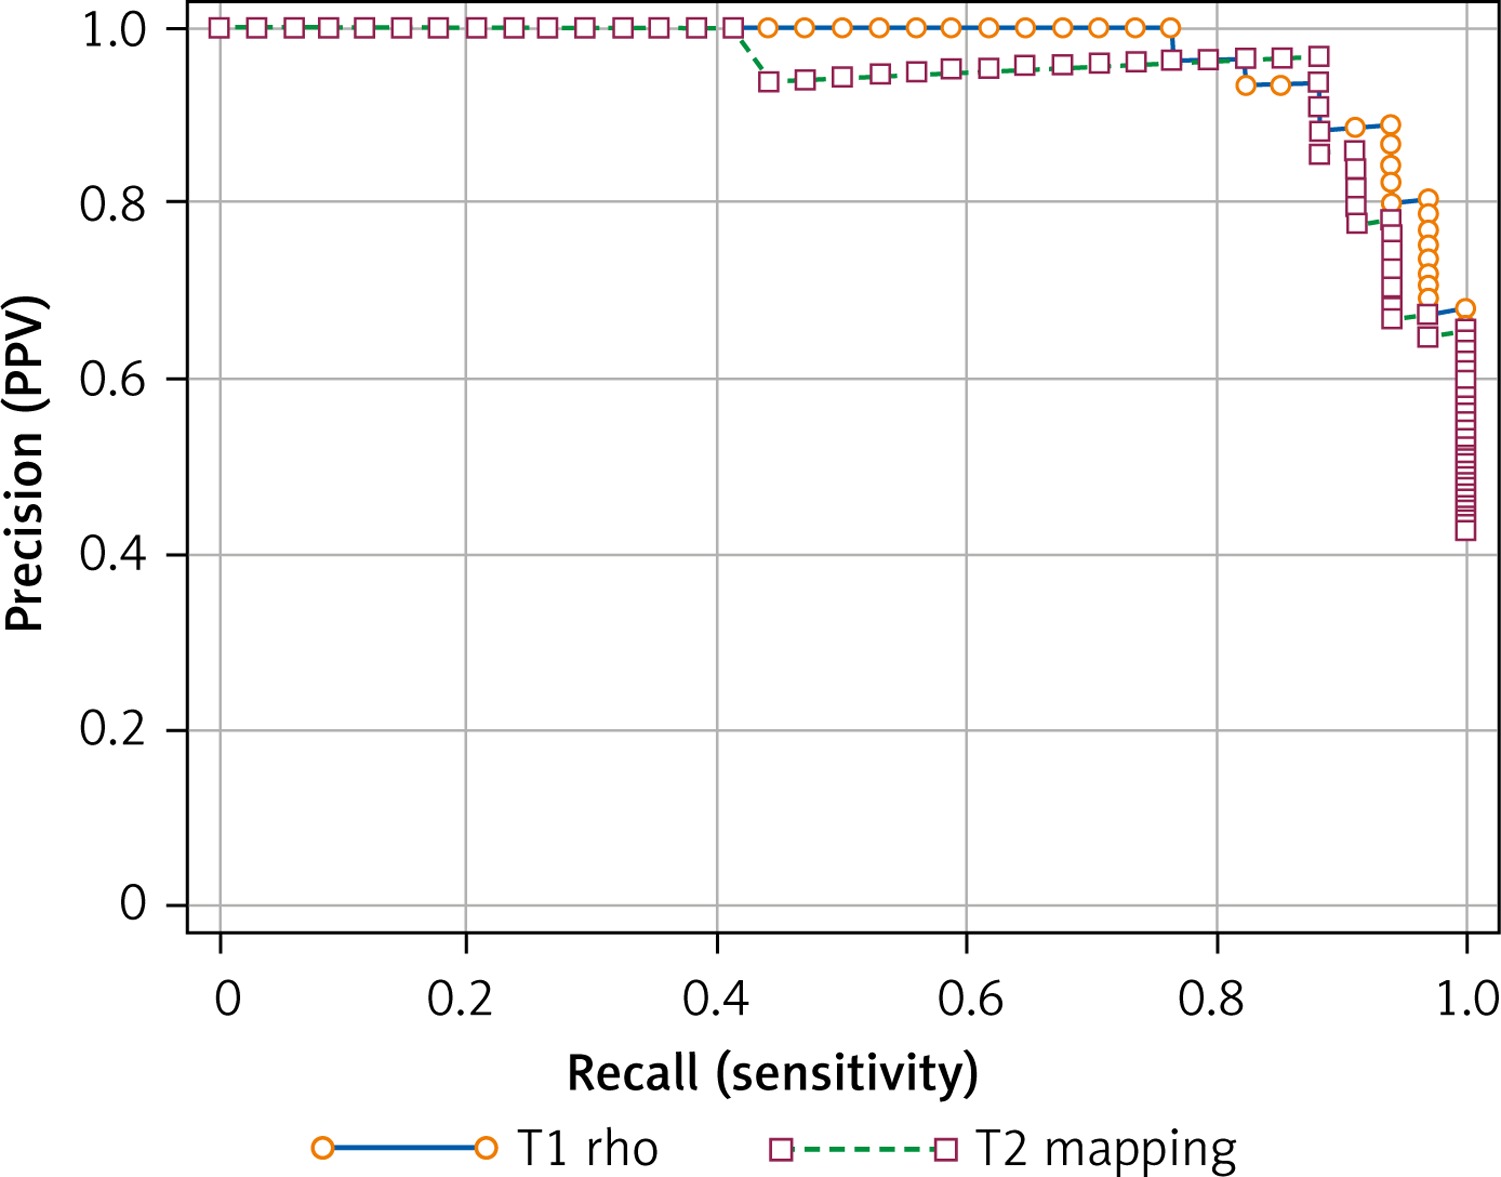
Precision-recall curves of T1 rho and T2 mapping were analyzed after bootstrap simulation (Figure 9). The area under the PR curve of T1 rho was significantly greater than that of T2 mapping (Table VI). The difference between these two areas was estimated at 0.02314.
Table VI
Comparison of precision-recall curves
| Parameter | Value |
|---|---|
| Variable | T1rho |
| Area under curve | 0.972 |
| 95% Bootstrap CIa | 0.925 to 0.992 |
| F1max | 0.914 |
| Associated criterion [ms] | > 33 |
| Variable | T2mapping |
| Area under curve | 0.949 |
| 95% Bootstrap CIa | 0.877 to 0.989 |
| F1max | 0.923 |
| Associated criterion [ms] | > 35.04 |
| Difference between areas | 0.02314 |
| 95% Bootstrap CIa | 4.8298E-16 to 0.07229 |
Figure 9
Precision-recall curve of T1 rho and T2 mapping. A bootstrap simulation was applied to assess the reliability of optimal criteria between T1 rho and T2 mapping. The area under the PR curve of T1 rho was significantly greater than that of T2 mapping, which suggested that the optimal criterion of T1 rho might be more reliable
Discussion
The histopathology assessment system of cartilage is the gold standard to evaluate cartilage damage [12, 15]. The Histologic/Histochemical Grading System (HHGS) was established to evaluate the quality of cartilage. However, this grading system was established from well-advanced OA cartilage samples. Early-stage OA could not be evaluated properly by HHGS [16]. Thus, the Osteoarthritis Research Society International (OARSI) Cartilage Histopathology Assessment System (OOCHAS) system is recommended for studies investigating the association between histopathology and other parameters [16, 17]. The OARSI system (OOCHAS system) included a grade methodology, stage assessment and scoring method. The OARSI grade methodology illustrated depth-damaging progression into cartilage, including grades 0–6. The OARSI stage assessment illustrated the extent of joint involvement and scoring of points was the result of the grade times stage. A previous study [17] assumed that OA involving deeper cartilage degeneration was much more advanced and a good indicator of progressive disease. OARSI stage assessment was based on the horizontal extent of the injured cartilage surface and was categorized by percentage. However, the image analysis method [2] or post-operative guideline of dividing condyles into different sections could not ensure that each sample had an equal horizontal extent, which might affect the denominator of the percentage. As a result, we considered that the OARSI stage was a bias in this case. Therefore, we chose the OARSI grade methodology as the post-operative gold standard of cartilage damage. Considering that there is sclerotic bone or reparative tissue but no cartilage involvement in OARSI grade 5 and grade 6, it was presumed to be incapable of measuring T1rho/T2 mapping in MRI.
While cartilage edema and irregularity occurred in the superficial layer of cartilage in OARSI grade 1, and fibrillation occurred in OARSI grade 2, the microstructure and mechanical properties of the perichondral matrix changed. A previous study [12] showed significant differences in biomechanical properties between OARSI grade 1 and grade 2, while no significant differences were shown in aggregate modulus from OARSI grade 2 to grade 5. No visible superficial degeneration existed in OARSI grade 1 cartilage; however, superficial fibrillation, cell death, and mechanical changes existed simultaneously. Preoperative detection of these changes might provide an appropriate opportunity to take precautions against the pathological progress of osteoarthritis. More notably, the composition of the extracellular matrix of OARSI grade 2 cartilage had changed [18, 19], especially the collagen fiber arrangement. Many in vitro studies [20–22] regard the treatment before degeneration of extracellular matrix and superficial fissure as the key for early treatment of knee osteoarthritis. The lack of a preoperative imaging cutoff point was the key issue hindering the application of this research in patients. Hence, the earlier OARSI grade 1/2 is identified, the more opportune it is to prevent pathological progression.
However, in general, the criteria of early-stage OA included cartilage degeneration, which reflected OARSI grade 3-4 [10, 11, 23]. To identify an earlier stage of OA, which could demonstrate the changes of microstructure and mechanical properties, OARSI grade 0/1 was defined as early-stage OA while OARSI grade 2–4 was considered as advanced OA, which all could be measured by T1 rho/T2 mapping. This kind of classification was essential to be applied to explore the possibility of T1 rho/T2 mapping in detecting different changes of cartilage that could not be detected by morphological MRI, but whose mechanical structure had changed significantly.
Palmer’s study [10] demonstrated that morphological MRI could identify OARSI grade 3; however, these routine knee MRI sequences were not sufficient for the assessment of earlier-stage OA. Physiologic imaging techniques such as T1 rho/T2 mapping were needed for the evaluation of early-stage cartilage abnormalities (OARSI grade 0/1). T1 rho/T2 mapping could be used to reflect the proteoglycan or collagen fiber arrangement and water content in the early stage of cartilage. T1rho could describe the spin-lattice relaxation, thus reflecting the interaction effect between proteoglycan content in the cartilage extracellular matrix and the motion-restricted water molecules [1]. Previous studies [24, 25] suggested that the relaxation time value of T1 rho was related to the arrangement of collagen fibers in the extracellular matrix. Nishioka [26] found that T2 mapping was mainly affected by the changes in collagen fiber and water arrangement. Relevant literature [9, 27–29] also confirmed that T2 mapping and T1 rho measurements could be used to determine whether articular cartilage was damaged. Current T1 rho/T2 mapping studies have focused on comparing T2 and T1 rho relaxation times between different OA clinical grades. However, few studies have focused on discussing T1 rho/T2 mapping relaxation time cutoff points of different OARSI grades of OA. A key cutoff point that could discern the mechanical changes and microstructure changes with no visible superficial degeneration was important for in vitro experiments and clinical treatment. Although some mechanical tools could be used to detect microstructural changes, it was impossible to apply them preoperatively. Based on this, our study further analyzed the specific cutoff point of T1 rho/T2 mapping which could be used to judge the severity of cartilage damage before surgery, especially to distinguish edema cartilage and fibrillation cartilage with biomechanical changes.
To identify the 95% confidence intervals the resample method should be used given that T1 rho/T2 mapping could not be applied in such a large number of patients due to its cost. Through bootstrap (Monte Carlo) simulation, multiple independent random samples could be obtained from the original data, and the 95% confidence interval of the cutoff point could be estimated. Given this large number of replicates (10 000 random bootstrap simulation resamples in our study), 95% confidence intervals could be measured. We also compared the reliability of the cutoff point of T1 rho and T2 mapping. We further found that the measurement of T1 rho rather than T2 mapping could reveal the subtle changes of cartilage histopathologically.
These findings could play an important role in the earlier recognition and treatment of osteoarthritis. The cutoff point of T1 rho might be used as the key implication for the mechanical and microstructure changes of OA cartilage. At the same time, for physicians, early recognition of OA cartilage before superficial degeneration could be beneficial to patients. Furthermore, the T1 rho cutoff point could be key to determine which patients may benefit from preservation strategies and which are better candidates for joint surgery (since arthroscopy or joint replacement is applied for cartilage morphological degeneration). In addition, this diagnostic method may be used to develop personalized treatment for patients. For example, it might decide what kind of exercise or rehabilitation strategy should be adopted in the early stage to delay the progress of osteoarthritis and preserve the integrity of cartilage structure.
This study is not without limitations. The cutoff point of T1 rho/T2 mapping could only distinguish the difference between OARSI grade 1 and OARSI grade 2. To identify the occurrence of OA earlier, more updated non-invasive tools are needed in the future. In general, changes of OARSI grade 1 cartilage were more in the microstructure and chondrocytes. At the same time, the onset of knee osteoarthritis was not determined. The debate about knee OA originating from the cartilage or the subchondral bone is ongoing. More updated preoperative techniques are required to identify these onset changes microstructurally. Since the detection of T1 rho/T2 mapping itself could be performed in the existing MRI, it was of great significance for its promotion among hospitals. However, this technology itself was not prevalent, which may be a limitation. Only 80 samples undergoing TKA were employed in this study. Although the Monte Carlo method was used for bootstrap simulation, a larger sample size might be needed to consolidate our conclusions. Further long-term follow-up prospective clinical research is needed.
In conclusion, the cutoff point of the mean T1 rho relaxation time value (> 33 ms) might be used as the measurement for identifying advanced OA. T1 rho relaxation times might be a better measurement than T2.