Introduction
Neuroendocrine tumors (NETs) are a heterogenous group of neoplasms originating from endocrine cells and the nervous system, with different clinical expression. The most frequent primary tumors are seen in the gastrointestinal tract and lungs, as well as metastatic disease [1, 2].
Histologically NETs are divided into well-differentiated and poorly differentiated neuroendocrine neoplasms, and more specifically according to the degree of cell differentiation into low-grade, intermediate-grade, and high-grade tumors. Based on the mitotic index and Ki67-cell proliferation markers, well-differentiated tumors are grouped into NET G1 (low-grade), NET G2 (intermediate grade) and NET G3 (high grade), and poorly differentiated tumors are classified as neuroendocrine carcinomas (NEC G3) [3, 4].
Neuroendocrine tumors can be sporadic but also hereditary, as a family syndrome such as multiple endocrine neoplasia type 1 and 2 (MEN1, MEN2), von Hippel-Lindau (VHL) disease, neurofibromatosis type 1 and others [5–7].
Because of their ability to grow slowly, NETs can be indolent and discovered incidentally or manifest with a number of hormonal symptoms and syndromes such as Zollinger-Ellison syndrome or Verner-Morrison syndrome [8, 9].
For the detection of NETs, several different radiological imaging modalities are used – magnetic resonance, computed tomography, ultrasound, radiography and endoscopy – which lack the ability of functional characterization of the lesions [1, 10]. In addition, due to intra- and inter-tumor heterogeneity, characterization of the biological aggressiveness of NETs is difficult to assess. Therefore, the utility of nuclear medicine methods, using various tracers, in the detection of NETs is rising. Most of the NETs show increased expression of somatostatin receptors, which is why somatostatin receptor scintigraphy (SRS) with 99mTc-EDDA/HYNIC TOC (Tektrotyd) (TCT) and indium-111 pentetreotide (Octreotide), as a conventional nuclear medicine method, is used for staging, restaging and monitoring the therapy response of somatostatin analogue radionuclide therapy [11–13]. Positron emission tomography/computed tomography (PET/CT) using 68Ga-DOTA-TATE, 68Ga-DOTA-TOC, and 68Ga-DOTA-NOC, which show affinity for somatostatin receptors (SST2, SST3, SST5), are also used in the detection of slow growing NET and in identification of somatostatin or peptide receptor radionuclide therapy. PET/CT with 18F-fluorodeoxyglucose (18F-FDG PET/CT) reflects increased cancer cell glucose metabolism and is indicated in high grade and poorly dedifferentiated forms of NET, i.e. in more aggressive tumors [14, 15].
Radiotracers’ uptake on 18F-FDG PET/CT and SRS also has a prognostic role. The prognosis can range from weeks to many years for metastatic disease; therefore accurate prediction parameters for the progression of the disease are important to guide optimal management. The integration of the imaging information from separate SRS and 18F-FDG PET scans has been proposed as a promising comprehensive imaging biomarker and combination of 18F-FDG PET positive and SRS negative findings is likely to have poorer prognosis [16, 17]. Therefore, two aims of this study were to a) evaluate the diagnostic value of SRS with 99mTc-Tektrotyd (TCT) and 18F-FDG PET/CT in the detection and follow-up of NETs and b) to determine whether TCT and 18F-FDG PET/CT findings are predictors of disease progression in patients with NETs.
Material and methods
Patients
In this cohort retrospective study, TCT and 18F-FDG PET/CT were performed in 90 patients (37 men and 53 women, mean age 52.7 ±15.1) during 2016–2019. All of the patients had pathohistological verification of NET (Table I). The results of 18F-FDG PET/CT and TCT were compared to the results of follow-up of at least 6 months and up to 9 years after imaging, median 61 months.
Table I
Patients’ demographic and tumor information
Acquisition and interpretation of 99mTc-Tektrotyd scintigraphy findings
99mTc-Tektrotyd scintigraphy was performed 120 min and 24 h after injecting 740 MBq (20 mCi) 99mTc-EDDA/HYNIC TOC intravenously, on an ECAM gamma camera and ESOFT using a high resolution collimator and one photopeak activity (140 keV ±20%). SPECT was done for better orientation with 360º orbit, step and shoot mode, 30 s/view. Data were reconstructed with filtered back-projections using Butterworth (cut-off 0.6 cycles/pixel) and iterative reconstruction. Firstly, visual interpretation of the whole body was done followed by SPECT images and an increased focal uptake of the tracer was considered to be a positive finding. Afterwards, Krenning score was used to assess radiopharmaceutical uptake of neuroendocrine tumors on somatostatin receptor imaging (0 – no uptake, 1 – very low uptake, 2 – less than or equal to that in liver, 3 – higher than liver, 4 – higher than spleen and kidneys) [18].
Acquisition and interpretation of 18F-FDG PET/CT findings
A 18F-FDG PET/CT scan was performed on a 64-slice hybrid PET/CT (Biograph, TruePoint64, Siemens Medical Solutions, Inc. USA) in the National PET Center of the Clinical Center of Serbia, 1 h after i.v. administration of 5.5 MBq/kg of 18F-FDG and 6 h after fasting. Low-dose contrast unenhanced CT scans (120 kV with automatic, real-time dose modulation amperage, slice thickness of 5 mm, pitch of 1.5 and a rotation time of 0.5 s) and 3-dimensional PET scans (6–7 fields of view, 3 min/field) were acquired from the base of the skull to the mid-thigh. Attenuation corrected and uncorrected low dose CT without contrast, PET and fused PET/CT scans were presented on a Syngo Multimodality workstation. Regions of increased FDG uptake were analyzed visually and semi-quantitatively using the maximal standardized uptake value (SUVmax). 18F-FDG PET/CT findings were considered positive if the pathological uptake was higher than the uptake of liver and mediastinal blood vessels.
Statistical analysis
The results were presented as frequency (percent), mean ± standard deviation (SD) and median (95% CI). Diagnostic performance of TCT and 18F-FDG PET/CT was determined by calculating specificity, sensitivity and diagnostic accuracy. The Spearman rank correlation coefficient was used to assess the correlation between Ki67 and the tumor grade versus SUVmax and Krenning score. Progression-free survival (PFS) was assessed by Kaplan-Meier survival analysis. Cox regression analysis was used to identify the association between progression-related factors and PFS. Statistical hypotheses were tested using a significance level of 0.05.
Results
99mTc-Tektrotyd scintigraphy and 18F-FDG PET/CT findings
Out of 90 patients, true positive TCT was detected in 56 (62.2%) patients (Figure 1), true negative in 19 (21.1%), false positive in 4 (4.4%), false negative in 11 (12.2%). A Krenning score of 1 was found in 7 patients, a score of 2 in 16, a score of 3 in 24, and a score of 4 in 13 patients. Diagnostic sensitivity of TCT was 83.6%, specificity 82.6% and accuracy 83.3% (Table II).
Table II
Diagnostic performance of 99mTc-Tektrotyd scintigraphy and 18F-FDG PET/CT
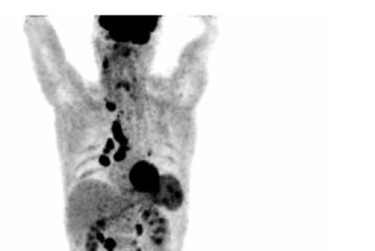
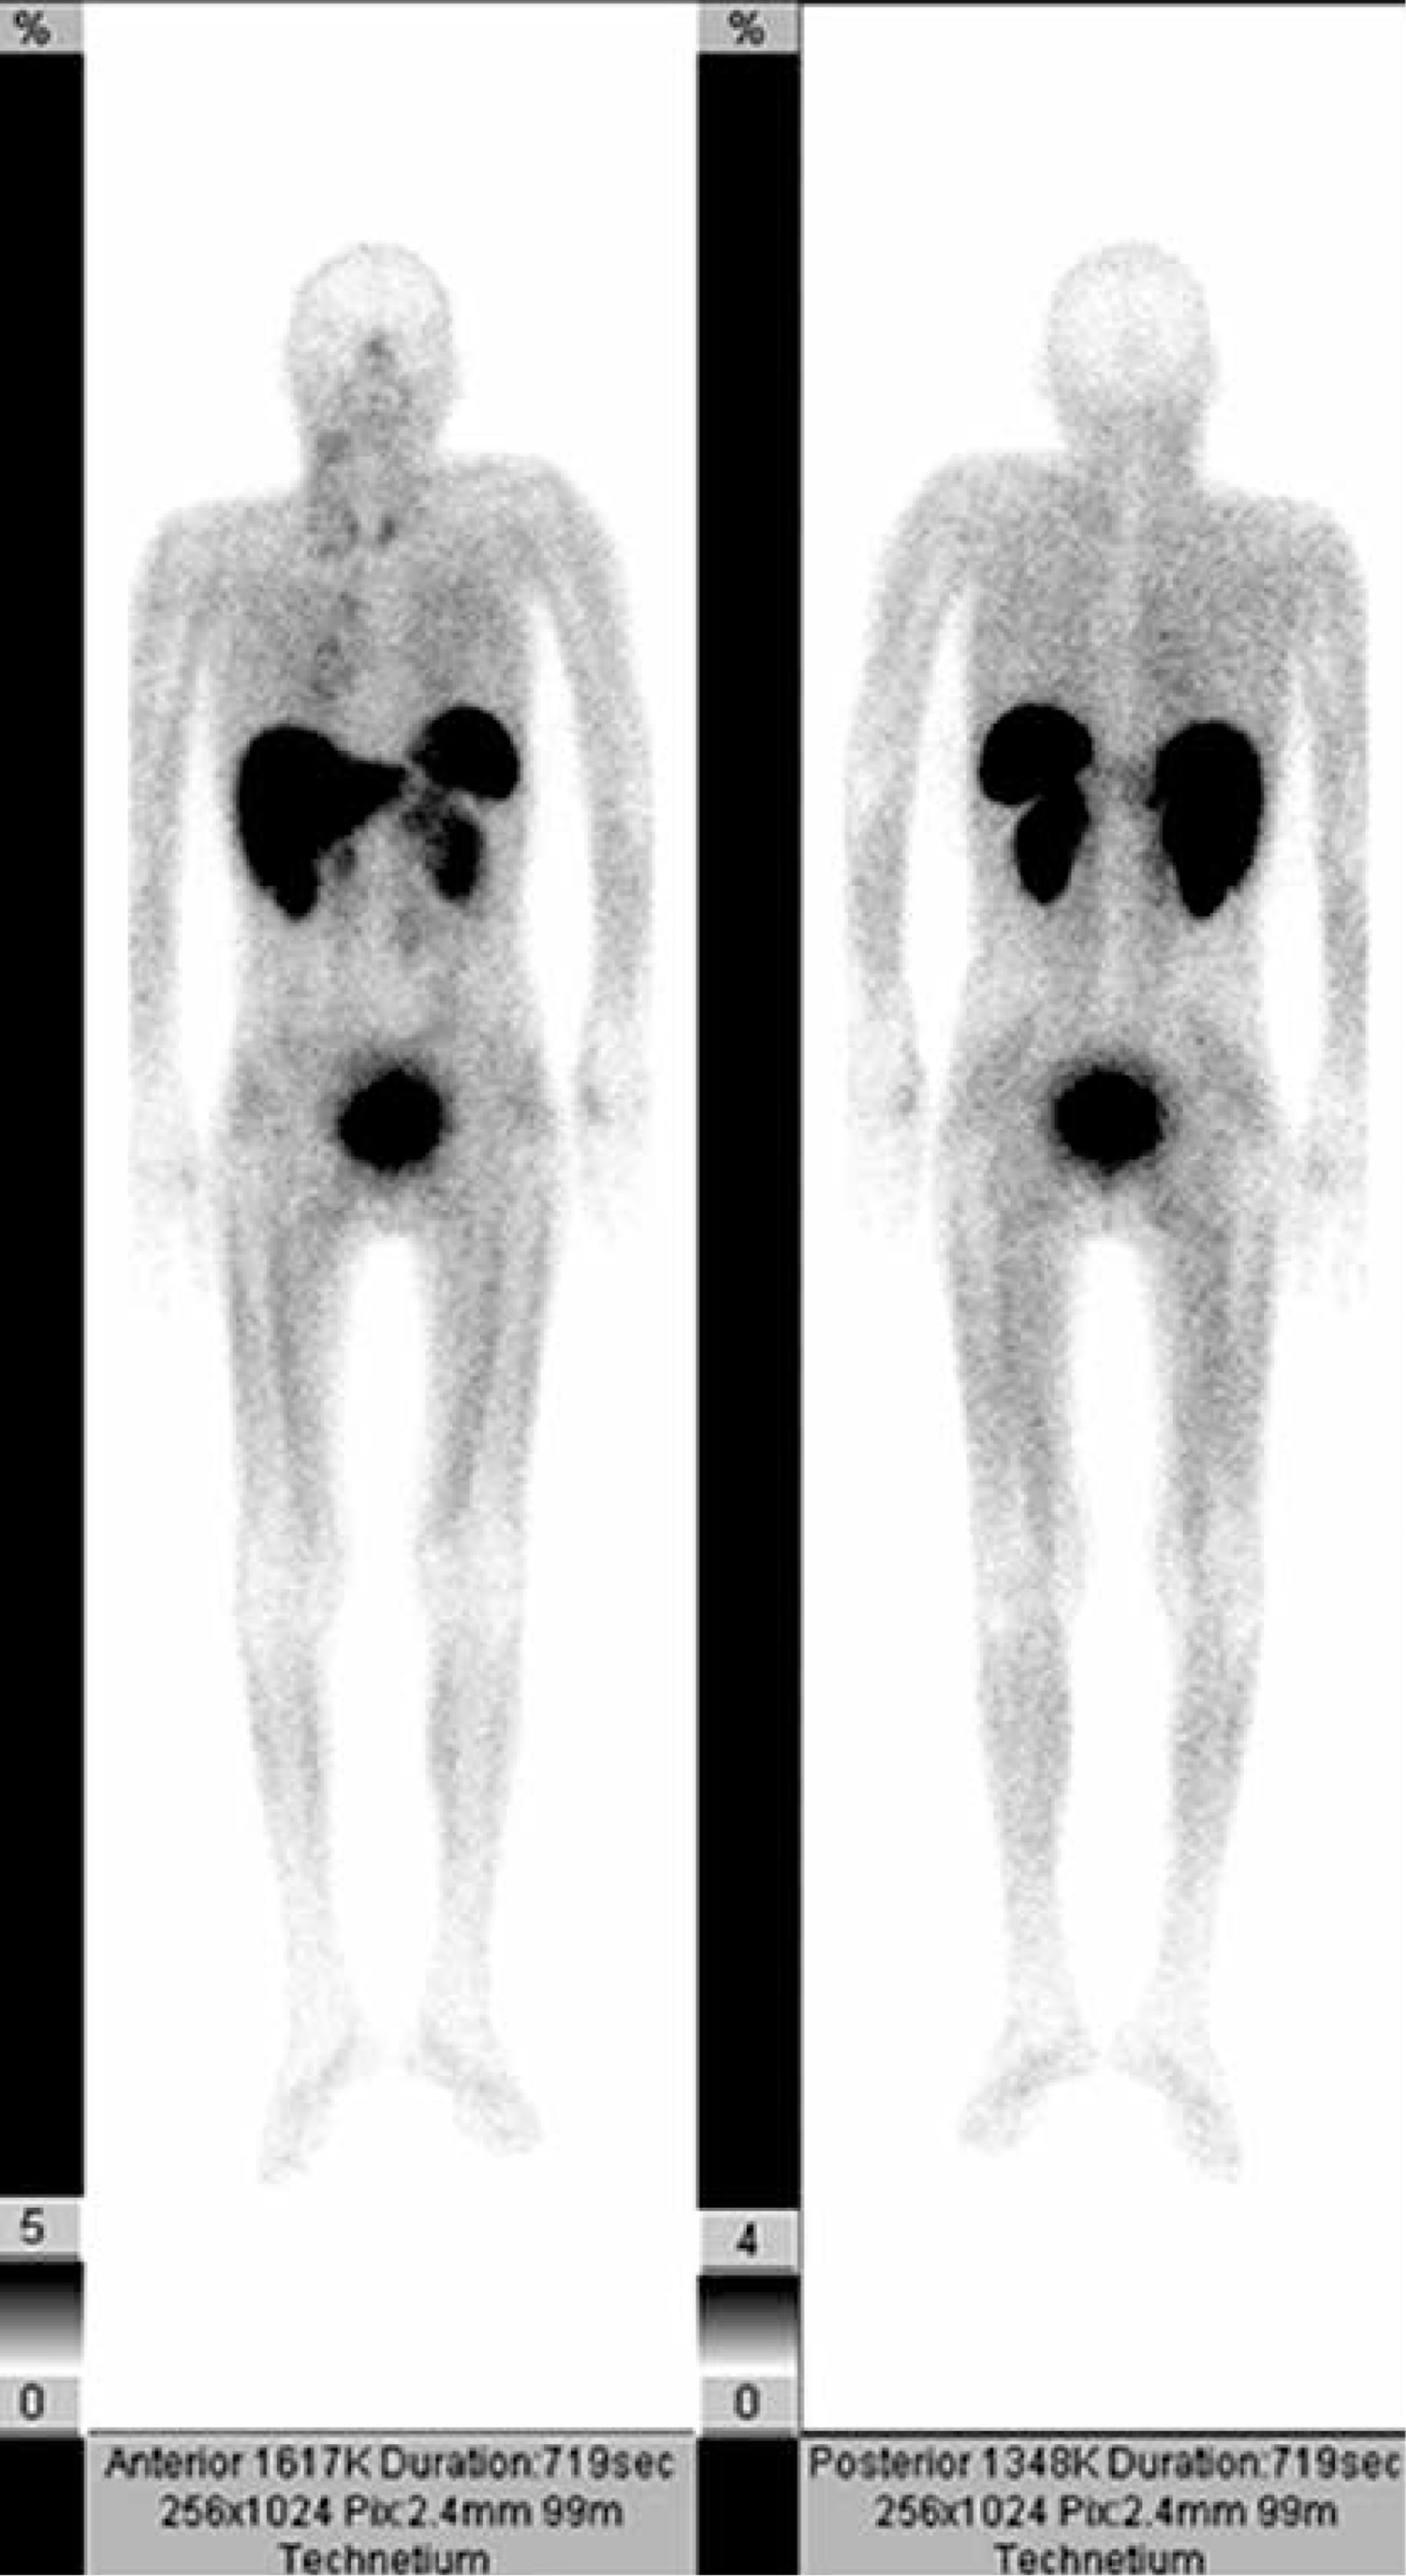
Figure 1
Anterior and posterior projection of 99mTc-Tektrotyd scintigraphy: positive finding in a 46-year old patient with medullary thyroid carcinoma with a Krenning score of 1 in mediastinal lymph nodes and the thyroid gland
18F-FDG PET/CT findings were true positive in 69 (76.7%) patients (Figure 2), true negative in 10 (11.1%), false positive in 5 (5.5%), false negative in 6 (6.7%). The mean SUVmax value was 6.8 +6.2. Diagnostic sensitivity of 18F-FDG PET/CT was 92.0%, specificity 66.7% and accuracy 87.8% (Table II).
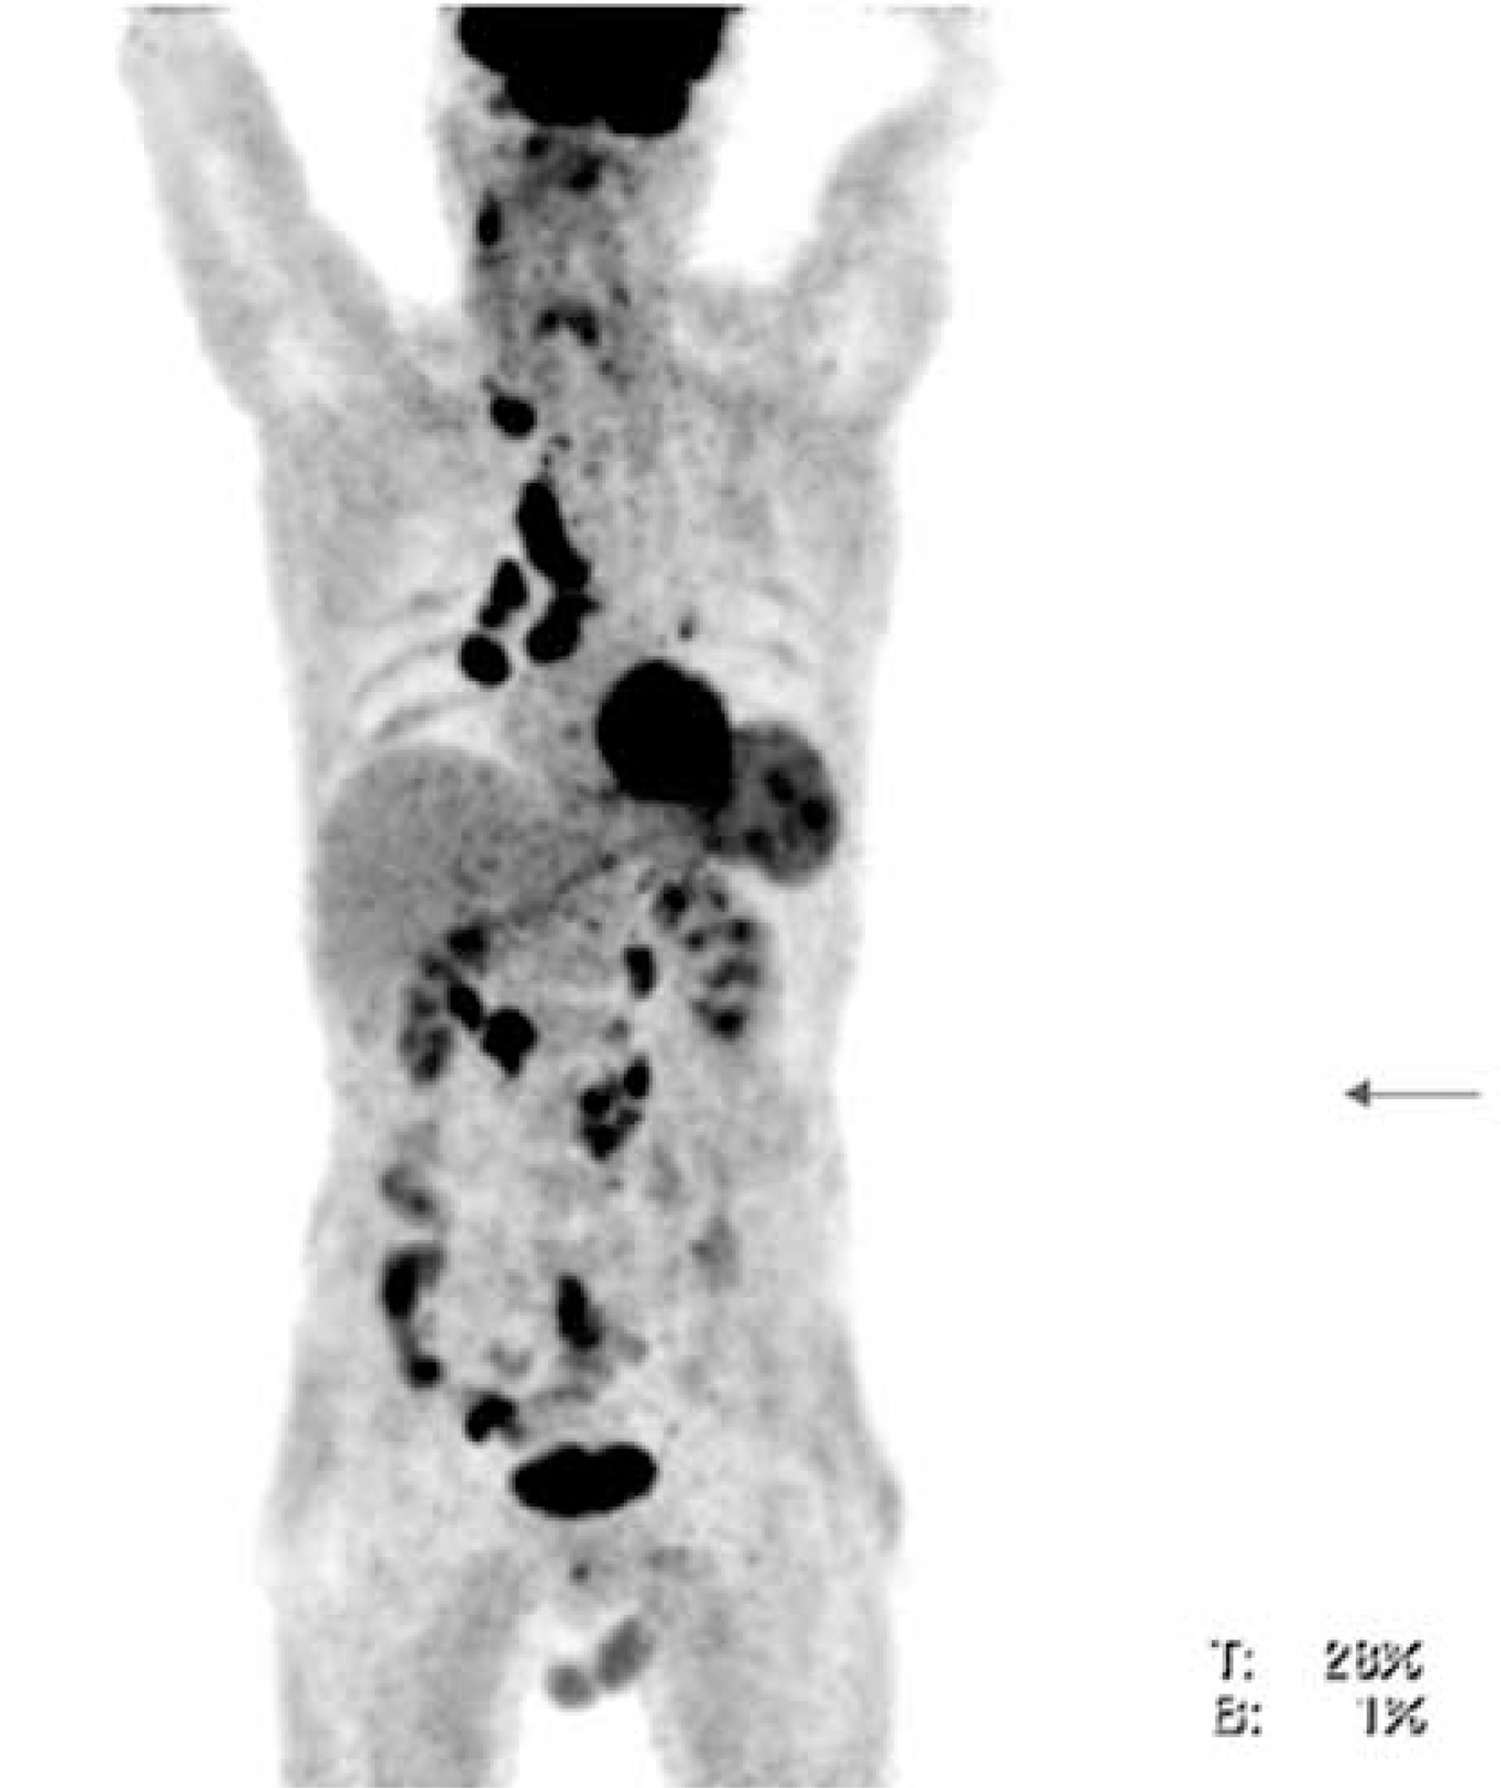
Figure 2
18F-FDG PET/CT maximal intensity projection (MIP) in the anterior view from the base of the skull to the mid thighs of the same patient with thyroid medullary carcinoma. Increased metabolism can be seen in neck, mediastinal, hilar and retroperitoneal lymph nodes, left lobe of the thyroid, spleen and colon
In 34 patients (37.7%), findings of 18F-FDG PET/CT differed from TCT, 24 positive 18F-FDG PET/CT findings were negative on TCT and 10 negative 18F-FDG PET/CT findings were positive on TCT.
Correlation between tumor grade and Ki67 with 99mTc-Tektrotyd scintigraphy and 18F-FDG PET/CT findings
A significant correlation was found between Ki67 and SUVmax in 18F-FDG PET/CT positive findings (Spearman’s rank correlation coefficient rho = 0.417; p = 0.004), and values of SUVmax increased with the percentage of Ki67. On the other hand, a correlation between Ki67 and Krenning score was not found (rho = 0.169, p = 0.318). Tumor grade did not have significant correlation with SUVmax or Krenning score (p = 0.012, p = 0.339). A significant correlation was not found between 18F-FDG PET/CT findings and Krenning score (p = 0.31).
Progression-free survival and predictive value of 99mTc-Tektrotyd scintigraphy and 18F-FDG PET/CT
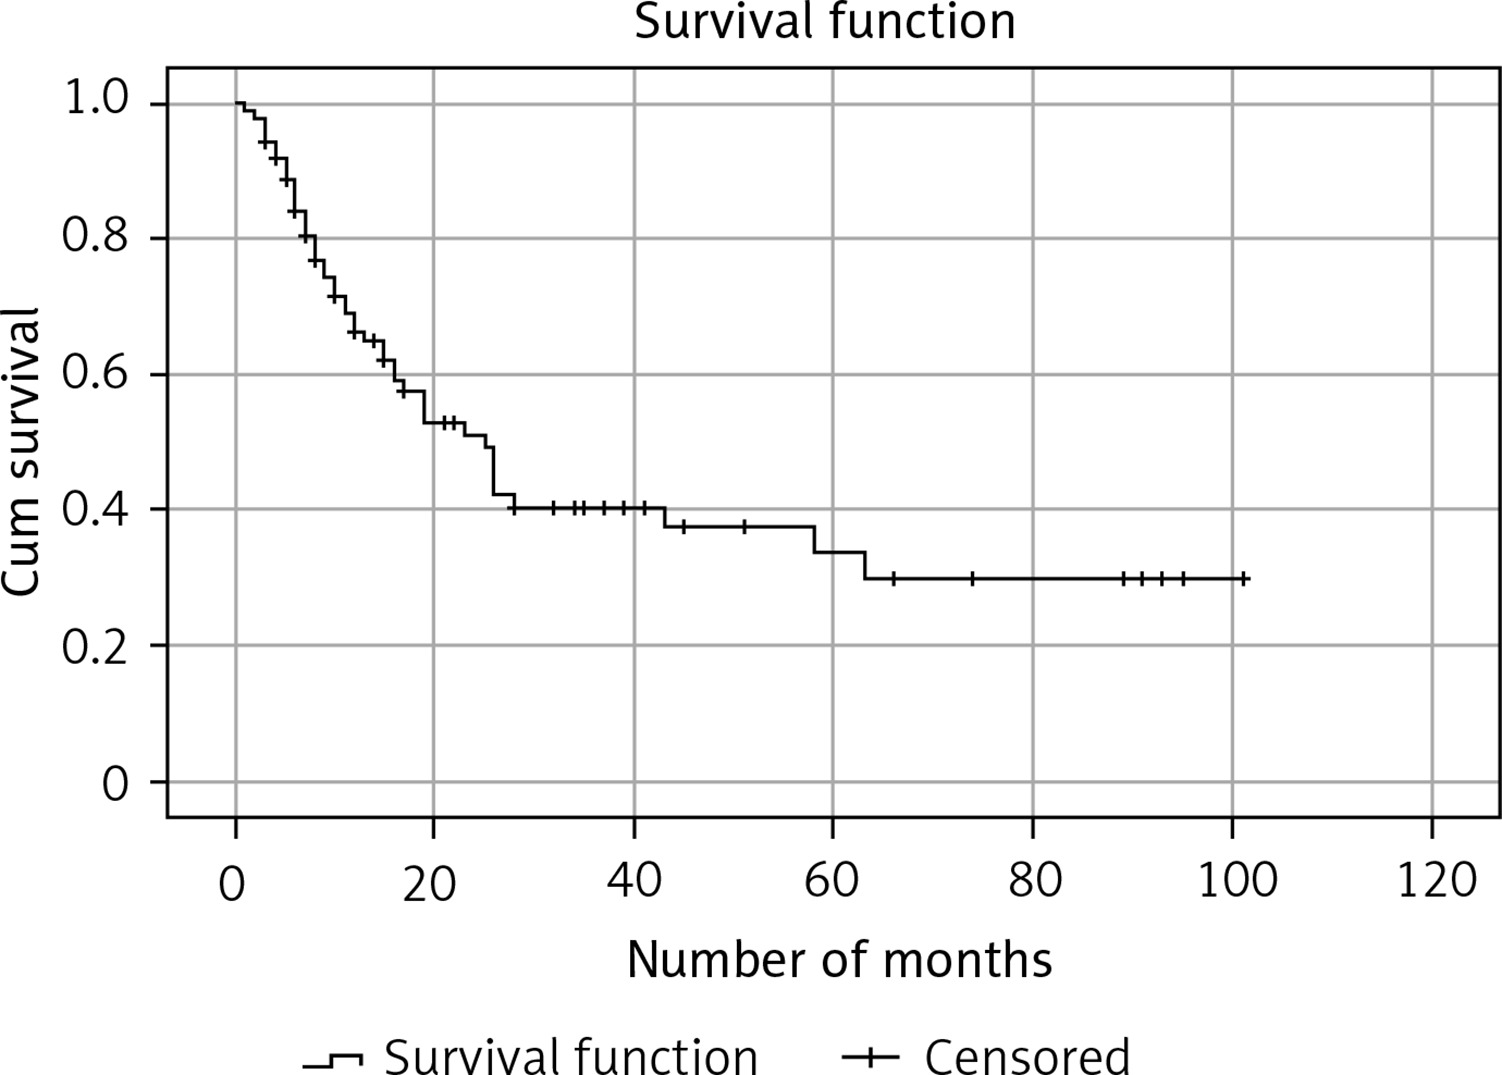
Kaplan-Meier survival analysis showed that median survival time to progression for the entire group was 25 months (with the 95% confidence interval 18.2–31.8) (Figure 3). A statistically significant difference was not found between PFS of 18F-FDG PET/CT positive and 18F-FDG PET/CT negative patients (23 months vs. 26 months (95% CI: 16.3–29.7), p = 0.279). Cox univariant regression analyses showed a positive correlation between progression of the disease and SUVmax, as well as Krenning score. The progression-free survival was significantly lower in patients with a higher Krenning score (b = 0.419; p < 0.001) and higher SUVmax values (b = 0.082, p < 0.001). During follow-up progression was found in 43 cases, local recurrence in 15 and distant metastases in 28.
Discussion
Our study demonstrates very good diagnostic utility of TCT and 18F-FDG PET/CT in detection of NETs. Moreover, the higher Krenning score on TCT and positive 18F-FDG PET/CT findings with higher SUVmax are predictors of progression of the disease.
The sensitivity of TCT in our study was 83.6% with 11 false negative findings that were positive on 18F-FDG PET/CT (mostly lung lesions). The detection rate can be increased by using SPECT/CT, which would result in fewer false negative findings, especially when lung lesions are too small to be seen on a low-resolution gamma camera, as was the case in our study [19].
Four false positive uptakes were seen in the region of biopsy, in the thyroid and in the left ureter. A possible reason for false positive findings could be inflammation and the slow excretion of the radiopharmaceutical [20, 21]. In our study, 18F-FDG PET/CT had a higher sensitivity than TCT, probably due to the larger group of patients with G2/G3, and poorly differentiated NETs included in the cohort, which correlates with the results in other studies [22–25].
Poorly differentiated neuroendocrine tumors present with increased 18F-FDG accumulation, and uptake degree was proved to correlate with the marker of proliferation Ki67 [14, 26]. Increased 18F-FDG accumulation was observed in our group of patients with average Ki67 of 19.8% with a significant correlation between SUVmax and Ki67 in 18F-FDG PET/CT positive findings, as reported in previous studies [19, 24, 27, 28]. However, a significant correlation was not found between SUVmax and tumor grade, similar to the findings of a recent study [27]. European Neuroendocrine Tumor Society guidelines recommend 18F-FDG PET/CT in patients with NET of G3 grading [29]. We did not find a significant correlation between Krenning score on TCT and Ki67 and tumor histological grade. This could be due to intra-tumor heterogeneity of NETs in our cohort.
Positive 18F-FDG PET/CT has a strong prognostic value for NET, which even overcomes the prognostic value of standard parameters such as Ki67 and chromogranin A [16, 30]. On the other hand, negative SRS is a good predictor for early progression of the disease [31]. In our study, Kaplan-Meier survival analysis for the entire group showed that median survival time to progression was 25 months, and in 18F-FDG PET/CT positive findings 23 months. Progression-free survival in 18F-FDG PET/CT positive findings in other studies range from 15.0 to 30.8 months [30, 32–34]. A significant difference between patients with 18F-FDG PET/CT positive and negative findings was not found, although the progression-free survival was shorter in patients with a positive finding. In our study, progression-related predictors were SUVmax values and Krenning score, similar to the other findings [16, 30, 35].
One of the purposes of dual tracer examinations is to help the clinicians in treatment planning. 99mTc-Tektrotyd scintigraphy is an appropriate method for selecting patients for peptide receptor radionuclide therapy, somatostatin analogue and radioguided surgery, as well as in monitoring its efficiency [36, 37]. On the other hand, chemotherapy and targeted drug therapy are reserved for FDG avid NETs [35].
This retrospective study has some limitations. All of the 90 patients had both imaging techniques done, but not on the same day, which could interfere with the comparison of the scans due to tumor proliferation during that period of time, as well as in other studies [38]. Also, distribution through different grades of NET is not even through the groups; grade 1 had only 10 patients. Inability to detect small lung lesions on TCT could be avoided by using SPECT/CT, which would result in fewer false negative findings [21].
In conclusion, our results show very good diagnostic accuracy of TCT and 18F-FDG PET/CT in detection of NETs. Higher Krenning score on TCT and positive 18F-FDG PET/CT findings with higher SUVmax are predictors of progression of the disease in patients with metastatic NETs. Therefore, TCT and 18F-FDG PET/CT can be useful complementary tools in management of patients with NETs and in predicting patients’ outcome. Further larger prospective investigations of the utility of dual tracer imaging are needed for more accurate assessment of metastatic neuroendocrine tumors.