Colorectal cancer (CRC) is the third most common malignant tumor and the second deadliest cancer worldwide [1]. Current research and practice have demonstrated that the progression of CRC precancerous lesions to cancer generally takes 5–7 years, which provides an opportunity where dysplastic lesions can be detected and excised at the precancerous phase, or at an early, localized cancerous stage, that is highly treatable. The discovery of biological markers specific to precancerous colorectal adenomas and early, localized CRC would aid their early detection [2]. Therefore, it is crucial to identify detection methods that are highly specific, easily tolerated, and more compliant to achieve early diagnosis of CRC. The gut microbiota has been shown to promote the occurrence and development of CRC, and screening of gut microbiota for CRC has the potential to be a simple, convenient, non-invasive, highly sensitive, and well-tolerated method for detecting early signs of CRC. Fusobacterium nucleatum (Fn) is a Gram-negative, specialized anaerobic bacterium that mainly colonizes the intestines and oral cavity [3]. Studies have increasingly demonstrated that fecal Fusobacterium nucleatum is an emerging biomarker with promising potential for the diagnosis of CRC. However, the accuracy of this biomarker in diagnosing CRC remains to be determined due to biases of individual research. This study aims to evaluate the diagnostic performance of fecal Fusobacterium nucleatum in CRC.
We retrieved systematic reviews in PubMed, Embase, Cochrane Library and CNKI up to and including July 1, 2022, by Boolean operator: (“Fusobacterium nucleatum” OR “Fusobacterium spp” OR “F. nucleatum” OR “Fn”) AND (“Colorectal Neoplasms” OR “colorectal cancer” OR “colorectal carcinoma” OR “colorectal neoplasm” OR “colorectal tumor”). Inclusion criteria: 1) The study design is clearly divided into two groups: a case group and a control group; 2) Sensitivity and specificity values of Fn for detecting CRC can be obtained from relevant literature and used to construct a 2 × 2 diagnostic grid table; 3) The diagnosis of CRC must rely on histological examination, which is the microscopic examination of tissue specimens; 4) Fn detection should be based on quantitative polymerase chain reaction analysis, fluorescence in situ hybridization or 16SrRNA sequencing; 5) Samples (feces or tissues) should be stored at –20°C to –80°C after collection. Exclusion criteria: 1) Incomplete data prevent the creation of a 2 × 2 Diagnostic table; 2) The control group specimens were taken from adjacent non-tumor tissues of CRC patients rather than the healthy control group; 3) No pathology as the diagnostic basis for CRC; 4) Conference paper abstracts, reviews, lectures, case reports, expert opinions and comments, etc.
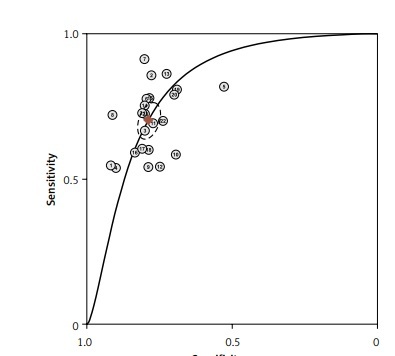
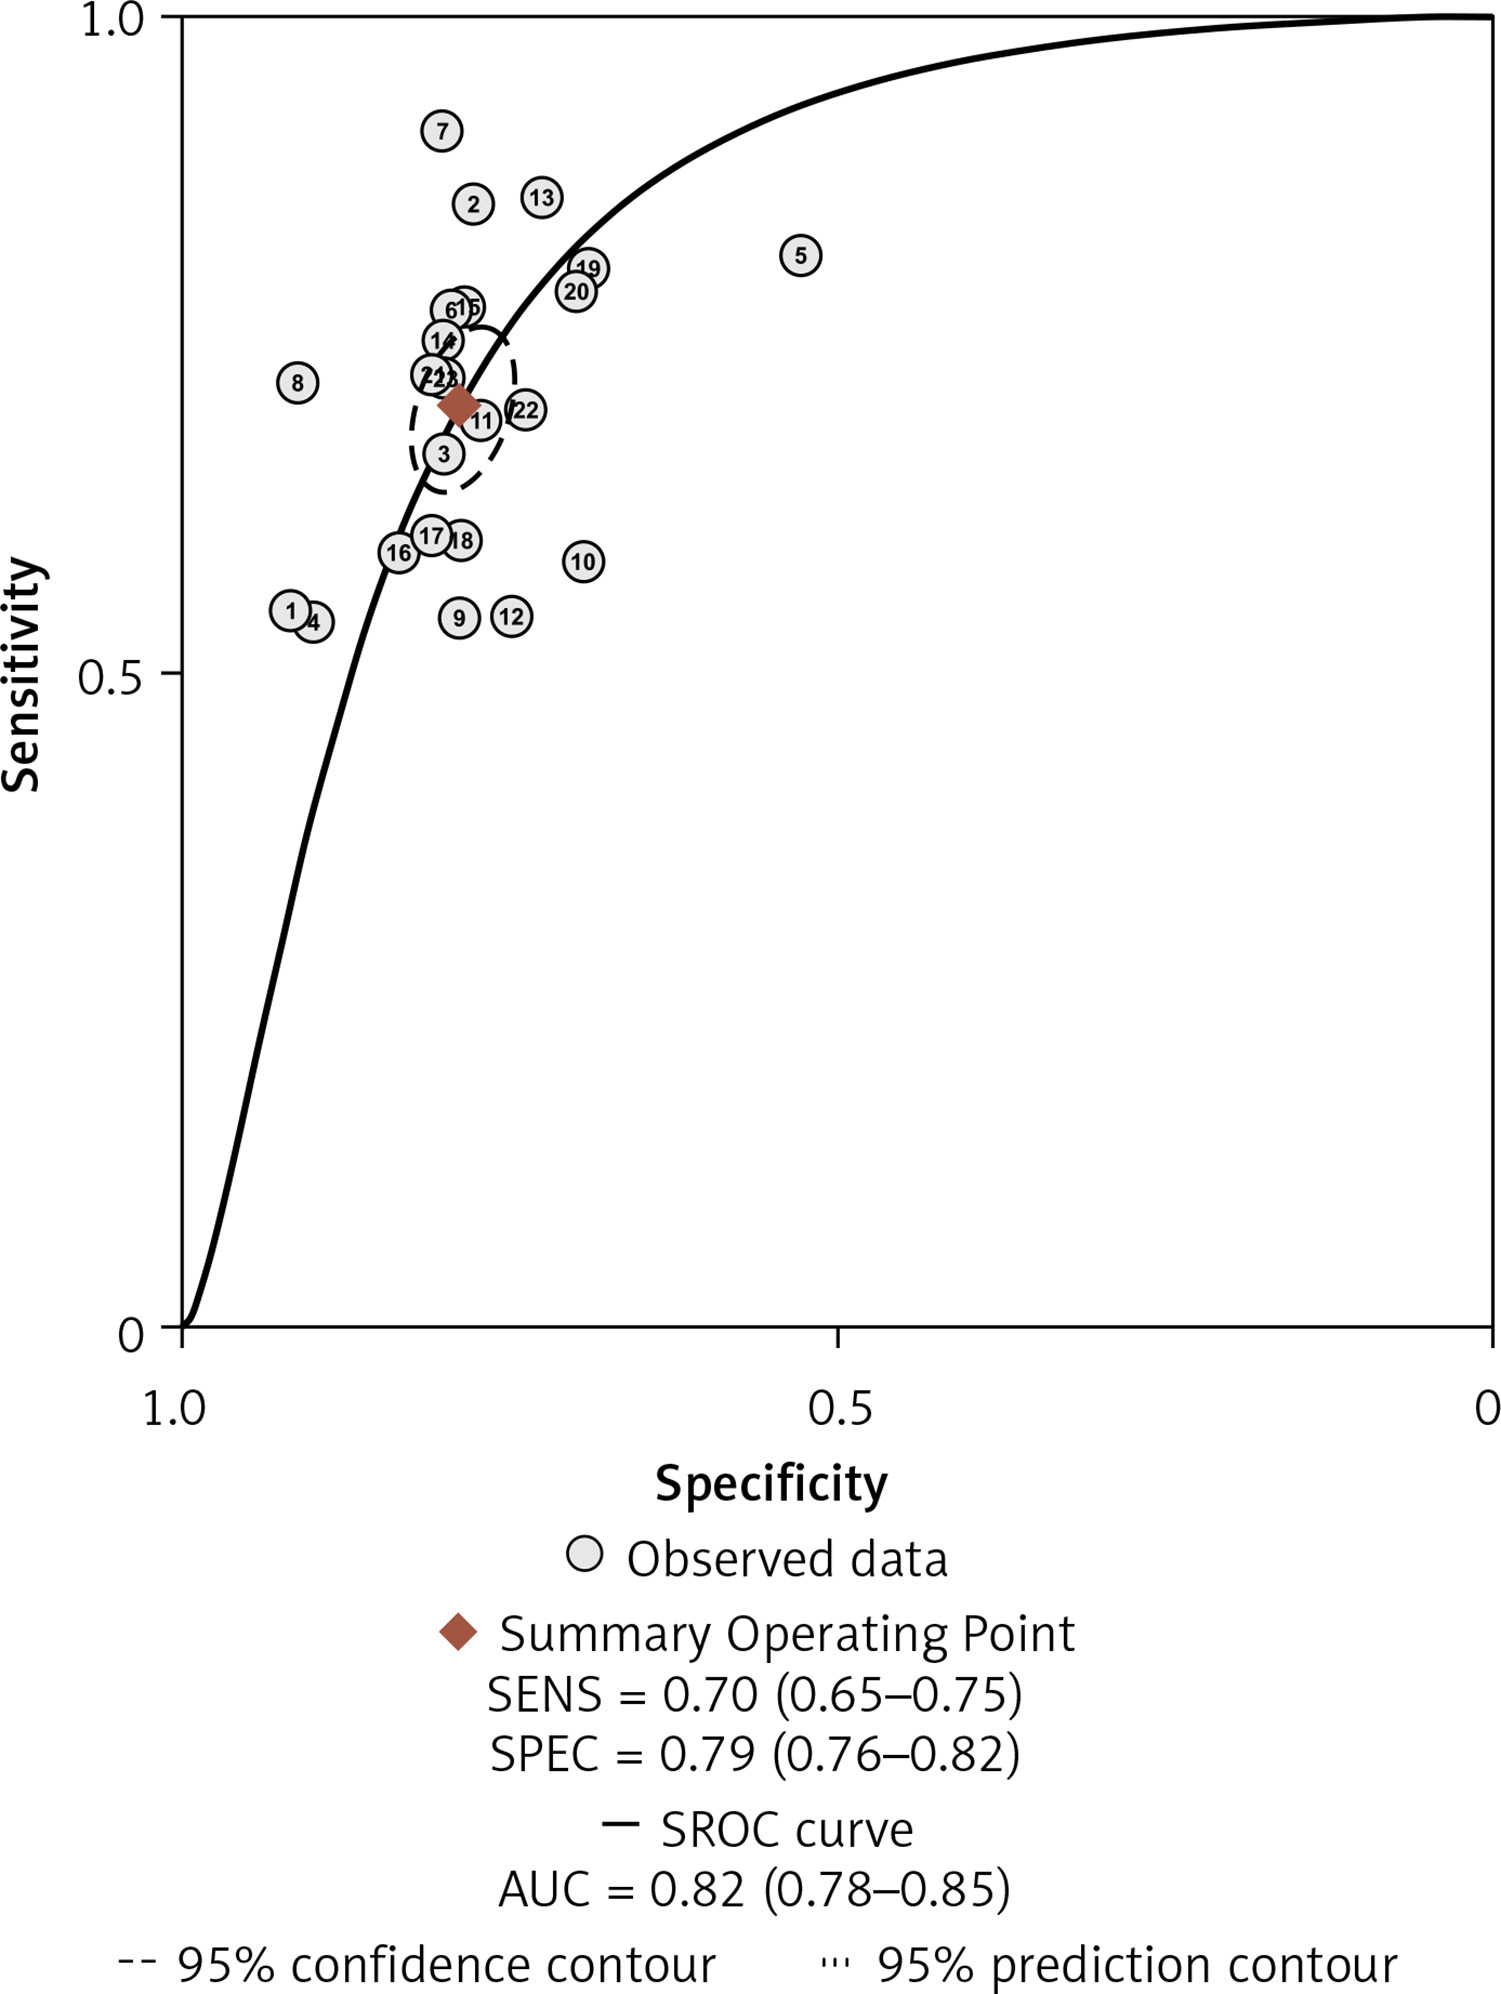
After screening the titles, abstracts and body of the retrieved papers, 16 articles were finally included in this study. Table I shows the General clinical characteristics of the articles [4–19]. A bivariate meta-analysis model was employed to merge sensitivity, specificity, diagnostic odds ratio (DOR), positive likelihood ratio (LR+), and negative likelihood ratio (LR-) to establish the diagnostic accuracy of Fn in identifying CRC and draw a summary receiver operating characteristic (SROC) curve. The forest plot (Figure 1) displays the performance of Fn in detecting CRC with a pooled sensitivity of 0.70 (95% CI: 0.65-0.75), specificity of 0.79 (95% CI: 0.76–0.82), LR+ of 3.3 (95% CI: 2.9–3.8), LR- of 0.38 (95% CI: 0.32–0.44), and DOR of 9 (95% CI: 7–11). The sensitivity heterogeneity (I2 = 84.9%, 95% CI: 79.52–90.20, p < 0.00) and specificity heterogeneity (I2 = 57.5%, 95% CI: 37.7–77.2, p < 0.00) indicated significant heterogeneity between studies. After conducting a meta-regression analysis (Table II), we found that the heterogeneity of specificity in the participants was influenced by their race. Additionally, we observed that both the heterogeneity of specificity and sensitivity were impacted by the sample size and the QUADAS score. The SROC showed an advisable distribution with an area under the curve (AUC) of 0.82 (95% CI: 0.78–0.85) (Figure 2).
Table I
Basic characteristics and diagnostic performance of F. nucleatum in CRC
| Authors | Year | Country | Sample types | Detection methods | QUADAS scores | Sample collection | Sample size, n | TP, n | FN, n | FP, n | TN, n | Sen (%) | Spe (%) | PPV (%) | NPV (%) |
|---|---|---|---|---|---|---|---|---|---|---|---|---|---|---|---|
| Zeller et al. [4] | 2014 | France | Feces | 16SrRNA sequencing | 10 | Colonoscopy | 114 | 29 | 24 | 5 | 56 | 55 | 92 | 85.3 | 68.3 |
| Mira-Pascual et al. [5] | 2015 | Spain | Feces | Real-time qPCR | 10 | Colonoscopy | 16 | 6 | 1 | 2 | 7 | 85.7 | 77.8 | 75 | 87.5 |
| Yu et al. [6] | 2016 | China | Tissues | FISH | 10 | Colonoscopy or surgical operation | 113 | 62 | 31 | 4 | 16 | 66.7 | 80 | 93.9 | 34 |
| Suehiro et al. [7] | 2017 | Japan | Feces | Droplet digital PCR | 9 | Colonoscopy or surgical operation | 218 | 85 | 73 | 6 | 54 | 53.8 | 90 | 93.4 | 42.5 |
| Liang et al. [8] | 2017 | China | Feces | Probe-based duplex qPCR | 11 | Colonoscopy | 69 | 27 | 6 | 17 | 19 | 81.8 | 52.8 | 61.4 | 76 |
| Liang et al. [8] | 2017 | China | Feces | Probe-based duplex qPCR | 11 | Colonoscopy | 370 | 132 | 38 | 41 | 159 | 77.7 | 79.5 | 76.3 | 80.7 |
| Wong et al. [9] | 2017 | China | Feces | Real-time qPCR | 11 | Colonoscopy | 119 | 21 | 2 | 19 | 77 | 91.3 | 80.2 | 52.5 | 97.5 |
| Wong et al. [9] | 2017 | China | Feces | Real-time qPCR | 11 | Colonoscopy | 206 | 75 | 29 | 9 | 93 | 72.1 | 91.2 | 89.3 | 76.2 |
| Xie et al. [10] | 2017 | China | Feces | Real-time qPCR | 10 | Colonoscopy | 569 | 177 | 150 | 51 | 191 | 54.1 | 79 | 77.6 | 55.8 |
| Xie et al. [10] | 2017 | China | Feces | Real-time qPCR | 10 | Colonoscopy | 180 | 69 | 49 | 19 | 43 | 58 | 69.3 | 78.4 | 46.7 |
| Eklöf et al. [11] | 2017 | Sweden | Feces | qPCR | 10 | Colonoscopy | 105 | 27 | 12 | 15 | 51 | 69.2 | 76.9 | 64.2 | 80.9 |
| Amitay et al. [12] | 2017 | Germany | Feces | Multiplex PCR | 10 | Colonoscopy | 277 | 25 | 21 | 58 | 173 | 54.3 | 74.8 | 30 | 89.1 |
| Guo et al. [13] | 2018 | China | Feces | Real-time qPCR | 10 | Colonoscopy | 254 | 131 | 21 | 28 | 74 | 85.9 | 72.6 | 82.7 | 77.1 |
| Guo et al. [13] | 2018 | China | Feces | Real-time qPCR | 10 | Colonoscopy | 371 | 162 | 53 | 31 | 125 | 75.3 | 80 | 83.9 | 70.2 |
| Liang et al. [14] | 2019 | China | Feces | qPCR | 9 | Colonoscopy | 491 | 158 | 45 | 62 | 226 | 77.8 | 78.5 | 71.8 | 83.3 |
| Liang et al. [14] | 2019 | China | Feces | qPCR | 9 | Colonoscopy | 168 | 42 | 29 | 16 | 81 | 59.2 | 83.5 | 72.4 | 73.6 |
| Löwenmark et al. [15] | 2020 | Sweden | Feces | qPCR | 11 | Colonoscopy | 101 | 23 | 15 | 12 | 51 | 61.1 | 81.4 | 65.7 | 77.2 |
| Löwenmark et al. [15] | 2020 | Sweden | Feces | qPCR | 11 | Colonoscopy | 332 | 143 | 95 | 20 | 74 | 60.0 | 79.1 | 87.7 | 43.7 |
| Liu et al. [16] | 2020 | China | Feces | qPCR | 6 | Colonoscopy | 173 | 93 | 22 | 18 | 40 | 80.8 | 68.9 | 83.7 | 64.5 |
| Liang et al. [17] | 2021 | China | Feces | qPCR | 12 | Colonoscopy | 227 | 140 | 37 | 15 | 35 | 79.1 | 70 | 92 | 48.6 |
| Liang et al. [17] | 2021 | China | Feces | qPCR | 12 | Colonoscopy | 248 | 24 | 9 | 41 | 174 | 72.7 | 80.9 | 37 | 95 |
| Liu et al. [18] | 2021 | China | Feces | qPCR | 10 | Colonoscopy | 102 | 42 | 18 | 11 | 31 | 69.2 | 73.9 | 79.2 | 63.2 |
| Osman et al. [19] | 2021 | Malaysia | Tissues | qPCR | 9 | Colonoscopy or surgical operation | 60 | 29 | 11 | 4 | 16 | 72.5 | 80 | 87.9 | 59.3 |
[i] TP – true positive, FN – false negative, FP – false positive, TN – true negative, PPV – positive predictive value, NPV – negative predictive value, CRC – colorectal cancer, F. nucleatum – Fusobacterium nucleatum, qPCR – quantitative polymerase chain reaction, FISH – fluorescence in situ hybridization, QUADAS – Quality Assessment of Diagnostic Accuracy Study.
Table II
Results of meta-regression for CRC
| Parameter | Category | Cohorts, n | Sensitivity | P1 | Specificity | P2 | P-value |
|---|---|---|---|---|---|---|---|
| Racea | Yes | 16 | 0.73 (0.68–0.77) | 0.21 | 0.78 (0.75–0.82) | 0.00 | 0.22 |
| No | 7 | 0.63 (0.54–0.73) | 0.80 (0.74–0.85) | ||||
| Sample typesb | Yes | 21 | 0.70 (0.66–0.75) | 0.25 | 0.79 (0.76–0.82) | 0.09 | 0.98 |
| No | 2 | 0.70 (0.53–0.86) | 0.80 (0.66–0.95) | ||||
| Sample sizec | Yes | 11 | 0.71 (0.64–0.77) | 0.00 | 0.80 (0.76–0.83) | 0.00 | 0.64 |
| No | 12 | 0.70 (0.63–0.77) | 0.77 (0.73–0.82) | ||||
| QUADAS scoresd | Yes | 18 | 0.70 (0.65–0.76) | 0.02 | 0.78 (0.75–0.82) | 0.00 | 0.77 |
| No | 5 | 0.70 (0.60–0.80) | 0.81 (0.75–0.87) |
Figure 1
Forest plot of the pooled diagnostic accuracy of Fusobacterium nucleatum for colorectal cancer detection
CI – confidence interval.
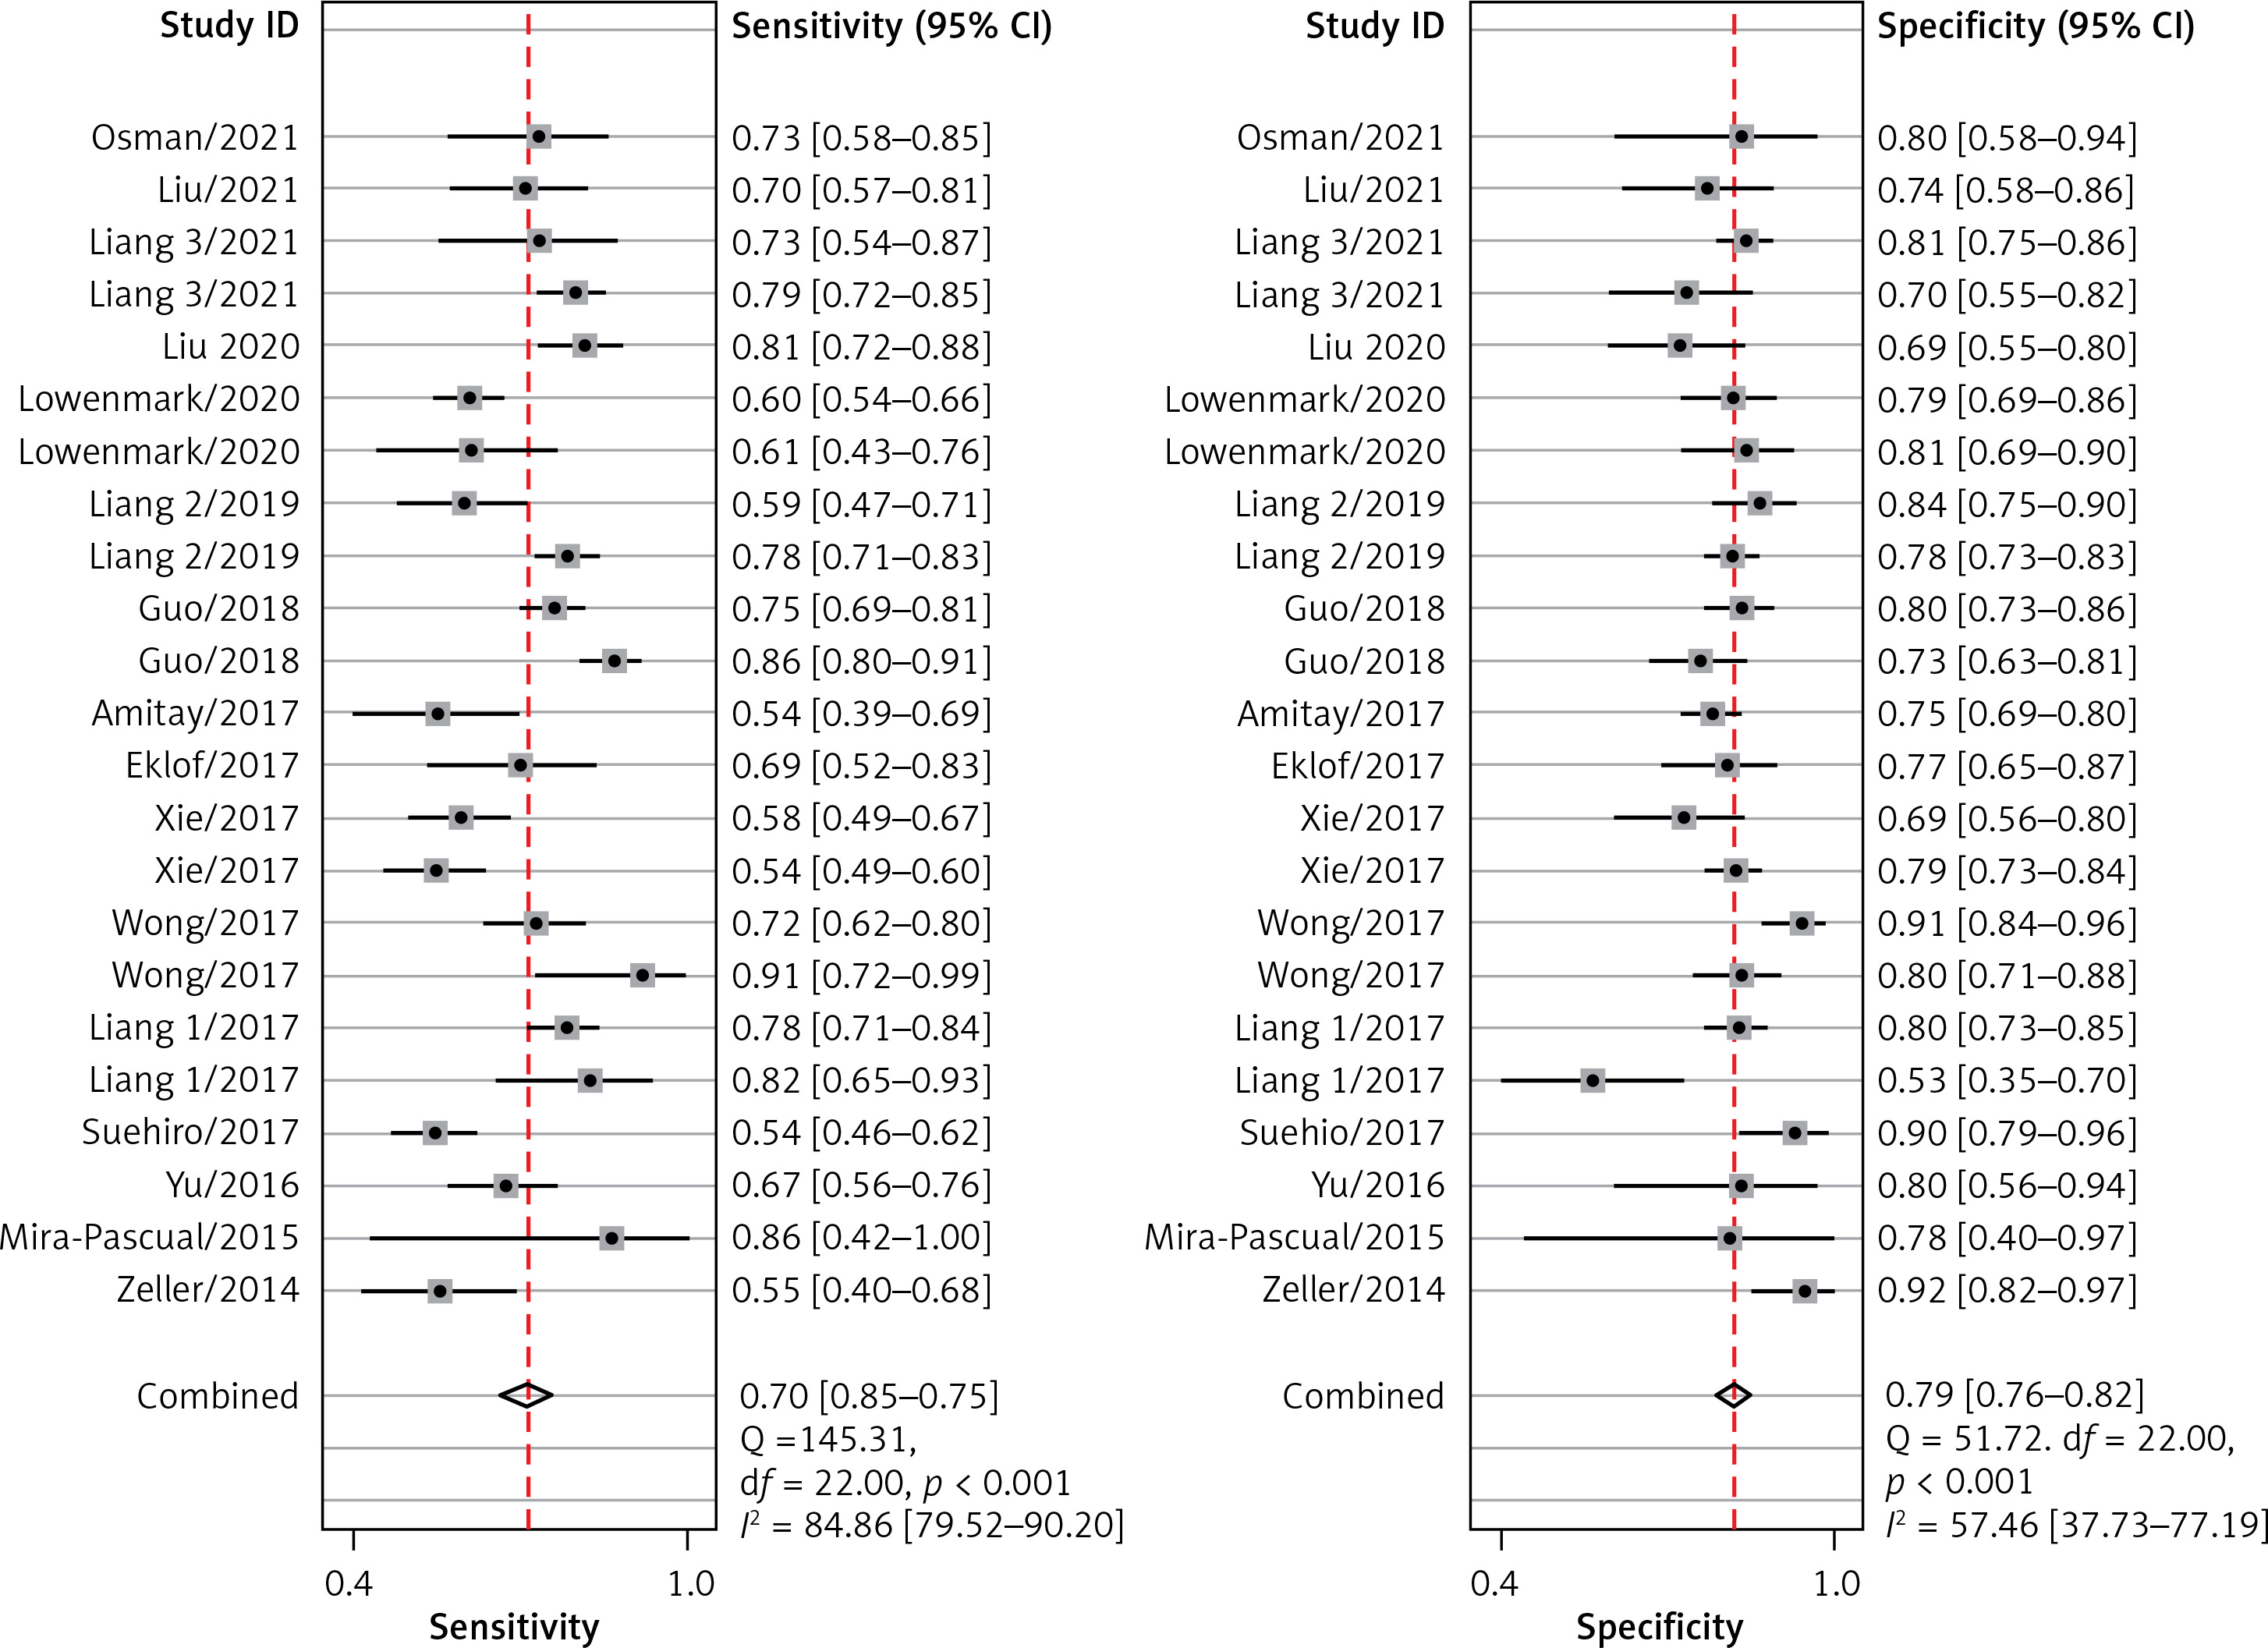
Figure 2
SROC assessment of diagnostic performance of Fusobacterium nucleatum for colorectal cancer
SROC – summary receiver operator characteristic curve
Our analysis included a total of 15 English and 1 Chinese studies, examining 2513 CRC patients and 2370 healthy controls. The forest map shows that the missed diagnosis rate and misdiagnosis rate of Fn in diagnosing CRC are 30% and 21%, respectively. The AUC of SROC was 0.82, supporting the notion that Fn can be a reliable screening indicator for CRC with low missed and misdiagnosis rates. Fn testing has shown excellent performance among all current non-invasive screening methods. A different study [9] has demonstrated that combining Fn biomarkers with FIT significantly improves sensitivity in detecting CRC (92.3% vs. 73.1%, p < 0.001) compared to using FIT alone. Therefore, Fn has potential as a biomarker for non-invasive screening of CRC.
The analysis of this study demonstrates that detection of fecal Fn has high utility in diagnosing CRC. This method shows promise in moving toward a non-invasive and cost-effective detection method for CRC. However, this analysis has certain limitations: 1) Due to the lack of unified detection methods and thresholds for evaluating fecal microbiota, most of the included studies defined thresholds specific to their study through ROC curves and obtained different cutoff values. Further research is required through controlled clinical trials with robust designs to determine an optimal threshold for diagnosing fecal microbiota CRC and evaluate its performance. Therefore, we cannot rule out that different cutoff values can significantly affect the diagnostic value. 2) The study’s sample size is relatively small. It is essential to increase the sample size to enhance the accuracy of the consolidation effect.
At present, a large number of studies have confirmed the mechanism by which Fn promotes the occurrence of CRC. However, the relationship between Fn and CRC still lacks evidence-based basis. We have demonstrated a positive correlation between Fn and CRC through meta-analysis. Therefore, this study provides valuable guidance for the early diagnosis of CRC in clinical practice.