

Introduction
Breast cancer (BC) is the most common malignancy among women worldwide [1]. In 2022, the number of new BC cases globally approached 2.3 million and is projected to rise to approximately 3 million by 2050 [2, 3]. Advanced BC can lead to multi-organ dysfunction due to distant metastasis, directly threatening life [4, 5]. Age, genetics, environment, and lifestyle factors are significant risk factors for BC [6]. From a pathological perspective, BC is primarily classified into non-invasive and invasive types. Rare subtypes such as mucinous carcinoma typically have a lower histological grade and higher hormone receptor expression, resulting in a relatively favorable prognosis [7]. Molecular subtyping further categorizes BC into intrinsic subtypes with distinct biological behaviors and therapeutic targets, such as luminal A, luminal B, HER2-positive, and triple-negative BC, based on the expression of key biomarkers (ER, PR, HER2, and Ki-67) [8]. In terms of treatment, the development of novel drugs and the application of comprehensive approaches including surgery, radiotherapy, chemotherapy, endocrine therapy, and targeted therapy have increased the 5-year survival rate for early-stage patients to nearly 90% [9]. However, significant challenges persist, including the heterogeneity of triple-negative BC (TNBC) and the development of treatment resistance across subtypes [10, 11]. Therefore, enhancing early detection and targeted anticancer therapy for BC is crucial for further improving patient survival rates.
Metabolic reprogramming, established as one of the core hallmarks of cancer, functions as a pivotal mechanism driving tumorigenesis and progression [12]. Its intricate crosstalk with epigenetic regulation is postulated to cooperatively facilitate the progression of BC [13, 14]. This reprogramming is primarily characterized by enhanced glucose metabolism, increased fatty acid synthesis, and an elevated rate of glutamine metabolism [15], which collectively enable cancer cells to flexibly adjust their energy metabolism and biosynthetic pathways. These adaptations provide indispensable support for rapid proliferation, invasion, metastasis, and adaptation to the complex tumor microenvironment (TME) [16]. Among these alterations, dysregulated lipid metabolism stands out as one of the most prominent metabolic disturbances in cancer, significantly influencing cell membrane architecture, diverse energy processes, and intercellular communication [17]. Specifically, the catabolism of fatty acids serves as a crucial energy source for ATP generation within cancer cells [18]. Growing evidence indicates that increased fatty acid synthesis and catabolism synergistically support the migratory capacity of metastatic BC cells [19]. Carnitine, specifically acylcarnitines, transports fatty acids into mitochondria for β-oxidation [20]. Consequently, the levels and functional status of carnitine-related metabolites (CRMs) directly govern the flux of fatty acid oxidation, thereby positioning CRMs as a critical nexus linking lipid metabolic reprogramming to cellular energy supply and the malignant phenotype in BC. While epidemiological studies have identified associations between circulating carnitine levels and BC risk [21], inherent limitations in study design and methodology have precluded deeper exploration of causality and underlying mechanisms.
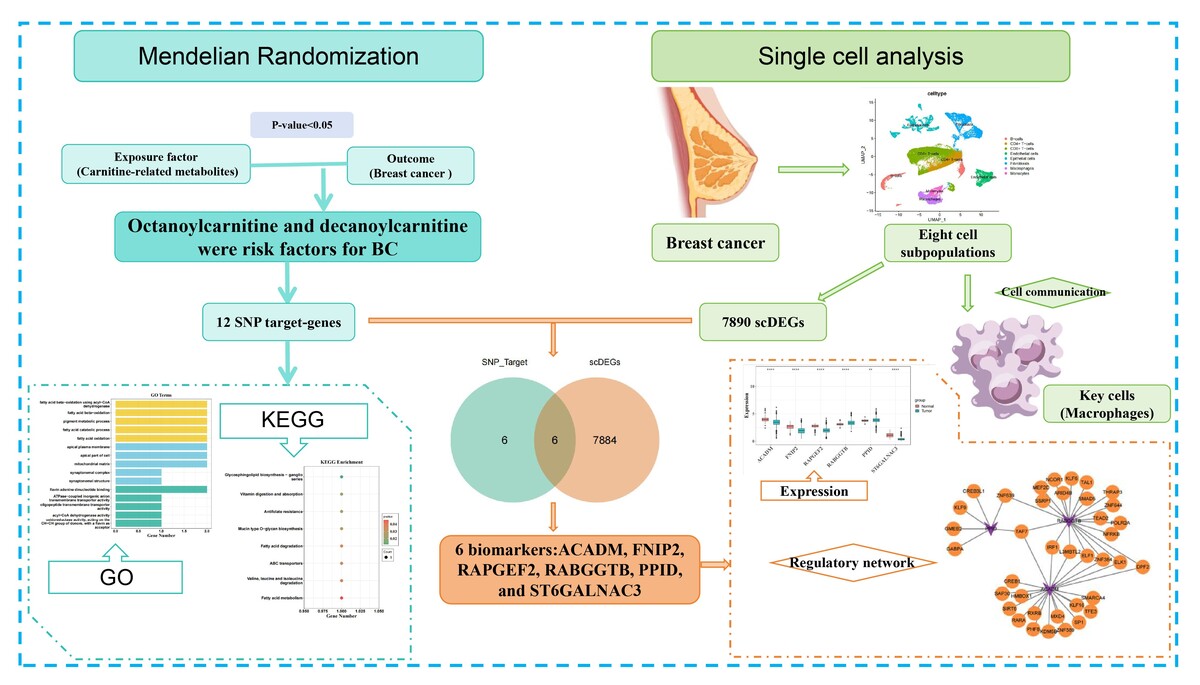
Therefore, this study is the first to systematically integrate MR with multi-omics analysis, aiming to overcome the limitations of previous correlational research, clarify the potential causal relationship between CRMs and BC, and characterize associated molecular pathways and cellular expression patterns. MR, which uses genetic variants as instrumental variables (IV), can reduce susceptibility to confounding and reverse causation, providing a useful approach for assessing potential causal relationships between exposures and outcomes [22, 23]. Based on this, we utilized large-scale genomic and transcriptomic data to investigate potential causal associations between CRMs and BC risk. Furthermore, by integrating single-cell RNA sequencing (scRNA-seq), cell communication analysis, and regulatory network construction, we characterized the cellular expression patterns and molecular features of CRM-associated genes within the TME and identified candidate genes for further investigation. This work provides genetic and transcriptomic evidence supporting the involvement of carnitine-related metabolic pathways in BC and highlights candidate genes for further mechanistic and translational investigation.
Material and methods
Data sources
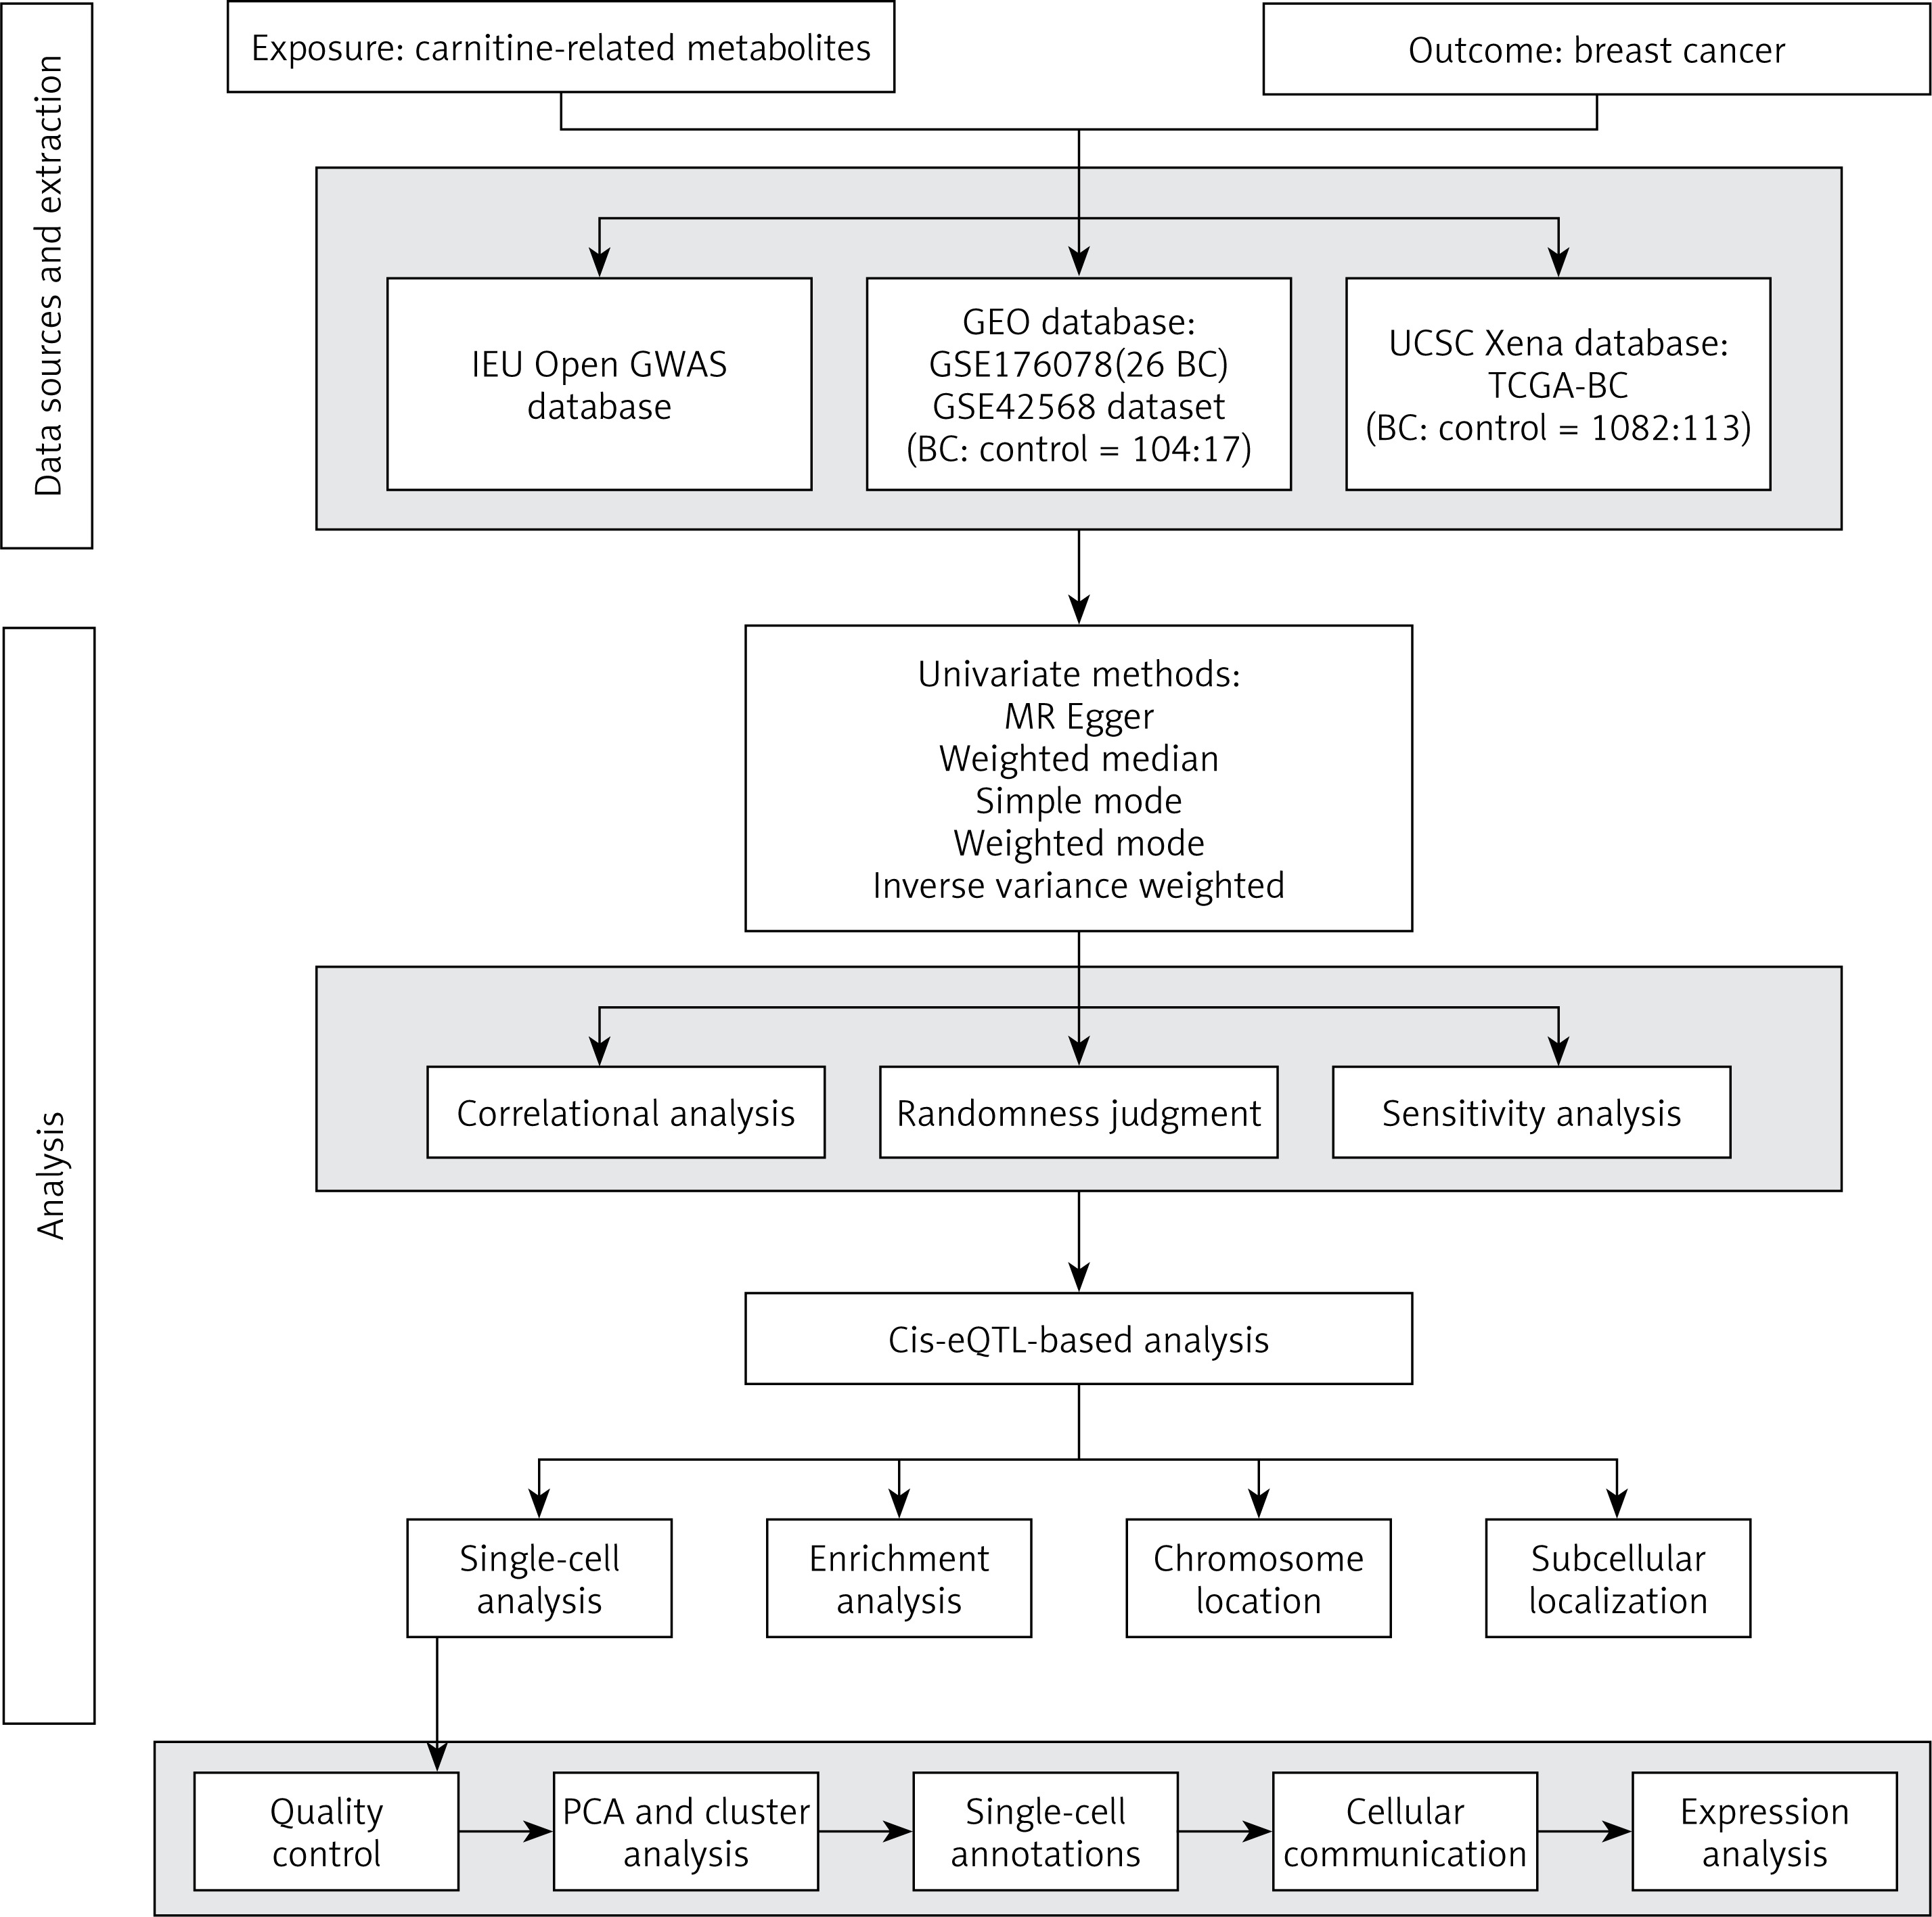
Figure 1 presents the comprehensive study framework. The primary data for MR analysis were obtained from the Integrative Epidemiology Unit (IEU) Open GWAS database (https://gwas.mrcieu.ac.uk/), including the BC dataset (ukb-b-12227) and CRM datasets (met-a-742, met-a-618, met-a-615, met-a-463, met-a-479, met-a-699, met-a-467, met-a-573, met-a-476, and met-a-652). Single-cell datasets GSE176078 (26 BC) [24] and GSE42568 (BC: control = 104:17) [25] were retrieved from the Gene Expression Omnibus (GEO) database (https://www.ncbi.nlm.nih.gov/gds). The Cancer Genome Atlas (TCGA)-BC (BC: control = 1,082:113) dataset was sourced from the University of California Santa Cruz (UCSC) Xena database (https://xenabrowser.net/datapages/) [26]. The data were accessed on September 1st, 2023. The representative histopathological slide images of breast cancer from the TCGA are provided in Supplementary Figure S1.
Figure 1
Flowchart of the study design
IEU Open GWAS – Integrative Epidemiology Unit Open genome-wide association study, BC – breast cancer, GEO – Gene Expression Omnibus, UCSC – University of California Santa Cruz, TCGA – The Cancer Genome Atlas, MR – Mendelian randomization, PCA – principal component analysis.
MR analysis
To investigate the potential causal relationship between carnitine metabolites and BC risk, this study employed MR for analysis. The MR analysis was based on three core assumptions: (1) the IVs should be significantly correlated with CRM; (2) the IVs must not be influenced by any other confounding factors; and (3) BC must be affected by CRM solely through the IVs [22]. The extract_instruments function was used to assess exposure factors and screen IVs (p < 5 × 10⁻⁸) [27]. IVs significantly correlated with the exposure factors were identified. The “clump” variable was employed to detect closely related IVs, which were then assessed for linkage disequilibrium (LD) with criteria of r2 = 0.001 and kb = 10,000. IVs for exposure factors and outcomes were harmonized, excluding SNPs with F-statistics < 10 (F = (samplesize.exposure-2) × ((R2)/(1 – R2))). The extract_outcome_data function was used to filter SNPs not associated with BC. MR analysis was performed using MR Egger regression [28], weighted median [29], inverse variance weighted (IVW) [30], and simple mode and weighted mode methods [31]. P-values and odds ratios (OR) for the IVW method were used, with the IVW approach treating the reciprocal of outcome variance (the square of SE) as the weight (R2 = (β2)/(β2 + SE2 × N )). The following thresholds were used: p < 0.05 indicated a significant causal relationship between an exposure factor and patient outcome; OR > 1 indicated risk factors; and OR < 1 indicated safety factors. MR results were visually represented using scatter plots, forest plots, and funnel plots.
Several sensitivity analyses were performed to evaluate the validity and stability of the causal relationships. Heterogeneity among IVs was assessed using the mr_heterogeneity function, with homogeneity indicated by p-values > 0.05. Horizontal pleiotropy was tested using the mr_pleiotropy_test function, where p-values > 0.05 suggested no directional pleiotropic effects. Additionally, leave-one-out analysis was conducted by systematically excluding individual SNPs to assess their impact on overall causal effect estimates. These analyses were implemented within the “TwoSampleMR” package [32].
Enrichment analysis
Genes associated with IVs corresponding to metabolites that showed evidence of associations with BC risk in the MR analysis were retrieved from the eQTLGen database and considered putative cis-eQTLs target genes. To investigate the potential biological functions and pathways associated with these genes in BC, an enrichment analysis was performed using the Gene Ontology (GO) and Kyoto Encyclopedia of Genes and Genomes (KEGG) databases via the “clusterProfiler” package [33] (p < 0.05).
Single-cell analysis
To characterize the cell-type-specific expression patterns and potential functional associations of CRM-related genes within the BC microenvironment, this study performed single-cell RNA sequencing analysis on BC tissues. Quality control for the GSE176078 dataset was conducted using the “Seurat” package [34], with criteria set to exclude cells containing fewer than 200 genes, genes detected in fewer than three cells, and cells with mitochondrial gene proportions exceeding 5% [35]. Highly variable genes were identified using the FindVariableFeatures function based on mean-variance relationships. Data normalization was performed using the ScaleData function. Following principal component analysis (PCA), uniform manifold approximation and projection (UMAP) was applied for cell cluster identification at a resolution of 0.25. Cell type annotation was performed using the “singleR” package [36].
Cell communication, pathway analysis, and single-cell trajectory in biological processes
To investigate the signaling interaction networks among different cell subpopulations within the TME of BC, the “cellchat” software package was employed to analyze cell communication between annotated cell types [37]. Cells exhibiting the highest number and intensity of intercellular interactions were selected as key cells. The FindALLMarkers function was applied to perform differential analysis on each sub-population, using the parameters only.pos = TRUE, min.pct = 0.2, and return.thresh = 0.01, to obtain single-cell differentially expressed genes (scDEGs). Subsequently, functional enrichment analyses of KEGG pathways and GO biological processes were performed using the org.Hs.eg.db and clusterProfiler packages (pvalueCutoff = 1 and qvalueCutoff = 1). To identify candidate biomarkers possessing both genetic association and cell specificity, biomarkers were derived from the intersection of SNP target genes and scDEGs. Additionally, the “Monocle” package [38] was employed to visualize the developmental trajectories of key cells and analyze changes in the expression levels of biomarkers during cell differentiation.
Identification and expression analysis of biomarkers
Chromosomal localization of biomarkers was performed using the “RCircos” package [39], and subcellular localization predictions were made using the RNALocate database (http://rnalocate.org) to investigate the expression distribution of biomarkers in cells. Expression analysis was performed using the TCGA-BC and GSE42568 datasets to compare the expression of biomarkers in BC and control groups. UMAP clustering heatmaps were generated to visualize the correlation between biomarkers and annotated cell types.
Molecular regulatory network and drug prediction
Transcription factors (TFs) regulating biomarker expression were identified through the ENCODE database chip-seq data via the NetworkAnalyst online platform (https://www.networkanalyst.ca/). The “multiMiR” package [40] was used to identify overlapping target microRNAs (miRNAs) from miRDB (https://www.mirdb.org/) and miRanda databases. Overlapping miRNAs were considered as target miRNAs for further investigation. LncRNA analysis of biomarkers was conducted using the starBase database (http://starbase.sysu.edu.cn). To explore potential therapeutic targets for BC treatment, biomarkers were queried against the DGIdb database (https://www.dgidb.org) to identify candidate drugs.
Statistical analysis
All bioinformatics analyses were conducted using R (v 4.2.2), with comparisons between groups performed using the Wilcoxon test [41].
Results
MR analysis suggested that octanoylcarnitine and decanoylcarnitine are potential risk factors for BC
The IVW analysis identified evidence supporting potential causal associations between decanoylcarnitine (OR = 1.0140, 95% CI = 1.0003–1.0278, p < 0.05), octanoylcarnitine (OR = 1.0131, 95% CI = 1.0015–1.0248, p < 0.05), and BC risk, suggesting that higher genetically predicted levels of both metabolites are associated with an increased risk of BC (Table I). The scatter plot showed a positive slope, further supporting their role as risk factors (Figures 2 A, B). Additionally, forest plots corroborated these findings, demonstrating an elevated BC risk linked to increased decanoylcarnitine and octanoylcarnitine levels in the IVW analysis (Figures 2 C, D). The funnel plot displayed approximate symmetry of IVs on both sides of the IVW line, suggesting that the MR analysis adhered to randomness (Figures 2 E, F).
Table I
Mendelian randomization analysis of associations between carnitine metabolites and breast cancer risk
Figure 2
Scatter plots of the potential causal association between CRM and BC risk. A – decanoylcarnitine and BC risk, B – octanoylcarnitine and BC risk Forest plots for diagnostic efficacy of decanoylcarnitine (C) and octanoylcarnitine (D). E, F – Funnel plot for randomness judgment. MR leave-one-out sensitivity test for decanoylcarnitine (G) and octanoylcarnitine (H)
SNP – single nucleotide polymorphism, MR – Mendelian randomization, OR – odds ratio.
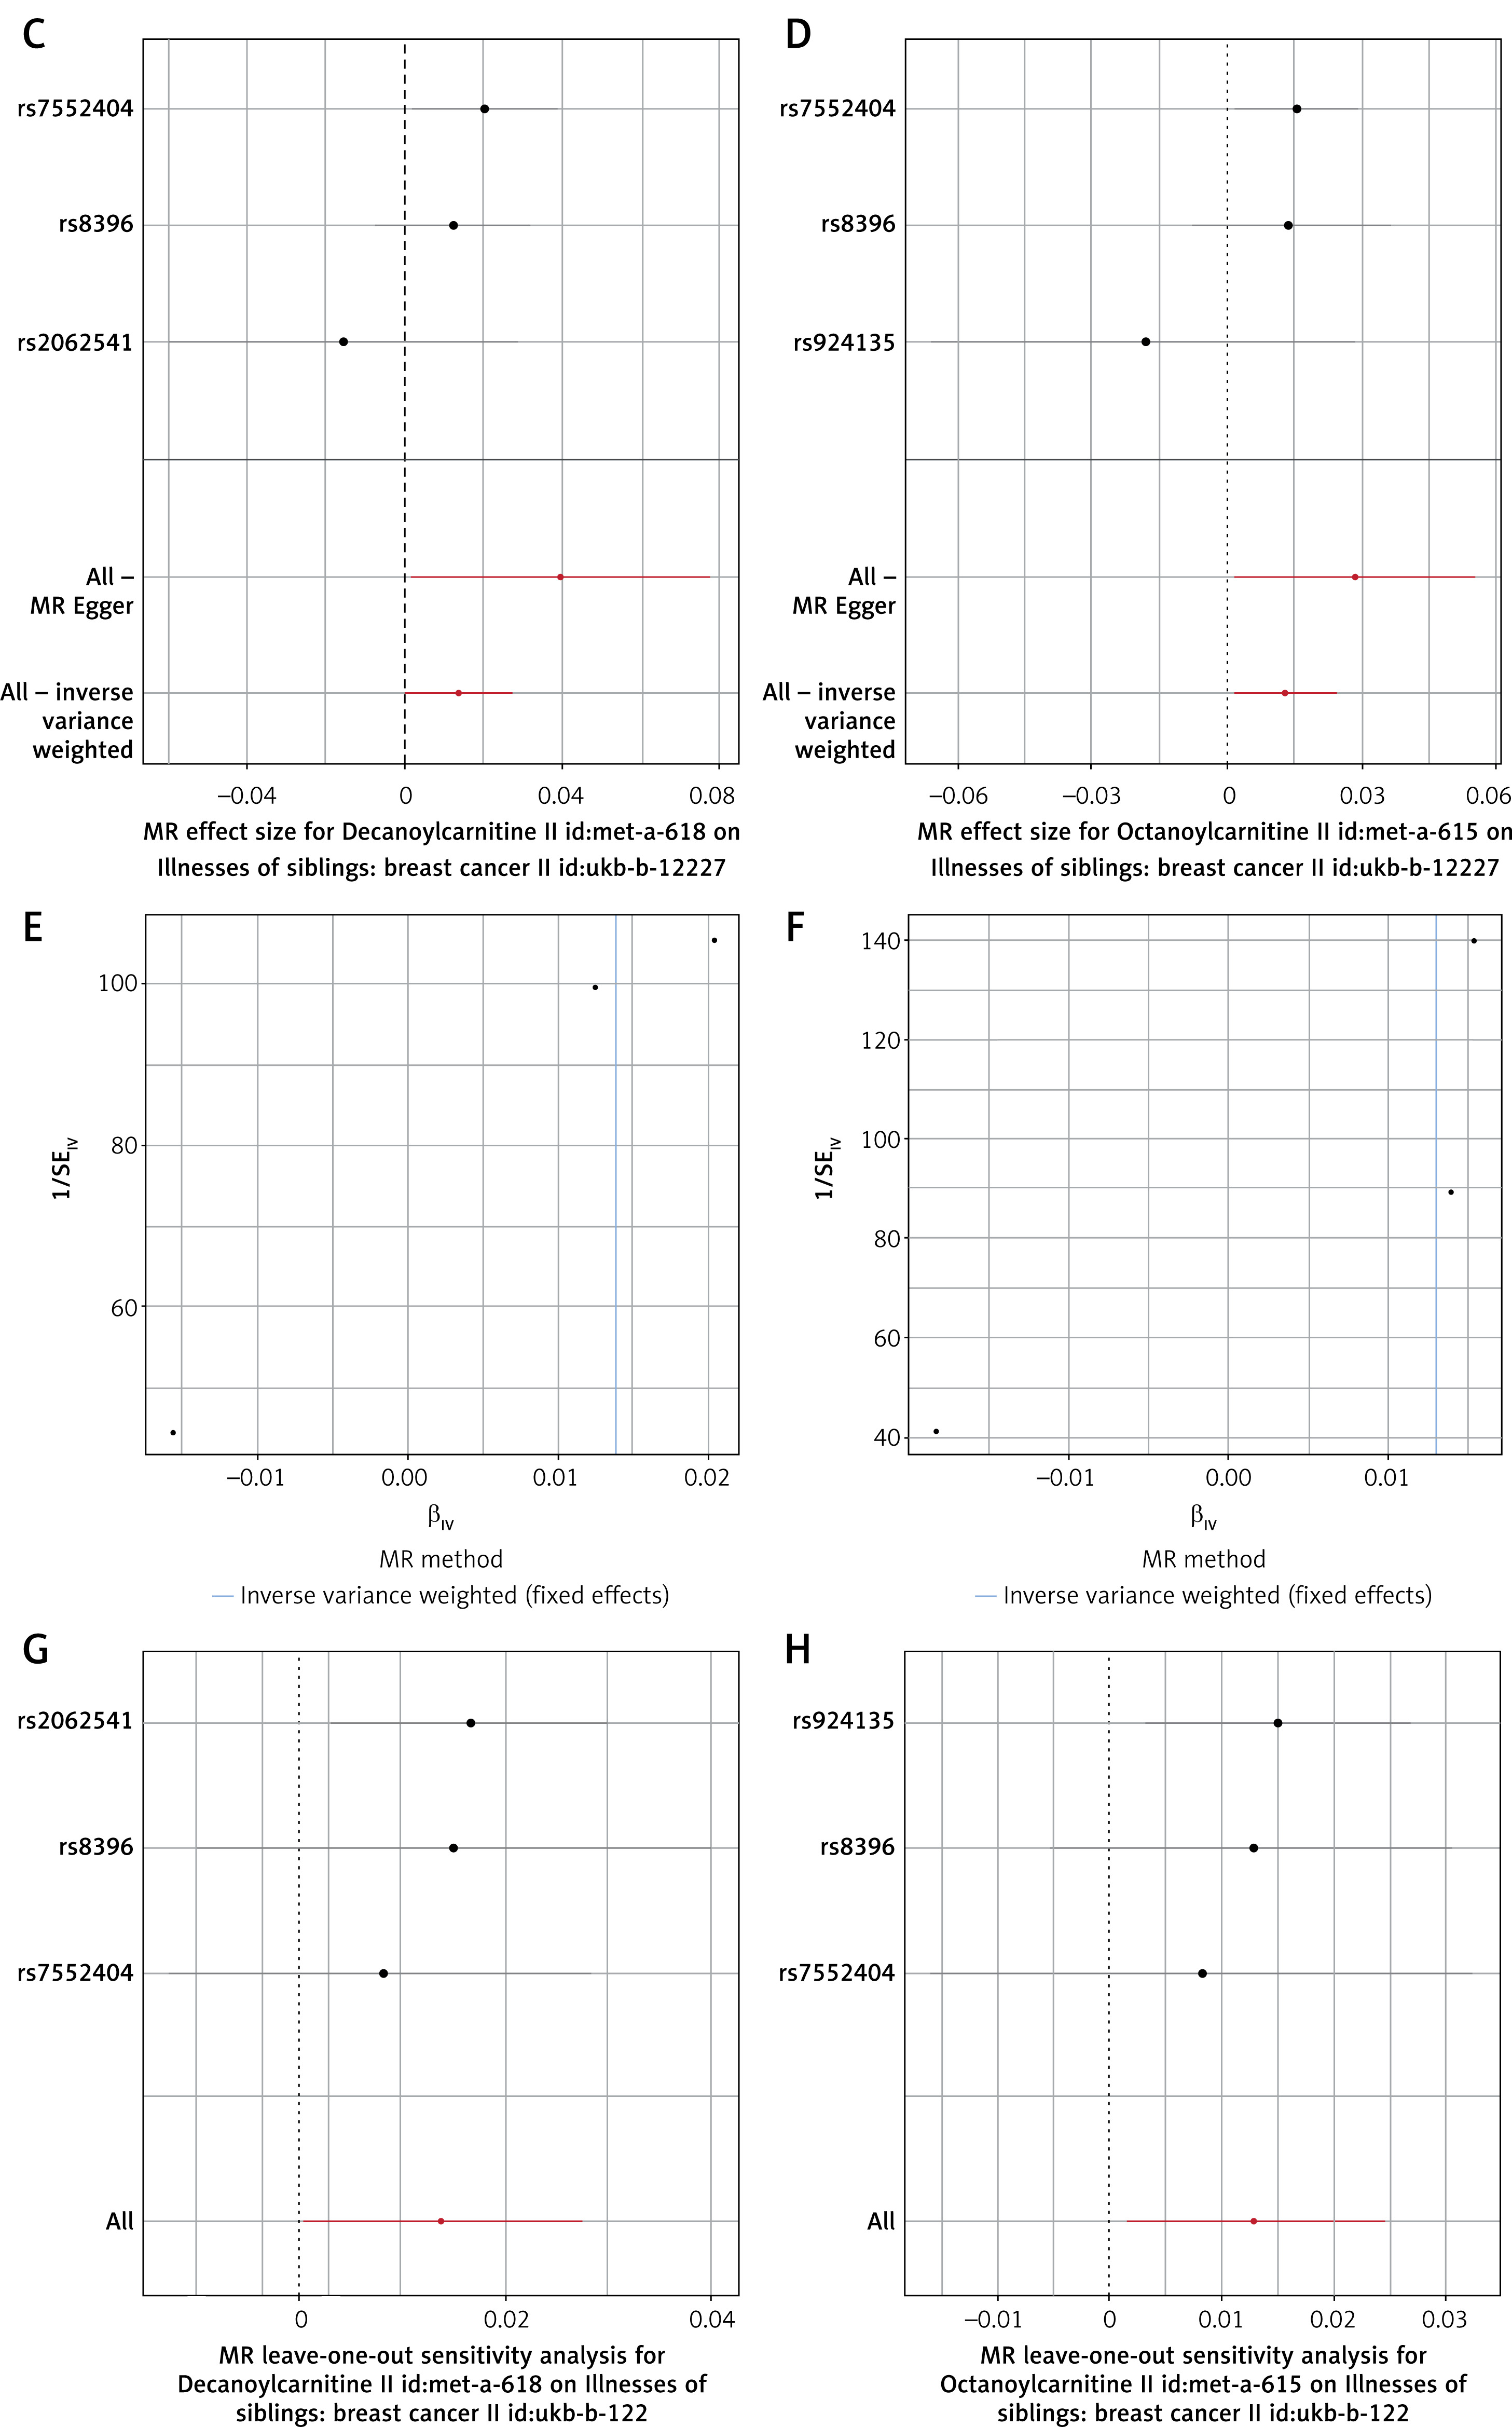
Sensitivity analyses supported the consistency of the MR results. No evidence of significant heterogeneity or horizontal pleiotropy was detected (p > 0.05) (Table II). Leave-one-out analysis indicated that no single SNP unduly influenced the overall estimates (Figures 2 G, H). In summary, the MR analysis suggested that higher genetically predicted levels of octanoylcarnitine and decanoylcarnitine are associated with increased BC risk. To explore shared instrumental variables between the two significant exposure factors, three overlapping SNPs were identified. A total of 12 SNP target genes were identified as being cis-regulated, including ACADM, ETFDH, FNIP2, RAPGEF2, RABGGTB, PPID, ABCC1, MSH4, TMEM144, ST6GALNAC3, CRYZ, and SLC44A5.
Functional analysis of 12 candidate genes
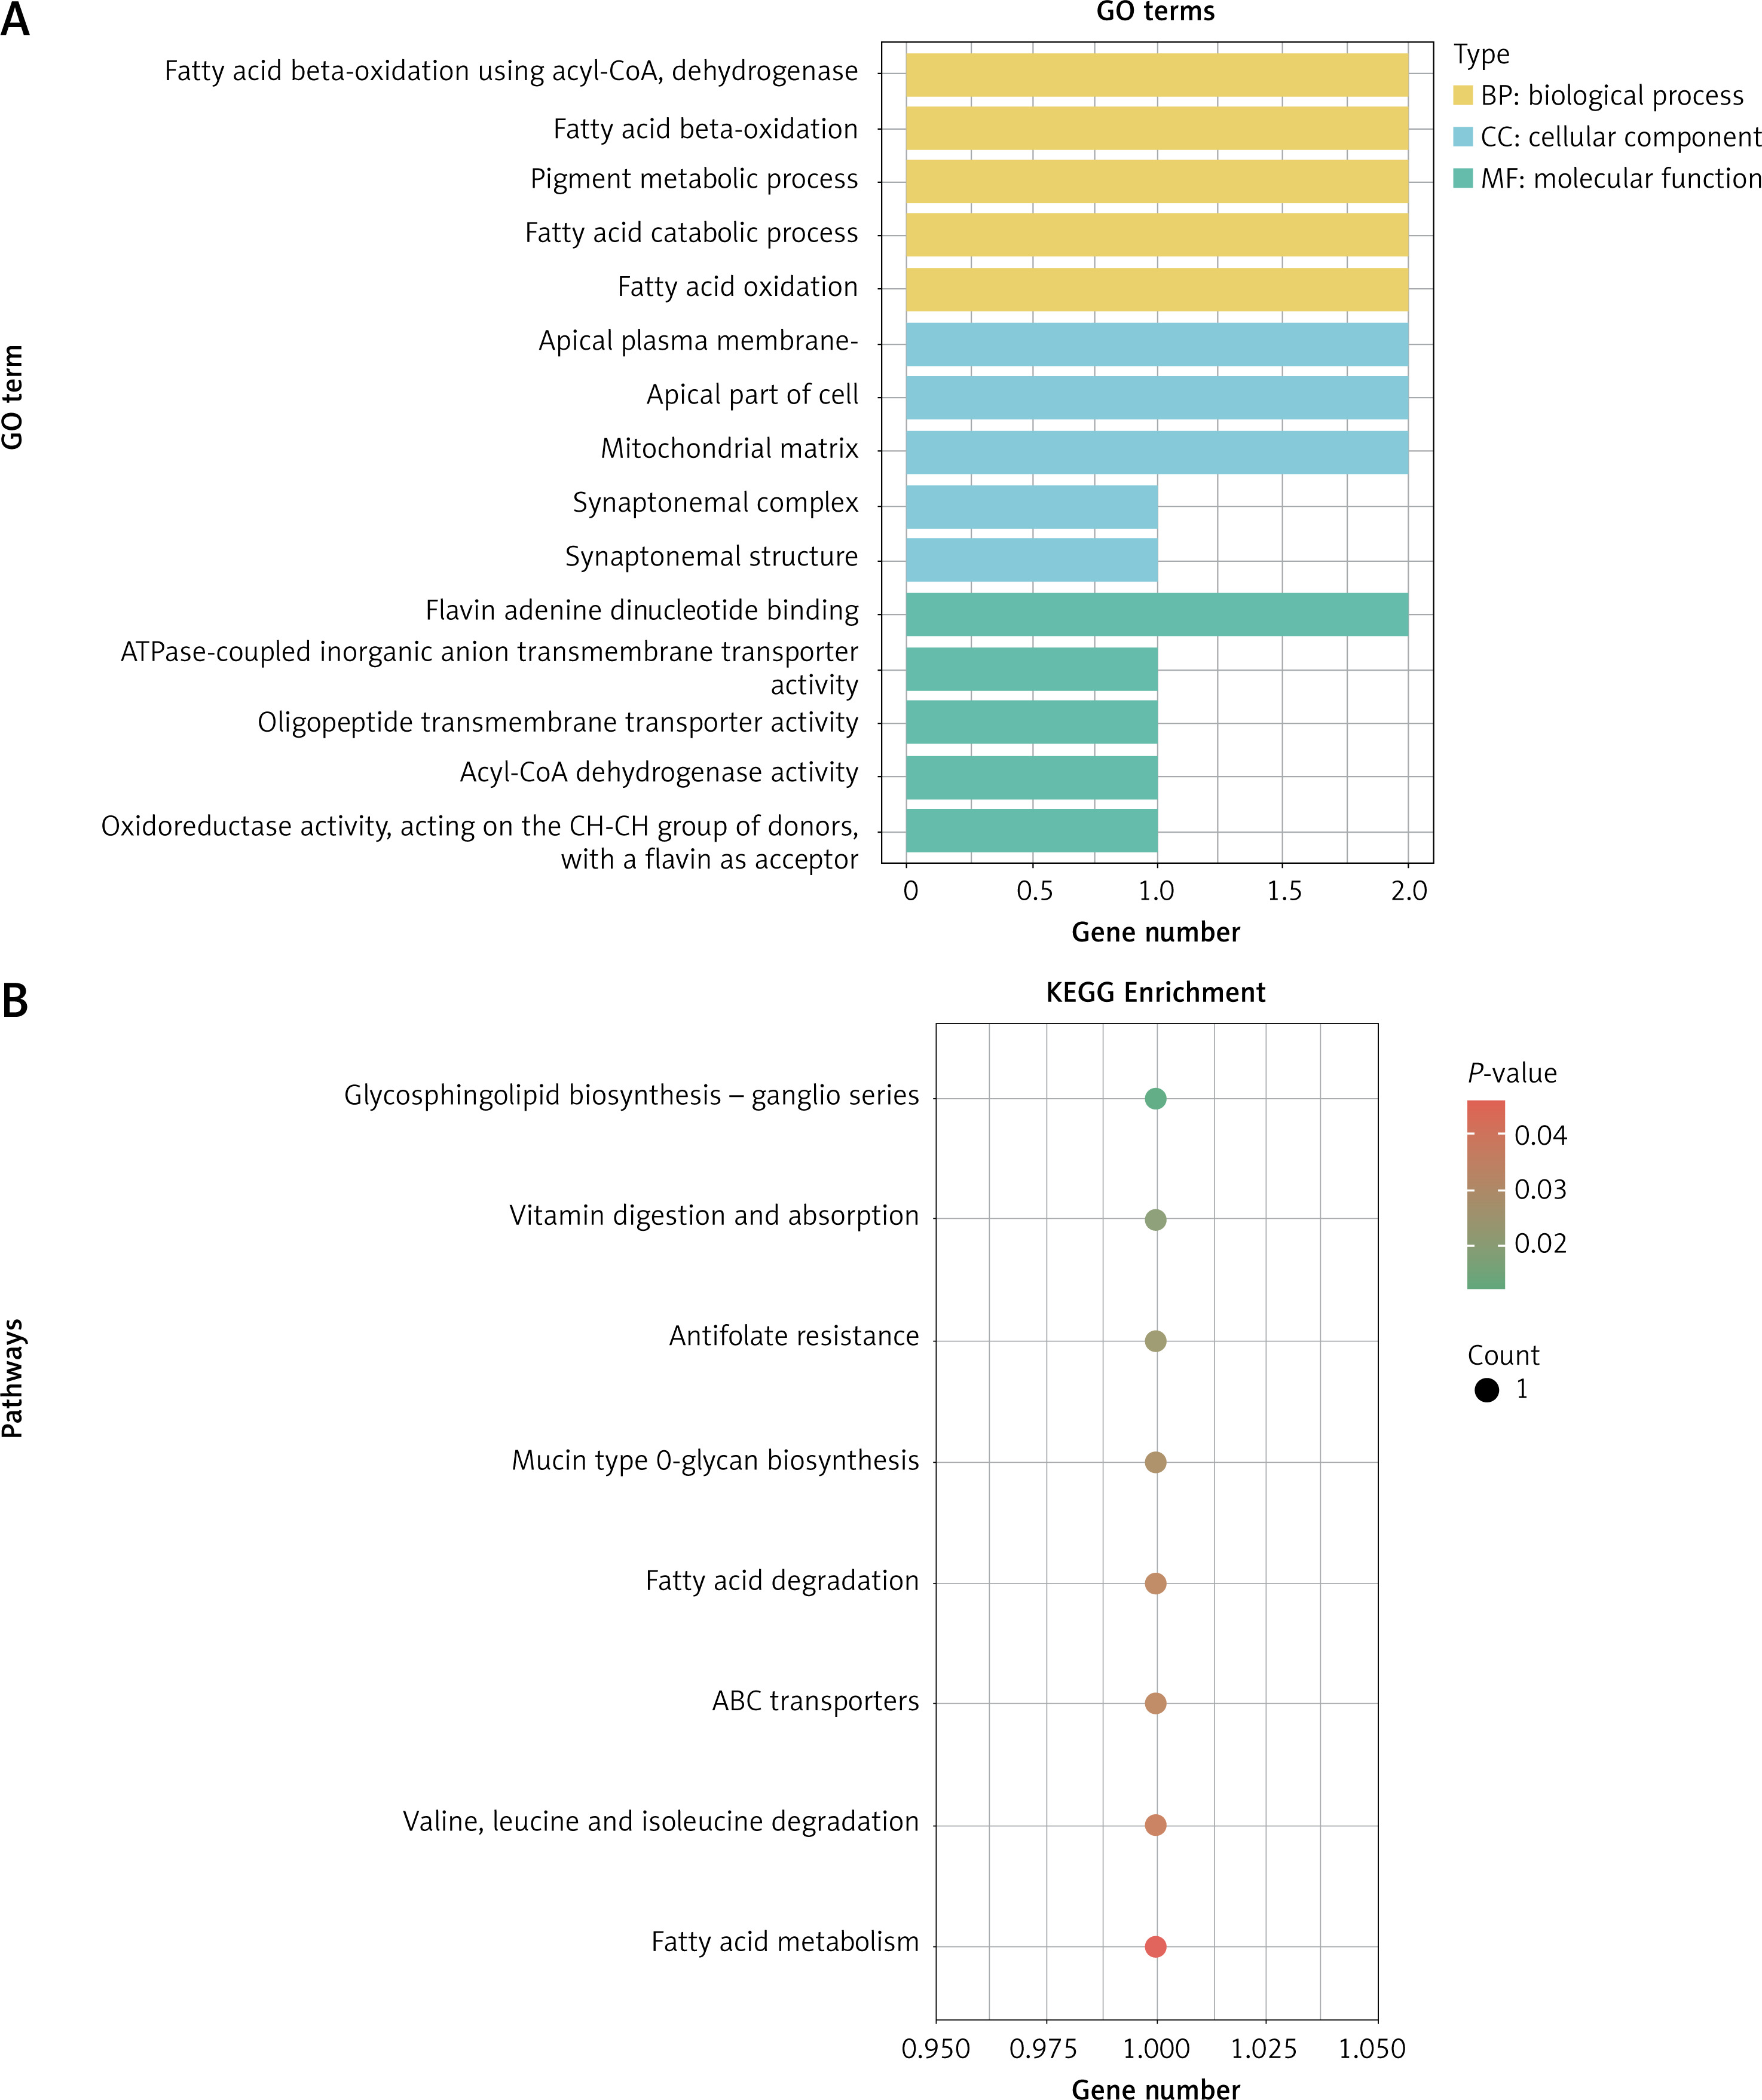
To explore their potential biological functions, an enrichment analysis was performed on these 12 SNP target genes. GO analysis revealed that these genes are associated with fatty acid β-oxidation (FAO) (Figure 3 A), while KEGG analysis indicated involvement in pathways such as glycosphingolipid biosynthesis-ganglio series, among others (Figure 3 B).
Eight cell subpopulations were identified and annotated
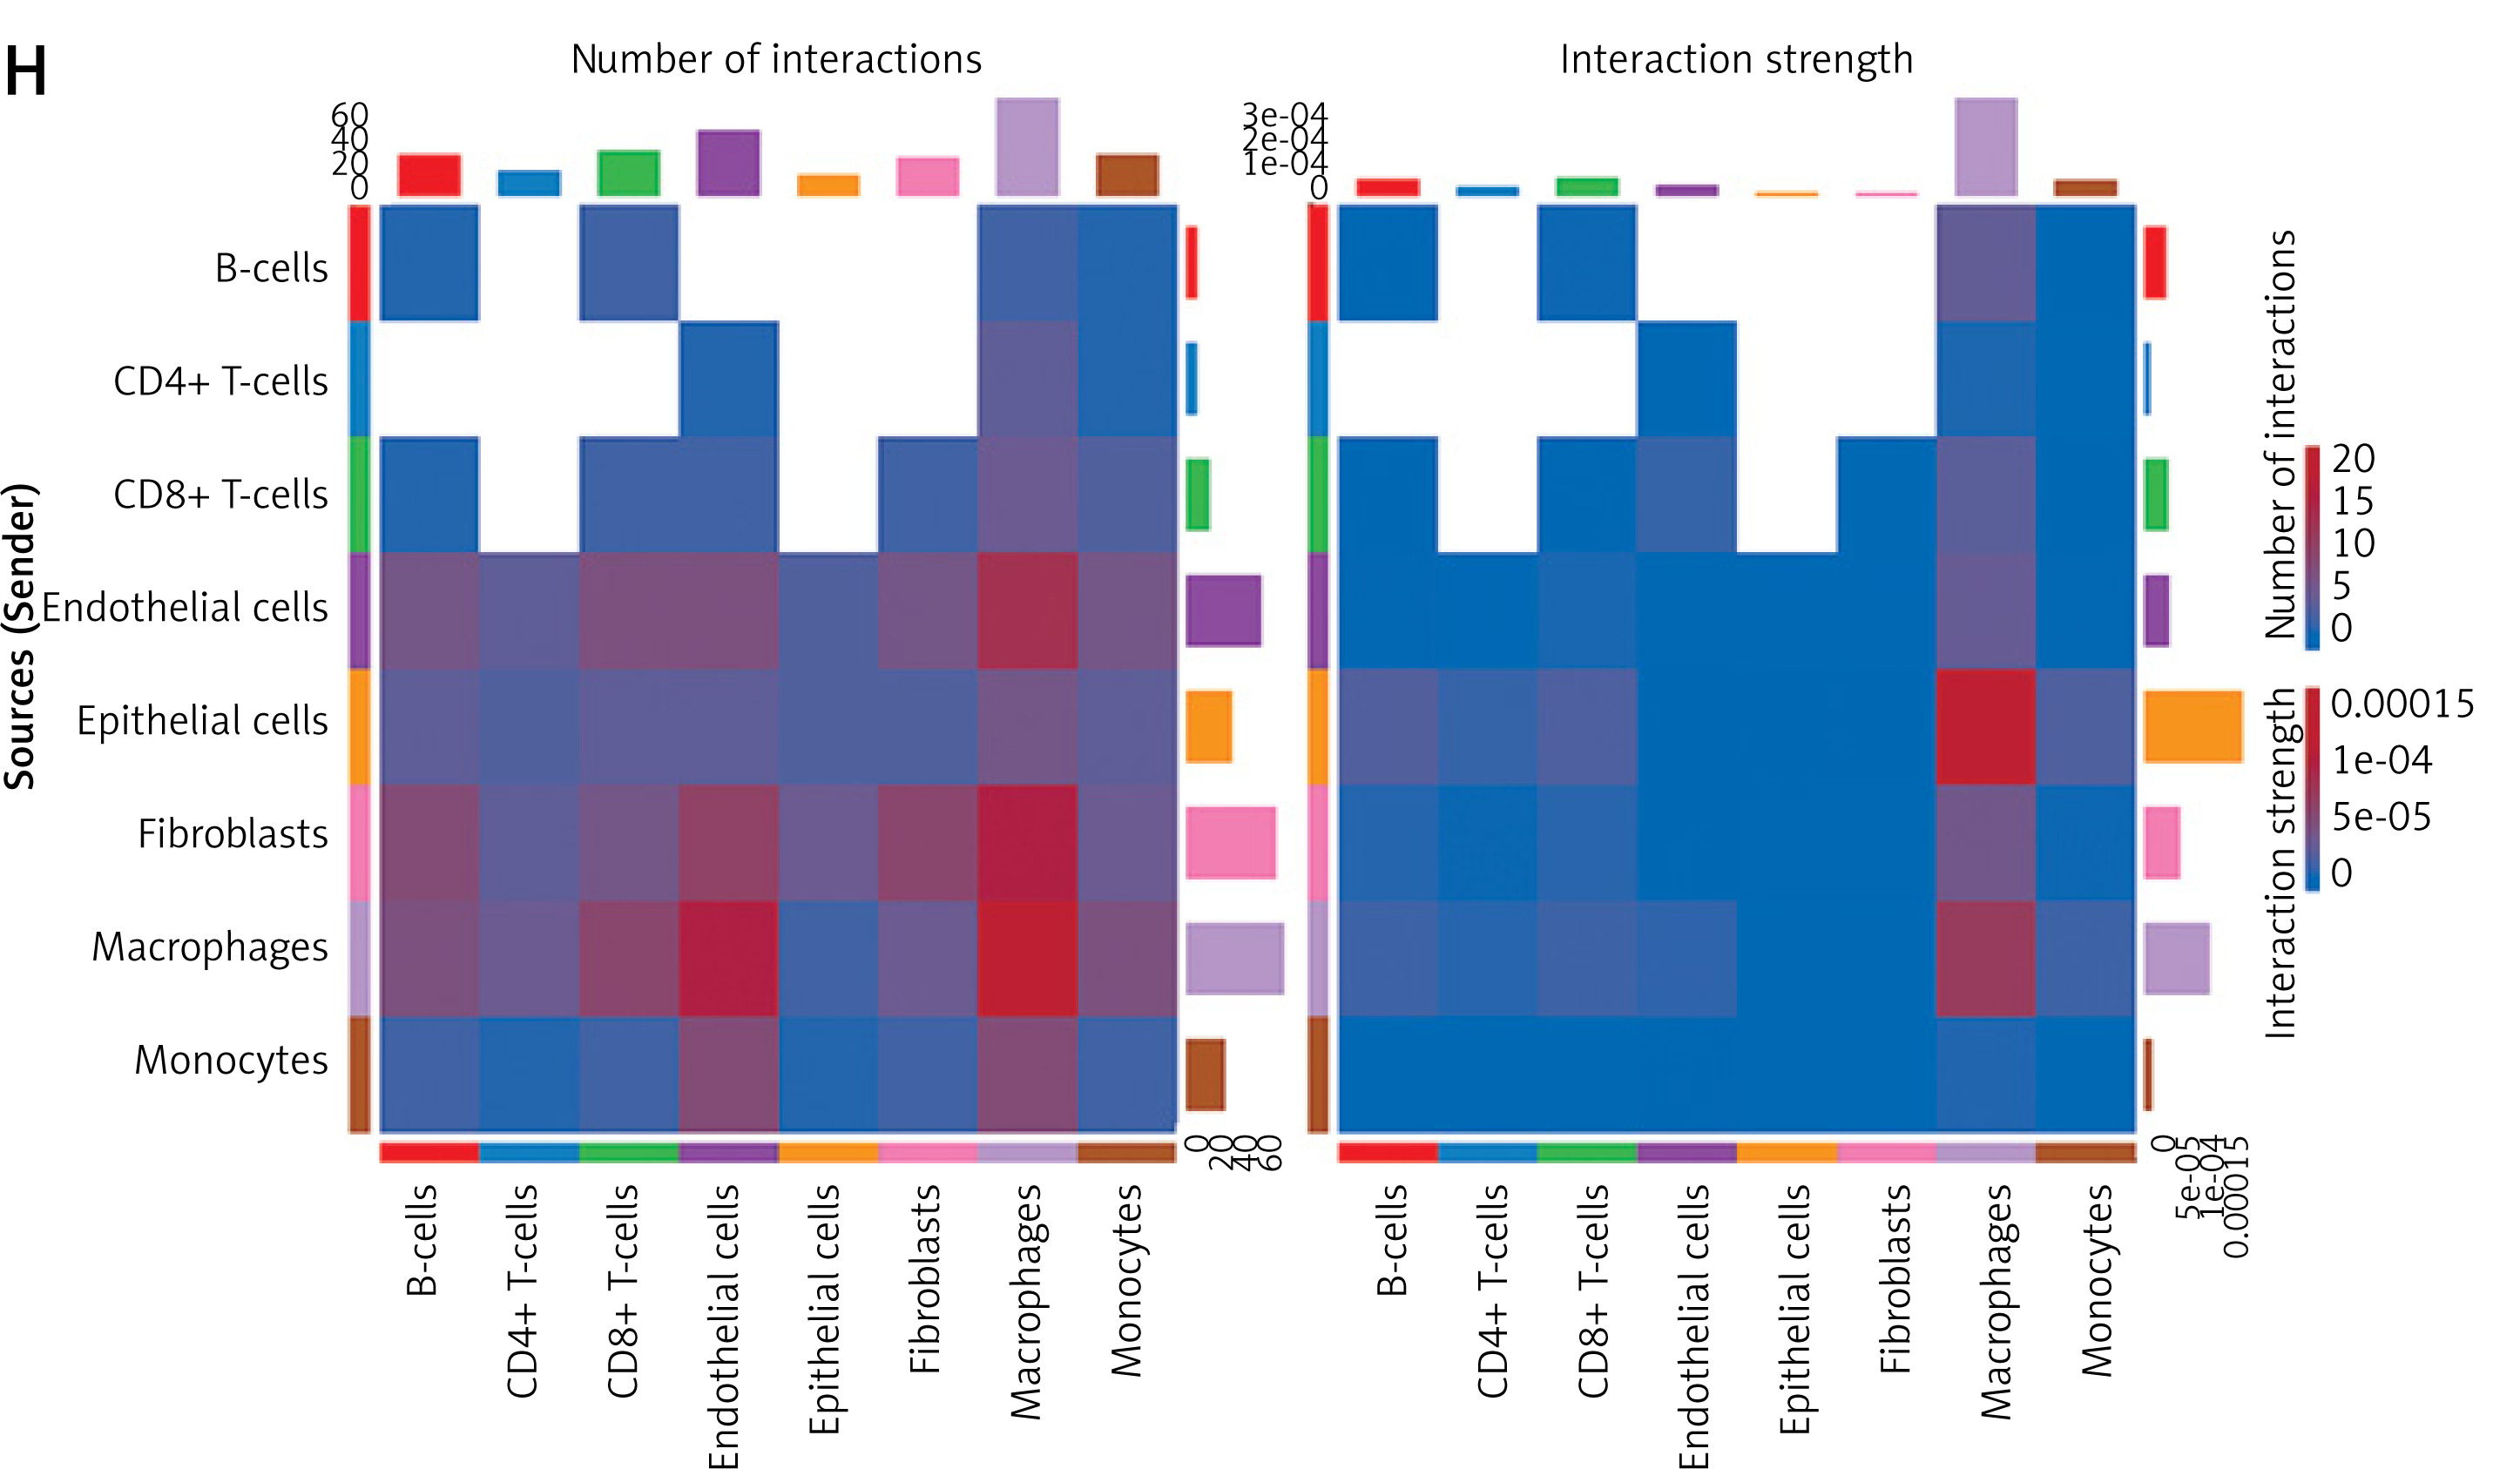
Quality control outcomes are shown in Supplementary Figure S2. Following standard preprocessing, 2000 genes with high variability were identified (Figure 4 A). PCA was performed, and the first 30 principal components were selected for further analysis (Figures 4 B–D). UMAP clustering analysis revealed 32 distinct cell clusters (Figure 4 E). Eight cell subpopulations were annotated, including epithelial cells, fibroblasts, and CD8+ T-cells (Figure 4 F). Cellular communication analysis showed enhanced communication between macrophages and macrophages and between macrophages and epithelial cells (Figures 4 G, H).
Figure 4
Single-cell RNA-seq of BC tissues. A – Results of screening highly variable genes. B – Dimension reduction by principal component analysis (PCA). C – Scatter plot of principal components. E – Uniform manifold approximation and projection (UMAP) cluster analysis. F – Single-cell annotations. G – Cellular communication. H – Heat map of cellular communication
Expression and signaling pathways involving biomarkers in scRNA-seq
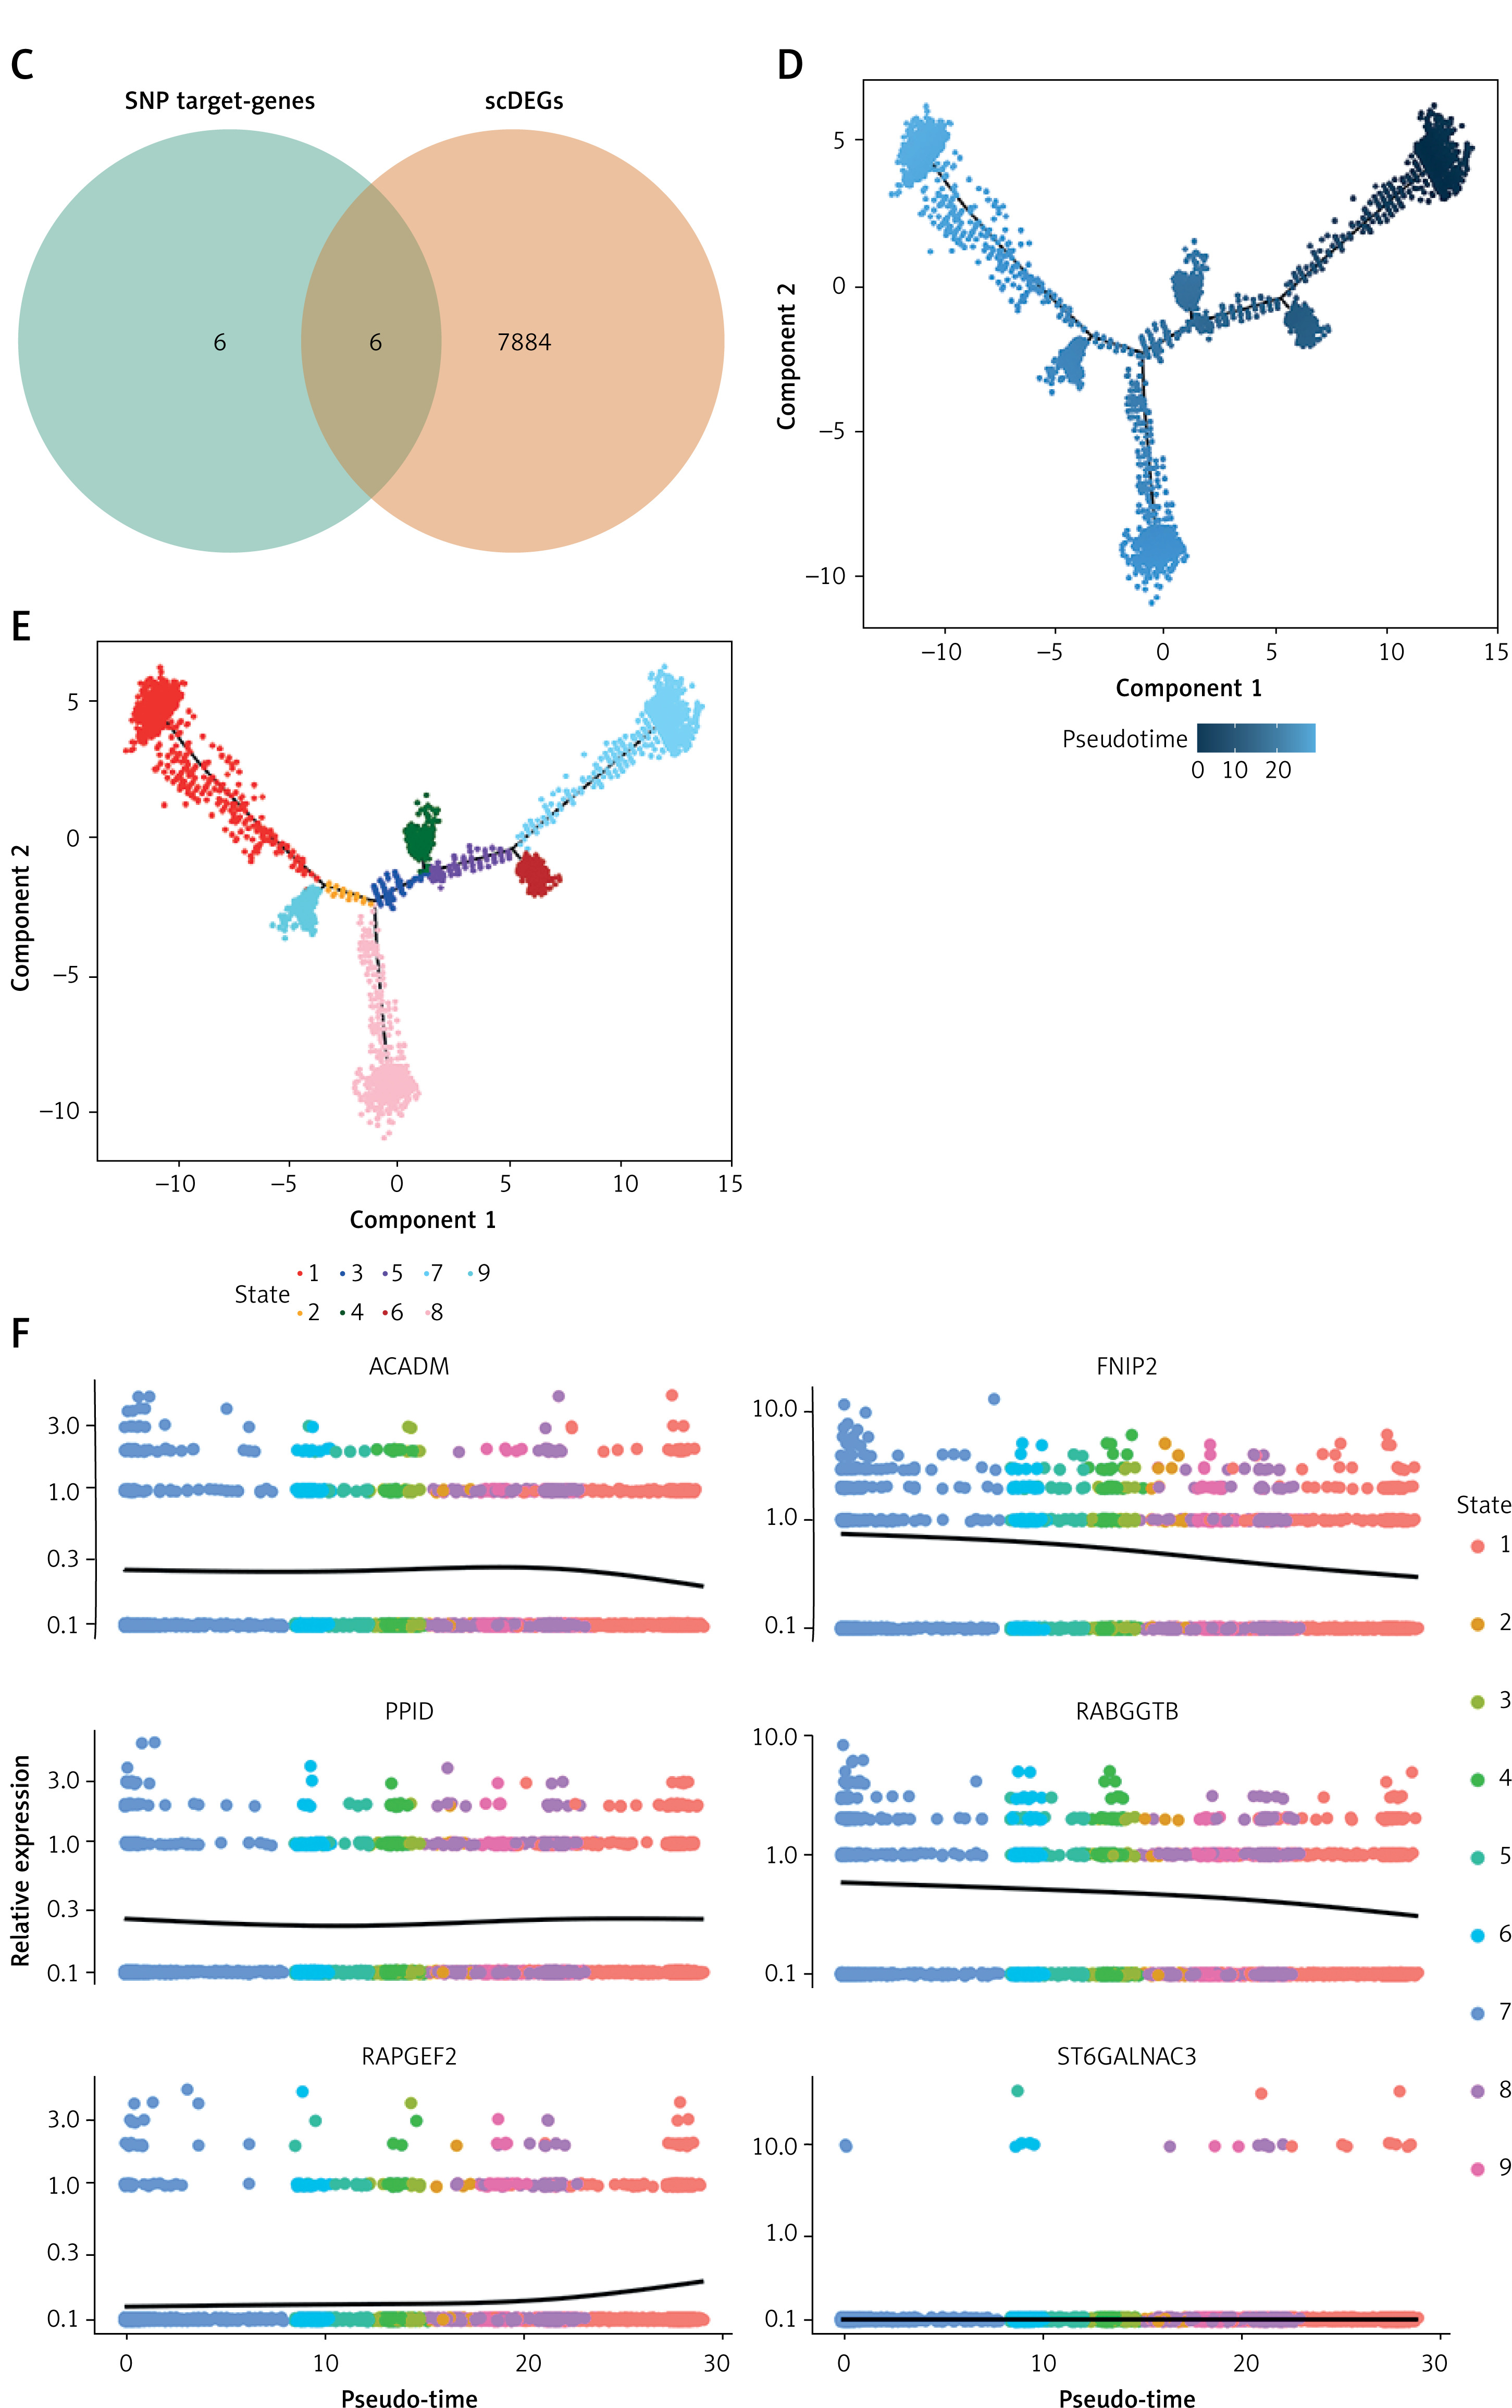
Macrophages exhibited the highest number and intensity of interactions with other annotated cells during cell communication, thus designating them as key cells. A total of 7,890 scDEGs across various cell clusters were identified (Figure 5 A). KEGG pathway and GO biological process analyses of annotated cell subpopulations revealed that macrophages were primarily enriched in processes such as antigen processing and presentation of exogenous peptide antigens, vesicle organization, vacuole organization, and macroautophagy. In contrast, epithelial cells were predominantly enriched in aerobic respiration, mitochondrial ATP synthesis coupled with electron transport, ribonucleoprotein complex biogenesis, and cytoplasmic translation (Figure 5 B). The overlap between the 7,890 scDEGs and the 12 SNP target genes identified six biomarkers: ACADM, FNIP2, RAPGEF2, RABGGTB, PPID, and ST6GALNAC3 (Figure 5 C). Following biomarker identification, their pseudo-temporal trajectories in macrophages were prioritized for further study. As shown in Figures 5 D, E, macrophage differentiation proceeded in three directions. Notably, state 7 differentiated earlier, while state 1 differentiated later. The expression levels of ACADM, RAPGEF2, and FNIP2 exhibited smooth changes, gradually decreasing throughout macrophage development. PPID expression remained stable throughout differentiation. In contrast, RABGGTB expression remained stable initially and then increased, while ST6GALNAC3 expression remained consistently low during macrophage development (Figure 5 F).
Figure 5
Expression and signaling pathways in differentially expressed genes (scRNA)-seq. A – Identification of single-cell scDEGs. B – Functional annotation of single-cell clusters. C – Identification of candidate biomarkers. D – Pseudotime analysis of macrophages. E – Differentiation state of macrophages. F – Expression levels of genes in development of macrophages
Localization information and expression levels of biomarkers
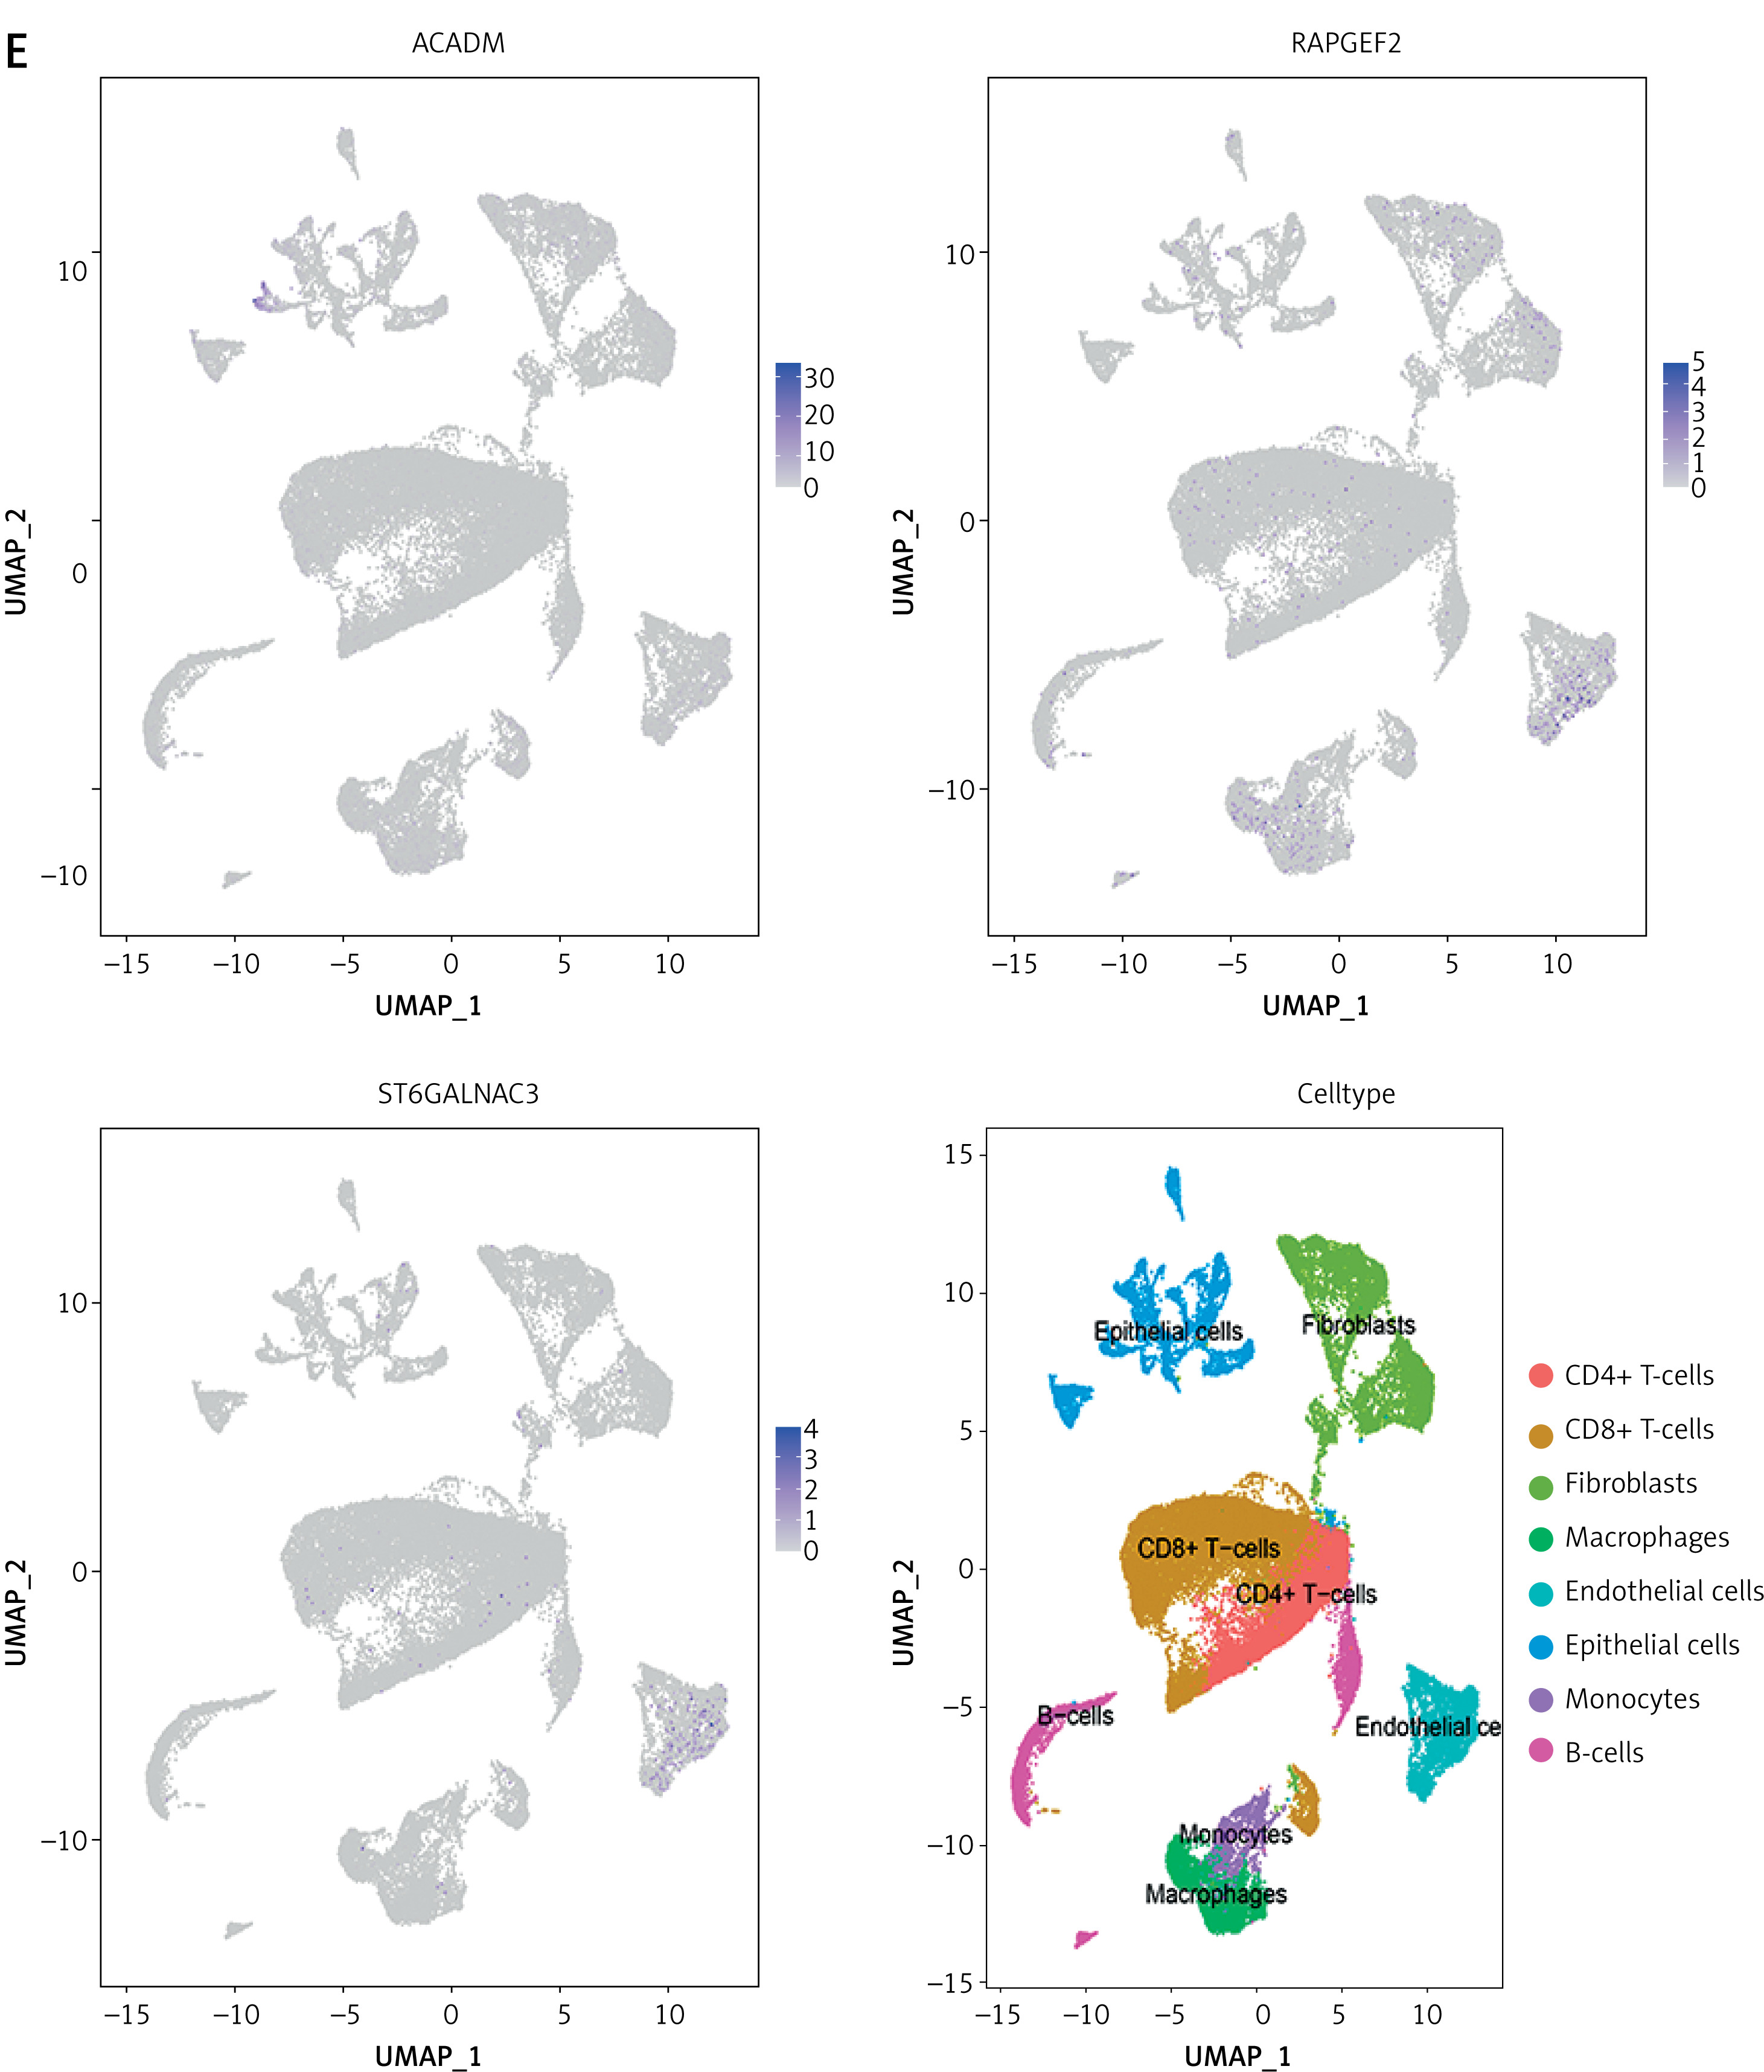
The chromosomal locations of the biomarkers in human DNA are shown in Figure 6 A. Specifically, ACADM, RABGGTB, and ST6GALNAC3 are located on chromosome 1, while FNIP2, RAPGEF2, and PPID are located on chromosome 4. Subcellular localization analysis revealed that the biomarkers were primarily distributed in the cytoplasm, ribosomes, endoplasmic reticulum, ribosome-free cytoplasm, and nucleus, with the majority of the proteins localized in the cytoplasm (Figure 6 B). Expression analysis of the TCGA-BC and GSE42568 datasets demonstrated significant downregulation of ACADM, RAPGEF2, and ST6GALNAC3 in BC samples (Figures 6 C, D). As presented in Figure 6 E, ACADM was among the highly variable genes in epithelial cells, whereas RAPGEF2 and ST6GALNAC3 were associated with highly variable genes in endothelial cells, and RAPGEF2 was also linked to highly variable genes in macrophages.
Results of molecular regulatory network and drug prediction for biomarkers
For ACADM, 21 TFs were predicted; for RABGGTB, 20 TFs; and for PPID, 6 TFs. No corresponding TF data were predicted for the remaining three biomarkers. These TFs were used to establish a TF-mRNA network, with the TF TAF7 co-targeting and regulating three biomarkers (Figure 7 A).
Figure 7
Molecular regulatory network and drug prediction for biomarkers. A – Prediction of TFs for candidate biomarkers. B – mRNA-miRNA-lncRNA regulatory network. C – Results of drug prediction analysis
TFs – transcription factors.
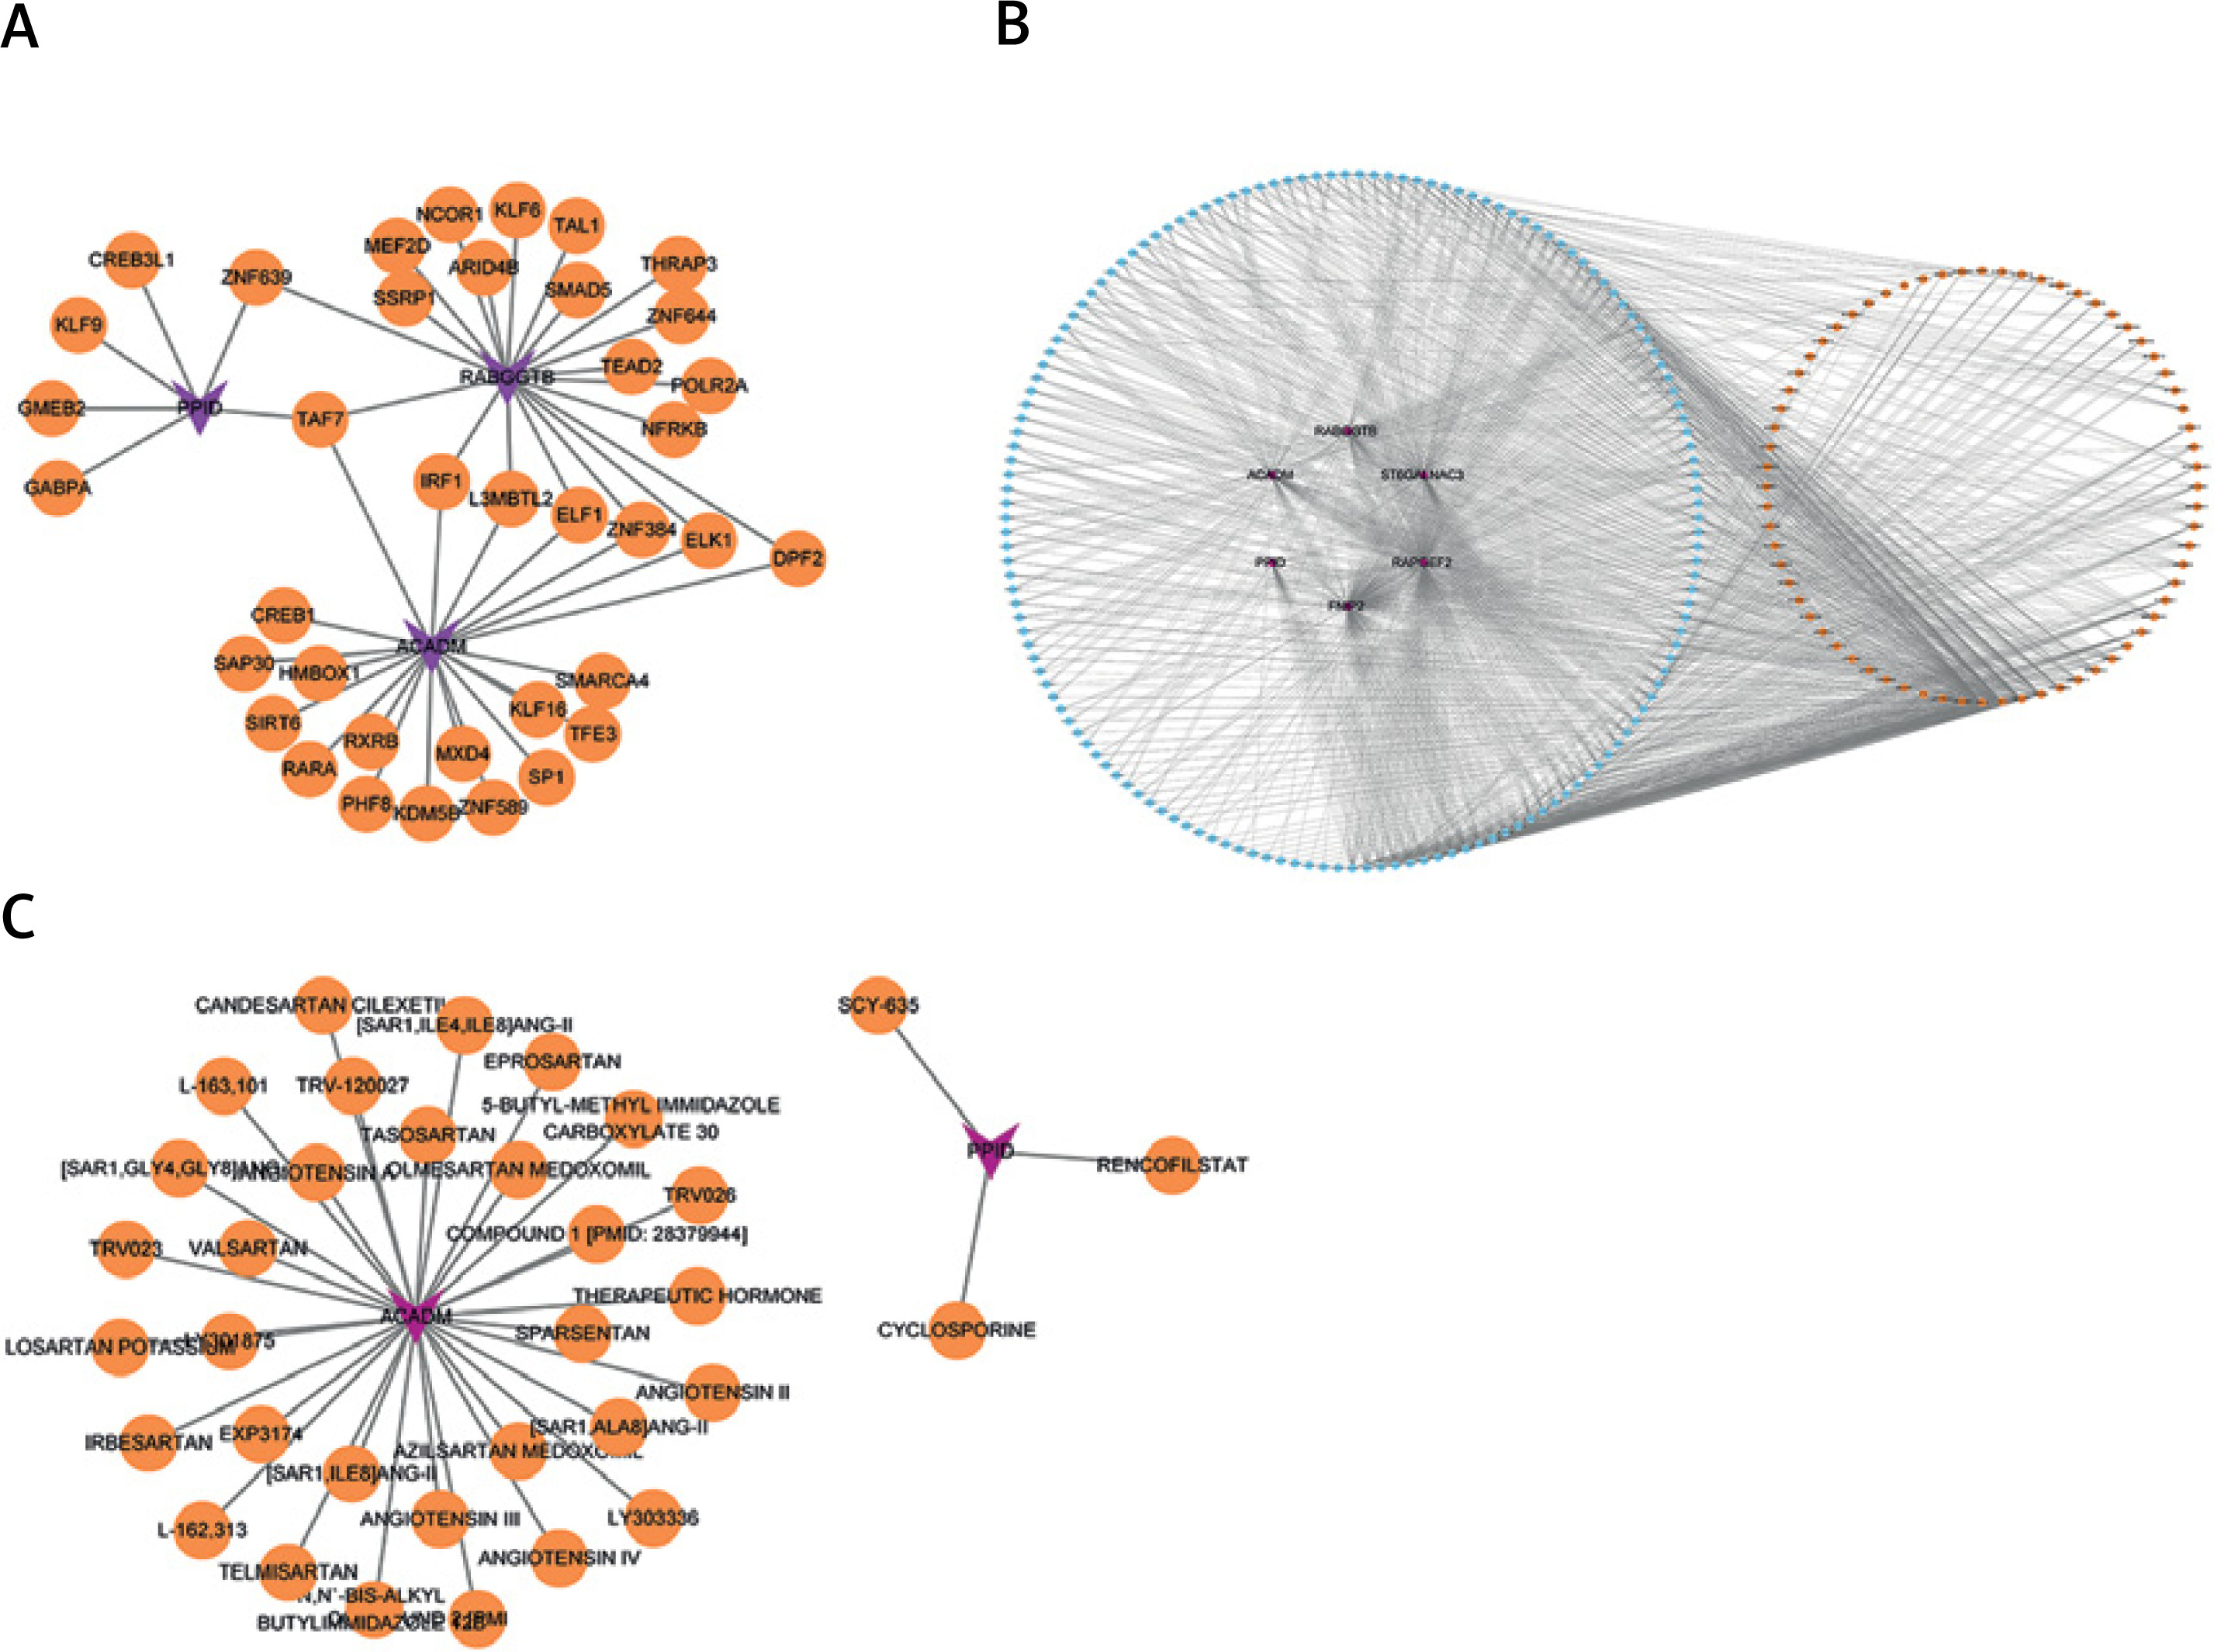
Additionally, the mRNA-miRNA-lncRNA regulatory network revealed that 157 miRNAs (such as hsa-miR-105-5p, hsa-miR-106b-5p, hsa-miR-1252-5p, and hsa-miR-126-5p) and 68 lncRNAs (such as NEAT1 and XIST) interacted with the biomarkers (Supplementary Table SI, Figure 7 B). Drug prediction analysis identified 31 targeted drugs for ACADM (e.g., irbesartan, angiotensin A, and trv-120027) and 3 drugs for PPID (SCY-635, rencofilstat, and cyclosporine) in BC (Figure 7 C, Supplementary Table SII). In summary, this integrative analysis provides insights into potential molecular pathways that may be associated with BC. The identification of candidate drug targets offers directions for future experimental and therapeutic investigation.
Discussion
BC exhibits significant diversity at both the cellular and molecular levels, which greatly impacts prognosis, particularly in subtypes such as TNBC. TNBC accounts for 15% of all BC cases and is associated with a relatively poor prognosis due to its high metastatic potential [42, 43]. A recent study highlighted that patients with hormone receptor-positive (HR+)/human epidermal growth factor receptor 2-negative (HER2-) BC exhibit distinct biological and clinical characteristics, suggesting the need for tailored therapeutic approaches for this group [44]. Therefore, identifying new biomarkers specific to these subtypes is critical. CRM have been proposed as potential prognostic biomarkers in multiple cancers [45, 46]. In the present study, MR analyses suggested potential associations between elevated levels of these metabolites and increased BC risk, supporting the need for further investigation of their potential clinical and biological relevance.
This study identified octanoylcarnitine and decanoylcarnitine as potential risk factors for BC. Previous studies have shown that octanoylcarnitine levels vary across BC stages and hormone receptor subtypes, with lower levels observed in T3-stage tumors and higher levels in ER/PR-positive tumors [47]. We hypothesize that elevated octanoylcarnitine may be associated with metabolic changes during BC development and progression. In advanced stages, its levels may be depleted and decline, possibly due to metabolic reprogramming, such as an enhanced Warburg effect, and microenvironmental changes [15]. However, the biological roles of these acylcarnitines display notable heterogeneity and context dependency. For instance, elevated octanoylcarnitine is associated with increased risk of gastrointestinal cancer [48], while it exhibits inhibitory effects in ovarian cancer [49]. Similarly, decanoylcarnitine has been reported to show a positive association with the risk of most cancers [50], but in metastatic pancreatic cancer patients, its higher serum levels are linked to favorable body composition characteristics (e.g., greater subcutaneous fat) and longer survival [51]. These findings suggest that the biological effects of octanoylcarnitine and decanoylcarnitine are highly dependent on cancer type, disease stage, molecular subtype, and the local metabolic microenvironment. In summary, the roles of these two metabolites in cancer are complex and dynamic. Future work will involve functional experiments and validation in clinical cohorts to further characterize their dynamic changes and mechanisms of action across different stages and subtypes of BC, and to evaluate their potential as stage-specific biomarkers or therapeutic targets.
The 12 SNP-targeted genes identified in this study were significantly enriched in FAO and related metabolic pathways, which represent the core processes through which carnitine regulates fatty acid metabolism. Previous studies have shown that modulating fatty acid metabolism via the AKT/RYR2 signaling pathway promotes the progression of TNBC [52]. Meanwhile, FAO can enhance BC invasion and metastasis through the miRNA-328-3p/CPT1A axis [53]. Furthermore, fatty acid oxidation is a key metabolic pathway that sustains the malignant mesenchymal phenotype of tumor cells and drives metastasis. Disruption of this pathway, through pharmacological (e.g., retinoic acid) or genetic intervention, can alter lipid metabolic flux, influence epigenetic modifications, and subsequently reverse the cellular state while suppressing metastatic potential [54]. Collectively, these findings suggest that carnitine-related metabolic pathways may contribute to metabolic alterations associated with BC progression. Further research is needed to explore the mechanisms linking carnitine-related metabolites to the development and progression of BC.
The complex TME of BC consists of tumor cells, immune cells, fibroblasts, vascular cells, and the extracellular matrix, all of which contribute to tumor growth, progression, and metastasis [55]. Cellular communication analysis revealed that macrophage-macrophage interactions and macrophage-epithelial cell communications were upregulated. Macrophages, as immune effector cells, play a critical role in the immune microenvironment of BC. Numerous studies have established the protumor effects of alternatively activated (M2) tumor-associated macrophages (TAMs), correlating their presence with poor prognosis in BC and other cancers [56, 57]. TAMs contribute to tumor progression by promoting angiogenesis, suppressing T cell-mediated immunity, and modulating metabolic activities and associated metabolites, thereby shaping the overall metabolic landscape of the TME [58]. Moreover, this study revealed that macrophage subpopulations are predominantly enriched in macroautophagy. As a central regulatory process governing cellular metabolism and homeostasis, the activation of autophagy is closely associated with functional polarization, survival, and pro-tumor activity of macrophages [59–61]. Targeting autophagic processes in macrophages may thus represent a promising therapeutic strategy to reverse their pro-tumor functions.
To explore therapeutic targets related to CRM in BC tumor cells, six biomarker genes were identified by overlapping DEGs and candidate genes: ACADM, FNIP2, RAPGEF2, RABGGTB, PPID, and ST6GALNAC3 (Supplementary Table SIII). Notably, ST6GALNAC3, ACADM, and RAPGEF2 were significantly downregulated in the BC group, suggesting their involvement in BC development and progression. The identified SNP target genes, including ACADM, are integral to the carnitine shuttle mechanism and are associated with promoting FAO, a pathway that supports cancer cell proliferation, migration, and invasion. These biomarkers may hinder tumor development by inhibiting FAO, leading to energy deprivation and abnormal lipid accumulation [62–64]. The expression of these genes correlates with tumor progression and metastasis, indicating that targeting these metabolic pathways could provide therapeutic strategies for mitigating BC.
However, this study has several limitations. First, the inclusion of participants of European ancestry may limit the applicability of the findings to diverse global populations. Future research should validate these results in more diverse cohorts and further confirm the conclusions by integrating clinical or epidemiological data. Moreover, although the MR approach enhances the reliability of causal inference and transcriptomic analysis provides mechanistic insights, the specific biological functions of the identified biomarkers and related metabolites in the development and progression of BC remain incompletely understood. These preliminary associations still require validation through in vitro and in vivo functional experiments to further assess their effects on cell proliferation, invasion, and lipid metabolism.
In conclusion, this study provides evidence supporting potential associations between elevated levels of octanoylcarnitine and decanoylcarnitine and increased risk of BC. The genes annotated by the associated SNPs were enriched in FAO-related pathways, suggesting a potential association between carnitine-related metabolites and fatty acid metabolic processes in BC. Further integration of single-cell transcriptomic analysis enabled the identification of six CRM-related potential biomarkers: ACADM, FNIP2, RAPGEF2, RABGGTB, PPID, and ST6GALNAC3. Notably, single-cell profiling revealed dynamic expression patterns of these biomarkers within macrophage subpopulations in the TME, suggesting potential links between CRM-related metabolic pathways and cellular communication within the BC microenvironment. These findings identify candidate genes and pathways that may contribute to future studies of BC biology and metabolism-related therapeutic strategies. However, further functional validation and investigation in more diverse populations are warranted to elucidate the molecular and cellular processes through which these metabolites and their corresponding genes may influence BC progression.

