

Introduction
Oxaliplatin, as the third generation of platinum anticancer drugs, is substantiated with forceful antineoplastic activity in colorectal cancer, becoming a first-line therapeutic strategy of this malignancy [1]. Moreover, gastric cancer (GC) is also considered for being administered with oxaliplatin treatment [2]. Unfortunately, intrinsic or acquired resistance to oxaliplatin is an important factor of treatment failure in GC [3]. Therefore, it is important to uncover the molecular mechanisms underlying oxaliplatin resistance (OR) to find an optimal therapeutic regimen and circumvent this phenomenon in GC.
Most cancer cells show initial sensitivity to oxaliplatin, but they will eventually develop into OR. Many molecular mechanisms have been described or hypothesized to be implicated in OR [4]. For example, the elevation of the endonuclease non-catalytic subunit, an excision repair enzyme, is an indicator of OR [4–6]. In addition, multiple pathways such as mitogen-activated protein kinase, phosphoinositide-3-kinase/Akt and epidermal growth factor/ataxin-2-like contribute to OR in GC [5, 6]. Gene expression profiling analysis reveals the involvement of a large number of genes in developing OR in human GC [7]. Thrombospondin-1 (THBS1) is an extracellular glycoprotein that plays multiple roles in physiological and pathological processes, including carcinogenesis [8]. THBS1 has been shown to play a role in angiogenesis [9] and promote tumor growth, invasion, migration and nodal metastasis in human GC [8, 10]. Recent studies indicate that THBS1 is involved in taxol resistance gene 1-mediated OR in SGC-7901 cells [11, 12]. However, the regulatory mechanism in the progression of OR in GC via targeting THBS1 has not been completely elucidated.
microRNAs (miR) are identified as a class of non-coding RNAs that can regulate messenger RNA (mRNA) degradation or translational repression via base complementarity between the miR seed sequence and the 3’-untranslated regions (3’-UTR) of their target genes [3]. Except for their well-known function to modulate post-transcriptional repression, accumulating evidence exhibits that abnormally expressed miRs are closely associated with tumorigenesis and multidrug resistance in cancer therapy [13, 14]. In vitro, miR-135a and -361 have been correlated with acquired resistance to oxaliplatin in GC via targeting E2F transcription factor 1 and ATP binding cassette subfamily B member 1, respectively [15, 16]. miR-338-3p as a tumor suppressor has been validated in GC [17, 18]. The purpose of our present study was to determine whether miR-338-3p modulates OR in GC cells via mediating THBS1.
Material and methods
Specimen collection
Adjacent non-tumor tissues (n = 31) and GC tissues from GC patients with (n = 14) or without (n = 17) OR were collected from GC patients who underwent a surgical operation at the Department of Gastrointestinal Surgery, the Second Affiliated Hospital of Kunming Medical University (Kunming China). Blood (5 ml) samples from healthy controls (HC; n = 19) and GC patients (n = 31) were collected with ethylenediaminetetraacetic acid (EDTA)-containing tubes (Becton, Dickinson and Company); serum samples were separated immediately with a centrifuge (3000 r/min, 10 min, 4˚C). All clinical specimens were maintained at –80˚C for further analysis. The specimens of GC patients were classified according to the 2004 World Health Organization criteria and the TNM staging system. Written informed consent was obtained from all of the participants before sample collection. The study was approved by the Ethics Committee of the Second Affiliated Hospital of Kunming Medical University (Kunming China) according to the Helsinki Declaration.
Cell culture
The human gastric mucosal epithelial cell line (GES-1) and GC cell lines (BGC-823 and MGC-803) were purchased from the Cell Bank of China Academy of Sciences (Shanghai, China). BGC-823 and MGC-803 cells with oxaliplatin resistance were established using escalating concentrations of oxaliplatin from 2 µM to 30 µM, increasing with 2 µM every 2 days until maintained with 30 µM. GES-1, BGC-823, BGC-823-OR, MGC-803 and MGC-803-OR were cultured in Dulbecco’s modified Eagle’s medium (DMEM; Invitrogen, Carlsbad, CA, USA) with 10% fetal bovine serum (Thermo Scientific HyClone, Beijing, China), 100 U/ml penicillin and 100 µg/ml streptomycin in a humidified incubator (Thermo Fisher Scientific, Inc., Waltham, MA, USA), 5% CO2, 95% air atmosphere.
RT-qPCR
Total RNA was extracted using the miRNeasy Mini Kit (Qiagen, Inc., Valencia, CA, USA). TaqMan RT kit and TaqMan MicroRNA assay (Applied Biosystems) were utilized to analyze the expression level of miR-338-3p in GC cell lines using the Applied Biosystems 7300 Real-Time PCR System (Thermo Fisher Scientific, Inc.). Relative miR-338-3p expression was calculated using the 2–ΔΔCt method, as described previously [19], and U6 was used as an internal control. The following primers for PCR were used: forward primer 5’-TCCAGCATCAGTGATT-3’ and reverse primer 5’-CAGTGCGTGTCGTGGAGT-3’ for miR-338-3p; forward primer 5’-CTCGCTTCGGCAGCACA-3’ and reverse primer 5’-AACGCTTCACGAATTTGCGT-3’ for U6.
Cell counting Kit-8 (CCK-8) assay
Cell viability was determined by CCK-8 (Dojindo Molecular Technologies, Inc., Kumamoto, Japan), and the absorbance was measured at OD450 nm with an Elx800 Reader (Bio-Tek Instruments Inc., Winooski, VT, USA).
Cell transfection
Specific short hairpin RNA (shRNA) was designed to repress THBS1 expression by shRNA design tools (http://rnaidesigner.thermofisher.com/rnaiexpress/). Using BLAST (http://blast.ncbi.nlm.nih.gov/Blast.cgi), we verified that the designed shRNA targeted only the THBS1. Lentiviral-delivered specific sh-Con and sh-THBS1 plasmids were packaged by Hanbio (Shanghai, China). The sequences of miR-Con (5’-CGUUGUAUAUGGUCCUGCGCGG-3’) and miR-338-3p (5’-UCCAGCAUCAGUGAUUUUGUUG-3’) were synthesized by RiboBio (Guangzhou, China). The wild-type (WT) or mutant-type (Mut) 3’-UTR of THBS1 was inserted into the multiple cloning sites of the luciferase-expressing pMIR-REPORT vector (Ambion; Thermo Fisher Scientific, Inc., Waltham, MA, USA). All of the vectors were transfected into podocytes using Lipofectamine 2000 (Invitrogen) according to the manufacturer’s protocols.
TUNEL staining
The TUNEL staining kit was purchased from Beyotime Institute of Biotechnology. After transfection with miR-338-3p mimics or corresponding control (miR-Con or sh-Con), TUNEL positive staining cells were measured using a fluorescence microscope (Olympus, Japan).
Migration and invasion assays
BGC-823-OR and MGC-803-OR cells were resuspended in 5% FBS medium to achieve a density of 1 × 10⁶ cells/ml. 100 µl cell suspension medium with 5% FBS was added to the upper chamber, and 600 µl of complete medium was added to the bottom chamber and incubated at 37°C with 5% CO2. For migration assays, the cells on the upper surface of the membrane were removed with cotton swabs, and the cells on the lower surface were the migrated cells. After being fixed with 4% paraformaldehyde and stained with 0.1% crystal violet solution, the cells that passed through the filter were photographed by an inverted fluorescence microscope (Leica Microsystems GmbH, Wetzlar, Germany). The transwell invasion assay was carried out as described above and as described previously [20].
Serum THBS1
The levels of THBS1 in serum of HC and GC patients were assayed using a double antibody sandwich ELISA (Elabscience Biotechnology Co., Ltd, Wuhan, China) following the manufacturer’s instructions and evaluated using an ELISA reader (MD SpectraMax M5; Molecular Devices, LLC, Sunnyvale, CA, USA).
Immunohistochemical (IHC) staining and Western blotting
The protocol of IHC staining and western blotting was consulted as previously described [21, 22]. The primary antibodies of THBS1 (cat. no: sc-59887; dilution: 1 : 100 for IHC staining; dilution: 1 : 1,000 for western blotting) were purchased from Santa Cruz Biotechnology, Inc. (Dallas, TX, USA). Horseradish peroxidase-conjugated secondary antibody (cat. no: sc-516102; dilution: 1 : 20,000) was obtained from Santa Cruz Biotechnology, Inc. (Dallas, TX, USA). Protein bands were visualized using an enhanced chemiluminescence kit (Thermo Fisher Scientific, Inc.). Signals were analyzed with Quantity One software version 4.5 (Bio Rad Laboratories, Inc., Hercules, CA, USA). Anti-β-actin (cat. no. sc-130065; dilution: 1 : 2,000; Santa Cruz Biotechnology) was used as the control antibody. THBS1 positive staining was evaluated using the average value of integral optical density in five fields with image Pro-Plus 6 software (Media Cybernetics, Inc., Rockville, MD, USA).
Luciferase reporter assay
BGC-823-OR and MGC-803-OR cells were seeded into 24 wells and co-transfected with luciferase reporter vectors containing WT or Mut 3’-UTR (0.5 µg) of THBS1, and miR-Con or miR-338-3P (100 nM) using Lipofectamine 2000 (Invitrogen; Thermo Fisher Scientific, Inc.) at 37°C for 48 h. Luciferase activity was measured using a dual-luciferase reporter assay kit (Beyotime Institute of Biotechnology), according to the manufacturer’s protocol.
Statistical analysis
Data were presented as the mean ± standard error. Statistical analysis was calculated using GraphPad Prism Version 7.0 (GraphPad Software, Inc., La Jolla, CA, USA). Two-group differences were analyzed using Student’s t-test. Inter-group differences were analyzed by one-way analysis of variance, followed by a post-hoc Tukey test. P < 0.05 represents a statistically significant difference.
Results
The expression of miR-338-3p is down-regulated in GC tissues and cell lines with OR
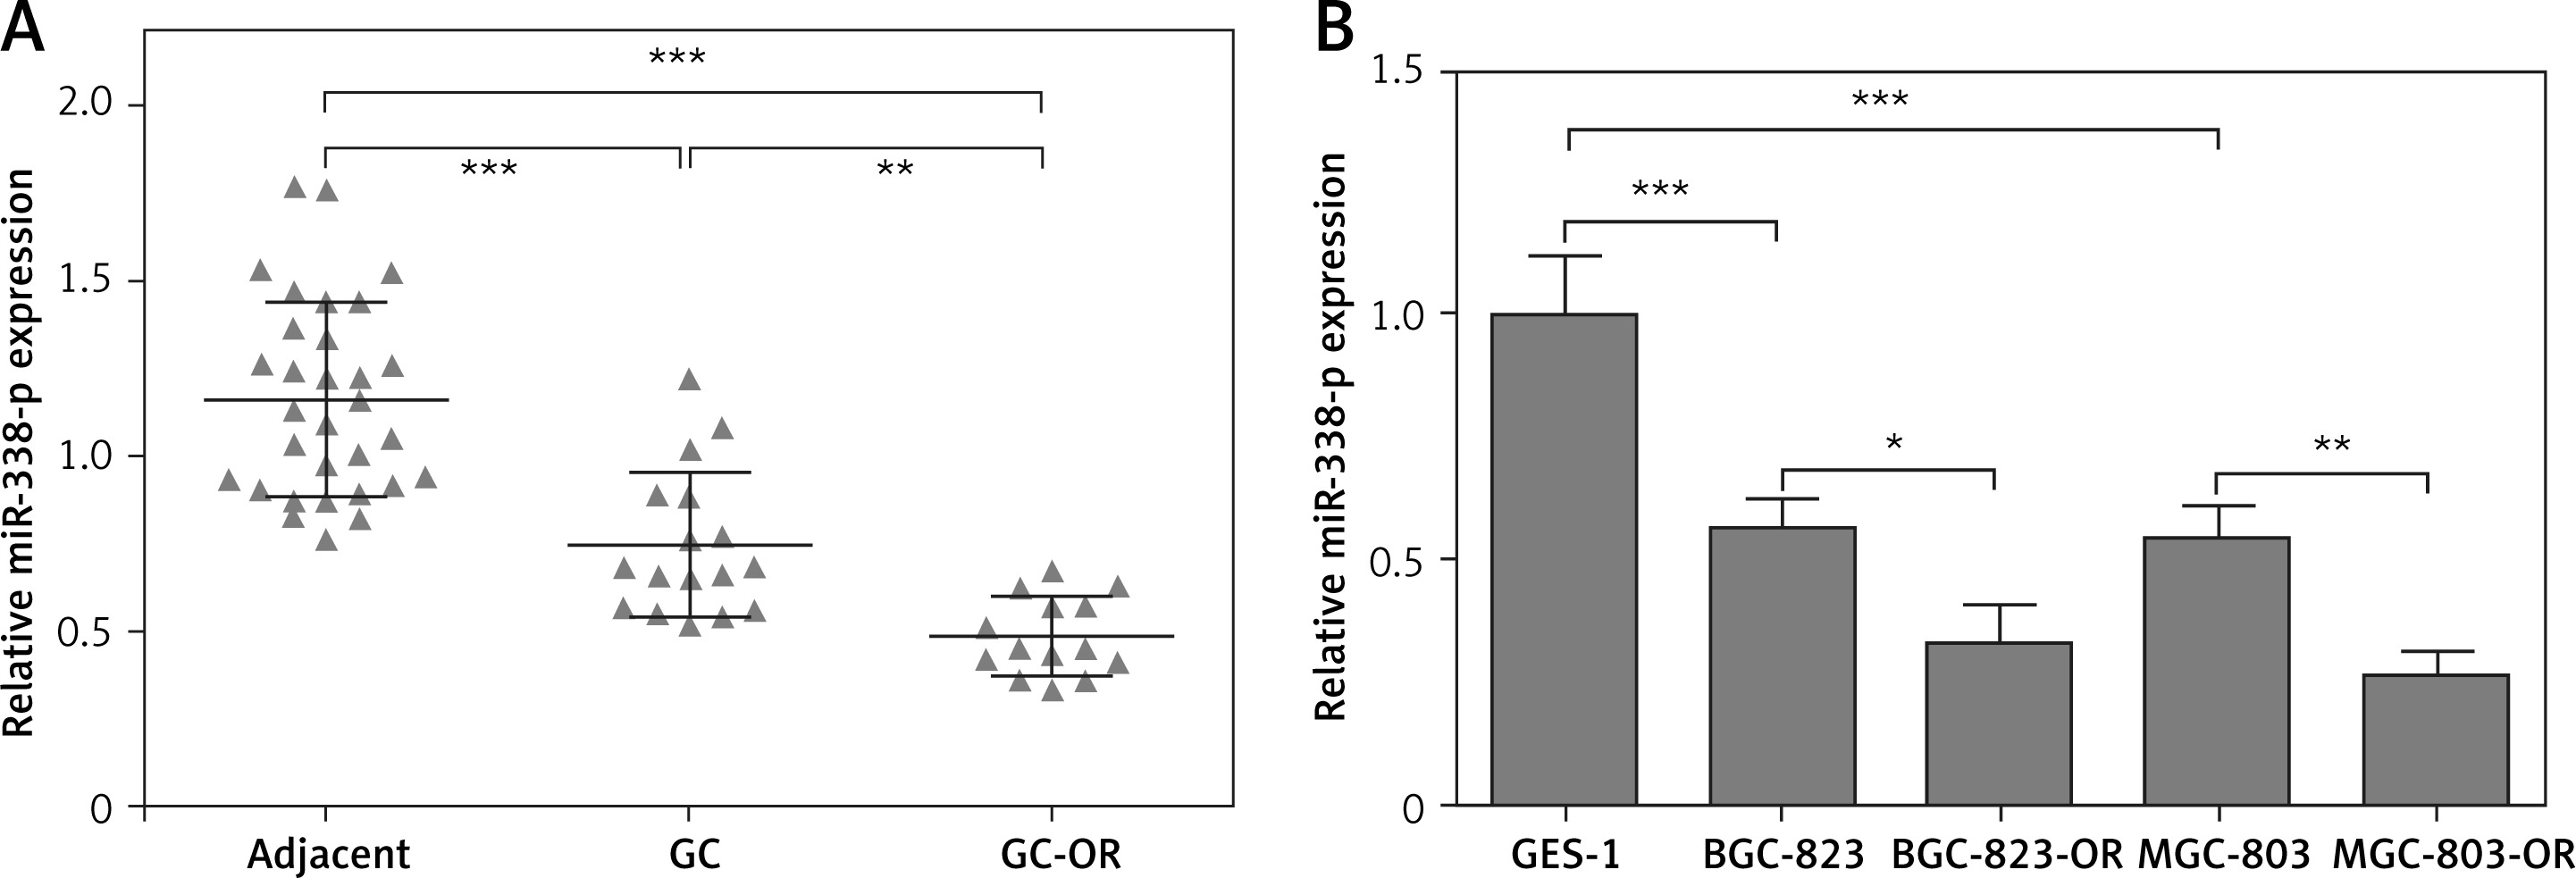
Compared with adjacent non-tumor tissues or normal human gastric mucosal epithelial cells (GES-1), miR-338-3p was abnormally low in GC tumor tissues or BGC-823 and MGC-803 cells (Figures 1 A, B). Intriguingly, OR was associated with a significant decrease in miR-338-3p expression level in GC tumor tissues and cell lines (Figures 1 A, B).
Figure 1
Expression of miR-338-3p is down-regulated in GC tissues and cell lines with OR. Expression of miR-338- 3p is detected using RT-qPCR in adjacent non-tumor tissues (n = 31) and GC tissues from GC patients with (n = 14) or without (n = 17) OR (A). Expression of miR-338-3p is detected using RT-qPCR in human gastric mucosal epithelial cell line GES-1, BGC-823, BGC-823-OR, MGC-803 and MGC-803-OR cells (B; n = 3 in each group)
*P < 0.05, **p < 0.01; ***p < 0.001. GC – gastric cancer, OR – oxaliplatin resistance.
Overexpression of miR-338-3p reverses OR in BGC-823-OR and MGC-803-OR strains
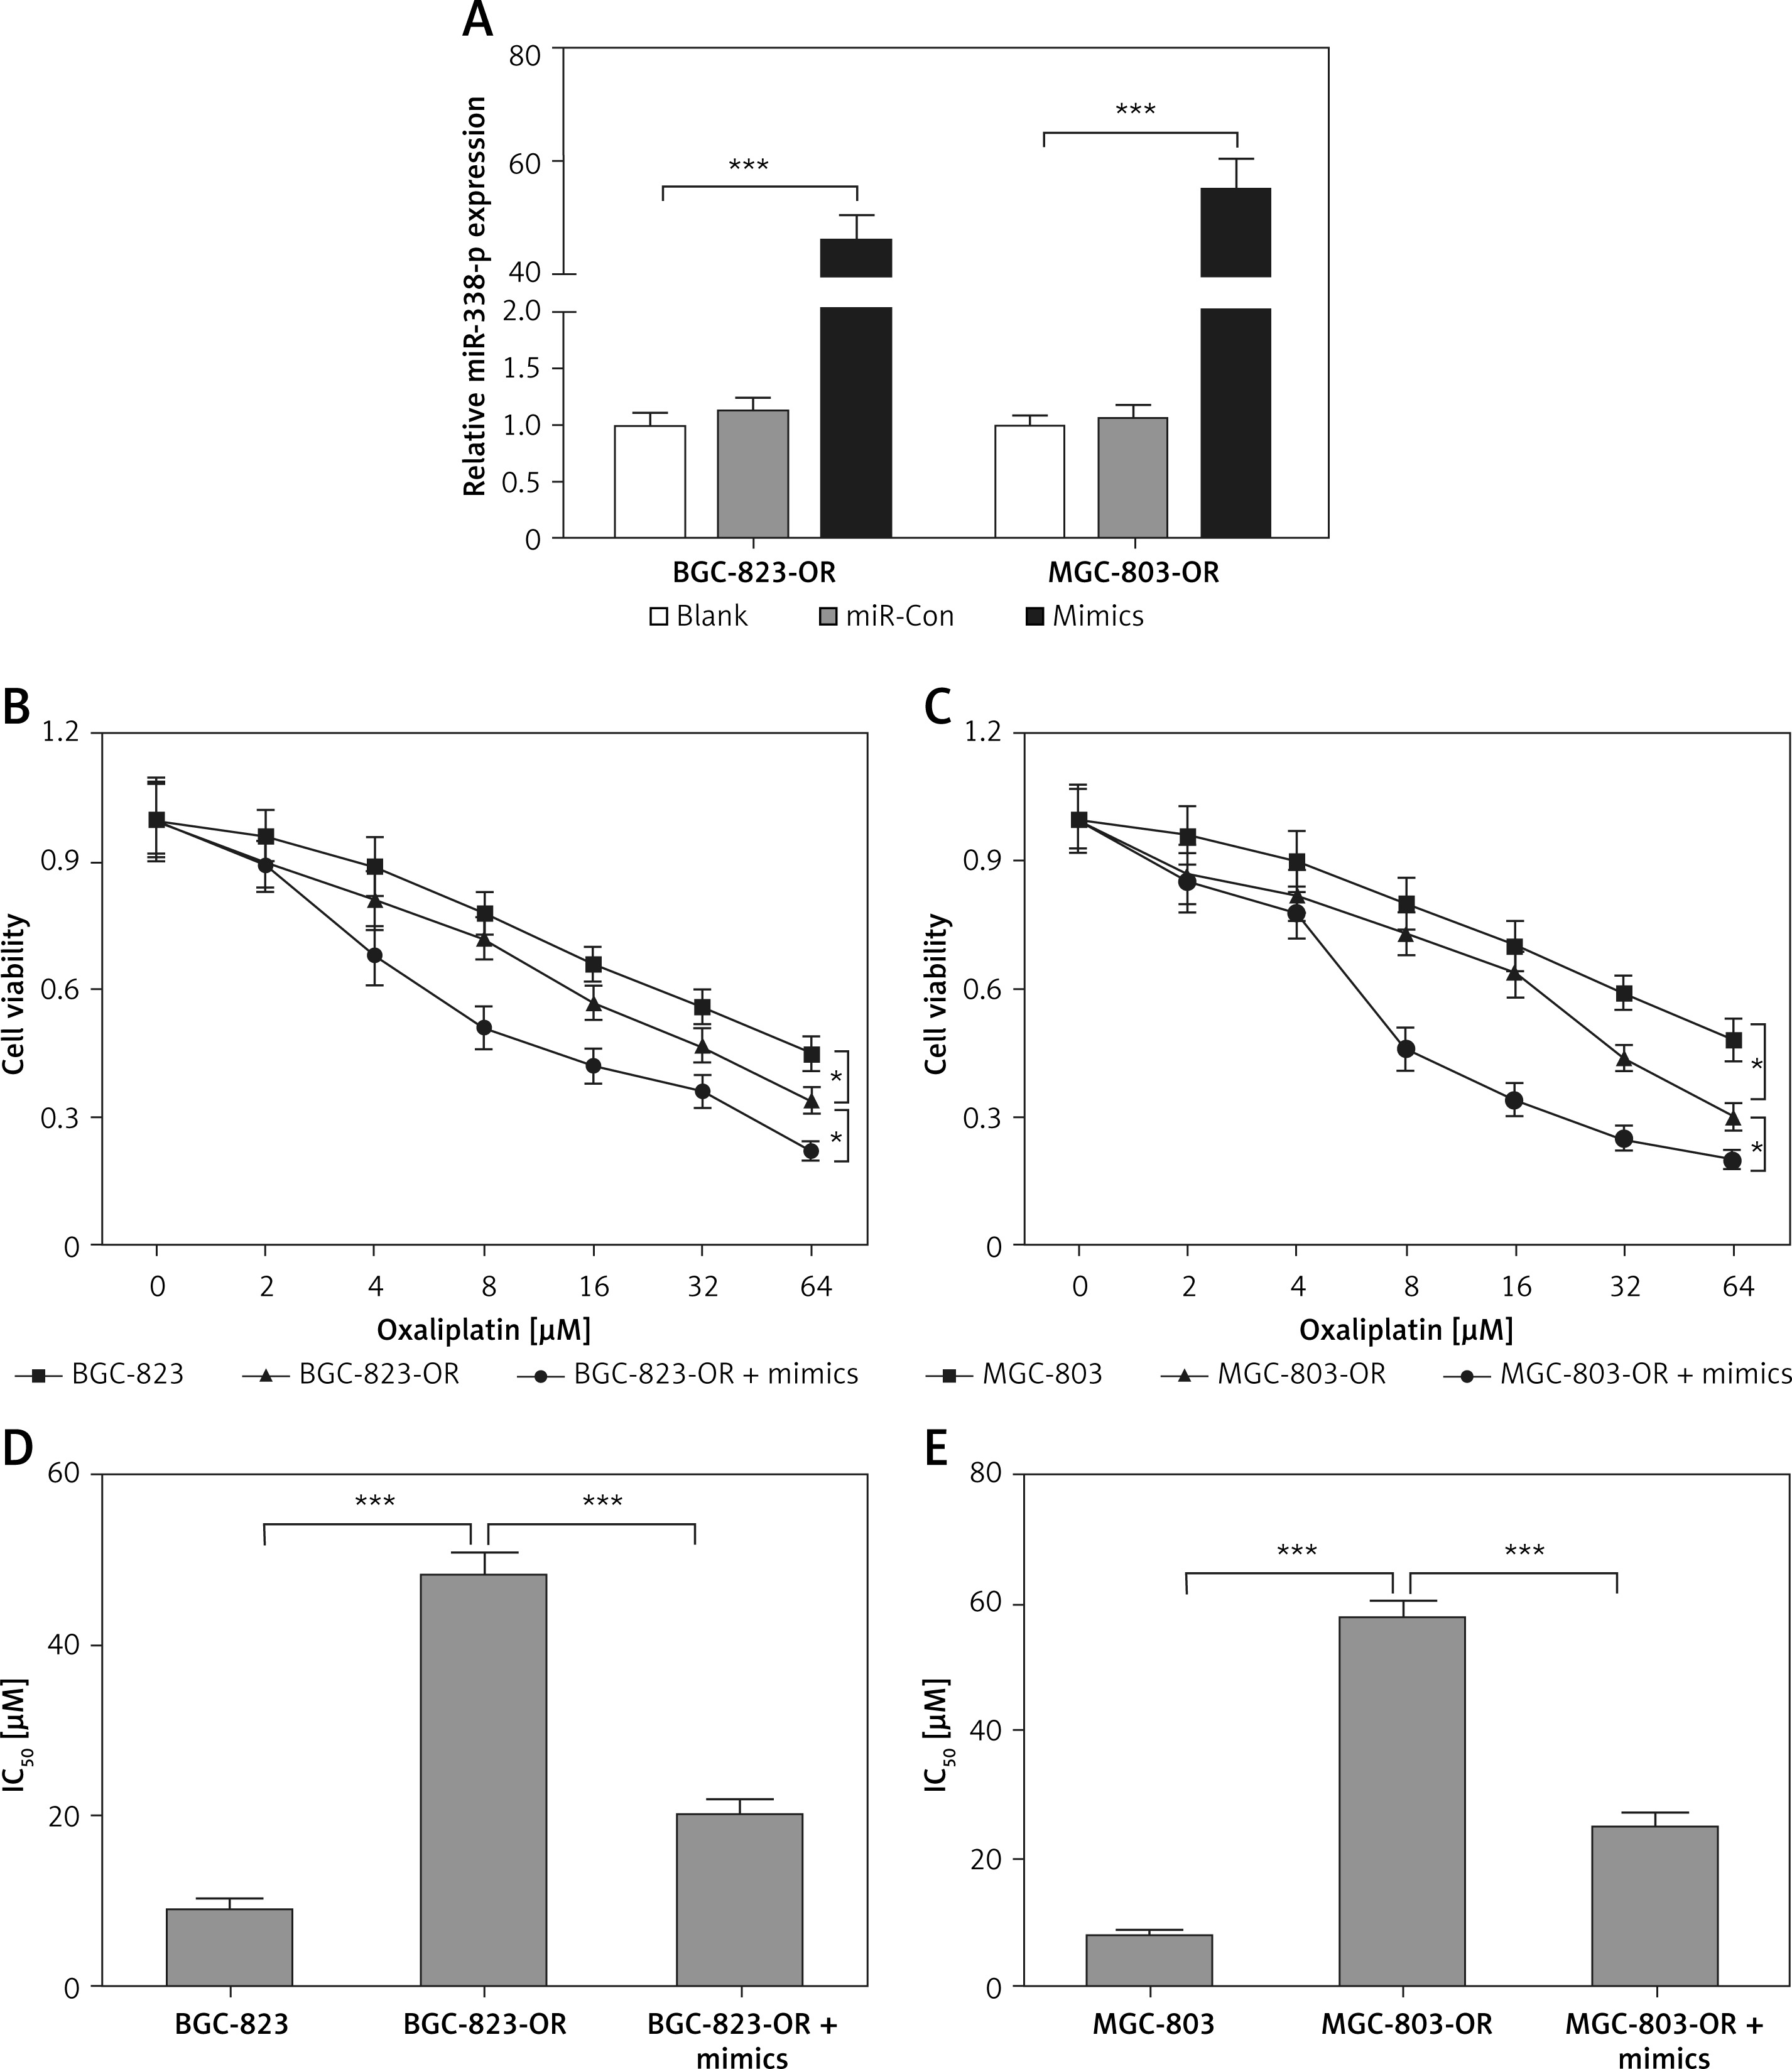
To expound the function of miR-338-3p on OR, we transfected miR-338-3p mimics into BGC-823-OR and MGC-803-OR cells. The results of qRT-PCR showed that miR-338-3p expression levels were significantly elevated in BGC-823-OR and MGC-803-OR cells after miR-338-3p mimic transfection compared with the blank control group (Figure 2 A). CCK-8 assay exhibited significantly lower sensitivity of BGC-823-OR and MGC-803-OR cells to oxaliplatin than their corresponding parental cells (Figures 2 B, C). However, transfection with miR-338-3p mimics into BGC-823-OR and MGC-803-OR cells markedly enhanced the sensitivity to oxaliplatin (Figures 2 B, C). In BGC-823-OR and MGC-803-OR cells (Figures 2 D, E), the IC50 value of oxaliplatin was increased approximately 5.32- and 7.23-fold, respectively. However, miR-338-3p mimic transfection led to a significant reduction of the IC50 value by about 58.1% or 56.5% in BGC-823-OR or MGC-803-OR cells, respectively.
Figure 2
Overexpression of miR-338-3p reverses OR in BGC-823-OR and MGC-803-OR strains. After transfection with miR-Con or miR-338-3p mimics into BGC-823-OR and MGC-803-OR cells for 48 h, the expression of miR-338- 3p is detected using RT-qPCR (A). Cell viability (B and C) and IC50 (D and E) value of BGC-823, BGC-823-OR, MGC-803 and MGC-803-OR cells in response to oxaliplatin stimulation are evaluated using CCK-8
*P < 0.05; ***p < 0.001. OR – oxaliplatin resistance, CCK-8 – cell counting kit-8.
Overexpression of miR-338-3p accelerates apoptosis and suppresses migration and invasion in BGC-823-OR and MGC-803-OR strains
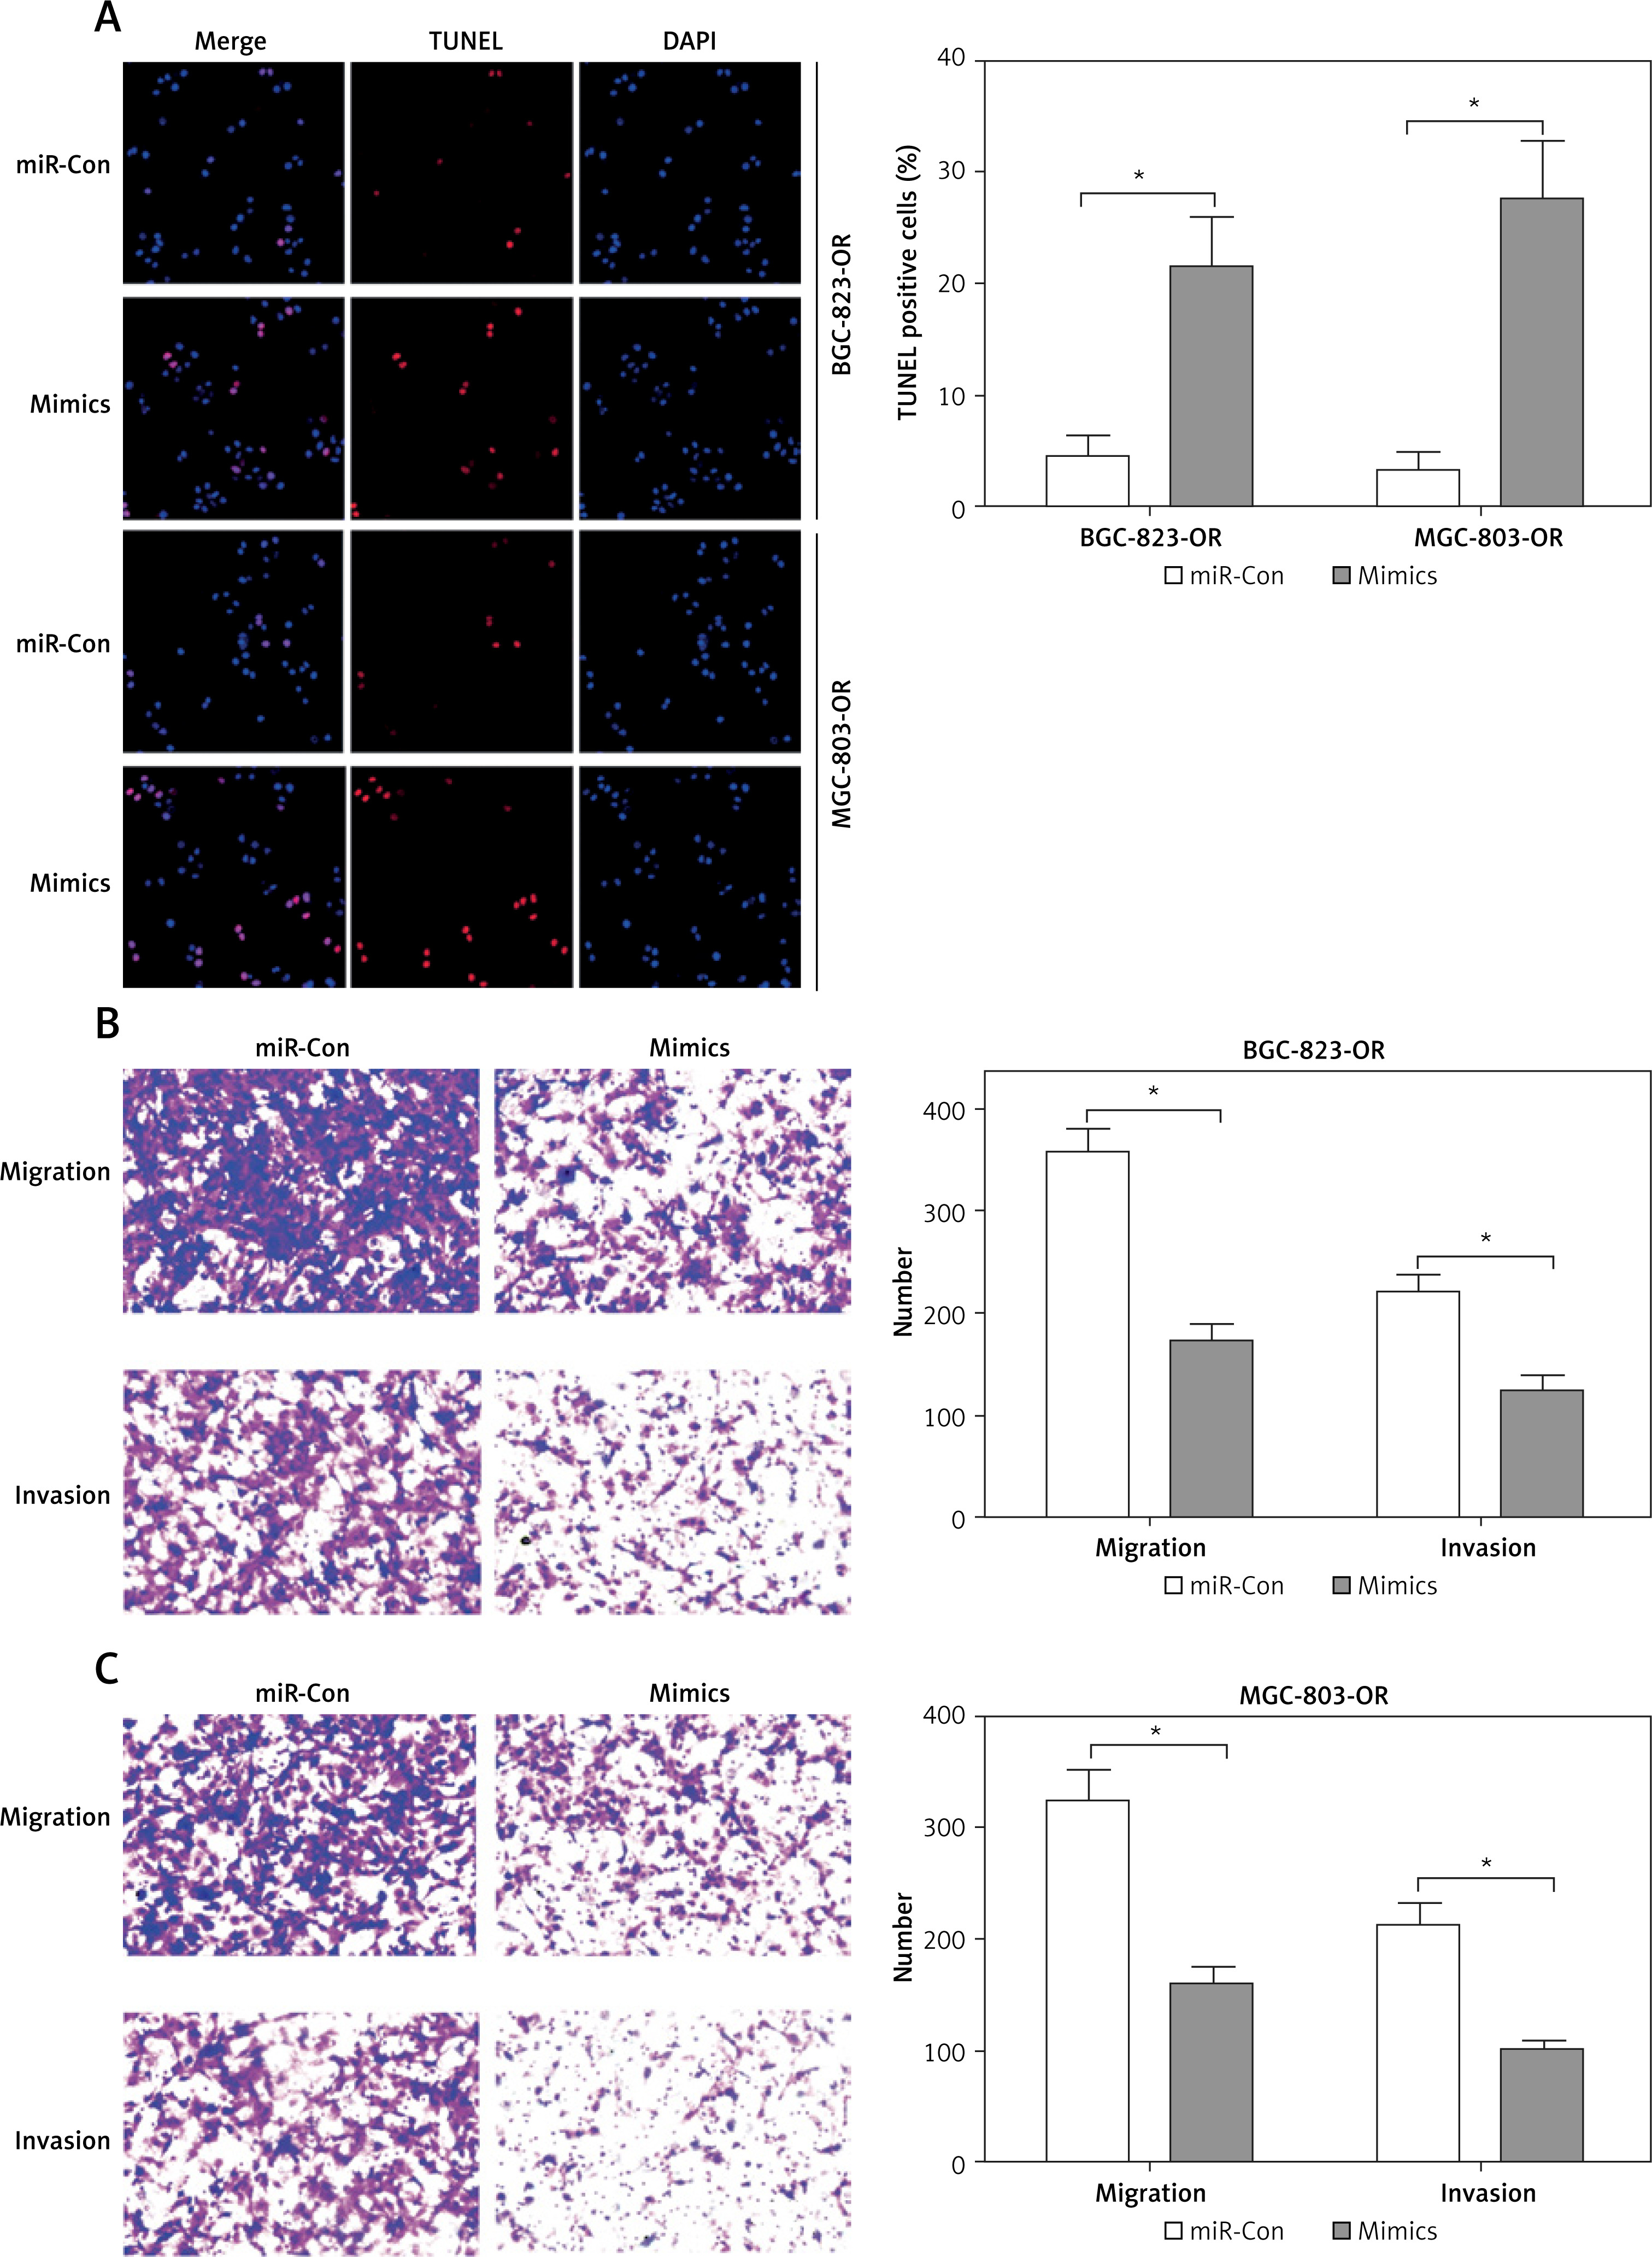
As shown in Figure 3 A, transfection with miR-338-3p mimics increased TUNEL positive staining cells of BGC-823-OR and MGC-803-OR strains. In addition, migration and invasion rates were inhibited by approximately 51.4% and 43.4% in BGC-823-OR cells, and 50.9% and 52.3% in MGC-803-OR cells (Figures 3 B, C).
Figure 3
Overexpression of miR-338-3p accelerates apoptosis and suppresses migration and invasion in BGC-823- OR and MGC-803-OR strains. After transfection with miR-Con or miR-338-3p mimics into BGC-823-OR and MGC- 803-OR cells, cell apoptosis is performed using TUNEL staining (A); migration and invasion of BGC-823-OR (B) or MGC-803-OR (C) cells are analyzed using transwell assays
*P < 0.05. OR, oxaliplatin resistance; TUNEL, terminal-deoxynucleotidyl transferase mediated nick end labeling. n = 3 in each group.
THBS1 is up-regulated in GC tissues and cell lines with OR
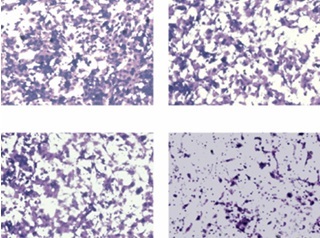
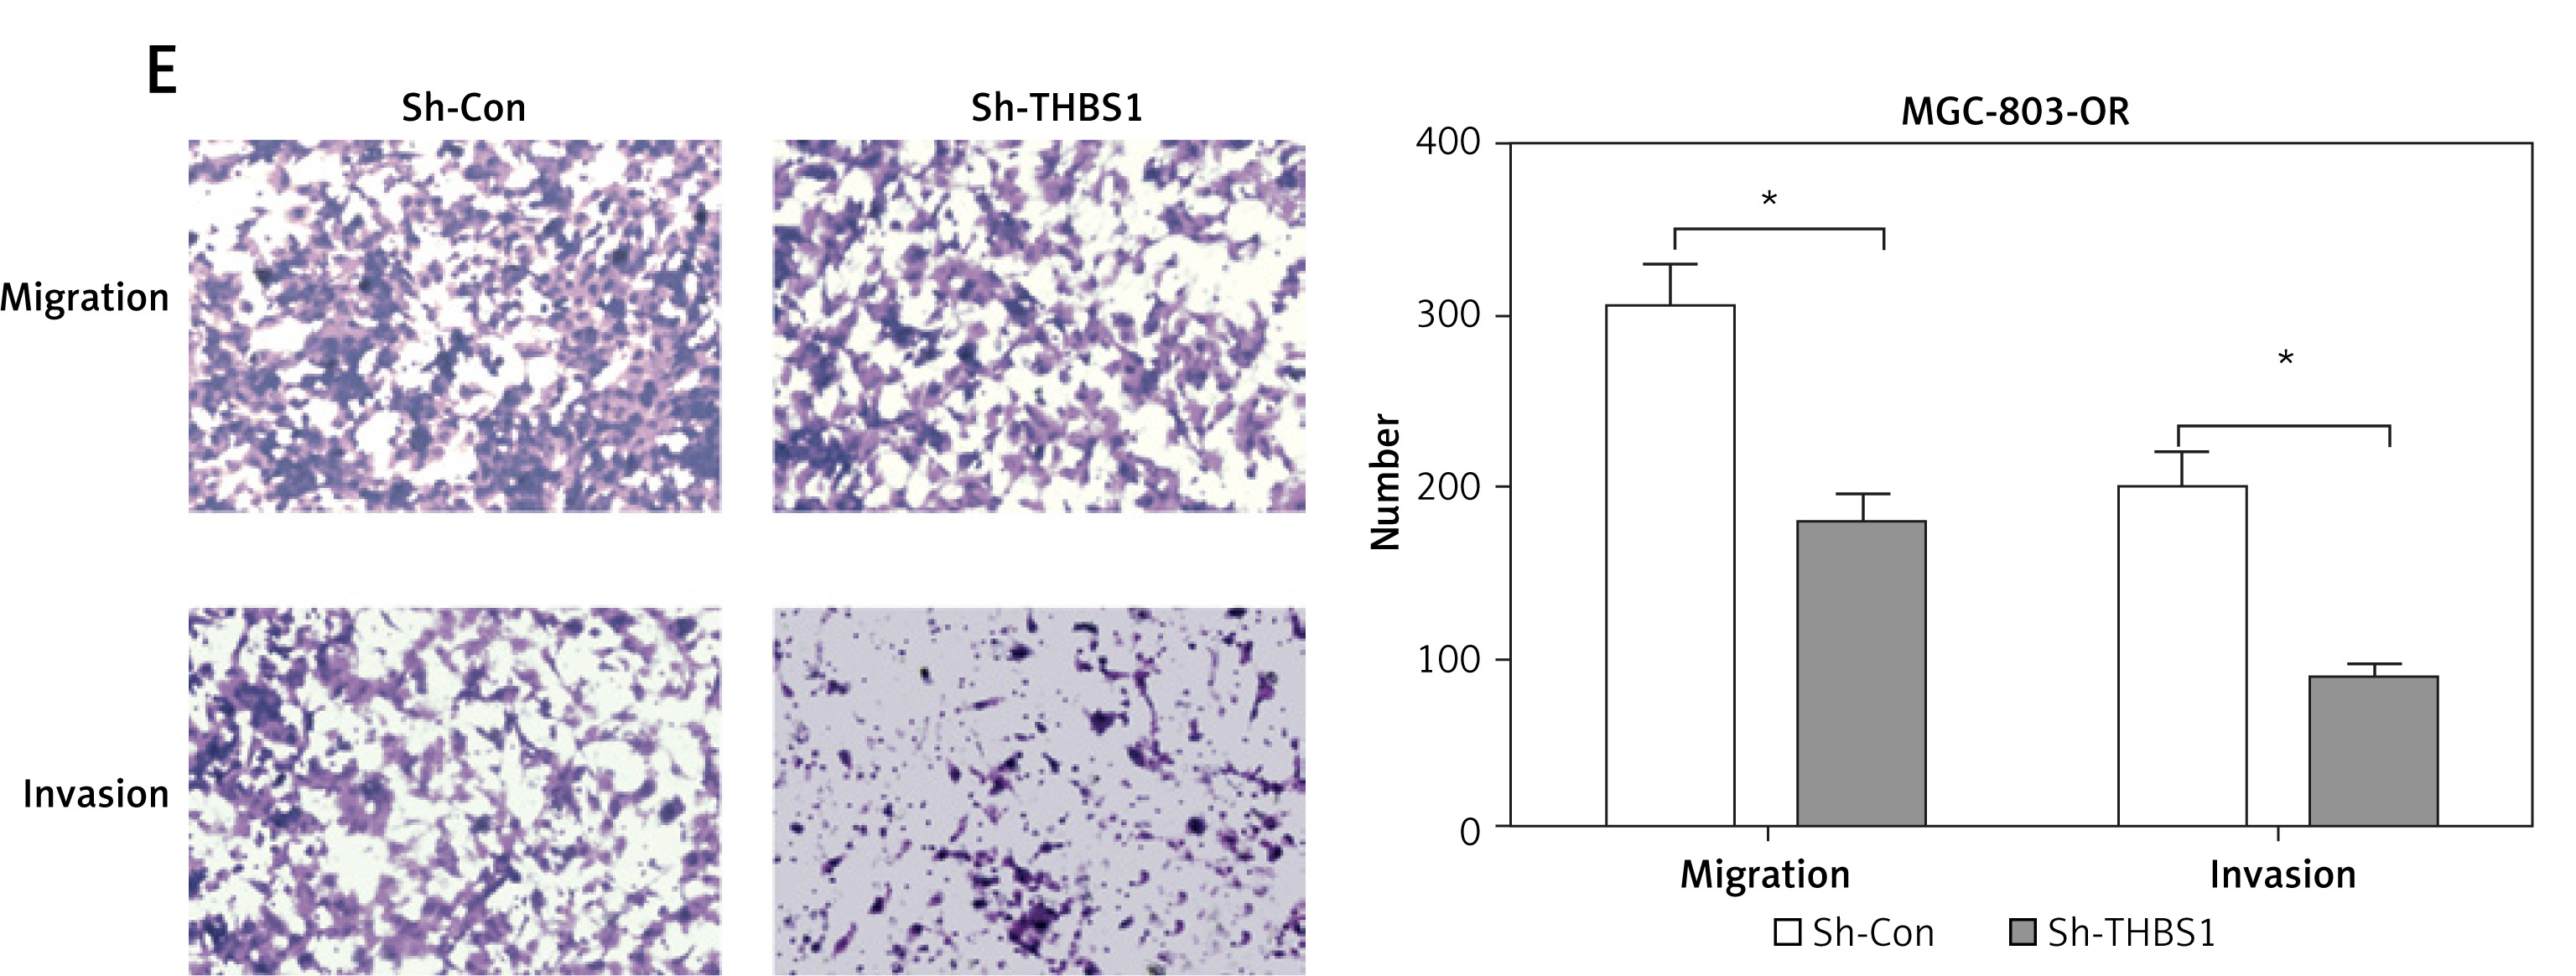
The previous study corroborates that THBS1 was up-regulated in GC tissues and associated with GC cell migration and invasion [8]. However, the role of THBS1 in GC with OR is ambiguous. Of note, the serum THBS1 level was significantly increased in GC patients compared with healthy subjects. In GC patients with OR, THBS1 level showed a further increase in serum (Figure 4 A), suggesting that the up-regulation of THBS1 might be associated with OR in GC. Interestingly, the trend of THBS1 protein expression was gradually elevated in GC tissues (Figure 4 B) and cell lines (Figure 4 C) with the development of OR. Compared with sh-Con transfection, sh-THBS1 transfection was able to inhibit migration and invasion in BGC-823-OR (Figure 4 D) and MGC-803-OR (Figure 4 E) strains.
Figure 4
THBS1 is up-regulated in GC tissues and cell lines with OR. Serum THBS1 in HC and GC patients with or without OR is measured using ELISA before surgery (A). Protein expression of THBS1 is detected using western blotting in adjacent non-tumor tissues and GC tissues from GC patients with or without OR (B; n = 4 in each group). Protein expression of THBS1 is detected using western blotting in human gastric mucosal epithelial cell line GES-1, BGC-823, BGC-823-OR, MGC-803 and MGC-803-OR cells (C; n = 3 in each group). After transfection with sh-Con or sh-THBS1 into BGC-823-OR (D) or MGC-803-OR (E) cells, cell migration and invasion are analyzed using transwell assays After transfection with sh-Con or sh-THBS1 into BGC-823-OR (D) or MGC-803-OR (E) cells, cell migration and invasion are analyzed using transwell assays
*P < 0.05; **p < 0.01; ***p < 0.001. HC – healthy control, GC – gastric cancer, OR – oxaliplatin resistance.
THBS1 is a direct target of miR-338-3p
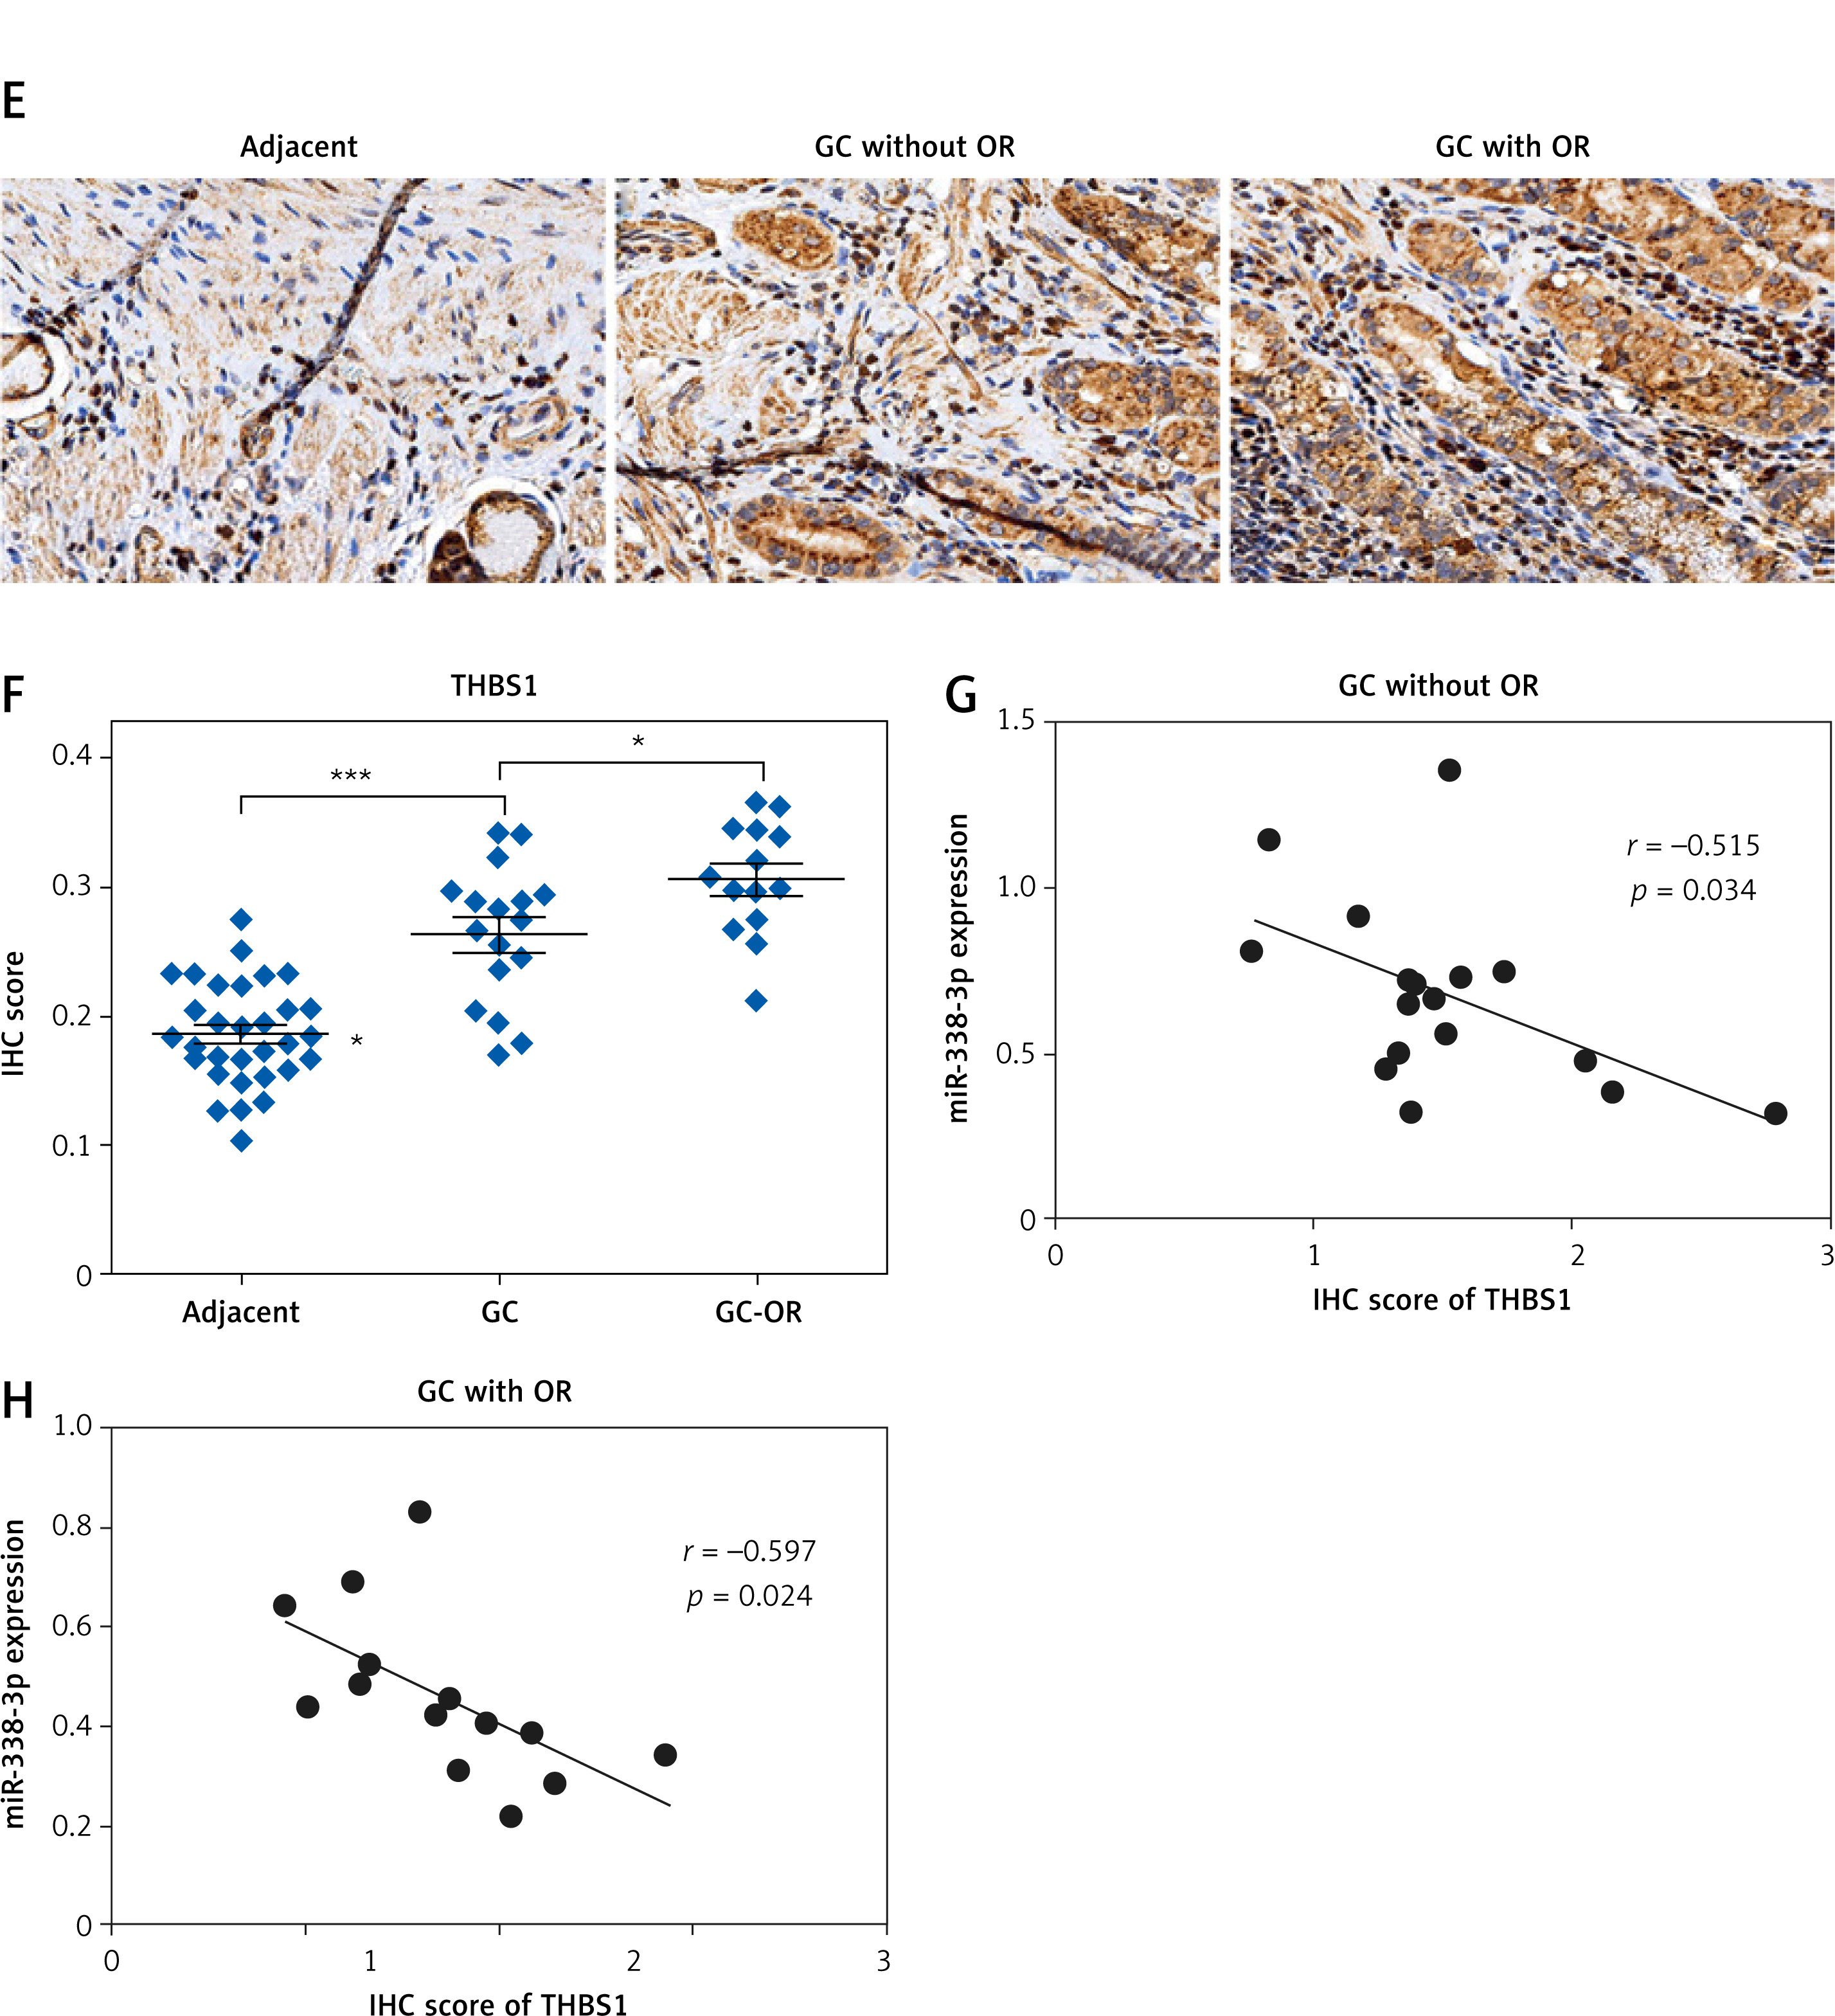
Based on the above findings, we summarized that THBS1 loss-of-function and miR-338-3p overexpression exhibited the same function to inhibit migration and invasion of BGC-823-OR and MGC-803-OR cells. To determine the association between miR-338-3p and THBS1, bioinformatics algorithms and luciferase reporter assays were performed to validate this hypothesis that THBS1 might be a potential target of miR-338-3p. As shown in Figure 5 A, TargetScan (www.targetscan.org) on-line prediction software presented the putative binding sites between miR-338-3p and the 3’-UTR of THBS1. To determine whether miR-338-3p targeted c via binding with its 3’-UTR, the putative miR-338-3p binding sequence with the 3’-UTR of THBS1 was scheduled as WT 3’-UTR of THBS1 and cloned into the luciferase reporter plasmid, and a Mut 3’-UTR of THBS1 was cloned as shown in Figure 5 A. After transfection with miR-Con or miR-338-3p mimics combined with WT or Mut 3’-UTR of THBS1 into BGC-823-OR and MGC-803-OR cells for 48 h, the luciferase activity was significantly reduced after transfection with miR-338-3p mimics into BGC-823-OR and MGC-803-OR cells containing WT 3’-UTR of THBS1, while the luciferase activity in BGC-823-OR and MGC-803-OR cells containing Mut 3’-UTR of THBS1 had no obvious change after miR-Con or miR-338-3p mimic transfection (Figure 5 B). These findings indicated that THBS1 was a direct target of miR-338-3p. Compared with miR-Con transfection, miR-338-3p mimic transfection significantly reduced the protein expression of THBS1 in BGC-823-OR and MGC-803-OR cells (Figure 5 C). In GC tissues, miR-338-3p expression levels were negatively correlated with THBS1-positive staining levels (r = –0.546; p = 0.002; Figure 5 D). IHC staining revealed that THBS1 was weakly expressed in non-neoplastic gastric tissues, while THBS1 was intensely expressed in GC tissues with or without OR. Intriguingly, GC tissues with OR exhibited significant up-regulation of THBS1 expression compared with those of in GC tissues without OR (Figures 5 E, F), suggesting that elevation of THBS1 expression in GC tissues might be associated with OR. As shown in Figures 5 G and H, a significant negative correlation between miR-338-3p and THBS1 expression was observed in GC tissues without OR (r = –0.515; p = 0.034) or with OR (r = –0.597; p = 0.024).
Figure 5
THBS1 is a direct target of miR-338-3p. TargetScan (www.targetscan.org) on-line prediction software presents the putative binding sites between miR-338-3p and the 3’-UTR of THBS1 (A). After transfection with miRCon or miR-338-3p mimics combined with WT or Mut 3’-UTR of THBS1 into BGC-823-OR and MGC-803-OR cells for 48 h, the luciferase activity was measured (B). After transfection with miR-Con or miR-338-3p mimics into BGC- 823-OR and MGC-803-OR cells for 48 h, the protein expression of THBS1 is detected using western blotting (C). *P < 0.05; n = 3 in each group. Spearman’s rank analysis was used to identify the correlation between the expression levels of miR-338-3p and THBS1 in 31 GC specimens (D) IHC staining was used to evaluate THBS1 positive staining in adjacent non-tumor tissues and GC tissues with or without OR (E and F). Spearman’s rank analysis was used to identify the correlation between the expression levels of miR- 338-3p and THBS1 in GC without OR (G) or GC with OR (H)
3’-UTR – 3’-untranslated regions, WT – wild-type, Mut – mutant-type, OR – oxaliplatin resistance, IHC – immunohistochemical.
Discussion
Down-regulation of miR-338-3p is observed in several cancers, including prostate cancer, ovarian cancer and hepatocellular carcinoma [23–25]. Moreover, miR-338-3p is widely reported as a tumor suppressor in GC via targeting multiple genes, including protein-tyrosine phosphatase 1B [17], zinc finger E-box-binding protein 2 [26] and synovial sarcoma family member 2 interacting protein [27]. The aim of the present study was to investigate whether miR-338-3p was implicated in the OR of GC cells. Previous studies have highlighted that abnormal miR expression levels are associated with chemoresistance in human cancers, including GC [28, 29]. miR-338-3p is reported to enhance ovarian cancer cell sensitivity to cisplatin by downregulating Wnt family member 2B [30]. In our study, down-regulation of miR-338-3p expression was observed in GC tissues and cell lines with OR, indicating that miR-338-3p had a close association with OR in GC. Overexpression of miR-338-3p restored the sensitivity of BGC-823-OR and MGC-803-OR cells to oxaliplatin treatment. Our findings also revealed that transfection with miR-338-3p mimics could accelerate cell apoptosis and block cell migration and invasion of BGC-823-OR and MGC-803-OR cells. Therefore, these results concluded that miR-338-3p participated in the progression of OR in GC, enhancing the sensitivity of BGC-823-OR and MGC-803-OR cells towards oxaliplatin.
THBS1 has been recognized as a “tumor suppressor” based on its anti-angiogenic activity [31]. In fact, the biological activities and pathological roles of THBS1 in the initiation and progression of malignant tumors are complex and controversial [31]. For example, although THBS1 exacerbates an aggressive phenotype in human melanoma and pancreatic cancer [32, 33], it functions as a tumor suppressor in lung adenocarcinoma and urothelial carcinoma [34, 35]. Accumulating evidence indicates that the up-regulation of THBS1 is associated with cancer cell migration and invasion, including GC [8]. Recently, THBS1 was proposed as a therapeutic target for improving chemosensitivity in malignancy [32]. Up-regulation of THBS1 expression levels are observed in vemurafenib resistant melanoma cells, and THBS1 silencing leads to a significant increase in the sensitivity of melanoma cells to vemurafenib treatment [32]. In contrast to that, the expression level of THBS1 is positively correlated with oxaliplatin sensitivity in SGC-7901 cells [11, 12]. Inversely, our results indicated that THBS1 protein expression levels were significantly up-regulated in both GC tissues and cell lines with OR as compared to the corresponding normal control of GC tissues and cell lines without OR. The up-regulation of THBS1 protein expression was inversely correlated with OR in GC patients and cell lines.
A major finding of the present study was that miR-338-3p directly targeted THBS1 in BGC-823-OR and MGC-803-OR cells, which was validated by bioinformatics algorithms and luciferase reporter assay. Strikingly, miR-338-3p overexpression significantly reduced THBS1 protein expression in BGC-823-OR and MGC-803-OR cells. In vitro experimental measurements revealed an almost opposite effect between miR-338-3p and THBS1 on migration and invasion of BGC-823-OR and MGC-803-OR cells. Mechanically, THBS1, as a tumor-specific extracellular matrix protein, stimulates the expression of matrix metalloproteinases to shield the migration and invasion of oral squamous cell carcinoma [36]. Therefore, we deduced that miR-338-3p might mitigate OR and inhibit migration and invasion of BGC-823-OR and MGC-803-OR cells via repression of THBS1.
In conclusion, our findings suggest that overexpression of miR-338-3p can reverse the resistance of GC cells to oxaliplatin treatment and inhibit the aggressiveness of BGC-823-OR and MGC-803-OR cells, and the underlying molecular mechanism is mediated, at least partially, through post-transcriptional repression of THBS1.

