Introduction
Nonalcoholic fatty liver disease (NAFLD) is reported to be associated with epigenetic DNA methylation and nutritional status [1]. In adult mammals, 70% of DNA methylation happens in the CpG sites, while nearly 70–80% of CpGs genomes are methylated in humans [2]. DNA methylation mainly regulates gene expression through affecting the binding rates of genes and transcription factors [3]. One of the most important ways to inhibit gene expression is the dynamic methylation of CpG islands in the promoter as well as its nearby regions [4, 5]. More than 1/3 of genetic diseases caused by base conversion are attributed to cytidine methylation [6]. de Mello et al. found 1,292 CpG methylations among 677 genes in the NASH population (non-alcoholic steatohepatitis, the second stage of NAFLD) [7]. Based on the analysis for 45,000 CpG loci, Ahrens et al. observed 467 dinucleotides with methylation in non-alcoholic steatohepatitis (NASH) patients in comparison to the non-obese population [8]. Additionally, they found that there were eight genes involved in NAFLD and metabolic disease whose CpG methylation was reversed [8].
In the NAFLD field, rat and mouse are the most common animals used in research, but they have many obvious disadvantages, such as a long modeling period (more than 48 weeks), a large difference in lipid metabolism compared to humans, and a low survival rate [9]. Our research group has been studying hyperlipidemia in a Mongolian gerbil model since 2005, and successfully established an NAFLD model in Mongolian gerbils [10]. NAFLD development in this animal has three distinctive stages (steatosis, steatohepatitis and fibrosis), mimicking the natural pathogenesis in humans. Moreover, the model could be available in a short time (1–12 weeks). Considering these outstanding improvements, the model received the Experimental Animal Science and Technology Achievement Award of China in 2016.
To study the underlying mechanism of NAFLD in Mongolian gerbils, two genes were selected in this research, fatty acid synthase (FASN) and sterol regulatory element-binding protein 1 (SREBP-1), which were crucial to lipid regulation and metabolism. We cloned part of the promoter sequence of both genes, detected the number and frequency of CpGs at specific locations by pyrosequencing and determined the expression by quantitative real-time PCR (qPCR) and western blot (WB) analysis, in order to investigate the potential mechanism from the perspective of epigenetic methylation.
Material and methods
Animal models
All the animals used in the study were male (Key Laboratory of Experimental Animal, Zhejiang Academy of Medical Sciences, China, Certificate No: SCXK (Zhejiang) 2014-0001, SYXK (Zhejiang) 2014-0008). Twenty 3-month-old gerbils (Meriones unguiculatus) of 50–70 g body weight were divided into a control group (n = 10) and an NAFLD model group (n = 10).
In addition, ten 8-month-old gerbils weighing 80–100 g were used as an aged group and ten newborn gerbils were used as an NB group. The NAFLD group was fed with a high-fat diet (7% lard, 2% cholesterol, 0.5% bile salts and 10% yolk powder) while the other two groups were fed with a standard diet. Blood and liver were collected for further detection after 4-week feeding in control and NAFLD groups, while NB and aged groups were harvested at the same time. All the animals were sacrificed by anesthesia with carbon dioxide.
The use of animals in this study complied with all relevant and institutional policies and was approved by the Ethics Committee for Research on Laboratory Animal Use of Zhejiang Academy of Medical Sciences.
Biochemical analysis and HE staining
Serum (except the NB group) was extracted for lipid detection including total cholesterol (TC), triglycerides (TG), high-density lipoprotein (HDL) and low-density lipoprotein (LDL), determined by an automatic chemical analyzer (Autolab PM4000, Italy) with a commercial kit (Diasys Diagnostic Systems, Co. LTD., Shanghai, China) according to the manufacturer’s instructions. One piece of liver tissue from the right lobe was used for the histological examination by HE staining.
Capture of promoter regions in FASN and SREBP
Primers were designed according to the sequences of human, rat and mouse as well as the amplification efficiency, fragment size and specificity. Primers were designed using Primer-blast software, and primer comparison was also performed using Blast in order to reduce the non-specific amplification. Gerbil liver (100 mg) was made into a TEN cell suspension, and then the genomic DNA was extracted with the dissolution in TE buffer solution (pH 8.0) using the magnetic bead method. Next, the purity and concentration of extracted DNA were measured, with the 260/280 ratio > 1.6 indicating good quality. The reaction liquid was diluted into 100 ng/µl with TE buffer solution for the next assay at 4°C. Primers for capturing the promoter regions in FASN and SREBP are listed in Table I. PCR Mix (15 µl) contained 12.5 µl KAPA2G Robust Mix, 1 µl each of forward and reverse primers (10 mM), 1 µl of template DNA and 9.5 µl of ddH2O. The thermal cycling profile for PCR was set up as follows: 94°C for 5 min, 94°C for 30 s, Tm for 30 s, 72°C for 1 min, 72°C for 5 min, followed by heat preservation at 4°C. PCR was performed on the Applied Biosystems 9700 PCR System.
Table I
Primers for capturing the promoter regions in SREBP and FASN. F and R indicate the forward and reverse primer sequence
Detection of CpG islands in the promoter regions of FASN and SREBP
DNA was treated with sulfite conversion for the methylation detection. To each sulfite mixture 800 µl of RNase-free H2O was added. PCR for sulfite conversion was performed in a total volume of 140 µl containing 40 µl of DNA solution (concentration range 1–500 ng/µl), 85 µl of sulfite mixture and 15 µl of DNA protection solution. The PCR program was set up as follows: denaturation at 95°C for 5 min, renaturation at 60°C for 25 min, denaturation at 95°C for 5 min, renaturation at 60°C for 85 min, denaturation at 95°C for 5 min, and renaturation at 60°C for 175 min. Three cycles were performed between the intervals of renaturation. PCR products were kept at 20°C overnight. Next, DNA was purified with disulphonic acid solution using the adsorption column method, followed by elution in elution buffer.
The purified DNA was used directly in the next methylation-specific real-time PCR (MSP) analysis. MSP was performed in a total volume of 50 µl containing 10 µl of 5 × buffer GC (KAPA), 1 µl of dNTP (10 mM/each), 1 µl each of upstream and downstream primers (50 pM/µl), 2 µl of template DNA and 0.2 µl of Taq (5 U/µl). The thermal cycling profile for MSP was set up as follows: 40 cycles of 95°C for 3 min, 94°C for 30 s, 52°C for 30 s, 72°C for 1 min, and a final 7 min at 72°C. Primers for MSP of FASN1 and SREBP1 are listed in Table II.
Table II
Primer sequences for the methylation-specific PCR of FASN and SREBP. F and R indicate the forward and reverse primer sequence, and S indicates the primer sequence of pyrosequencing
Next, mixed beads together with PCR products formed a suspension, being immersed in 70% ethanol, 0.2 M NaOH and flushing buffer to cool to room temperature. Next, the mixture was denatured at 85°C for 2 min, and then the universal primer (cooled to room temperature) for sequencing (S primer) hybridized with the template DNA. Substrate mixture, enzyme mixture and 4 dNTP (QIAGEN) were added successively in the reagent chamber; the dosages were calculated according to the information of sequence design by PyroMark Assay Design software version 2.0. Finally, the reagent chamber together with the 96-hole reacting plate was put into the Pyrosequencing detector (PyroMark Q96 ID, QIAGEN) for the reaction. The methylation status of each site was automatically analyzed using Pyro Q-CpG software.
FASN and SREBP-1 expression
Quantitative real-time PCR (qPCR) was performed on the samples derived from liver tissue. For qPCR analysis, cDNA was synthesized from total RNA by reverse transcription with the RT-reagent Kit and DNA Eraser (TaKaRa Biotech, Kyoto, Japan). Primer synthesis of mRNA was designed using Primer 5.0 and Oli906.0, and β-actin was used as an internal control. qPCR reaction was performed in a total volume of 20 µl containing 10 µl of 2 × fluorescence qPCR Mix, 1 µl each of upstream and downstream primers (10 µM), 1 µl of template DNA and 7 µl of ddH2O. The thermal cycling profile for qPCR was set up as follows: 40 cycles of pre-denaturation at 94°C for 1 min, denaturation at 94°C for 10 s, annealing at 59°C for 10 s, followed by extension at 72°C for 10 s. The results of qPCR were determined with the 2-ΔΔCt method. Primers for qPCR are listed in Table III.
Table III
Primer sequences for qPCR of SREBP-1 and FASN. F and R indicate the forward and reverse primer sequence. F and R indicate the forward and reverse primer sequence
For Western blot, protein lysates from liver were quantified by the BCA kit (Tiangen Biotech Co. Ltd., Beijing, China). 30 µg of protein extracts was separated on 12% SDS-PAGE gels and transferred onto the PVDF membranes. After blocking with 5% non-fat milk, the membranes were incubated with primary antibody of FASN and SREBP-1 (1:500 dilution). Following secondary antibody incubation and PBS washing, the bands were visualized by X-ray exposure. Quantification was performed using the ImageJ software.
Statistical analysis
When applicable, results were presented as means ± standard deviation (SD). Tamhane’s T2 method was used for the comparison of serum lipid level and the paired t-test for gene expression. Correlation between the expression levels of FASN and SREBP and methylation rate were analyzed by Pearson’s correlation test. All statistical analyses were performed using the SPSS software (version 13.0, SPSS Inc. Chicago, IL, USA). A two-sided p < 0.05 was considered to be statistically significant.
Results
Hepatic morphology
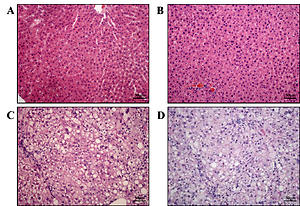
In the gerbil NB group, the structure of the hepatic lobule was clear, the hepatic cord was neatly arranged, and the hematopoietic cells of extramedullary hematopoietic foci were observed in the hepatic sinusoid, in which large numbers of mononuclear cells and red cells were found (Figure 1 A). In the control group, no obvious fat deposition in the abdominal wall of the gerbils was observed; the liver was not obviously changed; it appeared red with sharp edges, clear lobules and plate-like arranged hepatic cords (Figure 1 B). In the NAFLD and aged groups, the liver appeared yellow with blunt edges and a greasy feeling; some of the gerbils were observed to have a swollen spleen, in which the HE staining showed obvious hepatic steatosis, and the NAFLD group had more serious pathomorphology than the aged group, with hepatocyte necrosis and shedding widely distributed (Figures 1 C, D).
Figure 1
Pathology of liver in each group (HE staining × 20). The histopathological modification in each treatment in NB group. The hepatic structure was neatly arranged, and the hematopoietic cells of extramedullary hematopoietic foci were observed in the hepatic sinusoid, in which a large number of mononuclear cells and red cells were found (A). In the control, no obvious fat deposition in the abdominal wall of the gerbils was observed; the liver was not obviously changed; it appeared red with sharp edges, clear lobules and plate-like arranged hepatic cords (B). In the NAFLD and aged groups, the liver appeared yellow with blunt edges and a greasy feeling; some of the gerbils had a swollen spleen, in which the HE staining showed obvious hepatic steatosis (C, D)
Biochemical index
The serum levels of TC, TG, HLD and LDL are given in Table IV. The serum TC level of the gerbil NAFLD group multiplied rapidly to 5.3-fold higher compared to the gerbil control and aged groups, and the serum levels of HDL (6.5-fold) and LDL (4.3-fold) were also significantly increased (p < 0.01). The serum TG level of the gerbil aged group was significantly higher than that of the gerbil control and NAFLD groups (5-fold, p < 0.01). It indicates to some extent that the two types of fatty liver models are in different stages of NAFLD, or different types of hyperlipidemia.
Sequences in the promoter regions of FASN and SREBP
Two long fragments in the promoter regions of FASN and SREBP were captured. The sequences of the promoter regions of FASN and SREBP genes referred to the attached sequence data (Supplementary Table SI).
Number of CpG island in the gerbil liver
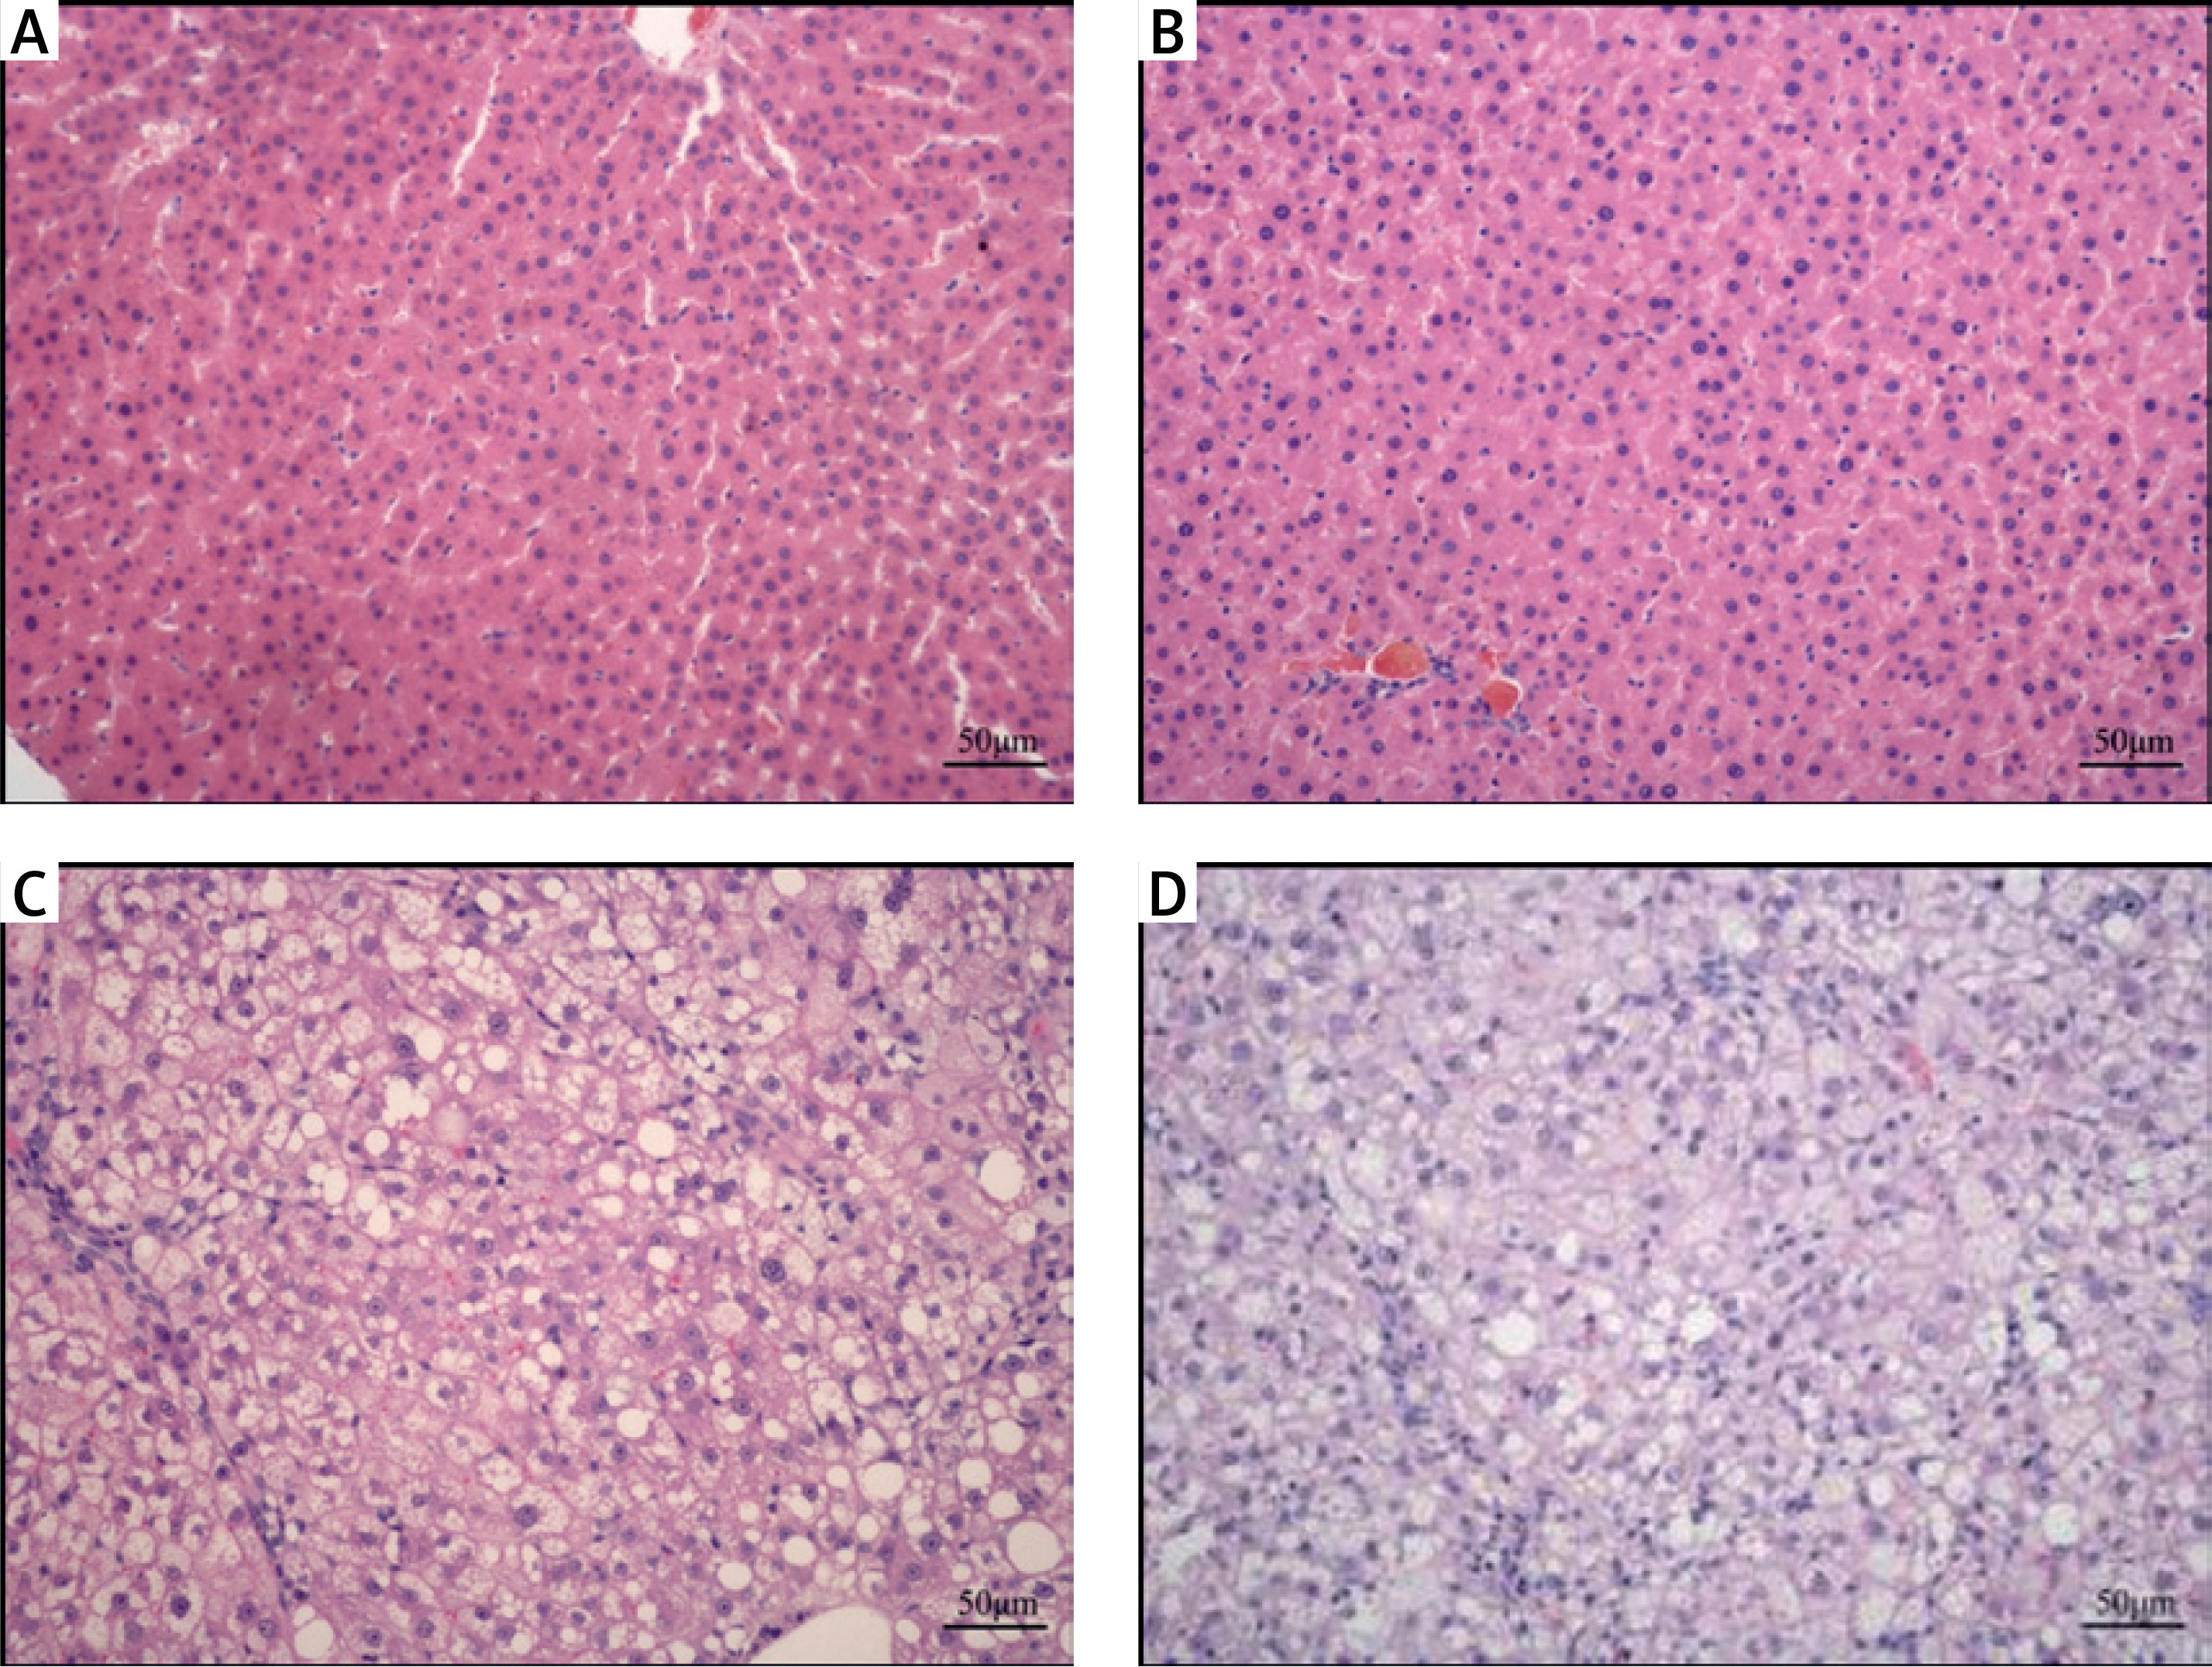
The methylation levels showed dramatic differences in different regions of the same promoter region of genes. For the FASN gene, the methylation rate was highest in the gerbil control group, followed by the gerbil NAFLD and aged group (p < 0.05). For the SREBP gene, the methylation rate was also highest in the gerbil control group, yet followed by the gerbil aged and NAFLD group (p < 0.05). The results above indicated that methylation levels of FASN and SREBP gradually decreased in NAFLD with the supplementation of a high-fat diet (except the gerbil NB group), which was closely associated with hyperlipidemia and NAFLD (Figures 2, 3).
Figure 2
Detection results of CpG island in the promoter region of FASN (A) and SREBP1 (B). The CpG sites were measured using pyrosequencing, and the “methylation%” was the average of “%” of each CpG site measured. The Figure presents the results of the methylation rate of samples A4, A5, E1, E2
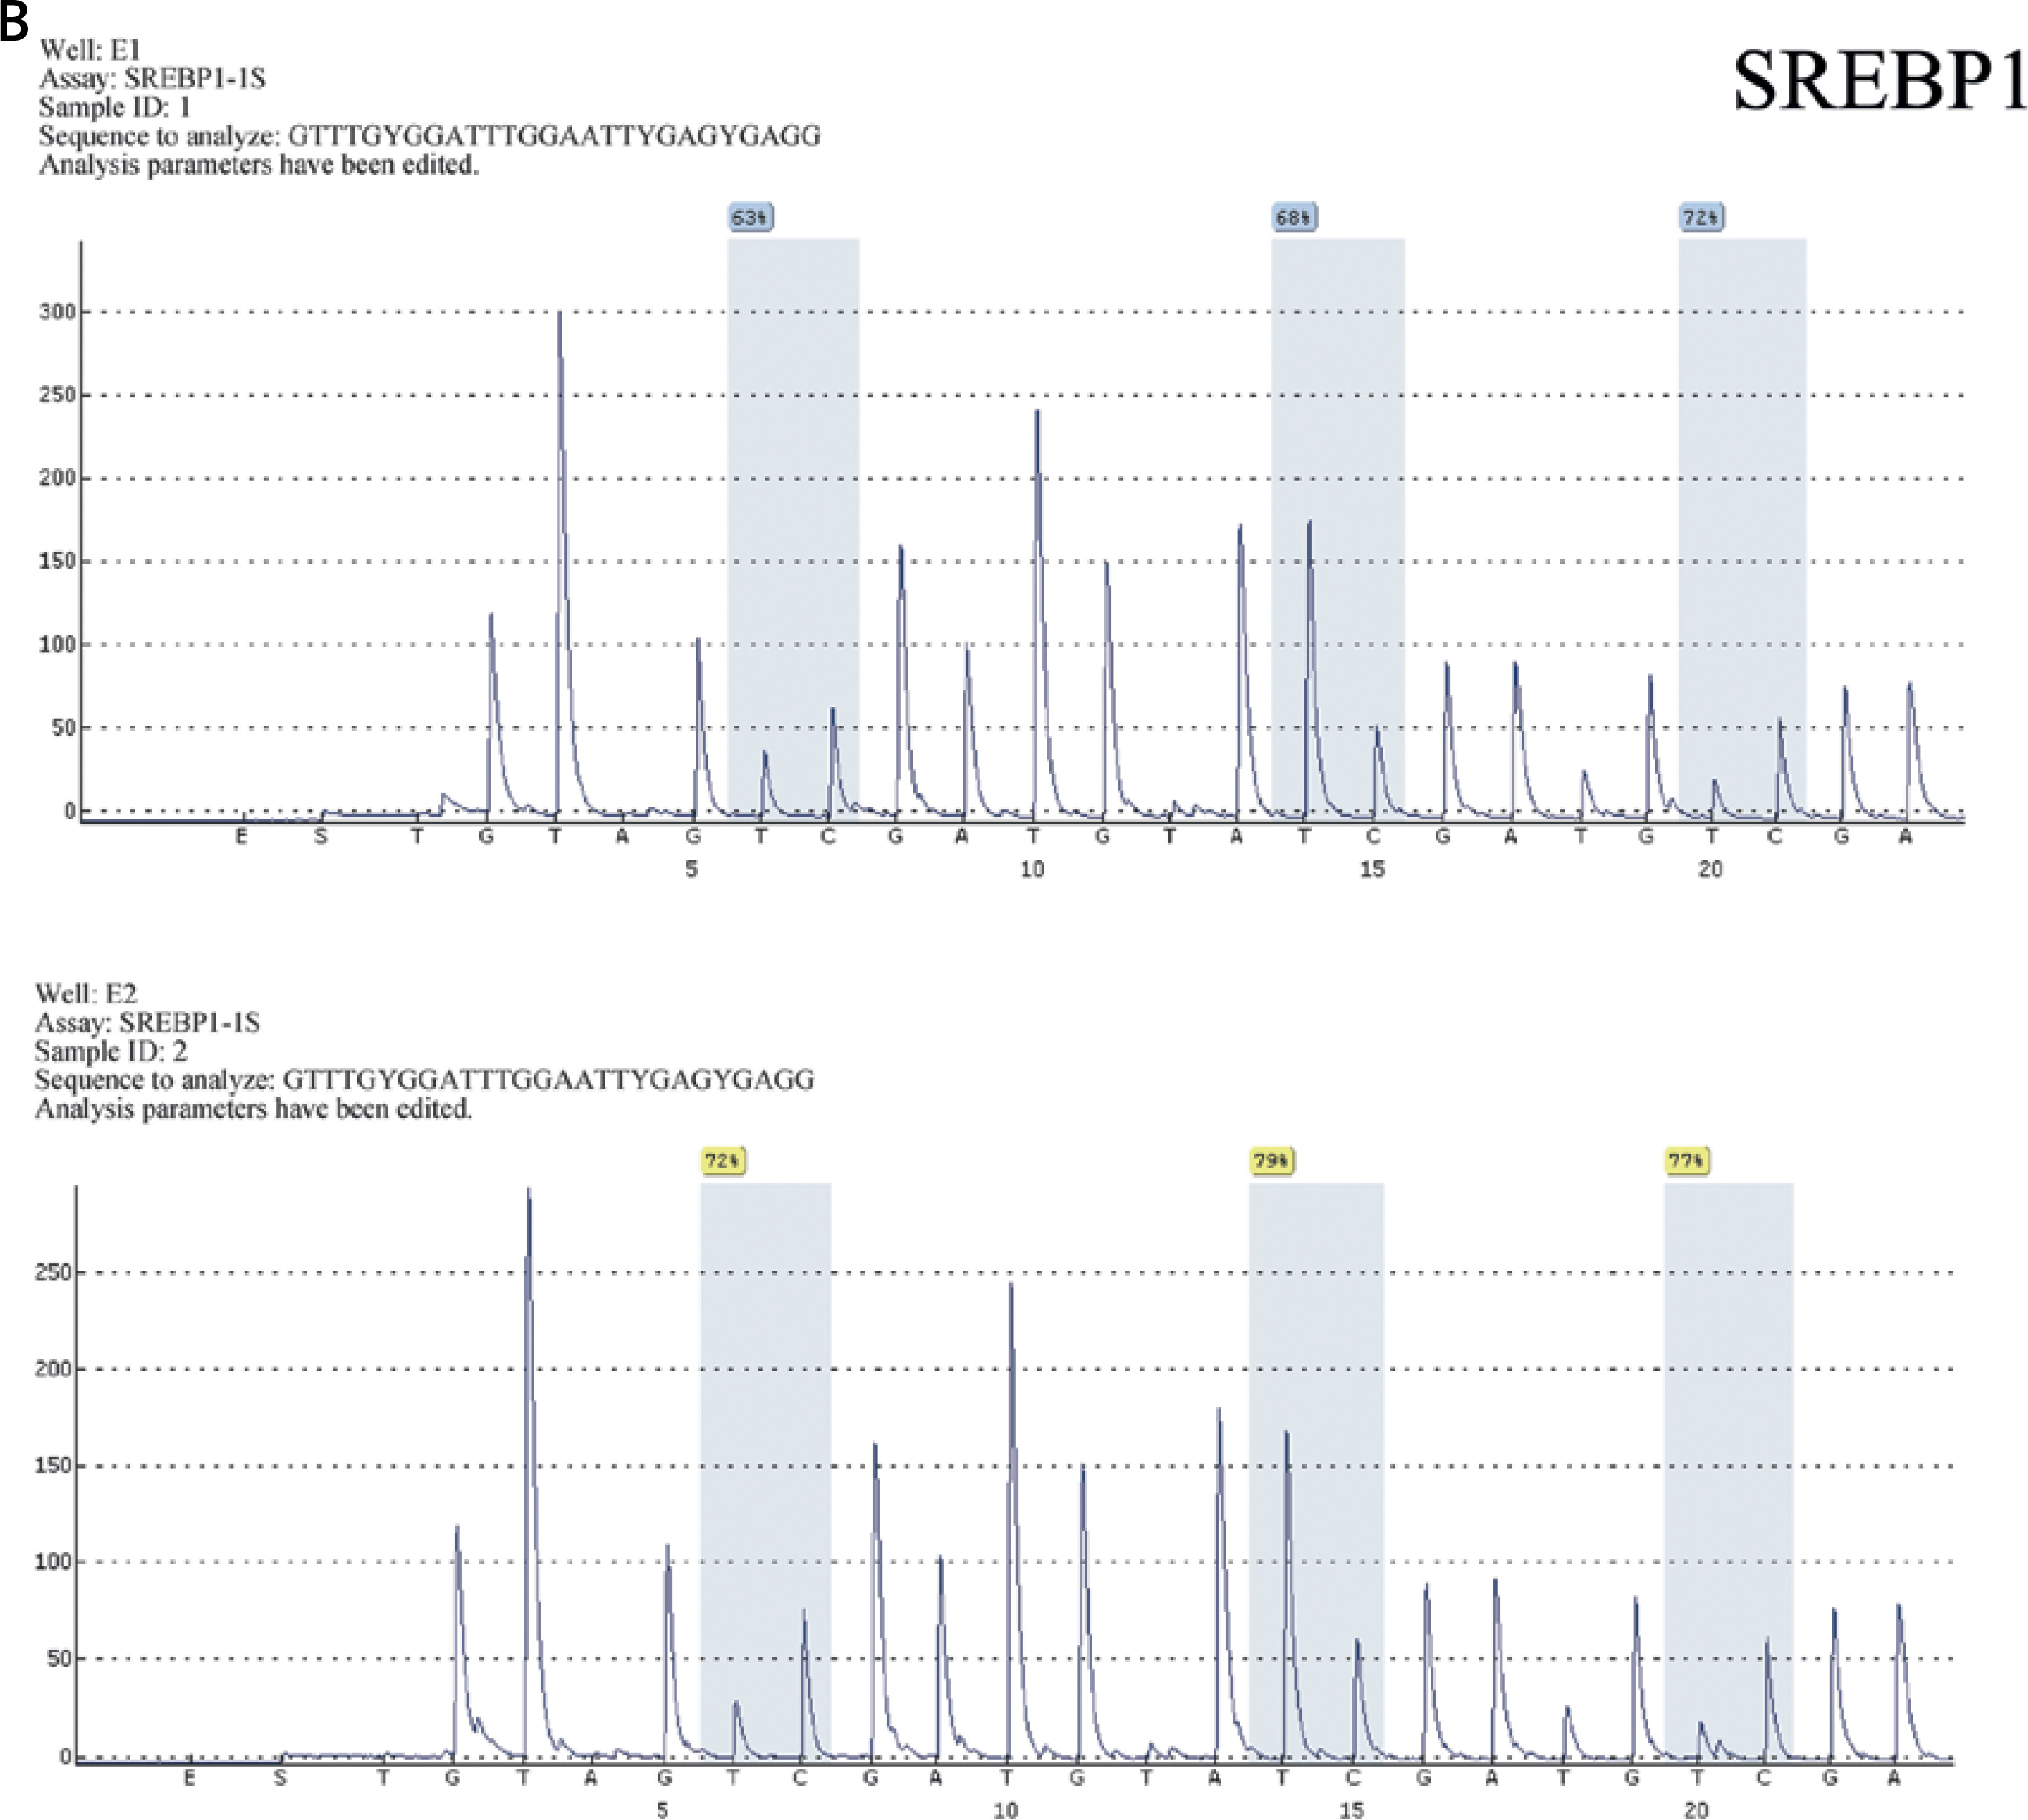
Figure 3
Methylation rate in the promoter regions of FASN and SREBP. A – The high methylation rate region of FASN and SREBP genes of each treatment. B – The low methylation rate region of the FASN gene and SREBP gene of each treatment. The letters A/B/C above each column indicate a significant difference (p < 0.01)
Transcription and expression levels of FASN and SREBP
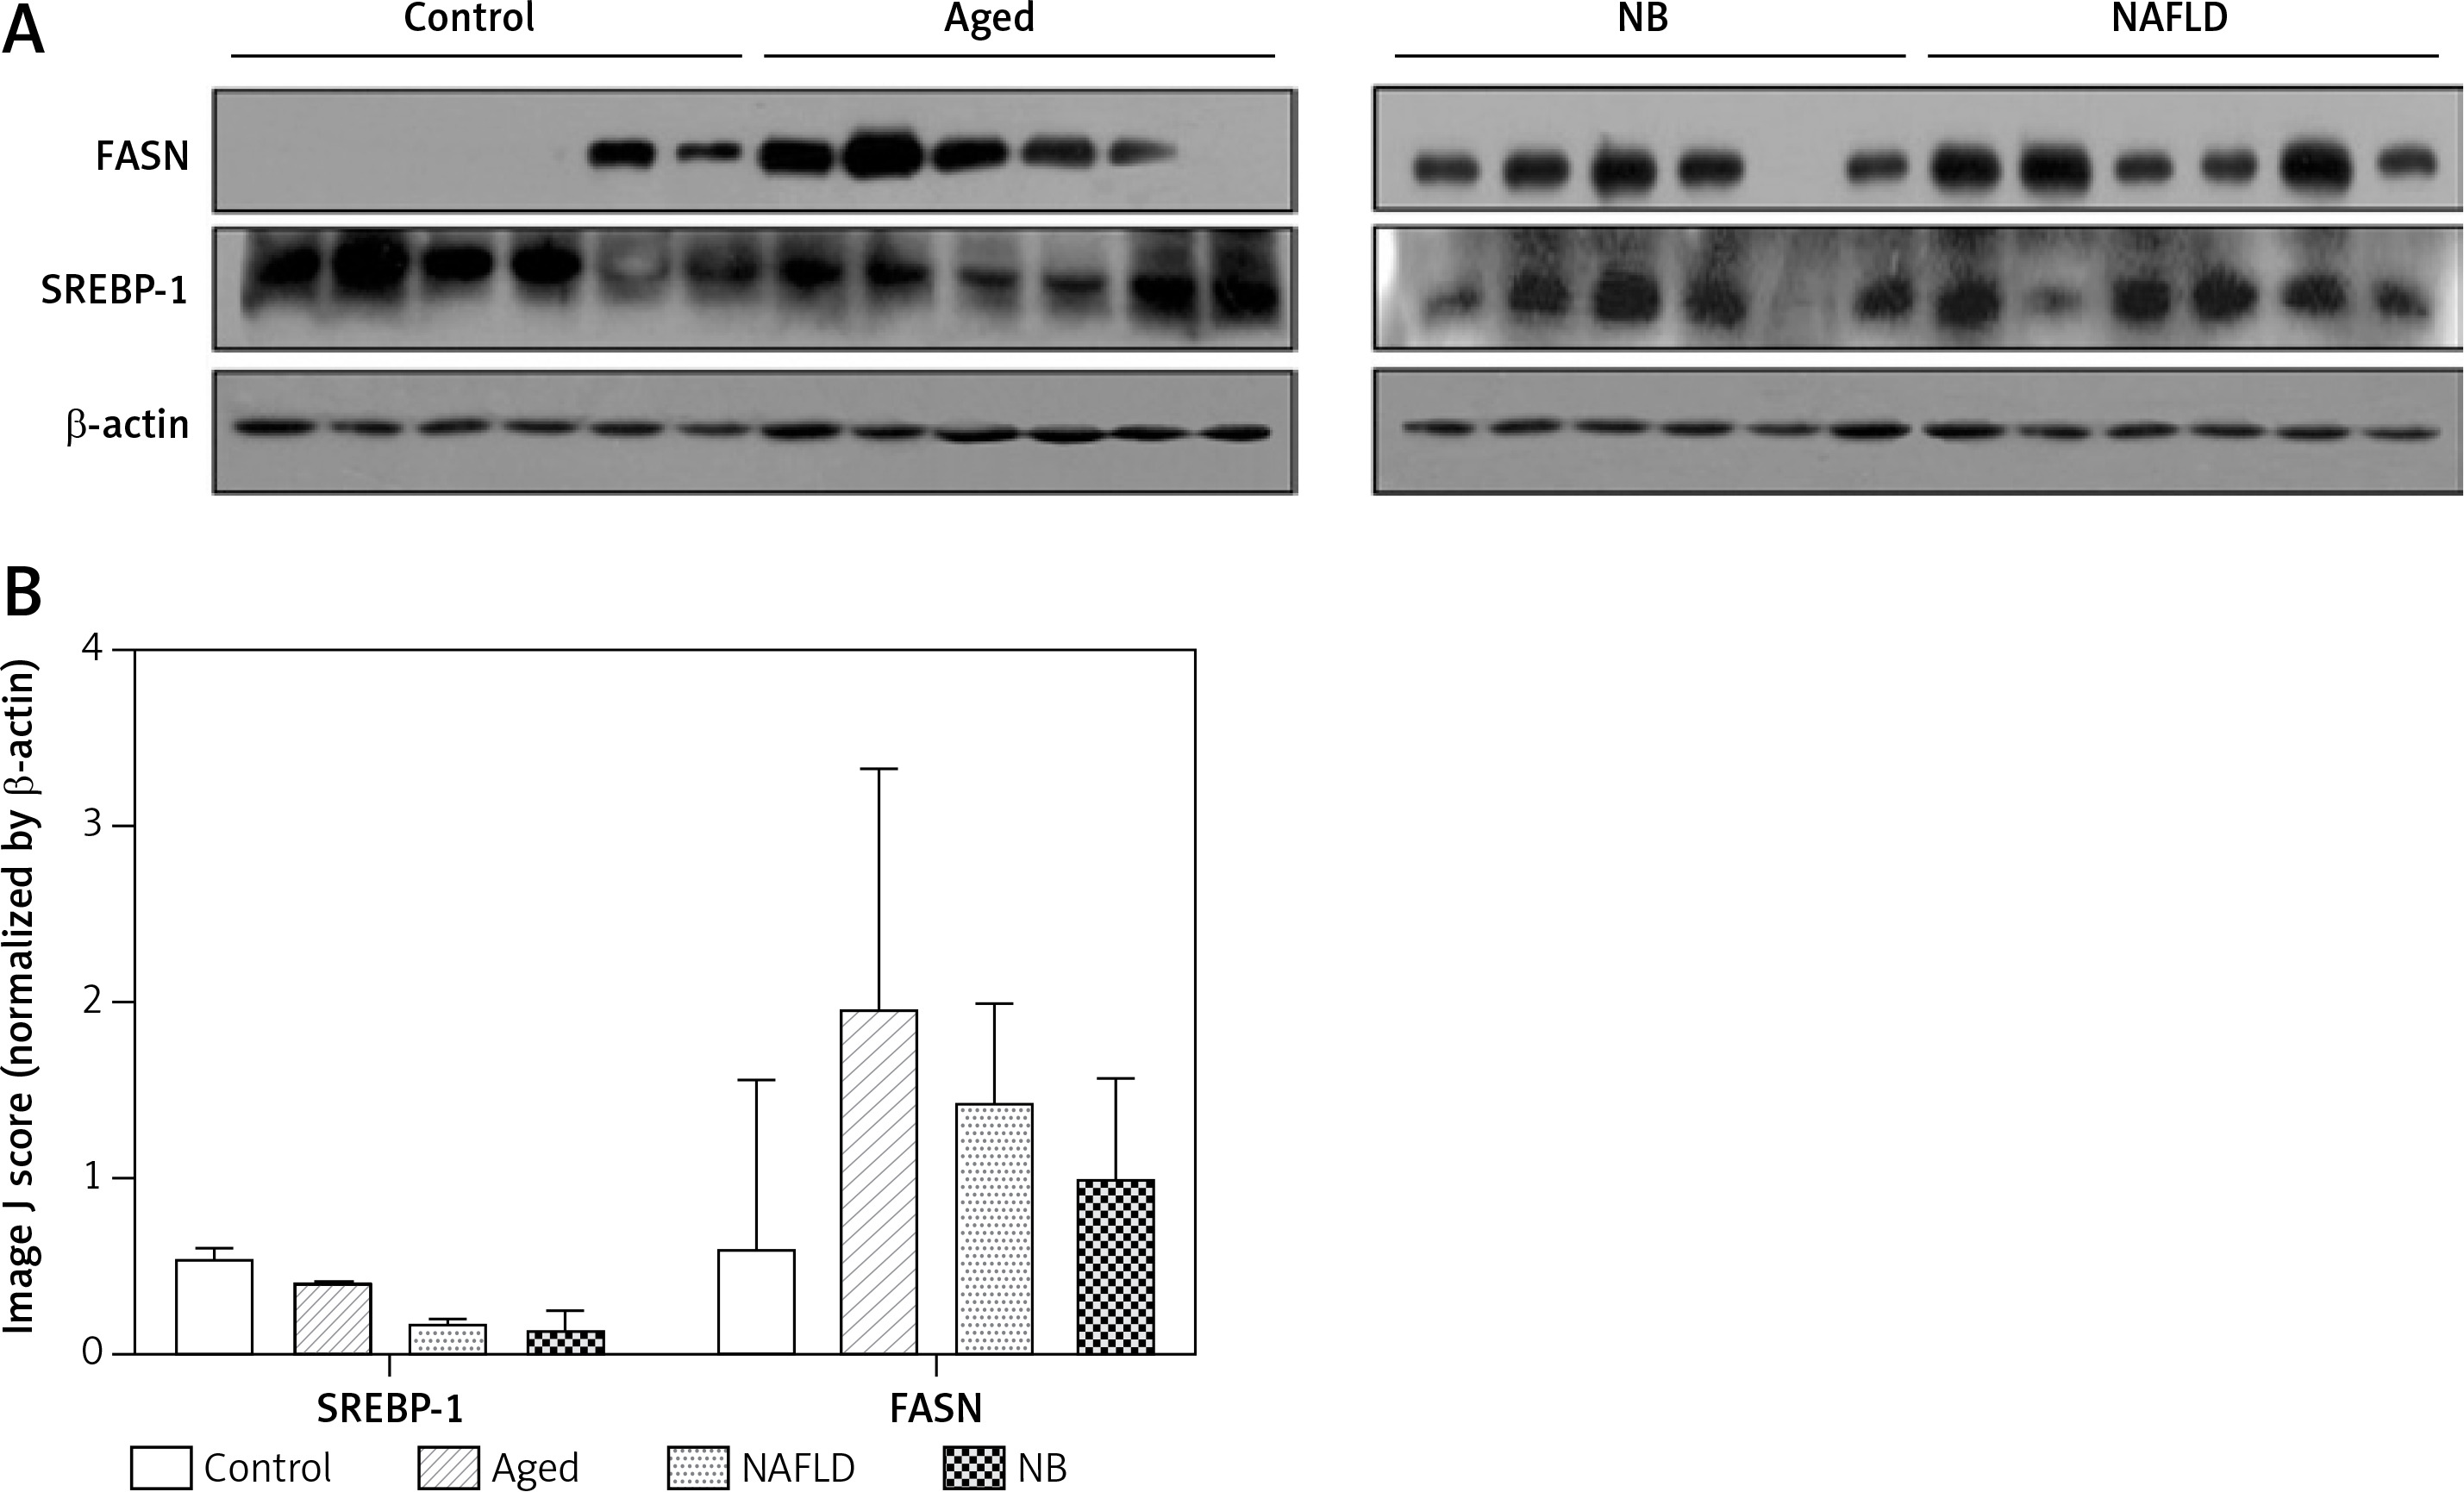
In the transcription level, the FASN gene was highest in the gerbil NB group, followed by the gerbil aged, NAFLD and control groups. Yet, for the SREBP gene, the transcription level was highest in the gerbil control group, followed by the gerbil NB, aged and NAFLD groups (Figure 4). The expression levels of FASN and SREBP genes are presented in Figure 5. For the FASN gene, the expression level was highest in the gerbil aged group, followed by the gerbil NAFLD, NB and control groups. Yet, for the SREBP gene, the expression level was highest in the gerbil control group, followed by the gerbil aged, NB and NAFLD groups.
Figure 4
Transcription levels of SREBP and FASN (qPCR). A – The transcriptional level of the FASN gene for newborn, aged, NAFLD, and normal. B – The transcriptional level of the SREBP gene for newborn, aged, NAFLD, and normal gerbils
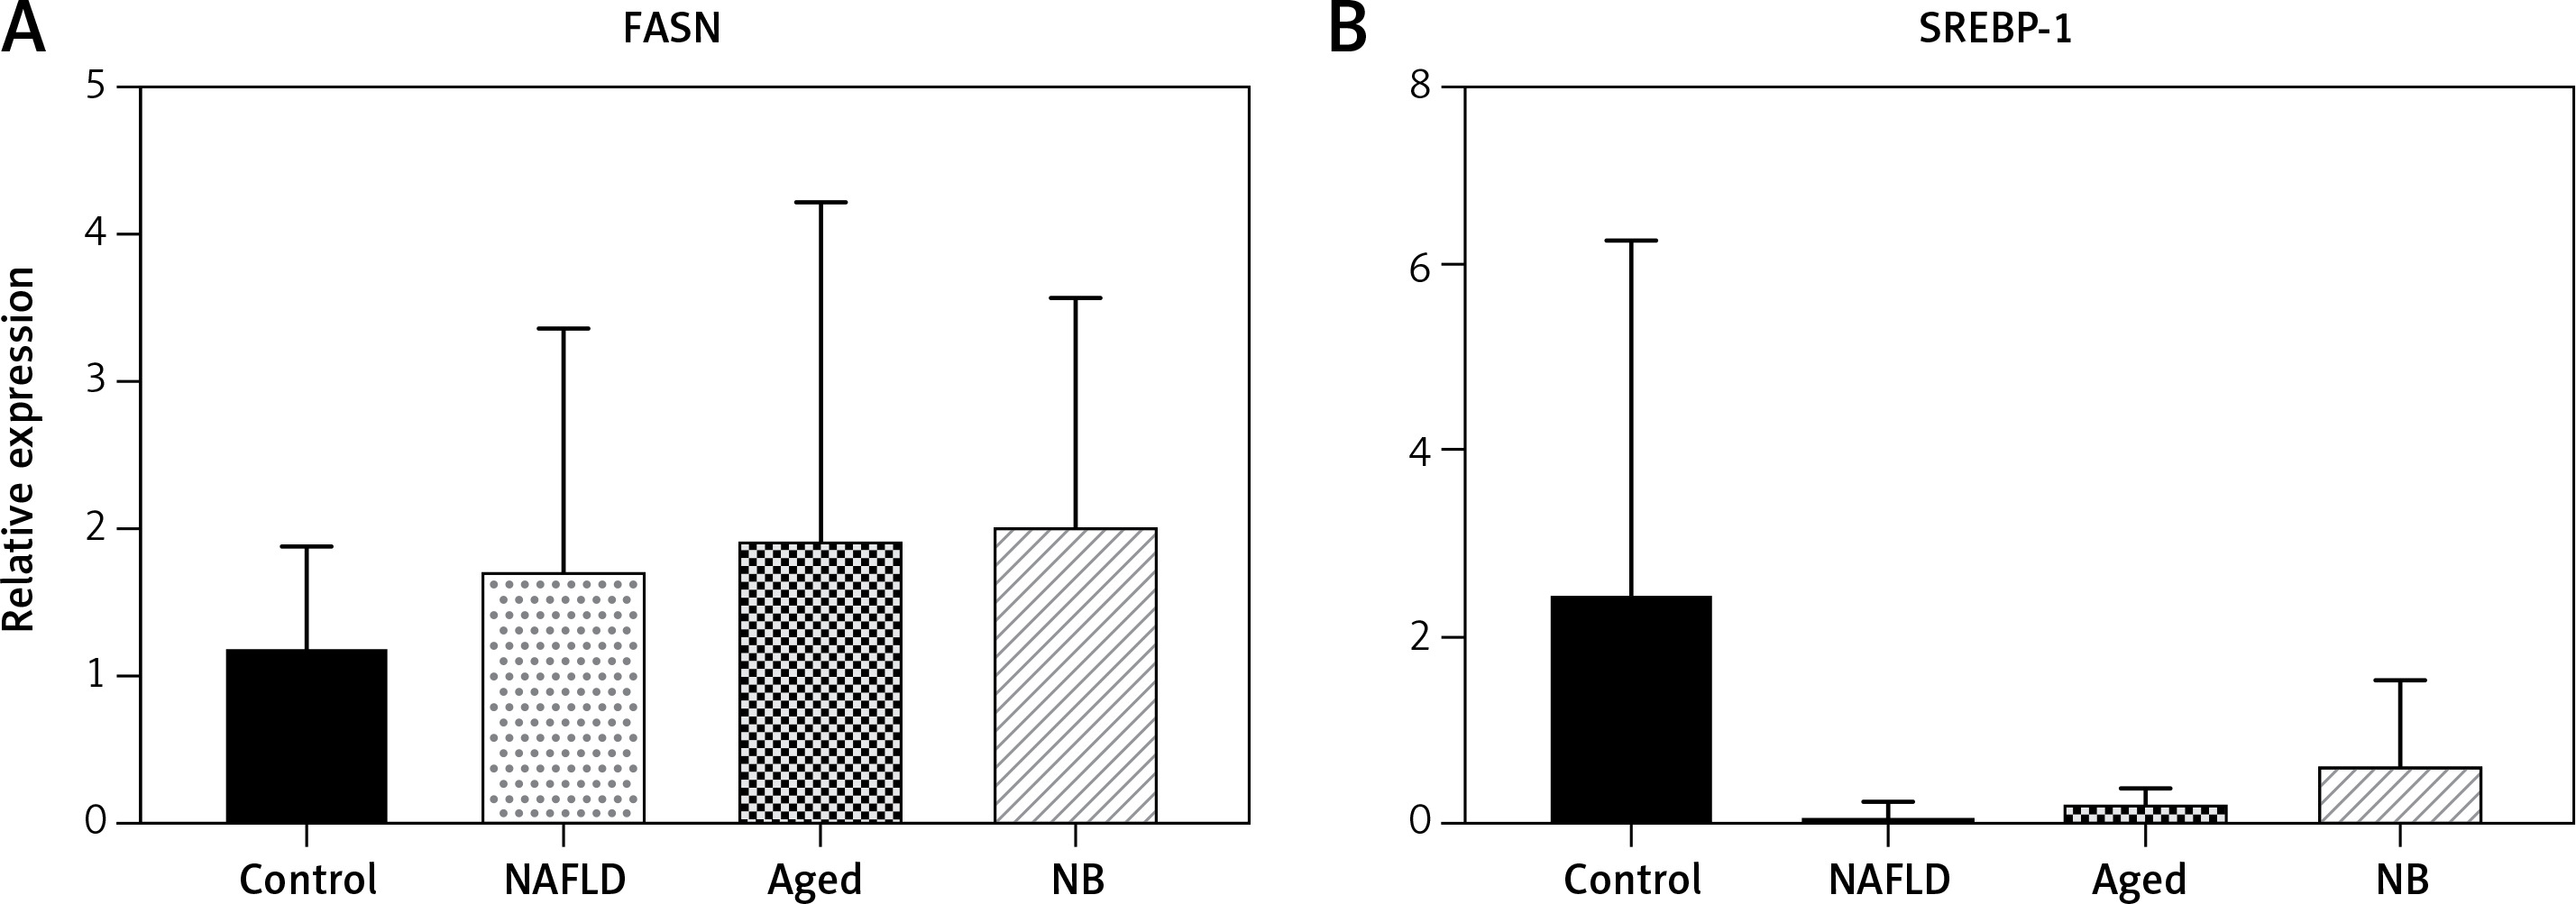
Figure 5
Expression levels of SREBP and FASN (Western blot analysis). A – The Western blot results of FASN and SREBP genes for each treatment. B – The average gray value of each treatment compared with β-actin
The correlation between gene expression and methylation rate was computed. For the FASN gene, the methylation rate was negatively correlated with the expression level in the gerbil NB (r = –0.78) and control groups (r = –0.61), while this trend weakened in the gerbil NAFLD (r = –0.11) and aged groups (r = 0.04), which was consistent with the results of WB analysis. For the SREBP gene, positive and negative correlations between methylation rate and expression level were found in the gerbil NB (r = 0.22) and NAFLD groups (r = –0.29), respectively. However, based on high methylation rates, the expression levels in the gerbil aged (r = 0.05) and control groups (r = –0.07) tended to be weakened with the increase of methylation rates.
Discussion
The methyl of DNA methylation is mainly derived from the methionine, folic acid and choline in food. High-fat diet feeding (methyl-donor-deficient diet, choline and L-amino acids) for animals can affect the gene expression through the change of DNA methylation. Methylenetetrahydrofolate reductase (MTHFR) is a key enzyme in the metabolic process of folic acid, which is involved in the methionine metabolic cycle and DNA methylation through converting the 5,10-methyltetrahydrofolate (MTHF) into 5-MTHF [11]. Folic acid deficiency can interfere with the metabolism of methionine, resulting in a decreased methyl donor in the body; therefore, hypomethylation occurs in the genome of the liver, promoting liver injury [12]. The above is the main reason for inducing fat deposition in the liver of animals [13], and also an important theory for establishing the high-fat diet-induced animal model. In the study conducted by Wang et al., progress in pathological changes of NAFLD (fatty liver–fibrosis–NASH) were found to be closely associated with the alteration of genome methylation in the liver, which was related to the gradually decreased methyl donors due to the disorder of the methionine cycle [14]. Metabolic syndrome (including hyperlipidemia) is often associated with a balance disorder between methyl supplement and methyl consumption [15]. In addition, the change of DNA methylation not only accumulates as time proceeds, but also is influenced by eating habits, body weight, aging and the environment [16, 17]. Epigenomic studies of mouse models indicated that a high-fat diet and exercise can change the lipid metabolism pathway and process of muscle development, of which exercise can significantly change the gene hypermethylation caused by a high-fat diet [18]. Fujiki et al. found that the DNA methylation of a specific gene (PPARγ) could change the expression of specific genes in adipocytes [19], while Kovalenko et al. found that drug-induced (pyrazinamide) liver injury was related to the decrease of overall DNA methylation level in the liver genome, with a dose-dependent effect [20]. Therefore, it could be speculated that the fatty liver of gerbils with NAFLD (induced model) was not only related to the changes of DNA methylation caused by the high-fat diet, but also related to the time cumulative effect of DNA methylation and aging (8-month-old gerbil model).
The methylation levels showed dramatic differences in the different regions of the same promoter region of the gene. For the FASN gene, the number of CPG islands selected from the two segments FASN-6R1-1S and FASN-6R1-2S showed a different distribution in each group. The dynamic methylation rate changes of these groups were affected by diet, age and NAFLD progression. Hypermethylation in the gerbil control group was significantly different than in the gerbil NAFLD and aged groups (p < 0.05); for the SREBP gene, the methylation rate was also higher in the gerbil control group compared to the gerbil aged and NAFLD groups (p < 0.05). The results above indicated that methylation levels of FASN and SREBP genes gradually decreased in NAFLD with the addition of a high-fat diet except the newborn gerbils (the overall DNA methylation levels in the liver genome are relatively high, inhibiting the expressions of lipogenic genes, which may be closely related to the reprogramming and environmental factors at the embryonic stage) [21, 22].
Sterol regulatory element-binding protein 1 plays an important role in the metabolism of lipid and protein in the liver cells; it is a key molecule regulating the lipid metabolism and expressions of genes related to the synthesis of fatty acid and TG [23]. In this study, the transcription level of the SREBP gene was higher in the gerbil control group compared to the gerbil aged and NAFLD groups (except the gerbil NB group), which was highly consistent with the gene expression levels. The results above indicated that the gene expression levels tended to decrease with the formation of NAFLD, which seemed to be inconsistent with the function of lipogenic genes. However, a study conducted in geese showed that a high-fat diet could reduce the expression level of SREBP mRNA [24, 25], with a significant negative correlation between the expression levels of the SREBP gene in liver tissues and liver weight index (p < 0.01) [25, 26], which may be due to the excessive deposition of TG in the liver resulting in an adaptive feedback of the goose body, thus inhibiting the abundance of SREBP and reducing the expressions of genes related to lipid synthesis [26].
Fatty acid synthase is a key enzyme in fatty acid synthesis, which has binding regions SRE (sterol regulatory elements) of SREBP-1C and ChREBP (carbohydrate responsive-element binding protein) in the promoter region. So the dynamic changes of SREBP can regulate the expression of FASN. Also, insulin can induce the tri-dimensional hypermethylation of H3K4 histone and super acetylation of H3 and H4 of FASN to regulate expression of the FASN gene, and can also accelerate expression of the FASN gene by enhancing the combination of SREBP-1C and ChREBP [27]. In this study, the transcription and expression levels of the FASN gene were both higher in the gerbil aged group compared to the gerbil NAFLD and control groups, indicating that the expression levels tended to increase with the formation of NAFLD, which was consistent with the pathogenesis of NAFLD including the increase in synthesis of fatty acid and cholesterol, abnormal transport of TC and cholesterol, and inhibition of fatty acid oxidation decomposition in the liver [28].
In view of the susceptibility of the Mongolian gerbil to a high-fat diet and differences in blood lipids between the age groups as well as the combination of results in the present study, we concluded that the liver genomic DNA of gerbils was influenced by a high-fat diet and age, which may be different in methylation level in multiple gene expression or signal transduction pathways. The present study provided a basis for future research on NAFLD in gerbils.