Introduction
Glioma is a type of major neural malignant tumor with an average survival of 12–15 months in people who undergo surgery, chemotherapy, and radiation treatment [1]. Gliomas arise from malignant transformation of glial cells and can be subdivided into astrocytomas, oligodendrogliomas, ependymomas, and mixed gliomas according to their clinical and pathological features [2]. Despite the high toxicities of existing treatment methods, most patients with brain cancer exhibit tumor recurrence because of incompatibility with radio- and chemo-therapy [3–5]. However, current chemotherapeutic methods have exhibited unfavorable efficacy in treating these tumors; therefore, the development of additional treatment methods is necessary. It is imperative to discover new therapeutic tools that directly act on the molecules that are altered in the malignancy.
Afatinib has been approved by the Food and Drug Administration due to its inhibitory effect on EGFR, HER2, HER4, and EGFRvIII through an irreversible association with ATP binding sites [6–8]. Several studies have indicated that afatinib, in relation to gemcitabine and cisplatin or pemetrexed and cisplatin, could dramatically increase the progression-free survival (PFS) of patients with EGFR mutant non-small-cell lung cancer (NSCLC) [9, 10] and those simultaneously developing brain metastases [11]. Further, afatinib dramatically improved PFS and overall survival (OS) of patients diagnosed with pulmonary squamous cell carcinoma [12]. Afatinib has also been confirmed to cross the blood–brain barrier [13]. Afatinib has a manageable safety profile but limited single-agent activity in unselected recurrent glioblastoma multiforme patients [14]. Interestingly, in another study, afatinib noticeably increased the OS of patient with EGFRvIII- and EGFR-overexpressing recurrent glioma by six times (60 months) [15]. Combinatorial treatment with afatinib and temozolomide significantly inhibited the tumorigenicity of glioblastoma, maintenance of cancer stem cells in vitro, and growth and development of tumor in vivo [16].
p53-upregulated modulator of apoptosis (PUMA), a member of the Bcl-2 homology 3-(BH3)-only subgroup of the Bcl-2 family, may directly regulate p53-relevant apoptosis [17–19]. The PUMA protein is relevant to mitochondria; when overexpressed in diverse cell lines, it could trigger apoptosis before p53 exogenous expression induces apoptosis. Additionally, PUMA can regulate p53-relevant apoptosis and its corresponding pathways. These findings revealed that PUMA plays an essential role in mediating cell apoptosis. In the current study, we administered afatinib to the glioma cells of xenograft tumors to assess its effect on apoptosis induction in vitro and in vivo. Next, we investigated whether PUMA was associated with the pro-apoptosis effect of afatinib in glioma cell lines or xenograft tumor.
Material and methods
Cell culture
U373-MG and U87-MG [20] cells, collected from the China Academia Sinica Cell Repository, were maintained in Dulbecco’s Modified Eagle Medium (DMEM) containing fetal bovine serum (FBS; 10%), glutamine (2 mmol/l), and penicillin and streptomycin (0.1 mg/ml each) in a 5% CO2 atmosphere at 37°C. Cells were transfected using Lipofectamine 2000 (11668030, Thermo Fisher) as per the manufacturer’s instructions.
Reagents and drug preparation
Afatinib (Giotrif, Selleck Chemicals) was diluted with dimethyl sulfoxide (DMSO) to 10 mmol/l and stored at –20°C. For in vitro studies, afatinib was diluted with DMSO to various concentrations (1, 5, and 10 µM) and subsequently added to cells in DMEM without serum. For in vivo studies, afatinib was diluted with distilled water to 1.25 mg/ml.
PUMA knockdown shRNA plasmid was purchased from Santa Cruz Biotechnology. PUMA overexpression plasmid was purchased from Addgene. All siRNAs were synthesized by GenePharma. Control siRNA duplexes targeted the sequence 5ʹ-UUC UCC GAA CGU GUC ACG U-3ʹ. PUMA siRNA duplexes targeted the sequence of 5ʹ-CGG ACG ACC UCA ACG CAC A-3ʹ. Lipofectamine 2000 (Invitrogen) was used for transfection as per the manufacturer’s instructions.
Xenograft model in athymic mice and drug treatment
All animal experiment protocols were approved by our hospital. U373-MG cells and U373-MG cells (1 × 10⁷) with PUMA knockdown were subcutaneously injected to the right flanks of female nude mice, thereby creating tumor xenografts. U373-MG tumor-carrying mice were randomly classified into four groups (six mice per group) 5 days after tumor cell inoculation. Next, tumor size was determined and tumor volume (TV) was obtained using the following formula (the unit of parameters was “mm”): TV = 1/2 (length × width2) mm3. Optimal TV inhibition percentage (TVI%) was calculated as 100 – (TV treated/TV control × 100).
The mice were then subjected to afatinib or vehicle treatment (0.01 g/kg body weight) for 5 days per week, for 30 days (the start date was considered day 1). They were executed when in a particularly weak condition.
Western blotting (WB)
Cells were lysed using a RIPA lysis assay buffer (89901, Thermo Fisher), and the total amount of 100 µg of proteins were separated using 10% SDS–PAGE and then transferred onto Immobilon PVDF (0.45 µm) membranes, which were successively incubated with primary antibodies for 16 h and corresponding secondary antibodies for 60 min. The primary and secondary antibodies used in this study were as follows: Rabbit monoclonal anti-Bax antibody (1 : 2500, 2774S, CST), Mouse monoclonal anti-Bcl-2 antibody (1 : 2500, 15071S, CST), Rabbit polyclonal anti-PUMA antibody (1 : 1000, ab9643, Abcam), Goat anti-rabbit IgG H&L (HRP) (1 : 5000, ab205718, Abcam), and Goat anti-mouse IgG H&L (1 : 5000, ab6708, Abcam). The Mouse anti-beta Actin antibody (1 : 5000, ab8226, Abcam) and the Mouse anti-beta GAPDH antibody (1 : 5000, ab8245, Abcam) served as a loading control. The above incubation process was conducted at 4°C. Blots were visualized using chemiluminescence reagents (15159, Thermo Fisher) and a C-DiGit blot scanner.
Quantitative polymerase chain reaction (Q-PCR)
RNA was isolated with TRIzol reagent (15596026, Thermo Fisher), and electrophoresis of the products on 3.5% agarose gels was performed to validate the specific generation of the expected PCR product. Relative gene expression levels were determined with SYBR Green master mix using qRT-PCR with GAPDH, which is stably expressed among samples, as an internal reference. The PUMA and GAPDH were amplified using the following pairs of primers: PUMA forward 5ʹ-CTG CTG CCC GCT GCC TAC CT-3ʹ and PUMA reverse 5ʹ-CCG CTC GTA CTG TGC GTT GAG-3ʹ; GAPDH forward 5ʹ-AAT CCC ATC ACC ATC TTC C-3ʹ and GAPDH reverse 5ʹ-CAT CAC GCC ACA GTT TCC-3ʹ [21]. Reactions were conducted in triplicate in 0.02 ml of reaction solution in an ABI 7500 Real-Time PCR System. The amplification profile was denatured at 95°C for 10 min, followed by 40 cycles of 95°C for 15 s and 60°C for 45 s, in which fluorescence was acquired. At the end of the PCR cycles, melting curve analyses were performed. ΔCt was calculated by subtracting the Ct values of GAPDH from the Ct values of the gene of interest. ΔΔCt was then calculated by subtracting ΔCt of the control from ΔCt of the sample. The 2–ΔΔCT method was applied to calculate the copy number of target genes.
Cell proliferation and colony formation assay
Cell proliferation capacity was evaluated using the CCK-8 assay according to the manufacturer’s instructions. Cells were seeded into 96-well plates, CCK-8 (10 µl) was added to each well and cells were incubated for a further 2 h at 37°C. Optical density (OD) was measured at 450 nm using an auto-microplate reader (infinite M200, Tecan, Switzerland).
For the colony formation experiment, cells were cultured in 6-well plates and cultured for 7 days. They were then fixed in 4% formaldehyde for 20 min and stained with 1.0% crystal violet.
Annexin V-FITC/PI flow cytometry (FC)
Apoptosis was assessed using the Annexin V-FITC/PI FC (640914, BioLegend) test as previously described [22].
Results
Afatinib-induced inhibition of proliferation and growth of glioma cells
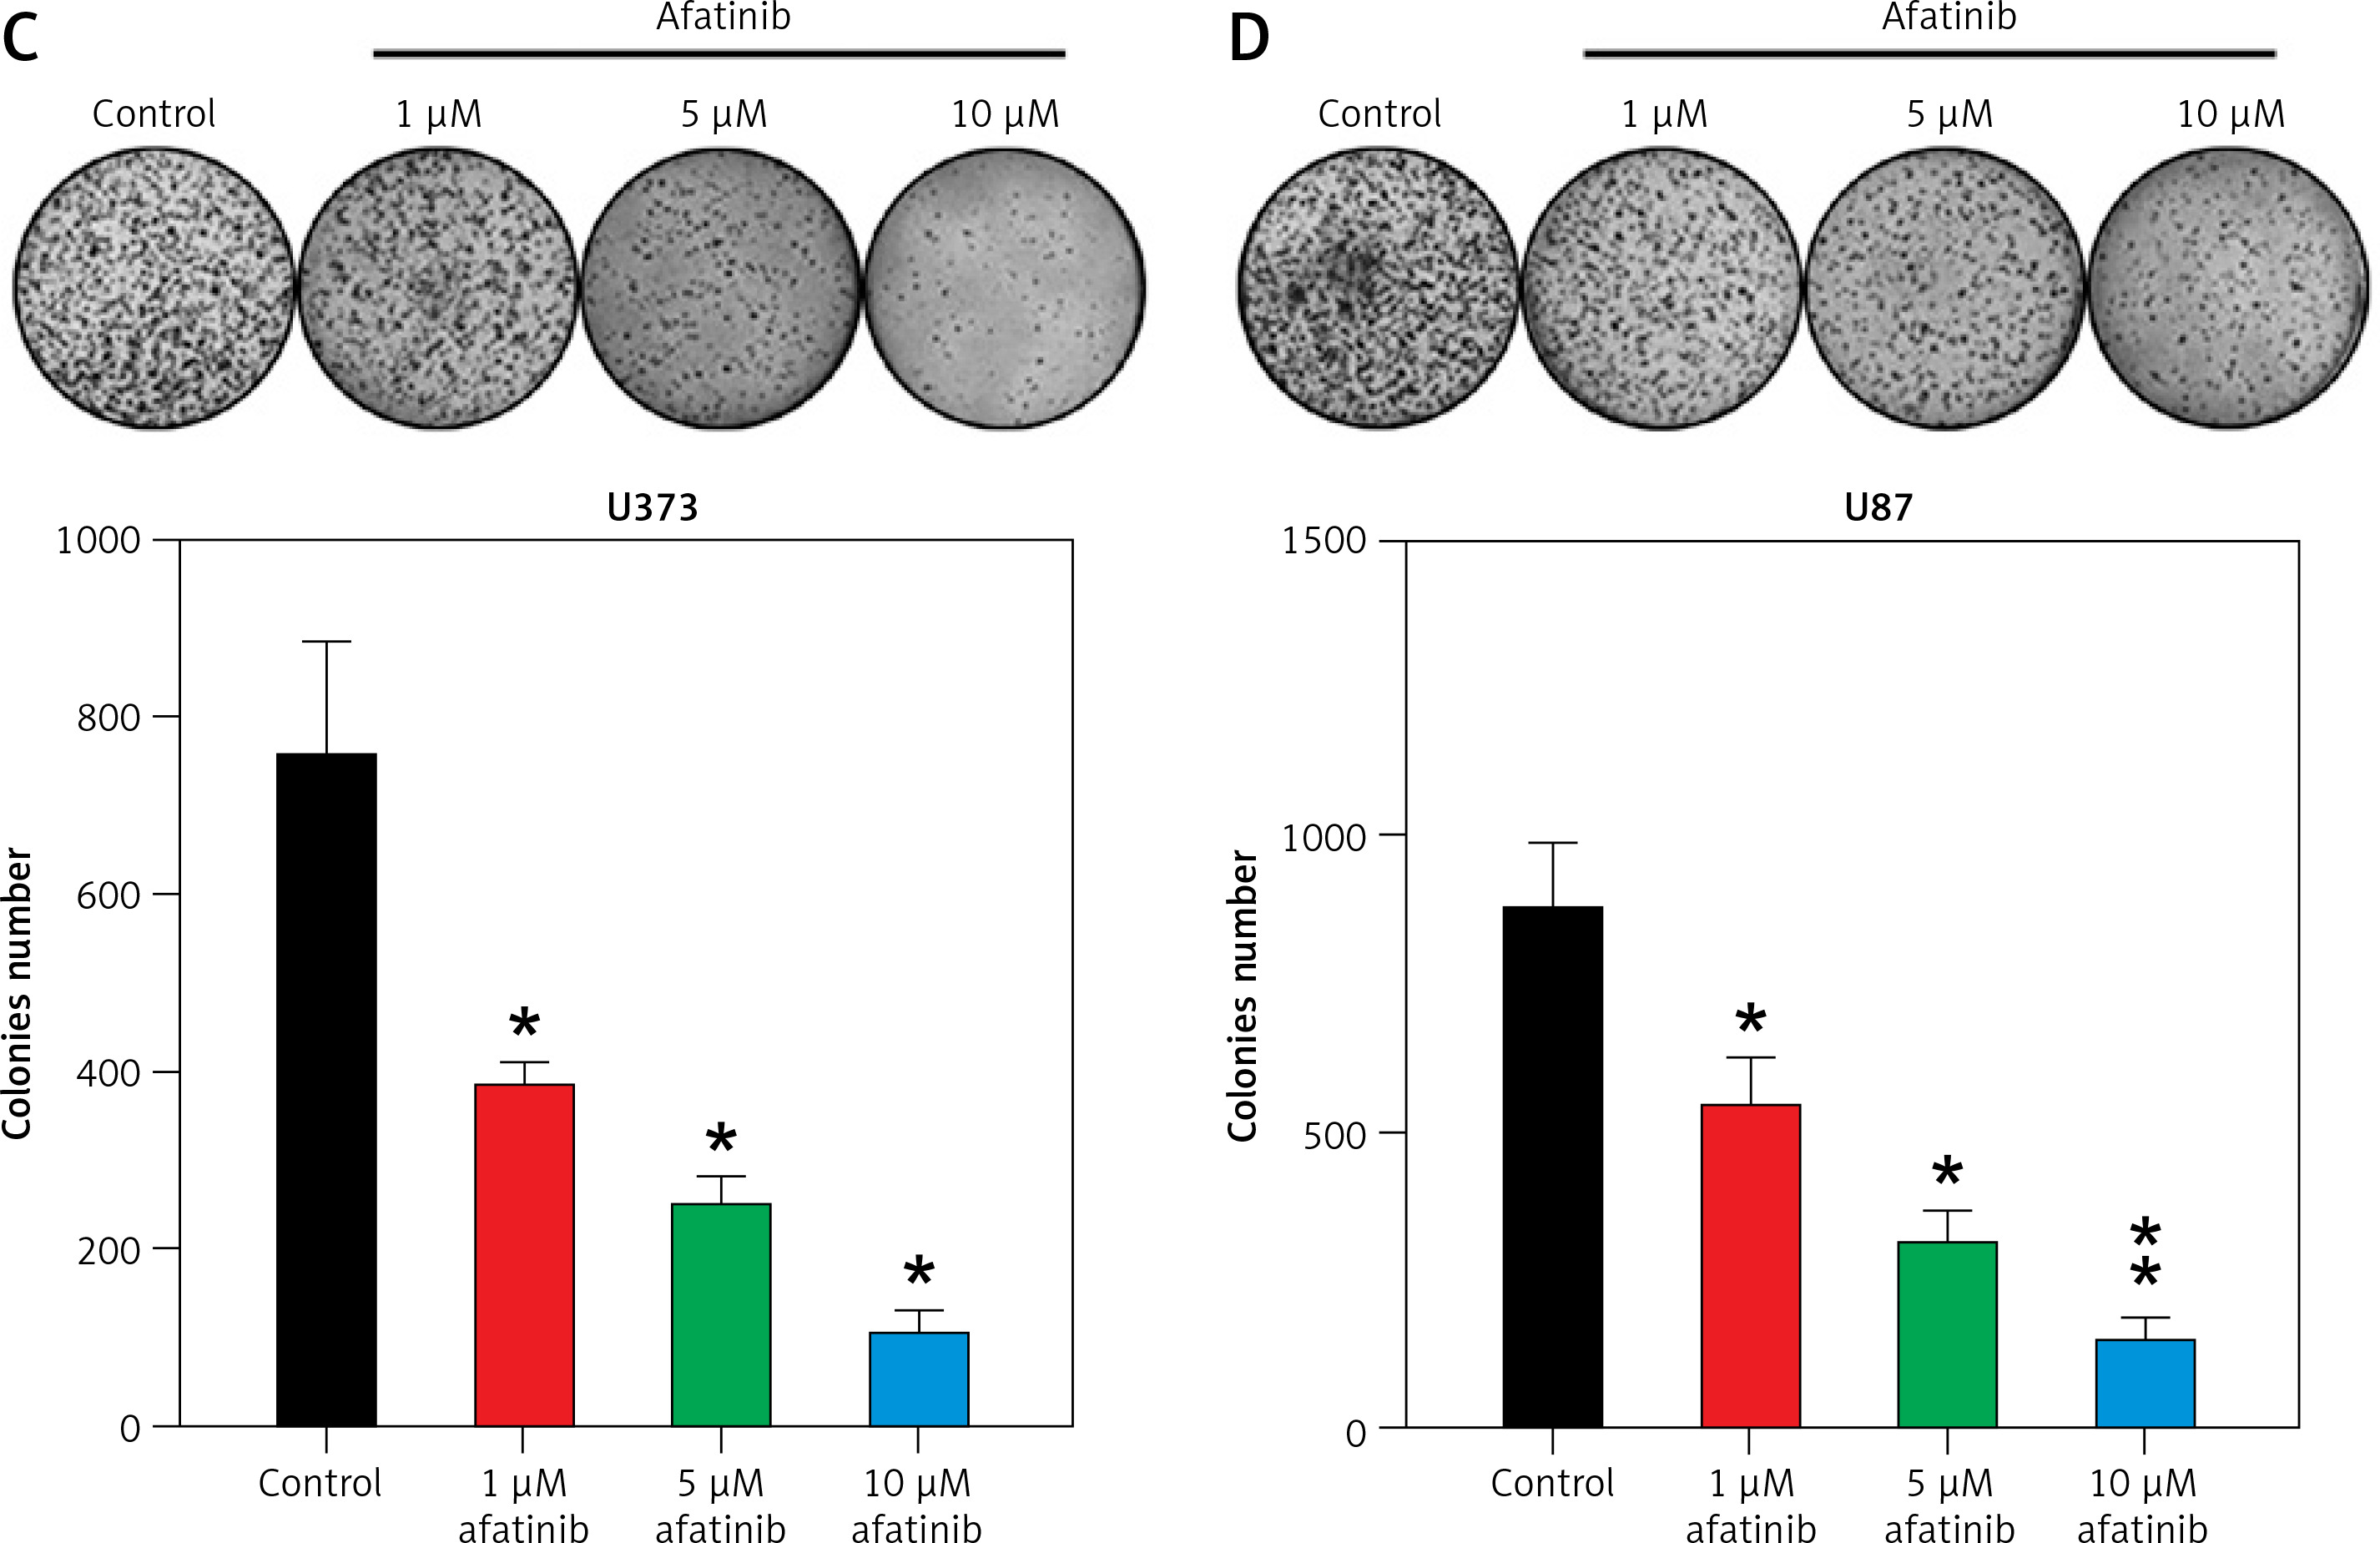
U373 and U87 cells were treated with afatinib at 1, 5, and 10 µM, based on a previous study in non-small cell lung carcinoma [23]. A Cell Counting Kit-8 (CCK-8) assay indicated that the proliferation rates of U373 and U87 cells significantly decreased owing to afatinib treatment at 36–72 h, depending on the afatinib concentration (Figures 1 A, B). The colony formation assay indicated that the growth of glioma cells declined after afatinib treatment in a dose-dependent manner (Figures 1 C, D). Altogether, these results indicate that afatinib repressed both the proliferation and growth rates of the glioma cells.
Figure 1
Glioma cell growth and proliferation suppressed by afatinib. U373 and U87 cells were exposed to afatinib of different concentrations (1, 5, and 10 μM). A, B – CCK-8 assay reveals that the proliferation rates of the two cell lines significantly decreased when treated with different concentrations of afatinib. C, D – Soft agar colony formation assay for glioma cells was used to detect the number of cells at 72 h after afatinib treatment. N = 3; *p < 0.05; **p < 0.01 (vs control group)
Effects of afatinib on cell apoptosis and related proteins
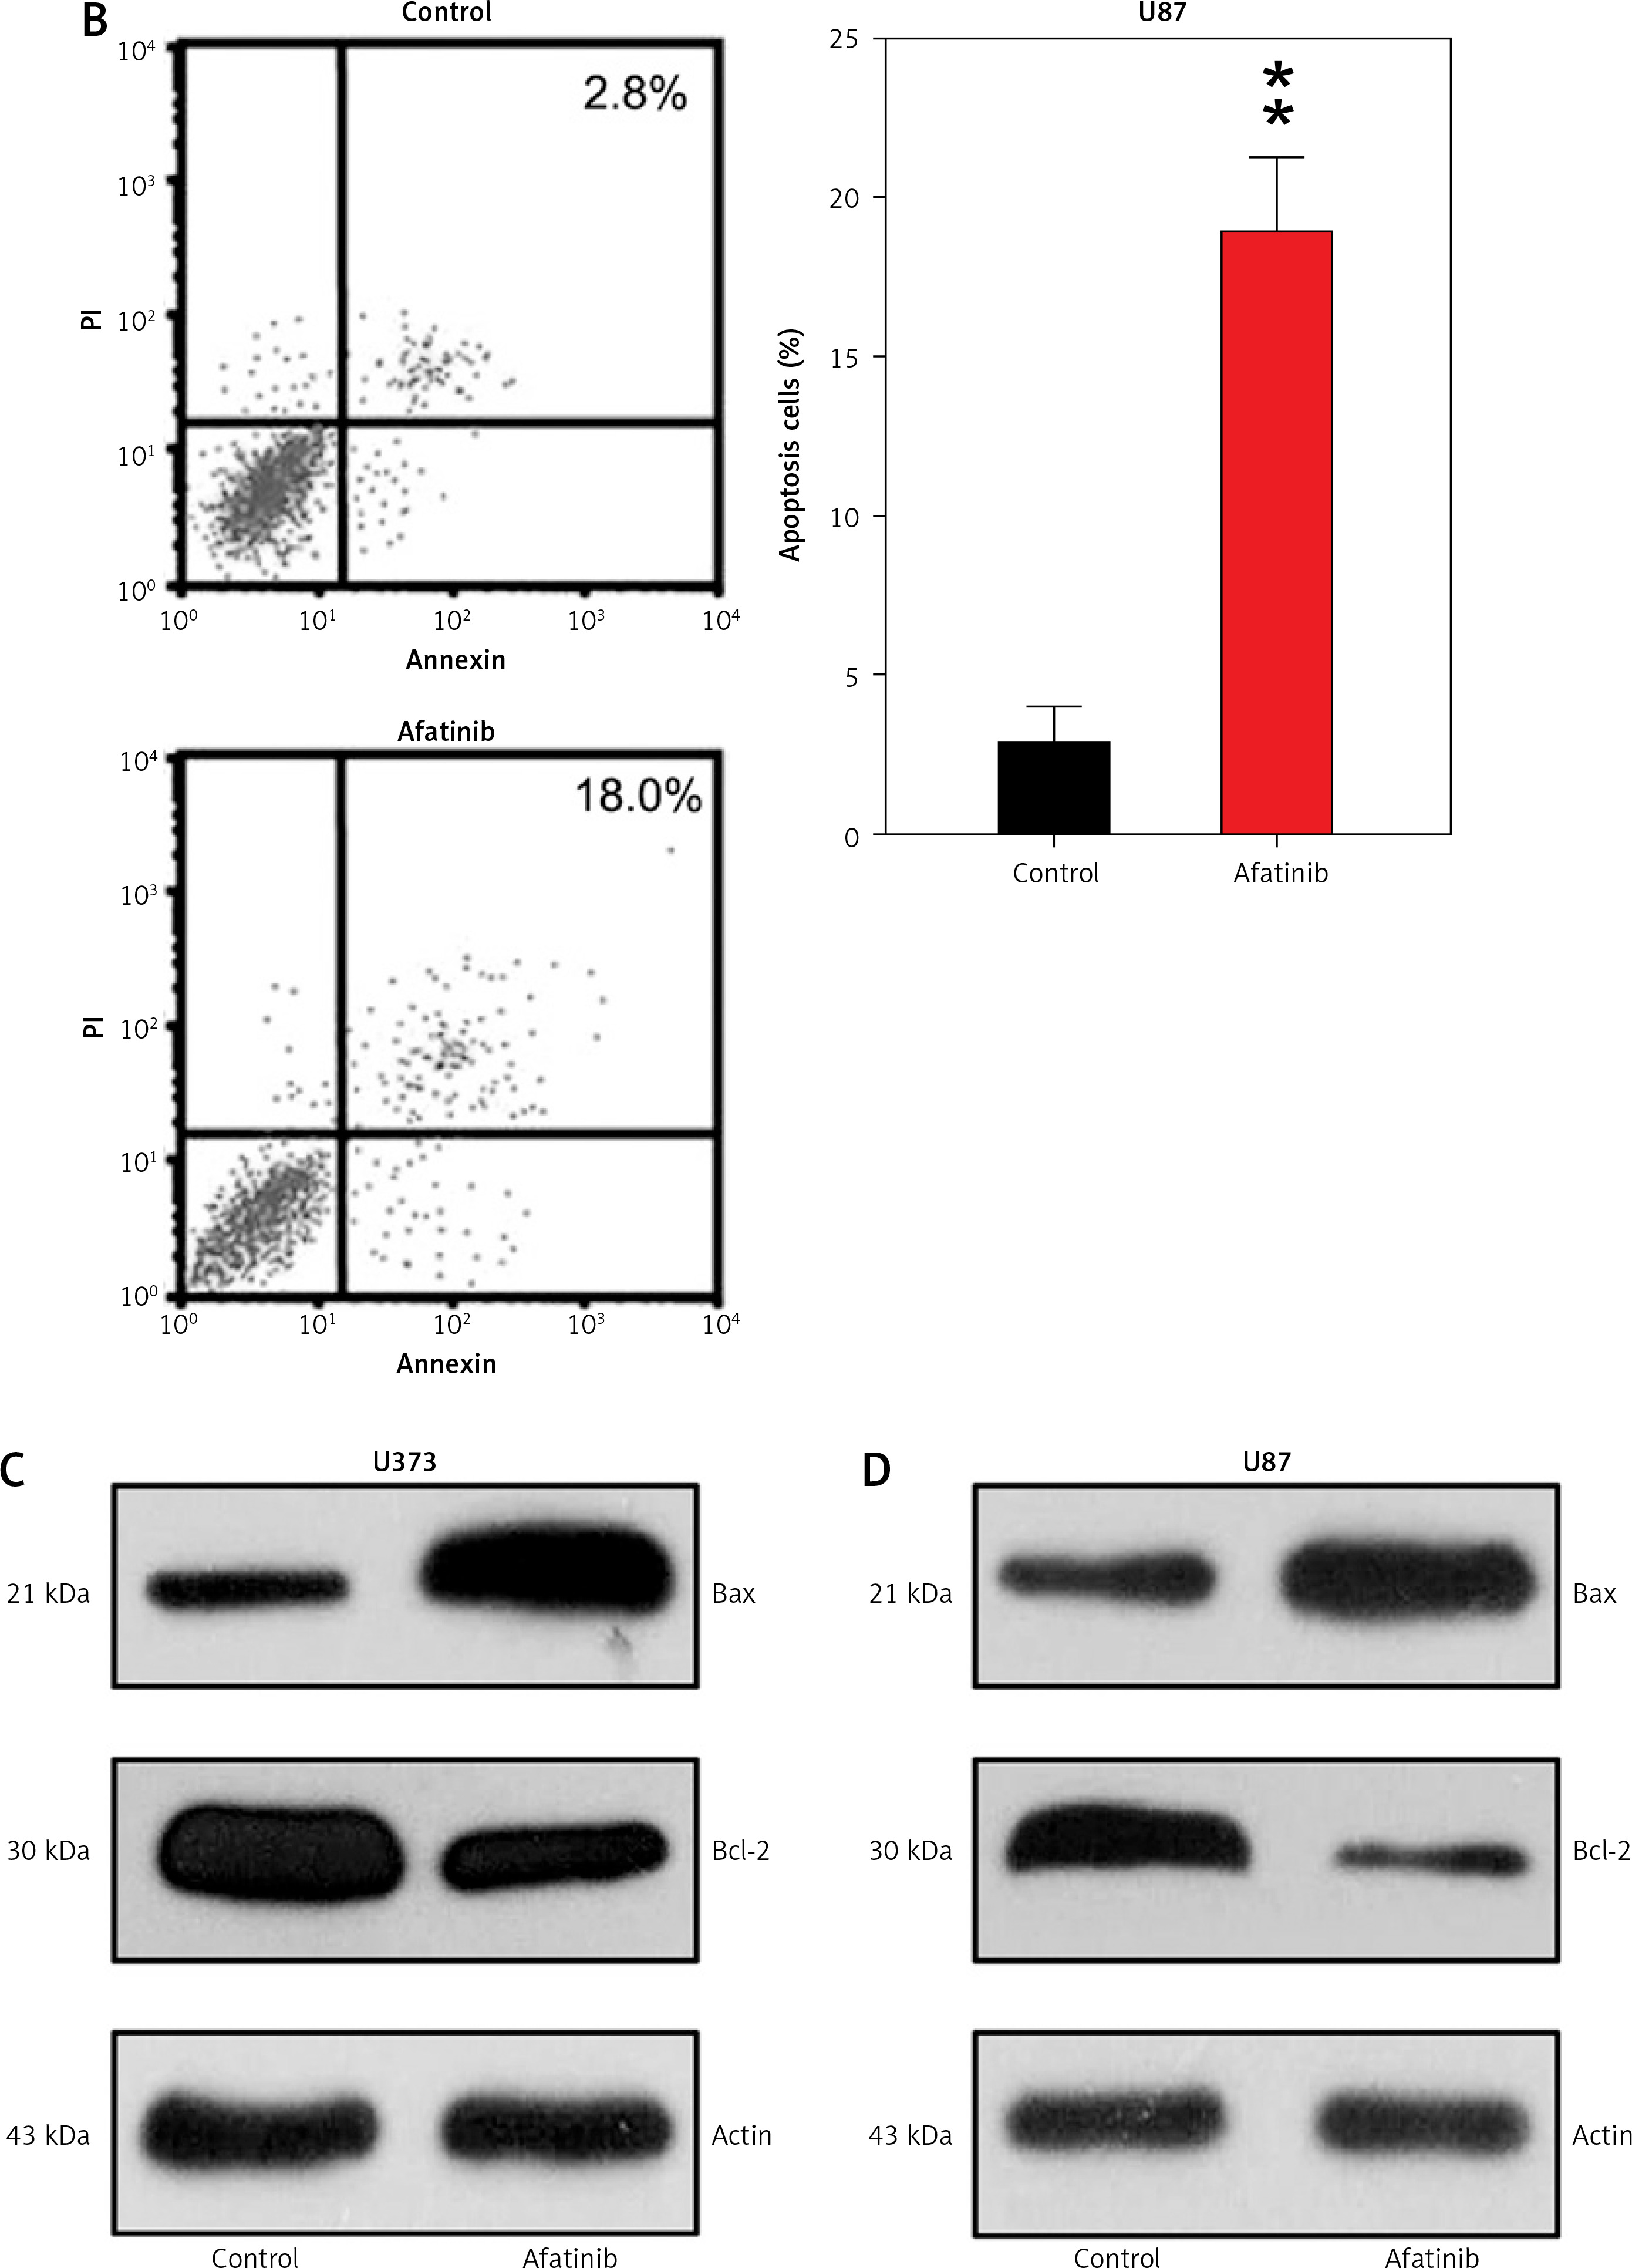
To explore how afatinib affects the apoptosis of glioma cells, U373 and U87 cells were treated with afatinib (10 µM) and then examined with Annexin V/PI FC. Afatinib treatment clearly promoted apoptosis in U373 and U87 cells (Figures 2 A, B). Next, apoptosis-related proteins, anti-apoptotic Bcl-2 and pro-apoptotic Bax, were examined using WB; it was demonstrated that afatinib upregulated the expression of Bax while downregulating Bcl-2 expression in both the cell lines (Figures 2 C, D).
Figure 2
Apoptosis of glioma cells regulated by afatinib. U373 and U87 cells were treated with afatinib (10 μM). A, B – Annexin V/PI staining results reveal that afatinib significantly increased the apoptosis rate in both glioma cell lines. The early apoptotic population of cells is indicated in the upper right quadrant of each plot. C, D – Western blotting results reveal that afatinib treatment regulated the expression of Bcl-2 and Bax in U373 and U87 cells. N = 3; **p < 0.01 (vs. control group)
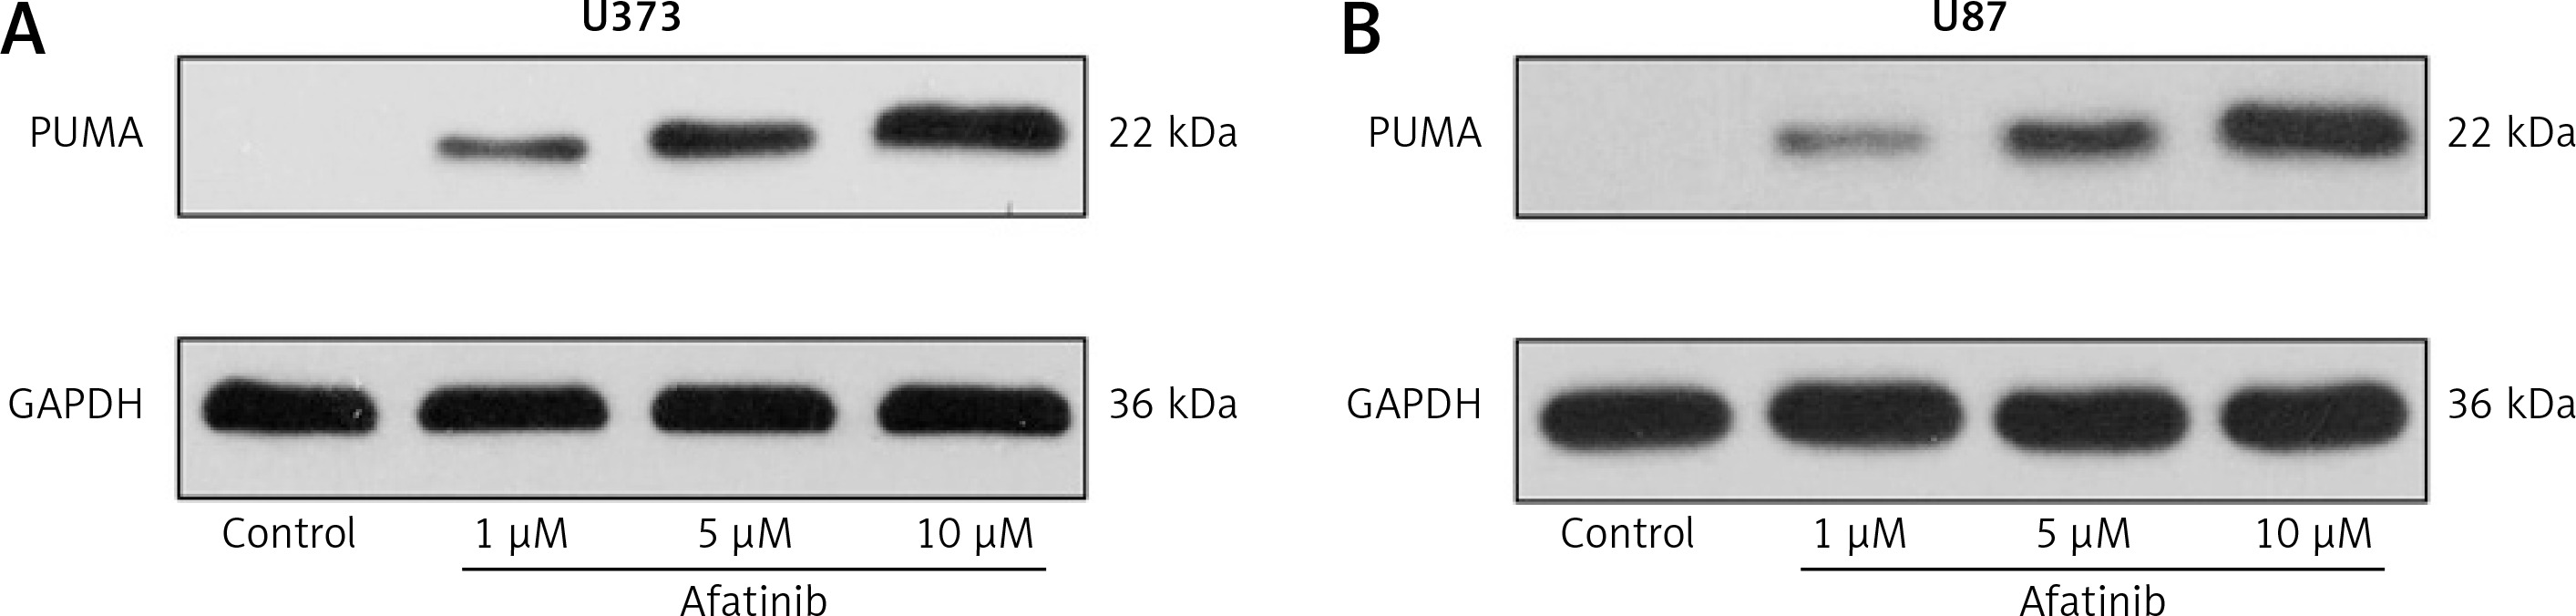
Moreover, we examined the expression of key pro-apoptotic PUMA expression in both cell lines using afatinib treatment of different concentrations. Afatinib treatment appeared to elicit PUMA expression in a dose-dependent manner (Figures 3 A, B).
The role of PUMA in afatinib-induced mediation of cell growth and apoptosis
To investigate the effect of PUMA in the regulation of growth and apoptosis of glioma cells by afatinib, PUMA was deliberately overexpressed or silenced in the afatinib-treated U373 and U87 cells.
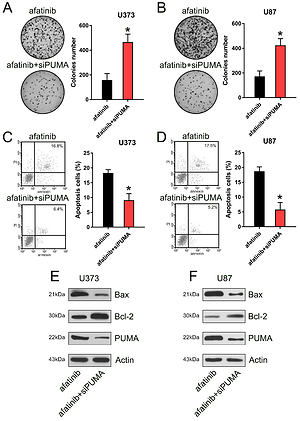
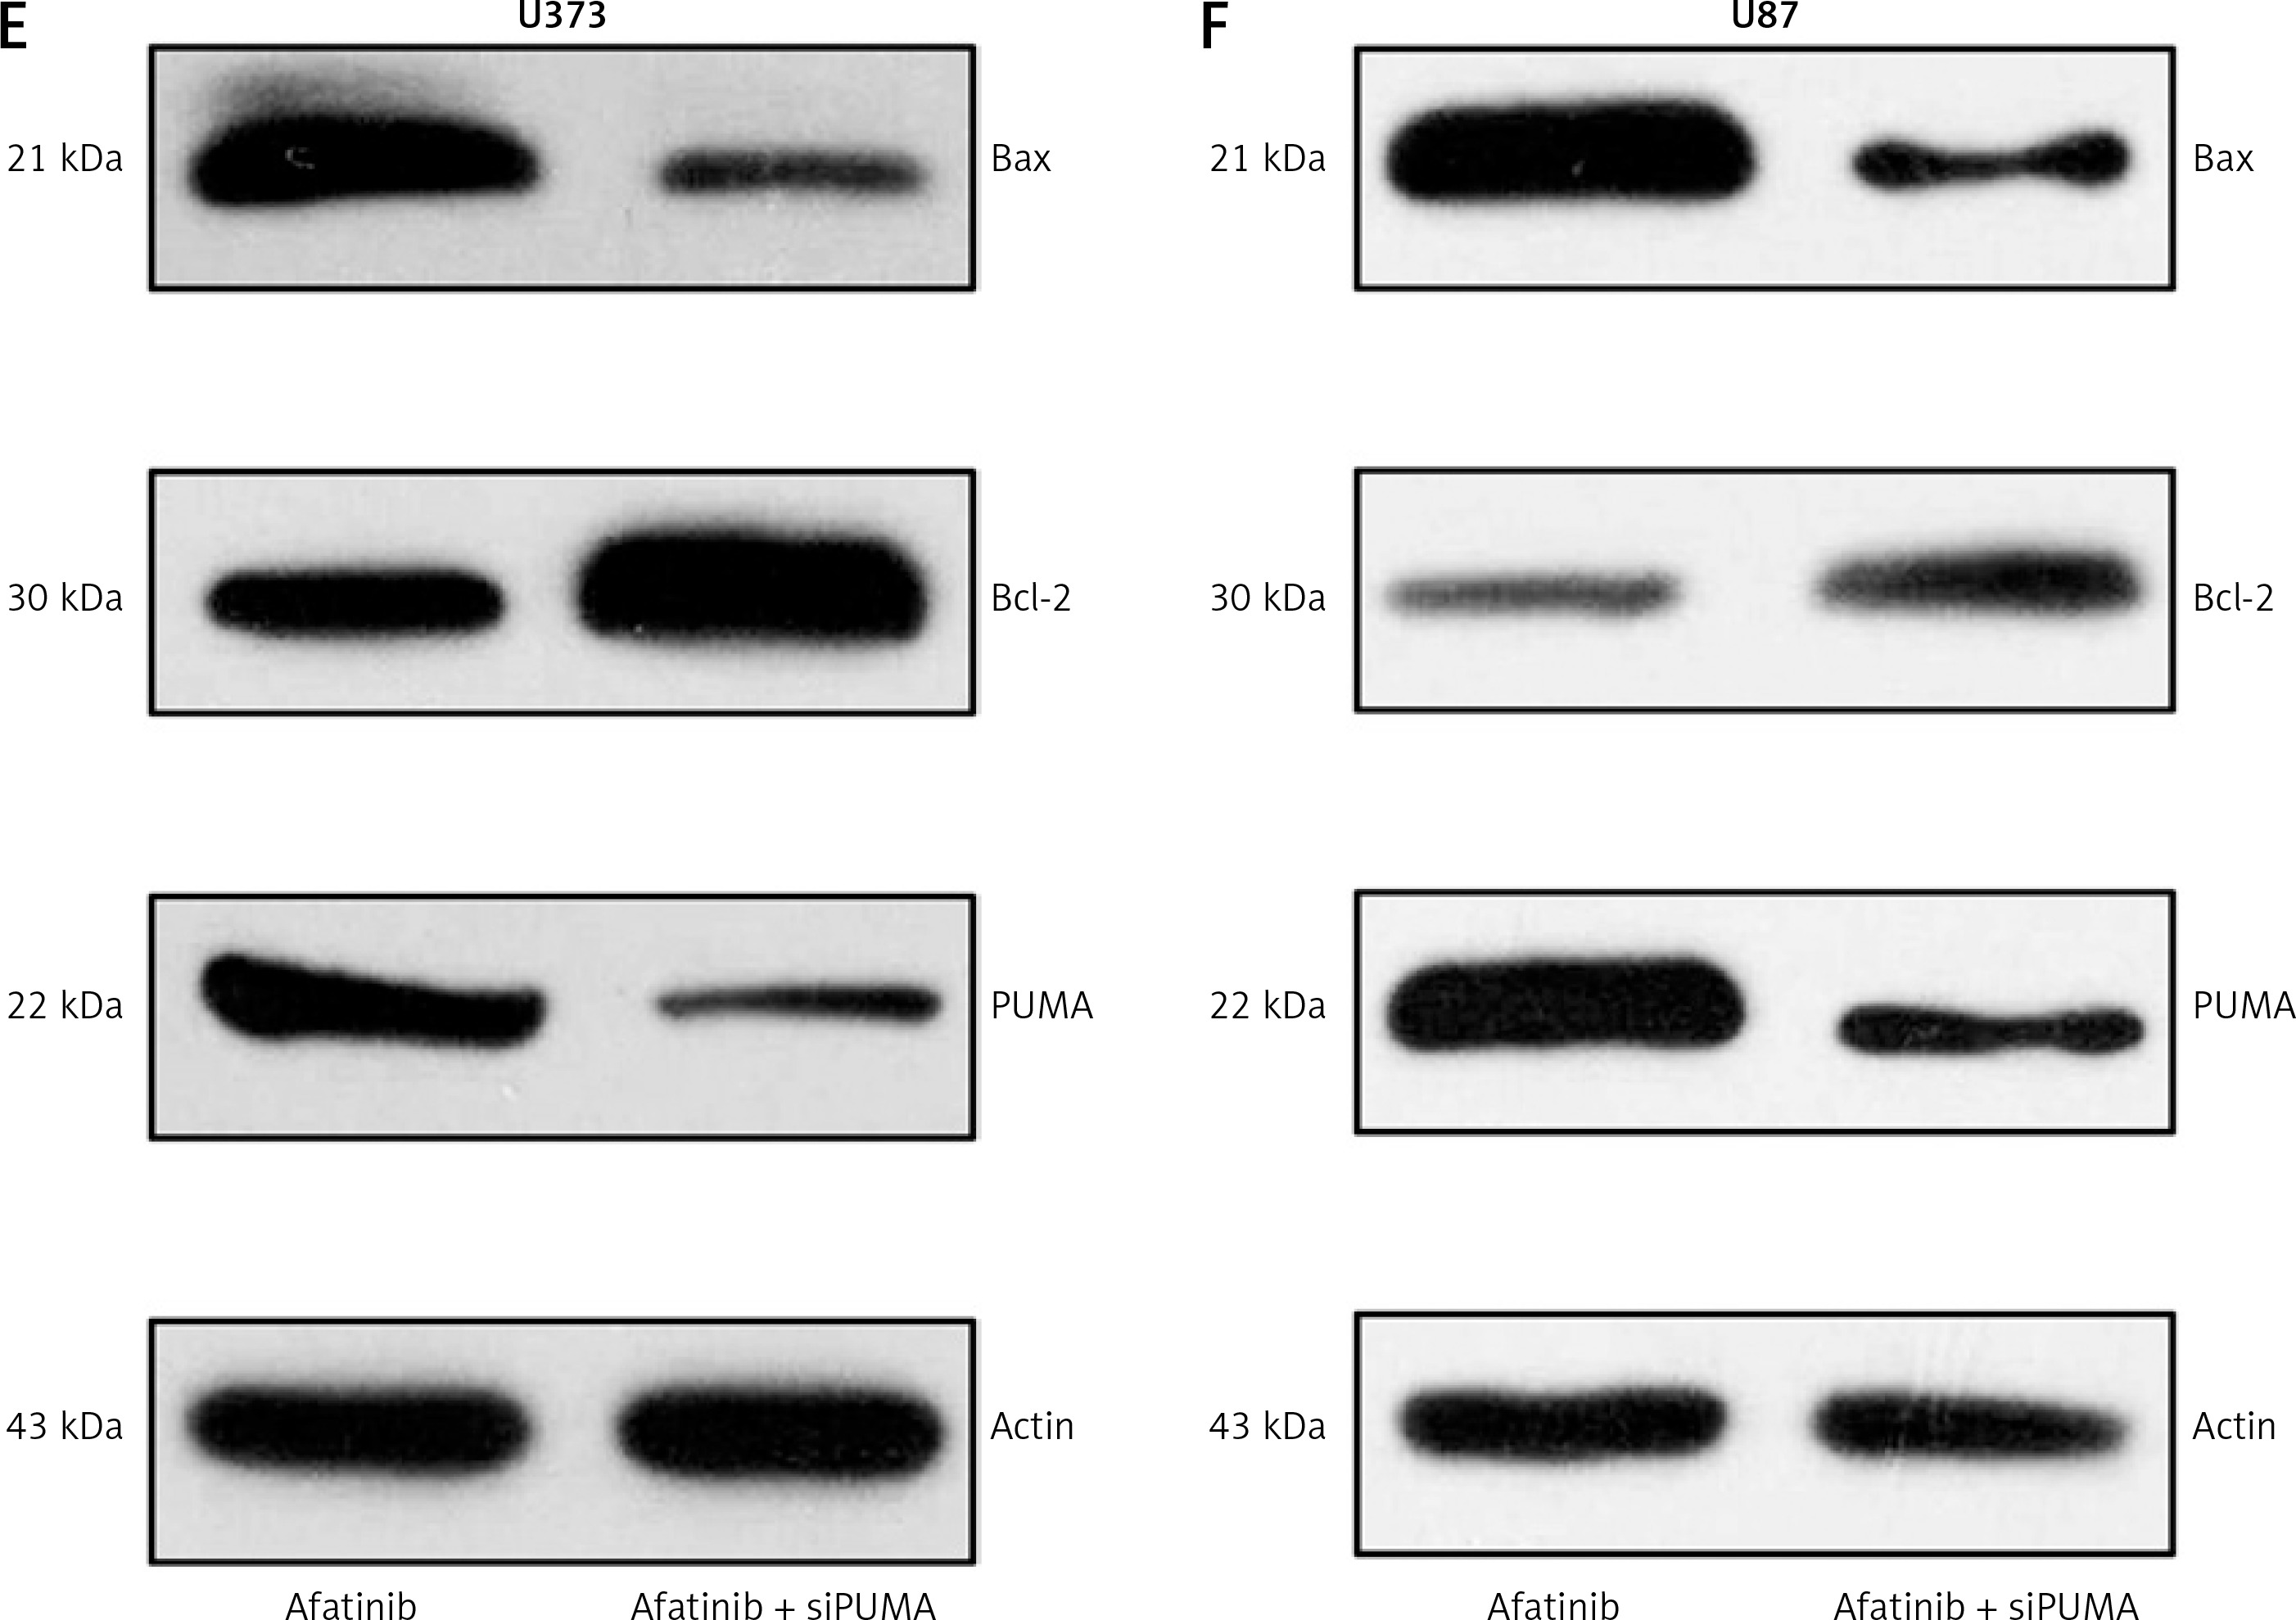
First, the overexpressing cells were investigated. In the PUMA-overexpressing U373 and U87 cells, there was an increase in the inhibition of cell growth caused by afatinib treatment (Figures 4 A, B). Annexin V/PI FC also indicated that PUMA overexpression led to an increase in the number of apoptotic cells induced by afatinib (Figures 4 C, D). Overexpression of PUMA also increased the expression of Bax and reduced the Bcl-2 level (Figures 4 E, F). PUMA was then silenced in afatinib-treated U373 and U87 cells by the transfection of siRNA-PUMA. The colony formation assay showed that silencing PUMA restored the colony number that had been impaired by afatinib in both cell lines (Figures 5 A, B). Silencing PUMA also reduced the number of apoptotic cells, which were elevated by afatinib treatment (Figures 5 C, D). Additionally, silencing reduced Bax expression and increased Bcl-2 expression in the afatinib-treated U373 and U87 cells (Figures 5 E, F). Altogether, these data indicate that in this study, in vitro afatinib treatment reduced glioma cell growth through PUMA-mediated apoptosis.
Figure 4
Influence of PUMA overexpression on growth and apoptosis of afatinib-treated glioma cells. U373 and U87 cells with overexpressed PUMA were subjected to 10 μM afatinib for 2 days. A, B – Soft agar colony formation assay was utilized to determine the cell number at 48 h after afatinib treatment. C, D – Annexin V/PI FC was employed to reveal the apoptosis rate in both glioma cell lines after treatment. The early apoptotic population of the cells is visible in the upper right quadrant of each plot. E, F – Western blotting results reveal that PUMA overexpression regulated the expression of Bcl-2 and Bax in U373 and U87 cells. N = 3; *p < 0.05 (vs. indicated group)
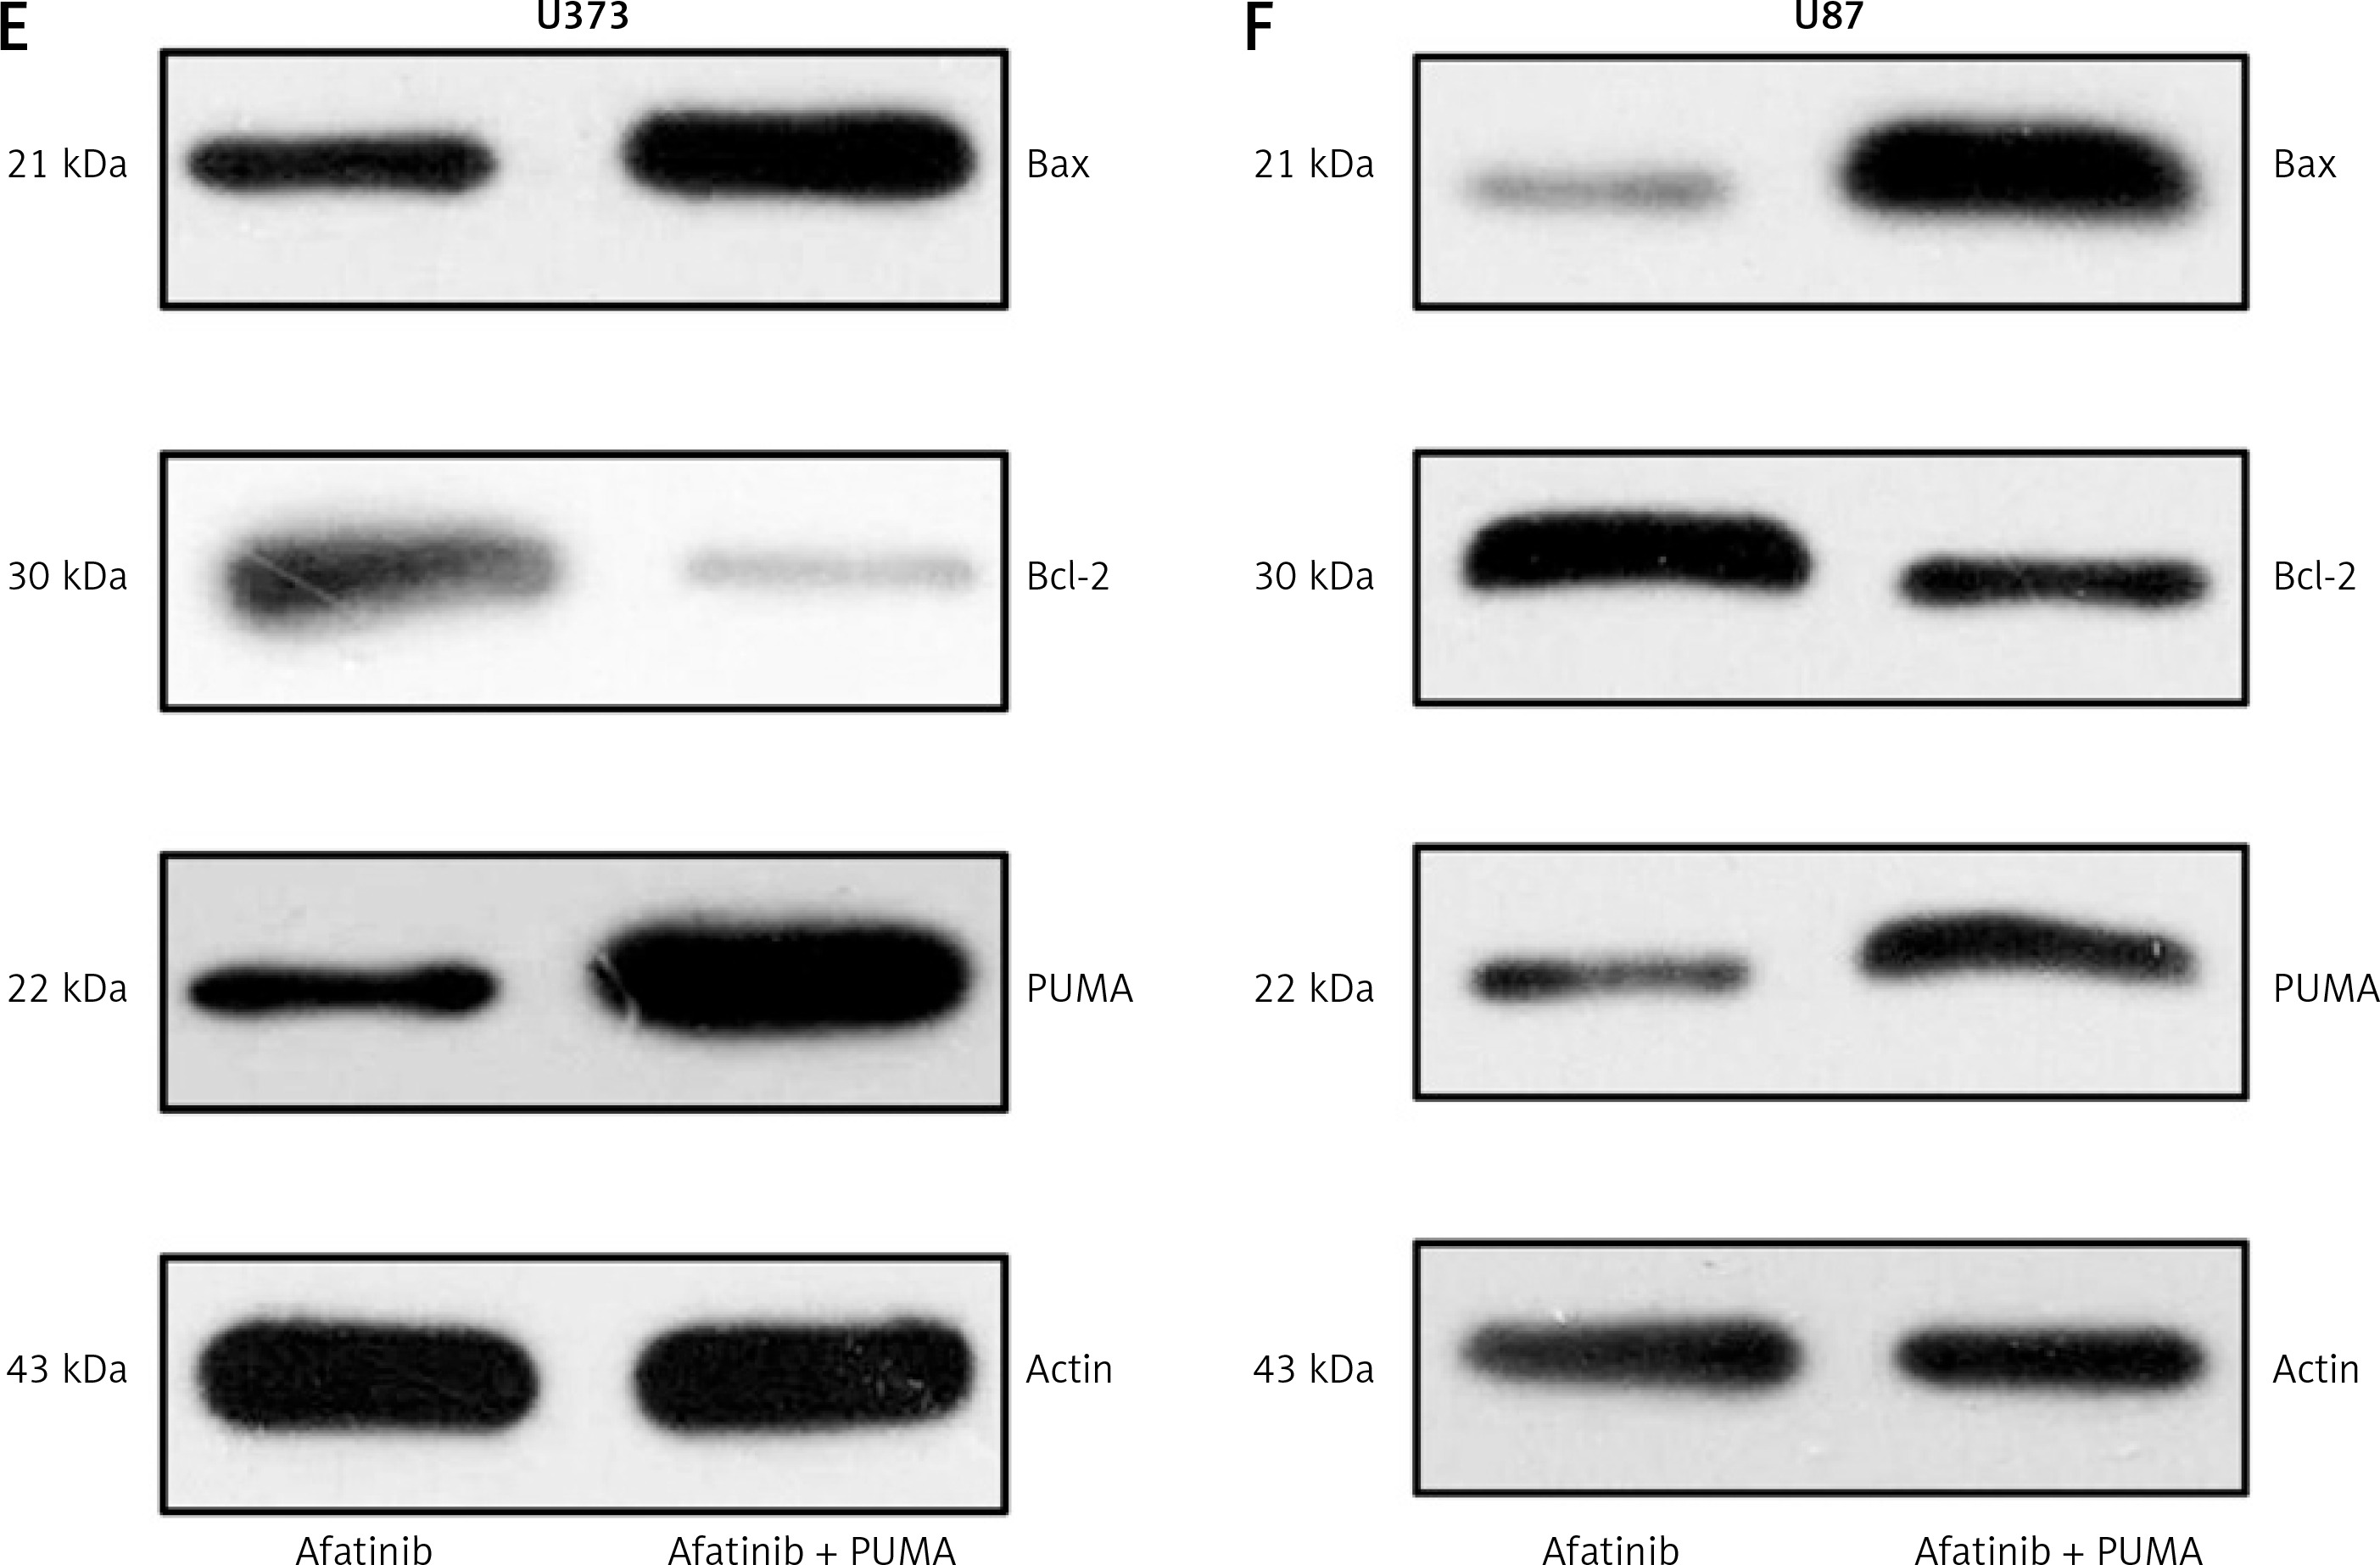
Figure 5
Influence of PUMA silencing on growth and apoptosis of afatinib-treated glioma cells. U373 and U87 cells with silenced PUMA were treated with 10 μM afatinib for 2 days. A, B – Soft agar colony formation assay was used to detect the number of cells at 48 h after afatinib treatment. C, D – Annexin V/PI FC was employed to reveal the apoptosis rate in both glioma cell lines after treatment. The early apoptotic population of the cells is visible in the upper right quadrant of each plot. E, F – Western blotting results reveal that PUMA silencing regulated the expression of Bcl-2 and Bax in U373 and U87 cells. N = 3; *p < 0.05 (vs. indicated group)
Reduction of xenograft tumors through PUMA by afatinib administration
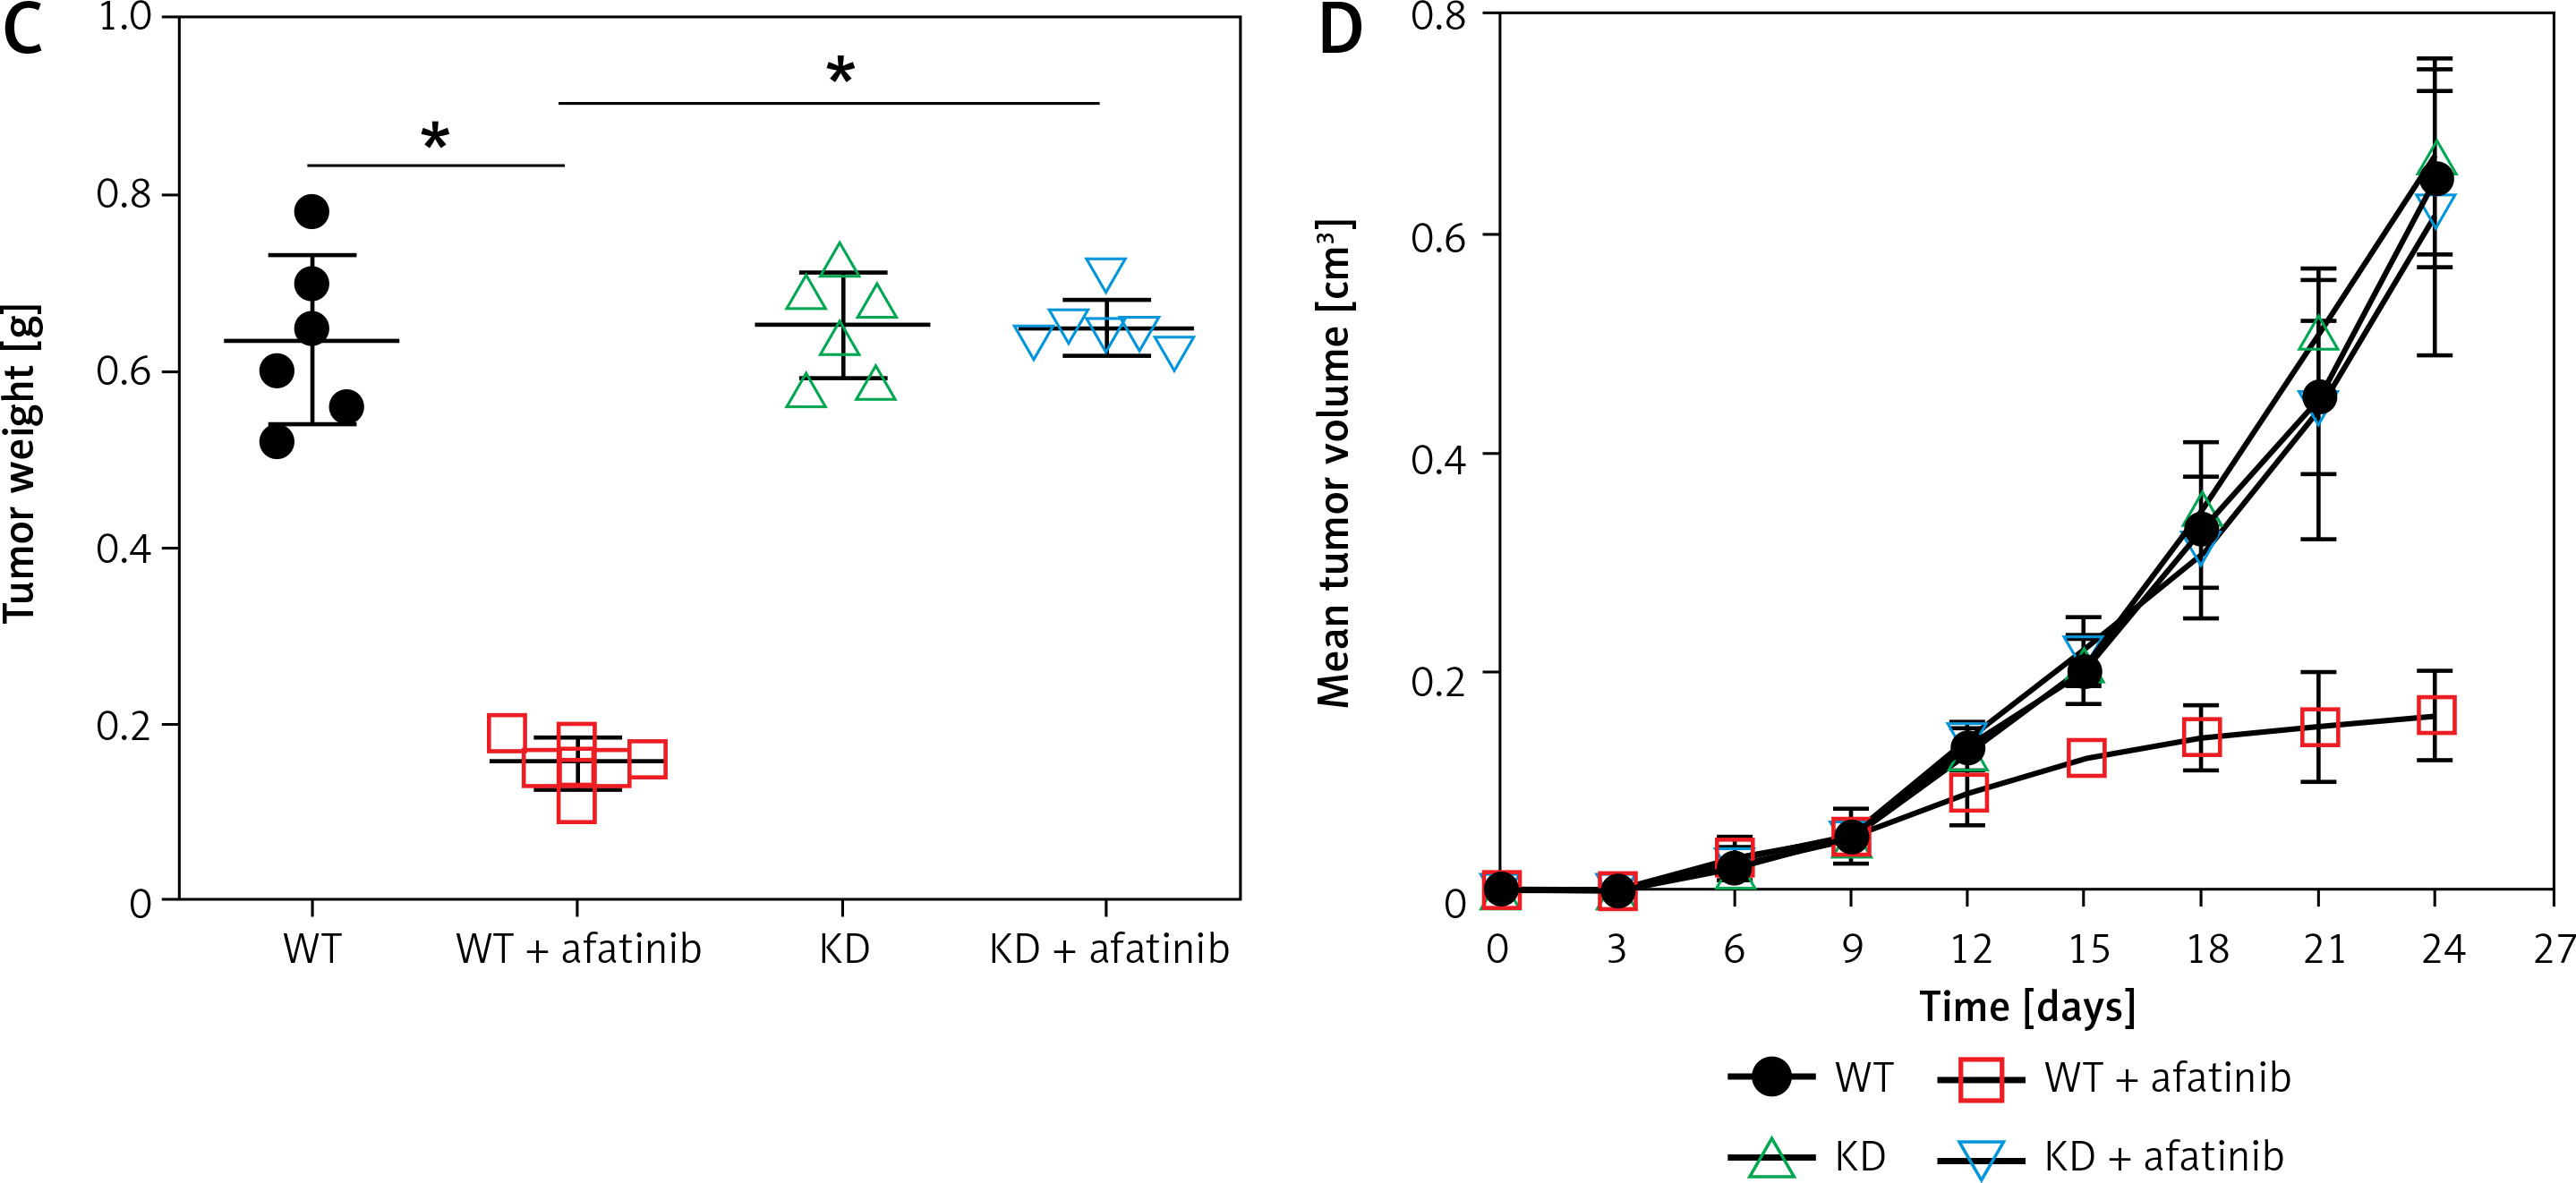
To further reveal the effect of afatinib and PUMA on glioma xenograft tumors in nude mice, U373-MG cells or U373-MG cells with PUMA knockdown (KD) were injected into the right flanks of female nude mice. The successful KD of PUMA was confirmed by Q-PCR and WB (Figures 6 A, B). Afatinib administration clearly reduced the tumor weight (Figure 6 C), and afatinib-treated tumors grew at a significantly slower rate than the vehicle-treated tumors (Figure 6 D). In the KD tumors, the downregulation of PUMA notably reduced the anti-tumor efficiency of afatinib, as evidenced by a restored tumor weight and tumor growth rate (Figures 6 C, D). Additionally, WB data showed that in PUMA KD tumor cells, Bcl-2 expression was higher, whereas Bax expression was lower than those in WT tumor cells (Figure 6 B). Altogether, these data indicate that in vivo afatinib administration reduced xenograft tumors through PUMA.
Figure 6
Influence of afatinib administration on wild type (WT) and PUMA knockdown mouse xenograft tumors. U373-MG cells with PUMA knockdown (KD) or control cells were subcutaneously injected in nude mice (n = 6). A – Quantitative PCR revealed the mRNA expression of PUMA in WT and PUMA knockdown mouse xenograft tumors. B – Western blotting showed the protein expression of PUMA, Bcl-2, and Bax in WT and PUMA knockdown mouse xenograft tumors. C – Xenograft tumor weight was determined 25 days after injection. D – Tumor growth curve at 0–24 days after injection. N = 3; *p < 0.05l; **p < 0.01 (vs. control group)
Discussion
Aggressive treatment methods involving surgery, radiation therapy, and/or temozolomide fail to considerably improve the chances of survival for patients with glioblastoma [24]. Most patients with glioblastoma are troubled by recurrence, which contributes to the universal fatality, indicating that it is imperative to investigate the disease and develop new therapies that increase survival rates. This study explored the potency of afatinib in glioma cell culture and mouse models and found that afatinib suppressed the proliferation and survival of glioma cells in a dose-dependent manner through the induction of cell apoptosis. Moreover, afatinib treatment also increased PUMA expression in treated cells. Overexpression and silencing of PUMA in glioma cells further affected the pro-apoptotic effect of afatinib, promoting and counteracting it, respectively. Remarkably, our in vivo study indicates that afatinib may repress tumor growth and trigger apoptosis via PUMA in xenograft tumor mouse models. However, only one cell line, U373, was used in the animal experiment; that is because we failed to carry out the xenograft model in mice with U87 cells in three independent experiments.
Previous reports have indicated that afatinib displays synergistic cytotoxicity with other compounds in diverse cancer cells [25–27]. Afatinib monotreatment has also been reported to induce apoptosis in non-small-cell lung carcinoma (NSCLC) cell lines [23], head and neck squamous cell cancer [28], neuroblastoma [29], bladder cancer [30], and retinoblastoma [31]. Therefore, we aimed to determine whether single afatinib treatment leads glioma cells to death. In this study, we found that afatinib significantly increased the apoptotic cell number in two glioma cell lines in a dose-dependent manner. Moreover, PUMA expression was demonstrated to be involved in afatinib-mediated cell death in vivo and in vitro. These findings indicate an explanation for the underlying mechanism of the effect of afatinib administration on tumor cell death and suggest that afatinib is still an effective compound for glioma therapy.
PUMA is a member of the BH3-only subgroup of the Bcl-2 family; once transactivated by p53, it triggers apoptosis to respond to genotoxic stresses [32]. Once stimulated by non-genotoxicity stress, such as ischemia/reperfusion and cytokine/growth factor loss, PUMA is activated by other transcription factors to elicit p53-independent apoptosis [33]. Biochemical studies indicate that genotoxicity and non-genotoxicity could contribute to the triggering of apoptosis by PUMA through the interaction of Bak and/or Bax with other Bcl-2 family members, thereby damaging mitochondria and activating caspase [34]. In our study, both Q-PCR and WB assay showed that afatinib treatment could upregulate PUMA in glioma cell lines. Ectopic PUMA overexpression augmented the pro-apoptotic effects of afatinib in glioma cells, whereas PUMA silencing abated the effect of afatinib. Afatinib administration caused a reduction of tumor size in xenograft mice, whereas PUMA knockdown decreased the effect of afatinib treatment on tumor growth in vivo.
In conclusion, this work confirms that afatinib administration dramatically reduces the proliferation and apoptosis of triggered glioma cell lines in vitro and significantly suppresses tumor growth in xenograft models. Afatinib dramatically decreased tumor size in xenografts in our mouse models through the induction of cell death. This study warrants further investigation into the mechanism of afatinib in glioblastoma treatment.