Introduction
Gout is a type of arthritis, which may present as chronic tophaceous gout due to the deposition of monosodium urate (MSU) crystals in the joints or tissues of patients with purine metabolism disorders. It is believed that the pathogenesis of acute gouty arthritis (AGA) is closely related to the NLRP3 inflammasome, interleukin-1 (IL-1) β and cyclooxygenase-2 (COX-2) [1, 2]. MicroRNAs (miRNAs) are a kind of non-coding RNA in eukaryotes, which has been proved to play a key role in the regulation of inflammatory diseases [3, 4]. However, the miRNA expression profile in AGA has rarely been studied [5, 6]. Therefore, it is possible to further clarify the pathogenesis and treatment of AGA from the perspective of miRNAs.
Non-steroidal anti-inflammatory drugs (NSAID) and colchicine are the first-line drugs in the treatment of AGA. Etoricoxib, a specific COX-2 inhibitor, has been recommended by the American College of Rheumatology (ACR) as class A evidence for the treatment of AGA [7]. Colchicine may act by inhibiting the MSU crystal-induced production of NLRP3 inflammasomes, thus reducing IL-1β to treat AGA [8]. However, it is not yet certain whether colchicine and etoricoxib ameliorate AGA by specifically regulating miRNAs.
Therefore, we utilized a miRNA array to detect miRNAs differentially expressed in the plasma of patients with AGA. Differentially expressed miRNAs were verified using quantitative real-time polymerase chain reaction (qRT-PCR). Additionally, miRNAs differentially expressed before and after colchicine and etoricoxib treatment were observed.
Material and methods
Patients
In this study, 160 newly diagnosed AGA patients receiving outpatient therapies in the Gout and Endocrinology Department of the Affiliated Hospital of Qingdao University were selected as the screening subjects. The study complied with the Declaration of Helsinki, and the ethics committee of Qingdao Medical University approved the study protocol. Informed consent was provided by all patients.
The diagnostic criteria were as follows: patients who met the 2015 ACR and EULAR diagnostic criteria for AGA [9], and the asymptomatic HUA diagnostic criteria. The inclusion criteria were as follows: age 18–70 years; newly diagnosed AGA; an onset of AGA duration of less than 48 h and no administration of colchicine, NSAID or glucocorticoids; no administration of medications affecting uric acid metabolism over the last 3 months; without diseases affecting uric acid metabolism.
The exclusion criteria were as follows: repeated or intermittent onset of AGA, or acute onset of chronic gout; chronic tophaceous gout, rheumatoid arthritis, traumatic arthritis or other types of arthritis; gouty nephropathy; pregnancy and lactation; diabetes; hypertension; severe dyslipidemia; severe liver damage, alanine aminotransferase (ALT) or aspartate aminotransferase (AST) 2 times higher than upper limit of normal; severe cardiovascular and cerebral disease; malignancies.
The termination criteria were as follows: joint pain and swelling cannot be alleviated in the course of treatment; and serious adverse drug reactions that patients were not able to tolerate.
There were 25 patients who did not meet the inclusion criteria and 13 patients who did not agree to join the study. Therefore, the final eligible sample size was 122 (Figure 1). From 122 patients recruited, 60 AGA patients were randomly selected to identify differentially expressed miRNAs in the plasma. Thirty asymptomatic HUA patients and 30 healthy subjects who were age- and gender-matched and treated in the same period were included. We performed high-throughput sequencing using miRNA microarray to obtain miRNA expression profiles in 12 volunteers. Then, the differential expression of miRNAs was detected using qRT-PCR in the plasma of 60 AGA cases, 30 cases with asymptomatic HUA and 30 normal subjects, including the volunteers.
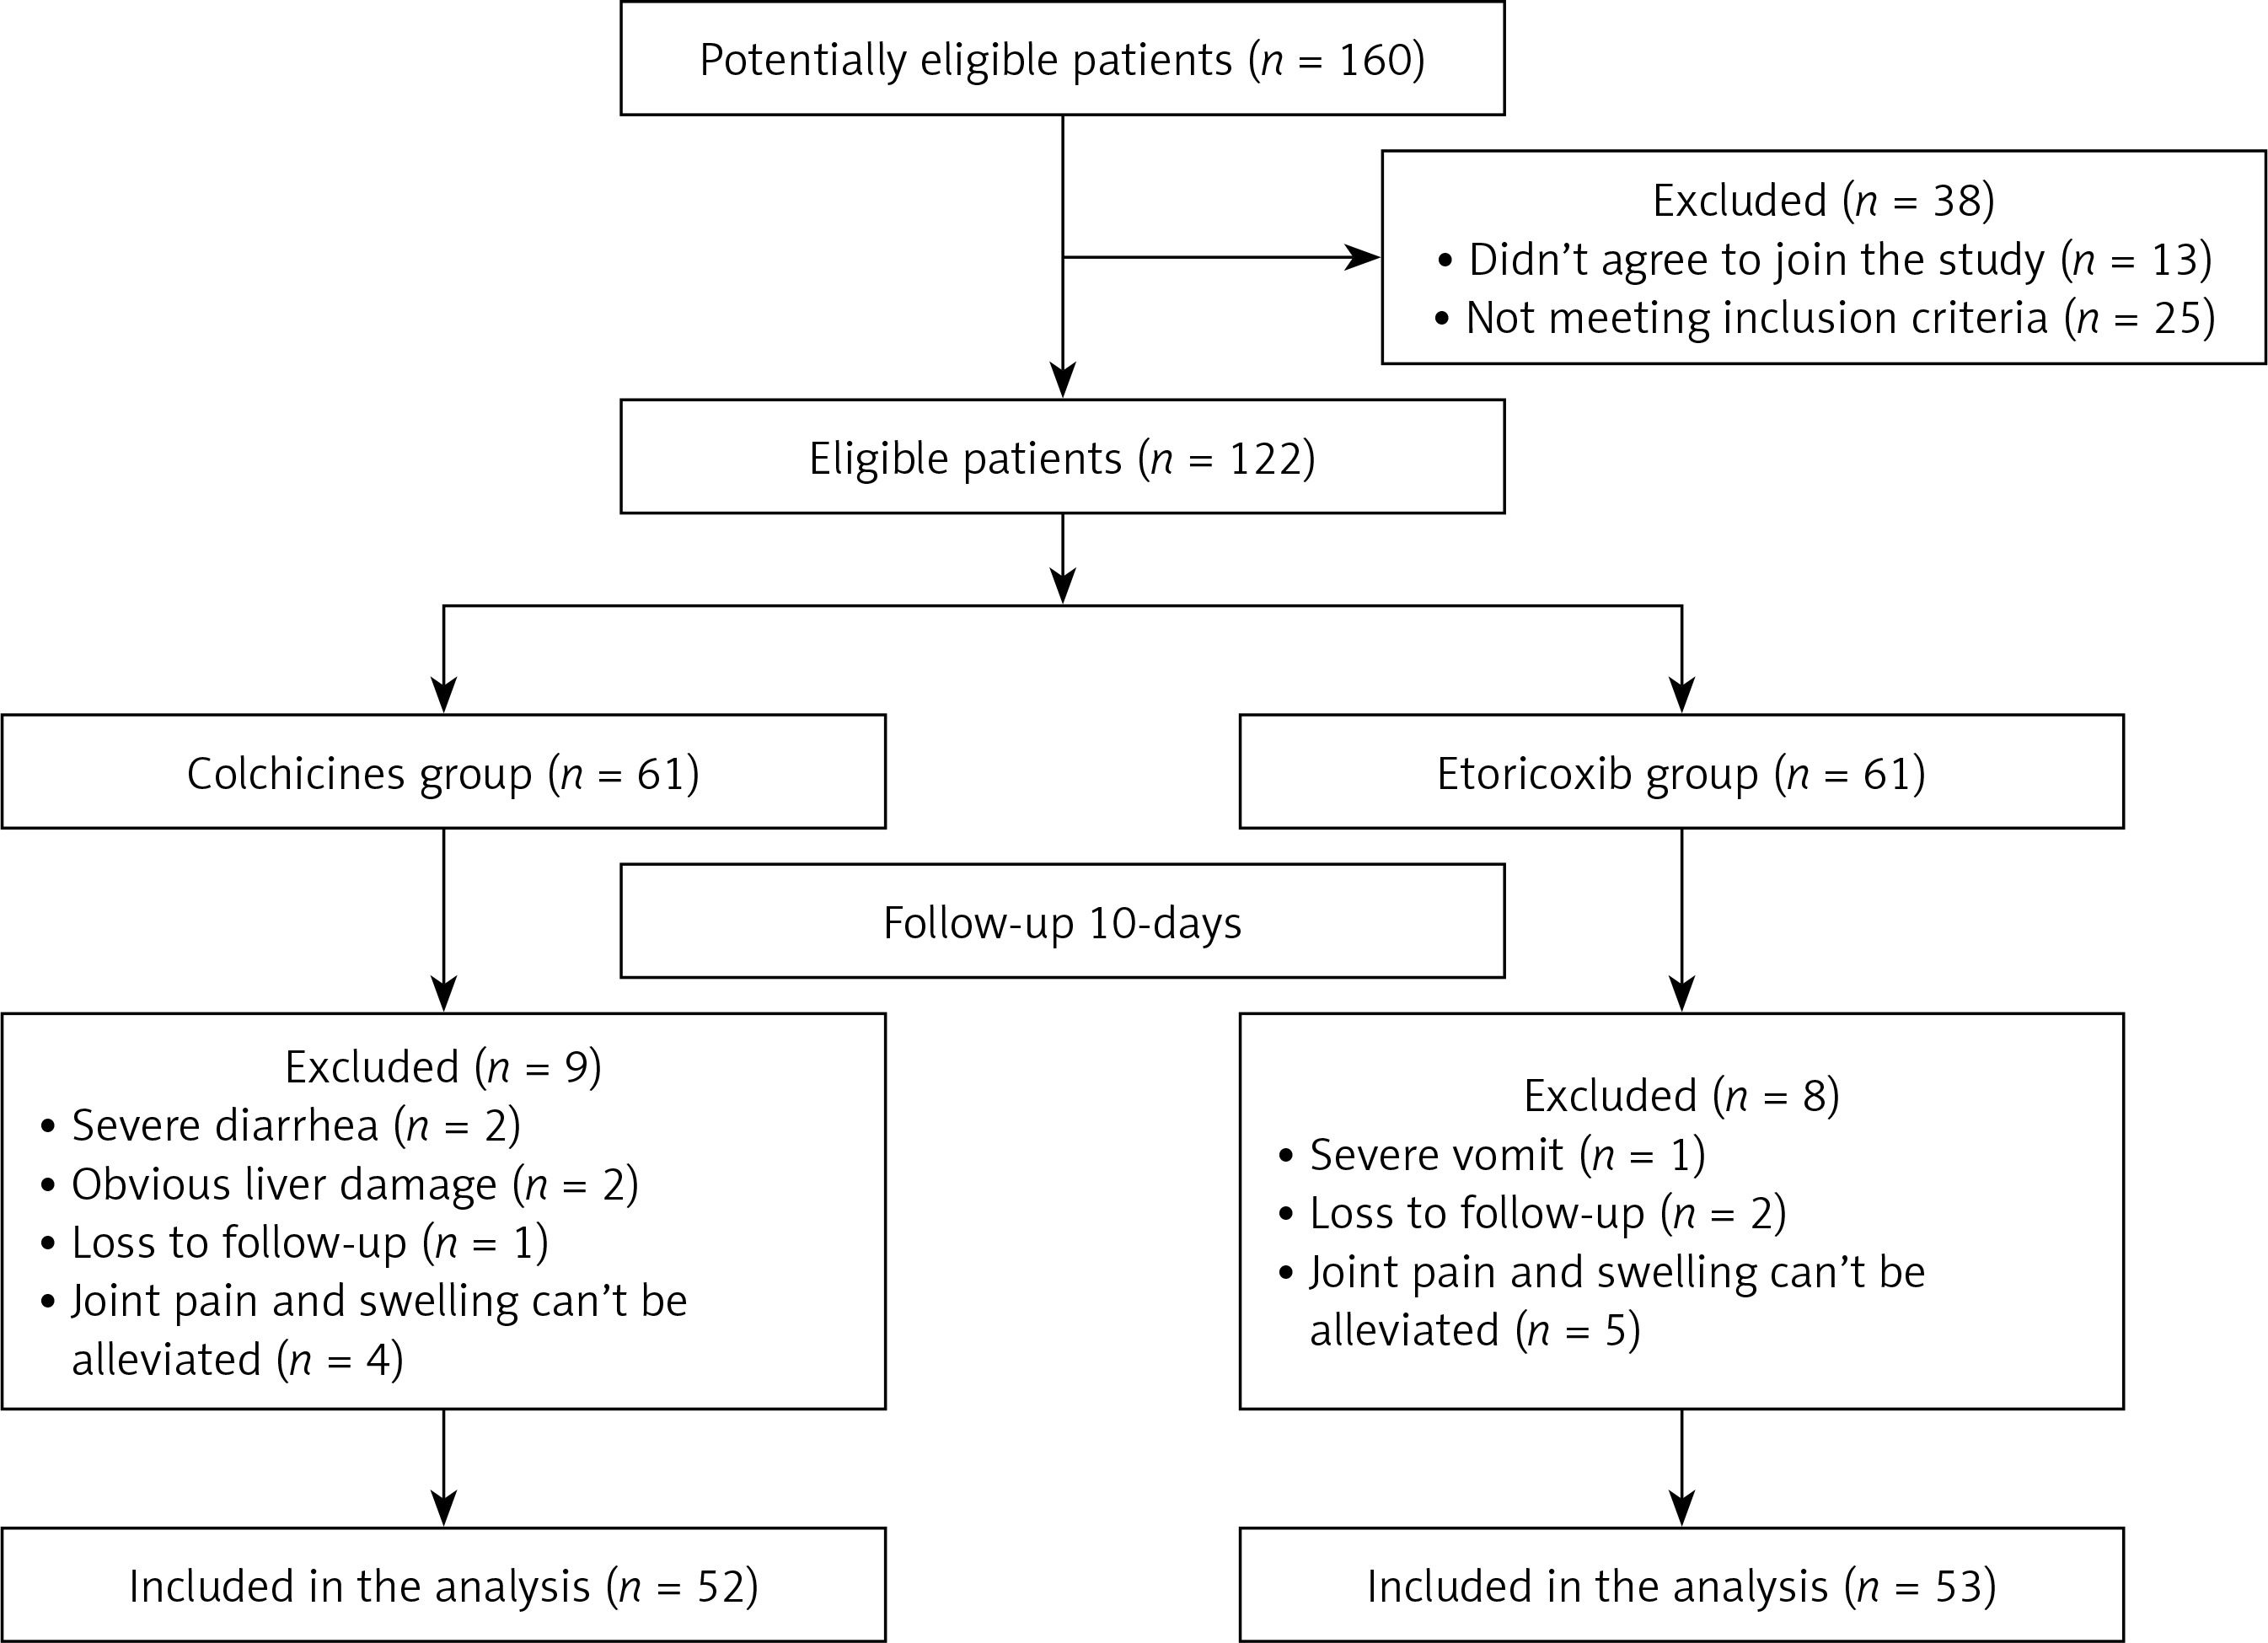
Additionally, we conducted a randomized double-blind and parallel-controlled study. A co-investigator randomized 122 patients in two-member blocks to the colchicine or etoricoxib group on the basis of a computer generated random number table previously established by a statistician. The colchicine group had 52 patients (excluding 2 patients with severe diarrhea, 2 patients with liver damage, 4 patients with unrelieved joint pain and swelling, and 1 patient lost to follow-up), and the etoricoxib group included 53 patients (excluding 1 patient with severe vomiting, 5 patients with unrelieved pain and 2 patients lost to follow-up) (Figure 1).
Methods
RNA extraction
The blood samples were collected from peripheral veins using EDTA tubes. Plasma was obtained by centrifugation at 2000 g for 20 min, and 250 μl of plasma was used to isolate RNA samples. Total RNA was harvested using TRI reagent BD (MRCgene, TB-126) according to the manufacturer’s instructions, which efficiently recovered all RNA species, including miRNAs. RNA quality and quantity were measured using a NanoDrop spectrophotometer (ND-1000, NanoDrop Technologies).
miRNA array
The 12 RNA samples from 4 AGA patients, 4 asymptomatic HUA and 4 healthy controls (age- and gender-matched) were labeled using the miRCURY Hy3/Hy5 Power labeling kit and hybridized on the miRCURYTM LNA Array (v.18.0) (Exiqon, Vedbaek, Denmark). The reaction mix for each microfluidic card was prepared by adding 360 μl of H2O and 450 μl of TaqMan Universal PCR Master Mix 2× to 90 μl of diluted and preamplified cDNA. The product of this reaction was incubated at 95°C for 10 min, followed by 40 cycles of 95°C for 15 s and 60°C for 1 min. The real-time PCR instrument ViiATM7 was used to perform the reactions. Then the slides were scanned using the Axon GenePix 4000B microarray scanner (Axon Instruments, Foster City, CA). The data were extracted from scanned images using GenePix Pro 6.0 software (Axon).
Verifying miRNA array data by qRT-PCR
cDNA was synthesized from total RNA using microRNA-specific, stem-loop RT primers and reagents from the TaqMan microRNA Reverse Transcription Kit (ABI, Foster City, USA), following the manufacturer’s protocol. Real-time PCR was performed in triplicate on the ViiATM 7 Real-time PCR System (ABI, Foster City, USA). The SYBR Green PCR Master Mix (ABI) was used to confirm the relative expression levels of differentially expressed microRNA. The miRNA primers were designed using Primer 5.0 software. Each plasma sample had 3 replicates, and the average of the 3 replicates was taken as the final result. Data analysis for qRT-PCR was performed by the comparative threshold cycle (Ct) method. MiR-39 is a synthetic Caenorhabditis elegans miR-39 miRNA mimic (cel-miR-39, Qiagen, Hilden, Germany) that served as the spike-in control to monitor the effectiveness of RT-PCR and quantitative PCR. Cel-miR-39 demonstrated both stable and moderate abundance Ct values (27.45 ±0.52) in all subjects. The relative expression of each miRNA after normalization to cel-miR-39 was determined by the 2– Δ Ct method.
Methods of drug intervention
All patients were given a low-purine diet and forbidden from smoking and drinking alcohol, and were required to drink enough water, 2500–3000 ml daily. All patients were also given sodium bicarbonate 1.0 g three times daily orally to alkalinize the urine. Meanwhile, all patients were required to stay in bed and avoid overtiring, cold and tension. Patients in the colchicine group received colchicine 0.5 mg orally (Xishuangbanna Pharmaceutical Co., Ltd.), 3 times daily, for 5 days, later changed to once daily. Patients in the etoricoxib group received etoricoxib 120 mg orally (Hangzhou MSD Pharmaceutical Co., Ltd), once daily, for 5 days, later changed to 60 mg orally once daily. Differentially expressed miRNAs, IL-1β and COX-2 were detected at the beginning of the experiment and at 5 days and 10 days after treatment. The total courses of treatment were 10 days.
The primary outcome measure was changes of expression of 2 differential miRNAs between groups before and after 10-day treatment. The secondary end-points included changes of expression of 2 differential miRNAs after 5-day treatment, and changes of joint pain scores, IL-1β and COX-2 after 5- and 10-day treatment.
Before and after treatment, all patients underwent measurements of height, weight and blood pressure. The joint pain scores were recorded in patients’ diaries. The differential expression of miRNAs was detected according to the methods mentioned above. ELISA technique was used to detect IL-1β and COX2. The ELISA kit was purchased from CloudSeq Biotech Inc. and used according to the manufacturer’s instructions. Biochemical indicators including white blood cells (WBC), fasting plasma glucose (FPG), blood lipids, ALT, and AST were detected. The above detected indexes were measured by two experienced technicians, who were unaware of treatment allocation.
Statistical analysis
Statistical significance was accepted at α = 0.05 and β = 0.2 (power of a test 80%). Based on the literature [10], it was predicted that the differentially expressed miRNAs in the colchicine group would change about 30% as compared with the etoricoxib group. With a drop-out rate of approximately 20%, at least 48 subjects would be needed in each group. Considering poor efficacy and unrelieved pain, 160 total subjects were included.
Data were analyzed using SPSS 16.0 statistical software (SPSS Inc., Chicago, IL, USA). Normality of distributions was evaluated by the Shapiro-Wilk statistic. The normally distributed data were expressed as means ± standard deviation (SD). Continuous variables were analyzed using Student’s t test. Pearson’s correlation coefficient was used to analyze the correlation between variables. Two differentially expressed miRNAs were compared at different time points by repeated measures analysis of variance (ANOVA). The intention-to-treat (ITT) analysis and the per-protocol (PP) analysis were carried out on the main outcome measure. Statistical significance was considered at p < 0.05.
Results
Intergroup comparison of baseline characteristics
No statistically significant differences in baseline characteristics were found between groups (p > 0.05, Table I).
Table I
Baseline characteristics of study participants in drug intervention trial
Screening for differentially expressed miRNAs
When compared with normal control and asymptomatic HUA groups, the expression of 21 miRNAs was either up-regulated or down-regulated more than 2-fold in the plasma of AGA patients. MiR-4449, miR-4531, miR-652-5p, and miR-4654 were upregulated and miR-451a, miR-589-5p, miR-361-5p, miR-151a-3p, miR-299-5p, and miR-1307-5p were downregulated compared with normal subjects. Meanwhile, plasma of AGA patients contained 11 differentially expressed miRNAs compared with asymptomatic HUA, including miR-3146, miR-3611, miR-223-3p, miR-4763-5p, miR-374b-5p, miR-3907, miR-885-5p, miR-4646-3p, miR-4787-3p, miR-874-5p and miR-5010-3p (Table II).
Table II
Acute gouty arthritis (AGA)-specific miRNA expression profile (upregulated or downregulated 2-fold or more)
Verification of differentially expressed miRNAs by qRT-PCR
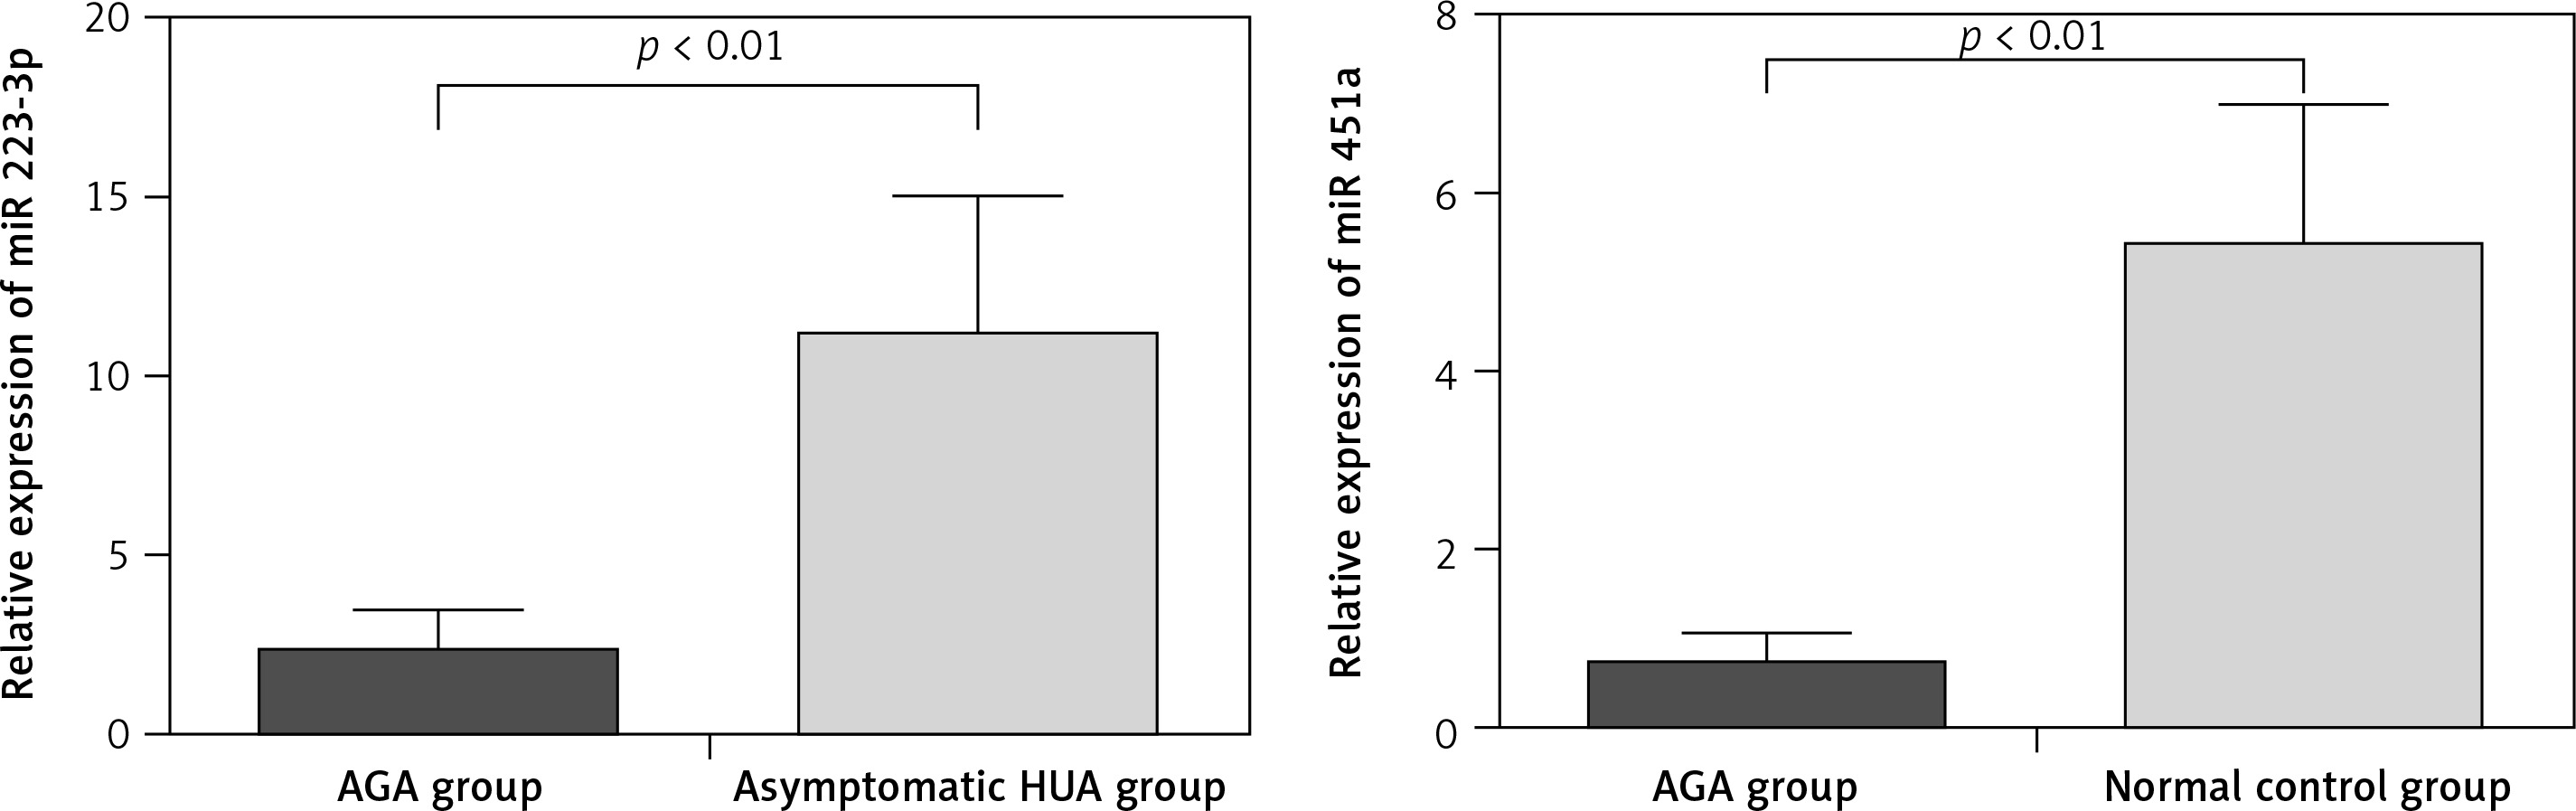
To verify the miRNA microarray results, we tested 2 miRNAs that were presumed to play a role in AGA, namely, miR-223-3p [11, 12] and miR-451a [13, 14]. The results showed that qRT-PCR was consistent with the microRNA microarray, which further verified the accuracy of microRNA array screening results (Figure 2).
Intragroup comparison of evaluation indicators before and after treatment
Compared with the baseline before treatment, joint pain scores were significantly decreased in both groups after 5 and 10 days of treatment (p < 0.05). After 5-day treatment, miR-223-3p expression was significantly upregulated (p < 0.05), IL-1β declined considerably, while miR-451a and COX-2 did not change significantly (p > 0.05) in the colchicine group. In the etoricoxib group, miR-451a was obviously upregulated and COX-2 was significantly decreased (p < 0.05). After 10 days of colchicine treatment, miR-223-3p increased and IL-1β decreased dramatically compared to pre-treatment (p < 0.05). Additionally, COX-2 decreased slightly, accompanied by a slight upregulated expression of miR-451a (p < 0.05). In the etoricoxib group, miR-451a was upregulated and COX-2 declined significantly (p < 0.05). Meanwhile, there was slight upregulation of plasma miR-223-3p and downregulation of IL-1β after etoricoxib treatment (p < 0.05, Table III).
Table III
Post-treatment changes of indexes between two groups (x ± s)
| Parameter | Change in values | |||||||
|---|---|---|---|---|---|---|---|---|
| Etoricoxib group(n = 53) | Colchicine group(n = 52) | t value | P-value | Etoricoxib group(n = 53) | Colchicine group(n = 52) | t value | P-value | |
| 5 days after treatment: | ||||||||
| White blood cells [× 109/l] | 6.78 ±1.01 | 6.65 ±1.19 | 0.566 | 0.573 | –1.99 ±1.04 | –2.30 ±1.24 | 1.364 | 0.176 |
| Joint pain scores | 2.25 ±1.07 | 2.15 ±1.24 | 0.404 | 0.687 | –4.26 ±1.50 | –4.56 ±1.47 | 1.013 | 0.314 |
| Joint swelling scores | 0.77 ±0.57 | 0.73 ±0.64 | 0.213 | 0.832 | –0.90 ±0.66 | –1.03 ±0.72 | 0.748 | 0.458 |
| Limitation of joint activity scores | 0.77 ±0.50 | 0.70 ±0.60 | 0.468 | 0.642 | –1.03 ±0.67 | –1.17 ±0.65 | 0.784 | 0.436 |
| IL-1β [pg/ml] | 33.2 ±15.3 | 29.6 ±15.9† | 1.154 | 0.251 | –2.7 ±7.2 | –8.7 ±8.4† | 3.905 | < 0.001 |
| COX-2 [pg/ml] | 16.1 ±8.2 | 20.3 ±8.8* | –2.576 | 0.011 | –4.7 ±4.1 | –0.7 ±3.9† | –5.003 | < 0.001 |
| miR223-3p | 2.62 ±1.18 | 2.88 ±1.37 | –1.045 | 0.298 | 0.15 ±0.40 | 0.67 ±0.78† | –4.282 | < 0.001 |
| miR451a | 0.95 ±0.43 | 0.79 ±0.41 | 1.948 | 0.054 | 0.17 ±0.10 | 0.05 ±0.07† | 8.035 | < 0.001 |
| 10 days after treatment: | ||||||||
| ALT [U/l] | 31.7 ±9.3 | 35.1 ±11.4 | –1.663 | 0.099 | 1.2 ±7.7 | 5.1 ±8.1* | –2.521 | 0.013 |
| AST [U/l] | 27.0 ±8.9 | 28.4 ±9.6 | –0.810 | 0.420 | 1.1 ±5.6 | 2.5 ±6.8 | –1.176 | 0.242 |
| Serum creatinine [μmol/l] | 61.3 ±11.2 | 61.6 ±11.1 | –0.135 | 0.893 | 0.4 ±8.0 | 2.1 ±5.2 | –1.283 | 0.202 |
| Serum uric acid [μmol/l] | 499 ±66 | 496 ±70 | 0.246 | 0.806 | –5 ±9 | –2 ±18 | –1.167 | 0.246 |
| Joint pain scores | 1.02 ±0.84 | 0.96 ±0.91 | 0.336 | 0.738 | –5.49 ±1.51 | –5.75 ±1.57 | 0.862 | 0.351 |
| IL-1β [pg/ml] | 25.7 ±10.9 | 17.1 ±8.1 | 4.578 | < 0.001 | –10.2 ±7.1 | –21.2 ±10.9 | 6.115 | < 0.001 |
| COX-2 [pg/ml] | 10.6 ±4.6 | 14.1 ±4.9† | –3.771 | < 0.001 | –10.1 ±7.5 | –7.0 ±5.9* | –2.388 | 0.019 |
| miR223-3p | 3.23 ±1.48 | 4.56 ±1.80† | –4.145 | < 0.001 | 0.77 ±0.89 | 2.35 ±1.08† | –8.227 | < 0.001 |
| miR451a | 1.67 ±0.66 | 1.12 ±0.54† | 4.713 | < 0.001 | 0.90 ±0.36 | 0.37 ±0.19† | 9.225 | < 0.001 |
Intergroup comparison of evaluation indicators after treatment
The results of the repeated-measures ANOVA test for comparing the variation of 2 differentially expressed miRNAs showed that miR-451a in the etoricoxib group was significantly higher than the colchicine group (F = 7.382, p < 0.05), and miR-223-3p in the colchicine group was upregulated in comparison to the etoricoxib group (F = 3.127, p = 0.080). Further comparison of differences between pre- and 5-day post-treatment confirmed that the upregulation of plasma miR-223-3p and downregulation of IL-1β induced by colchicine were more significant than etoricoxib (p < 0.05). However, the latter outperformed the former in the upregulation of miR-451a and downregulation of COX-2 (p < 0.05, Table III). When comparing the difference after treatment for 10 days, the ITT analysis showed that the magnitude of miR-223-3p upregulation in the colchicine group was significantly higher than the etoricoxib group (p < 0.05), while the etoricoxib group had higher expression of miR-451a than the colchicine group (p < 0.05, Table IV). The PP analysis was concordant with the ITT analysis. Additionally, comparison of therapy-related differences showed that the colchicine group had greater downregulation of IL-1β than the etoricoxib group, but the downregulation of COX-2 was more significant in the etoricoxib group than the colchicine group.
Table IV
ITT analysis of primary outcome measure after treatment (x ± s)
| Variable | Change in values at 5 days after treatment | Change in values at 10 days after treatment | ||||||
|---|---|---|---|---|---|---|---|---|
| Etoricoxib group(n = 61) | Colchicine group(n = 61) | t value | P-value | Etoricoxib group(n = 61) | Colchicine group(n = 61) | t value | P-value | |
| miR223-3p | 0.14 ±0.38 | 0.68 ±0.77† | –4.827 | < 0.001 | 0.69 ±0.86 | 2.08 ±1.34† | –6.806 | < 0.001 |
| miR451a | 0.18 ±0.11 | 0.04 ±0.07† | 8.423 | < 0.001 | 0.82 ±0.39 | 0.35 ±0.19† | 8.413 | < 0.001 |
Correlation analysis
We performed a linear correlation analysis for the expressions of 2 miRNAs in the plasma, IL-1β and COX-2. The results showed that miR-223-3p expression was negatively correlated with IL-1β in AGA patients (r = –0.796, p < 0.05), and miR-451a was negatively correlated with COX-2 (r = –0.633, p < 0.05).
Adverse events
One patient in the colchicine group suffered from mild vomiting with gradual remission. Four patients in the colchicine group had diarrhea during the treatment. Two patients had severe diarrhea and were withdrawn from the trial, and 2 patients had mild diarrhea with mild symptoms lasting less than 3 days, thereby not affecting the test. Additionally, 2 patients from the colchicine group had obvious abnormal liver function, and they were required to terminate the trial. Three patients in the etoricoxib group had vomiting during the treatment. One patient suffered from severe vomiting and asked to stop the treatment. Two patients had mild vomiting and were allowed to complete the trial. Additionally, 2 patients in the etoricoxib group reported mild diarrhea with mild symptoms, thereby not affecting the trial.
Discussion
In this study, we identified 21 differentially expressed miRNAs in AGA patients compared with normal controls and asymptomatic HUA, and obtained AGA-specific miRNAs expression profiles. Meanwhile, the results of qRT-PCR verified that miR-223-3p and miR-451a were specific downregulation in the AGA patients, which was consistent with gene chip by high-throughput sequencing technology.
According to TargetScanHuman (http://www.targetscan.org), miR-223-3p regulates NLRP3 expression by directly targeting the 3’-UTR of its mRNA, and then reduces IL-1β by inhibiting the inflammasome [11, 12]. Meanwhile, in this study, we found that miR-223-3p had a negative correlation with IL-1β, thus making contributions to the occurrence of AGA. MiR-451a is downregulated in many cancers and acts as a tumor suppressor gene. Previous studies have indicated that several miRNAs including miR-451a can target COX-2 [13]. Zhang et al. [14] found that miR-451a targeted CUG triplet repeat-binding protein 2, a ubiquitously expressed RNA-binding protein, known to interact with COX-2 3’-UTR and inhibit its translation. Additionally, in the present study, we found specific downregulation of miR-451a in the plasma of AGA patients. Correlation analysis suggested a significant negative correlation between miR-451a and COX-2. It was inferred that COX-2 may be the target of miR-451a in AGA patients.
The first-line drugs used to treat AGA include NSAID and colchicine. A previous study showed that COX-2 played an important role in the pathogenesis of a variety of diseases [15]. COX-2 in AGA was dramatically upregulated, further promoting progression of gout-related inflammation. As a specific inhibitor of COX-2, etoricoxib has been recommended by the ACR to treat AGA [7]. Colchicine is still a specific drug for AGA, which can inhibit the MSU crystal-induced production of NLRP3 inflammasomes and reduce the production of IL-1β. Our results showed that joint pain treated by colchicine and etoricoxib decreased considerably. In addition, the number of drop-out cases due to poor efficacy did not differ between groups. Therefore, both colchicine and etoricoxib were considered ideal for treating AGA.
The effect of medications on miRNA expression in AGA patients is not well understood. According to the corresponding reference [10], serum inflammatory cytokines such as IL-1β and COX-2 peaked at 3–5 days after the onset of AGA. Meanwhile, according to 2011 recommendation for the diagnosis and management of gout and hyperuricemia made by the European League Against Rheumatism (EULAR), oral colchicine and NSAID should be necessary to continue treatment for an additional 10 days for AGA [16]. Therefore, we treated the AGA patients with etoricoxib and colchicine for 10 days and changes of biochemical indices were characterized starting from 5 days. We found that colchicine was more effective in upregulating miR-223-3p and reducing IL-1β than etoricoxib, while etoricoxib was more effective in upregulating miR-451a and decreasing COX-2 than colchicine. It is suggested that colchicine may play an important role in the treatment of AGA by upregulating plasma miR-223-3p and decreasing IL-1β, while etoricoxib may treat AGA by upregulating miR-451a and downregulating COX-2.
It should be pointed out that the effects of colchicine and etoricoxib therapy on miRNAs in AGA patients may be complex. As is well known, AGA is a self-limited disease. A previous study showed that colchicine did not have an inhibitory effect on COX-2 [17]. However, in the present study, COX-2 decreased after 10 days of colchicine treatment, accompanied by slightly upregulated expression of miR-451a. Therefore, miR-451a was likely to be involved in the self-healing process of AGA. Additionally, there was mild upregulation of plasma miR-223-3p and downregulation of IL-1β after etoricoxib treatment. This also suggested that miR-223-3p may play an important role in the self-healing process of AGA. Meanwhile, previous studies have shown that COX-2 can promote the generation of IL-1β by regulating the NLRP3 inflammasome [18]. According to Daniels et al. [19], NSAID can suppress the activity of the NLRP3 inflammasome. Whether etoricoxib regulates the NLRP3 inflammasome by upregulating miR-223-3p remains unclear. At the same time, AGA heals spontaneously probably through the upregulation of anti-inflammatory cytokines such as transforming growth factor-β (TGF-β) 1 [20]. However, we are still uncertain about which miRNAs are involved in the spontaneous healing of AGA.
Several limitations of this study must be taken into account. Firstly, due to the small number of cases and short duration of follow-up, these conclusions need to be further confirmed by large-scale clinical trials. Secondly, in spite of repeated measurements and analysis of variance to characterize the differentially expressed miRNAs, the dynamic changes in miRNA expression still cannot be fully reflected due to the low detection frequency. Thirdly, the specific mechanism of miRNAs in AGA is not clear. For example, the secretion of IL-1β and IL-18 requires the activation of caspase-1, which is regulated by NLRP3 [21]. Therefore, IL-18 may also be the target gene of miR-223-3p. Additionally, Moriya et al. [22] found that IL-17 was one of the targets of miR-223-3p. However, we did not verify whether there was targeting regulation of miR-223-3p and IL-17 in AGA patients. Therefore, the role of miR-223-3p and miR-451a in the pathogenesis of AGA needs further study.
In conclusion, 21 differentially expressed miRNAs were detected in the plasma in AGA patients compared with normal subjects and asymptomatic HUA patients. Colchicine could upregulate miR-223-3p and downregulate IL-1β in the plasma, while etoricoxib may treat AGA by upregulating miR-451a and downregulating COX-2.