Introduction
Breast cancer is a complex multiple process influenced by multiple factors. It is considered that specific gene polymorphisms have effects on gene transcription, mRNA stability and protein activity [1]. Multi-functional cytokines involved in the process of inflammatory and immunological responses are closely associated with the pathogenesis of autoimmune and malignant diseases, making them potential risks for breast cancer [2–4]. The interleukin 1 gene family located on chromosome 2q14.2 includes three members: IL-1α, IL-1β and IL-1 receptor antagonist (IL-RA) encoded by IL-1RN [5]. Interleukin 1α and IL-1β are potent proinflammatory cytokines, whereas IL-RA is an anti-inflammatory cytokine [6]. Interleukin 1β can be produced by various cells and it modifies the process of host response to microbial invasion, tissue injury and inflammation [7].
The interleukin 1β gene has three potentially functional SNPs: –31 (rs1143627, C>T), –511 (rs16944, C>T) in the promoter region and +3954 (rs1143634, C>T) in exon 5 [8, 9]. So far, many studies have been conducted to assess the relations between the three SNPs (rs16944, rs1143634 and rs1143627) in IL-1β and breast cancer risk [10–20]. However, the results remain conflicting. Therefore, we performed this meta-analysis in order to obtain a more precise evaluation of these links.
Material and methods
Literature search
Relevant studies published before June 1st, 2018 were identified through a search in PubMed, Embase, and Web of Science using a combination of the following terms: (“polymorphism” or “SNP” or “single nucleotide polymorphisms”), (“breast cancer” or “breast carcinoma” or “breast tumor”) and (“Interleukin-1” or “IL-1β” or “Interleukin-1 beta”). The references from the eligible articles or textbooks were also manually searched by us to find additional potential sources.
Inclusion and exclusion criteria
The criteria for studies in our meta-analysis are as follows: (a) studies concentrated on relations between IL-1β polymorphisms and breast cancer risk; (b) providing sufficient data for the frequencies of alleles and genotypes; (c) published in English. Studies were excluded when: (a) they were not case-control studies; (b) did not supply complete and essential information; (c) they were meta-analyses, reviews, or editorial articles.
Data extraction
Data were extracted from each publication independently by two authors (Wang and Yuan) based on the inclusion criteria mentioned above. For each study, the data were collected as follows: the first author, year of publication, country of origin, ethnicity, menopausal state, numbers of patients and controls, source of controls, mutation detection methods, genotyping methods, minor allele frequency (MAF), allele and genotype frequencies and the evidence of Hardy-Weinberg equilibrium (HWE) in controls. Disputes were settled by consulting with a third author if disagreements occured.
Statistical analysis
In order to assess the strength of associations between IL-1β gene polymorphisms and breast cancer susceptibility under five genetic models which include the allele model, dominant model, recessive model, homozygous model and the heterozygous model, crude odds ratios (ORs) with their corresponding 95% confidence intervals (CIs) were adopted [21–24]. Hardy-Weinberg equilibrium in control groups was estimated using the χ2 test. The pooled OR’s statistical significance was verified using the Z test with a two-tailed p < 0.05 which is regarded as statistically significant. Between-study variations and heterogeneities were evaluated using either Cochran’s Q-statistic or I2 test. When the result is a p-value < 0.05 or I2 > 50%, it indicates the existence of heterogeneity among studies; only in this circumstance was the random effects model (DerSimonian Laird method) used. If not, the fixed effects model (Mantel-Haenszel method) was performed. In order to explore sources of heterogeneity, we performed subgroup analysis with reference to ethnicity, menopausal state, source of controls and genotyping methods. Additionally, to investigate the sensitivity, we removed each study in turn to evaluate the quality and consistency of results. We used Begg’s funnel plot and Egger’s linear regression test to detect publication biases. All analyses were conducted with STATA version 12.0.
Results
Eligible studies
Four studies with controls deviating from HWE were excluded [12, 15, 18, 20]. Ten case-control studies were conducted by us to assess associations between IL-1β polymorphisms and breast cancer risk. As shown in Tables I and II, 6 studies were eligible for rs16944(C>T) including 2454 cases and 2720 controls [11, 12, 14, 16, 18, 19]. Details are as follows: 1) Caucasians, Asians, and Africans were investigated in 4, 2 and 1 studies respectively, 3 of which were associated with menopause. 2) Only 1 study was based on PB regarding the source of controls. 3) Genotype methods included TaqMan, PCR, sequencing and MALDI-TOF. For rs1143634(C>T), it was the same as above, but only two studies were qualified, which contained 996 cases and 620 controls [13, 14]. Finaly, for rs1143627(C>T), just 2413 cases and 2438 controls were involved in five studies [10, 15–17, 19]. Genotype distributions in controls of all studies were in accordance with HWE.
Table I
Characteristics of case-control studies included in the meta-analysis
Table II
Characteristics of case–control studies included in the meta-analysis
Meta-analysis
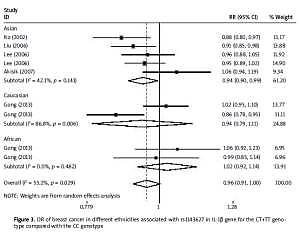
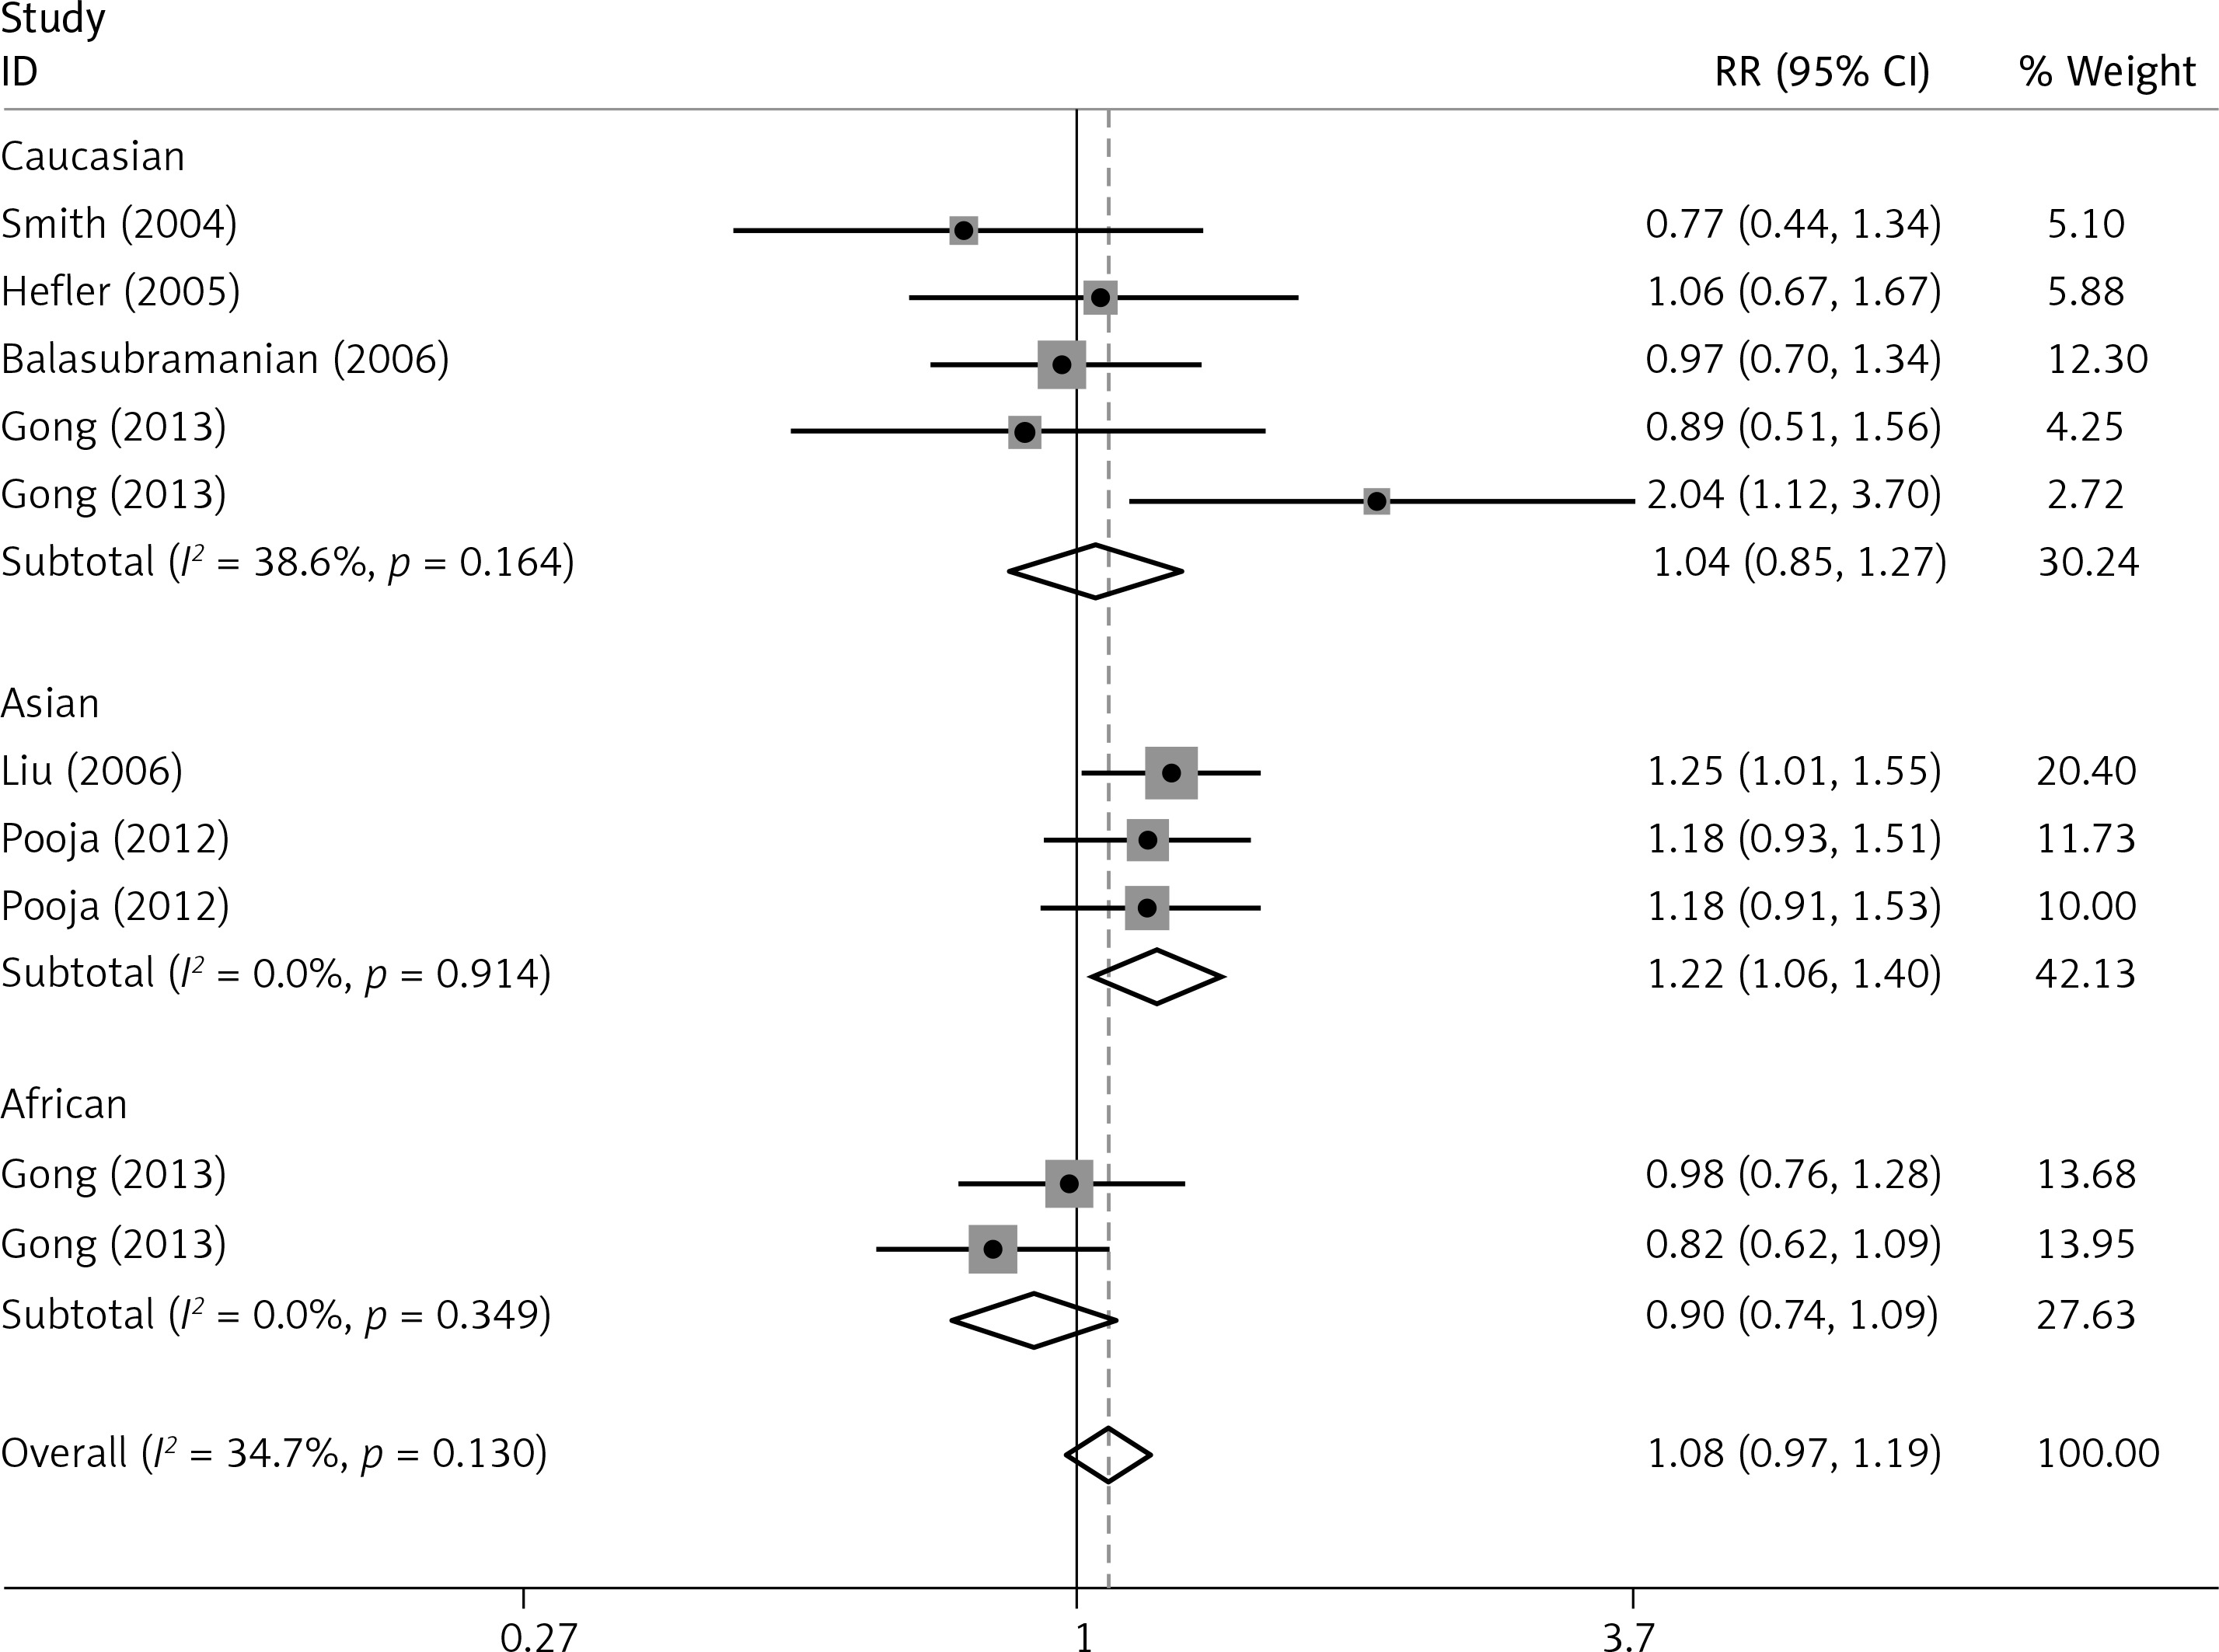
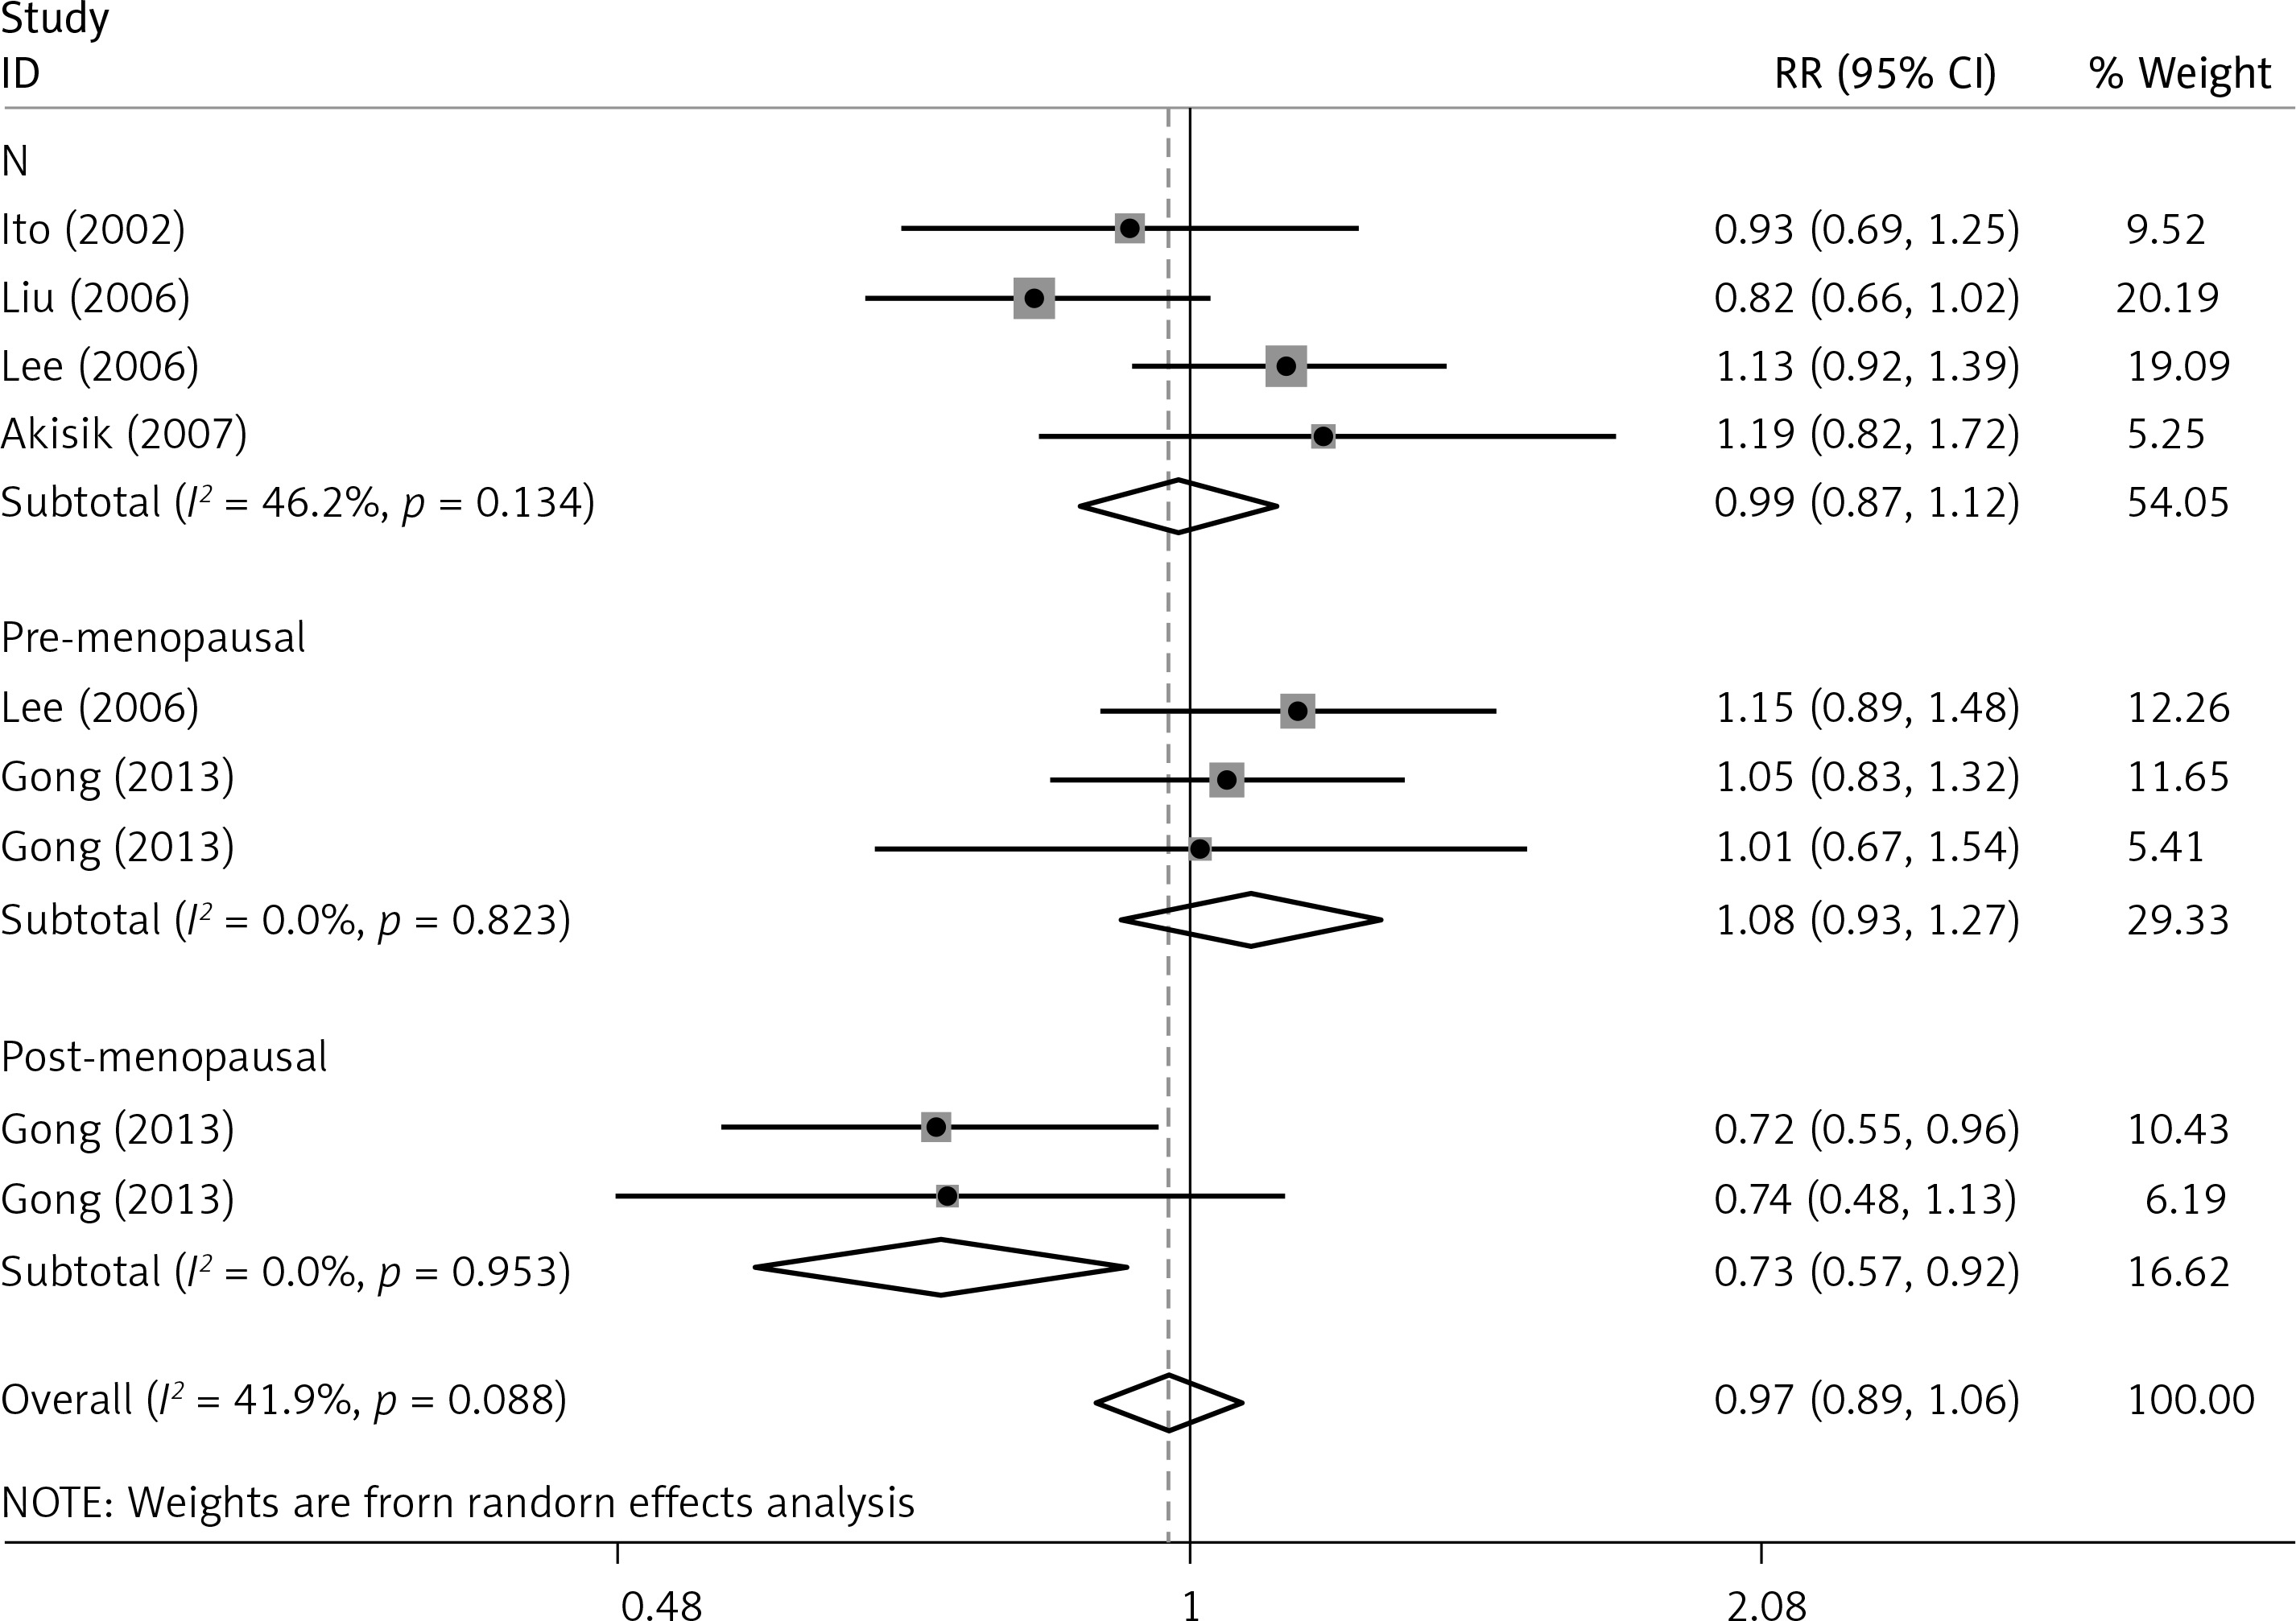
The critical results of the current meta-analysis are described in Table III. Based on data, three common polymorphisms in IL-1β (rs16944, rs1143634, rs1143627) were not significantly associated with breast cancer risk in all genetic models. To go a step further, the data were stratified into different subgroups according to ethnicity, menopausal state, source of controls and genotyping methods. In terms of analysis by ethnic subgroup, TT genotype of rs16944 polymorphism represented a higher risk of breast cancer compared to CT genotype and CC + TT genotype and this was only significant in Asian people (TT vs. CC + CT: 1.229, 95% CI: 1.063–1.422, p = 0.005, Figure 1; TT vs. CT: 1.211, 95% CI: 1.057–1.388, p = 0.006, Figure 2), not in Caucasian and African populations. Similarly, it is only in Asian people that a significantly decreased breast cancer risk was found in the dominant model (CT + TT vs. CC: OR = 0.944, 95% CI: 0.897–0.994, p = 0.027, Figure 3) for the rs1143627 polymorphism. With patients being stratified according to the menopausal state, we noted that the rs1143627 polymorphism correlated with reduced breast cancer risk among post-menopausal women in three genotype models: the allele model (T vs. C: 0.859, 95% CI: 0.753–0.98, p = 0.024), the recessive model (TT vs. CC + CT: 0.727, 95% CI: 0.576–0.918, p = 0.007, Figure 4), and the homozygous model (TT vs. CC: 0.743, 95% CI: 0.626–0.882, p = 0.001). No significant associations between IL-1β polymorphism and breast cancer risk were found in other stratified analyses based on source of controls and genotyping methods.
Table III
Summary ORs and 95% CI of interleukin-1β polymorphisms and breast cancer risk
| Variable | Allele model | Dominant model | Recessive model | Homozygous model | Heterozygous model | ||||||||||
|---|---|---|---|---|---|---|---|---|---|---|---|---|---|---|---|
| OR | (95% CI) | P-valuea | OR | (95% CI) | P-valuea | OR | (95% CI) | P-valuea | OR | (95% CI) | P-valuea | OR | (95% CI) | P-valuea | |
| rs16944: | |||||||||||||||
| Overall | 1.017 | 0.944–1.096 | 0.653 | 1.001 | 0.945–1.06 | 0.609 | 1.071 | 0.915–1.254 | 0.393 | 1.036 | 0.898–1.196 | 0.626 | 1.072 | 0.944–1.218 | 0.283 |
| Ethnicity: | |||||||||||||||
| Caucasion | 0.986 | 0.837–1.16 | 0.862 | 0.97 | 0.863–1.09 | 0.813 | 1.029 | 0.703–1.507 | 0.082 | 0.988 | 0.657–1.487 | 0.956 | 1.039 | 0.847–1.273 | 0.714 |
| Asian | 1.071 | 0.98–1.172 | 0.13 | 1.01 | 0.927–1.101 | 0.436 | 1.229 | 1.063–1.422 | 0.005 | 1.083 | 0.884–1.327 | 0.443 | 1.217 | 1.06–1.396 | 0.005 |
| African | 1.017 | 0.927–1.104 | 0.791 | 1.043 | 0.938–1.161 | 0.979 | 0.937 | 0.763–1.15 | 0.533 | 1.041 | 0.889–1.219 | 0.615 | 0.901 | 0.743–1.092 | 0.289 |
| rs1143634: | |||||||||||||||
| Overall | 1.072 | 0.783–1.466 | 0.665 | 1.036 | 0.777–1.382 | 0.807 | 1.27 | 0.863–1.87 | 0.226 | 1.277 | 0.758–2.151 | 0.359 | 1.243 | 0.86–1796 | 0.247 |
| rs1143627: | |||||||||||||||
| Overall | 0.959 | 0.903–1.018 | 0.171 | 0.956 | 0.912–1.002 | 0.058 | 0.966 | 0.855–1.092 | 0.581 | 0.918 | 0.823–1.025 | 0.128 | 1.017 | 0.92–1.124 | 0.747 |
| Ethnicity: | |||||||||||||||
| Caucasion | 0.918 | 0.726–1.159 | 0.472 | 0.94 | 0.792–1.115 | 0.475 | 0.879 | 0.611–1.265 | 0.488 | 0.879 | 0.617–1.252 | 0.473 | 0.943 | 0.779–1.143 | 0.553 |
| Asian | 0.965 | 0.899–1.034 | 0.312 | 0.944 | 0.897–0.994 | 0.027 | 1.023 | 0.881–1.187 | 0.768 | 0.929 | 0.812–1.064 | 0.289 | 1.084 | 0.963–1.22 | 0.181 |
| African | 0.988 | 0.873–1.118 | 0.849 | 1.024 | 0.924–1.135 | 0.651 | 0.866 | 0.632–1.186 | 0.37 | 0.932 | 0.689–1.259 | 0.645 | 0.845 | 0.639–1.118 | 0.239 |
| Menopausal: | |||||||||||||||
| Pre-menopausal | 1.025 | 0.958–1.098 | 0.471 | 1.005 | 0.952–1.061 | 0.867 | 1.085 | 0.925–1.272 | 0.326 | 1.037 | 0.928-1.159 | 0.519 | 1.08 | 0.932–1.251 | 0.308 |
| Post-menopausal | 0.859 | 0.753–0.98 | 0.024 | 0.913 | 0.787–1.058 | 0.225 | 0.728 | 0.575–0.922 | 0.008 | 0.743 | 0.626-0.882 | 0.001 | 0.812 | 0.653–1.011 | 0.062 |
Figure 1
OR of breast cancer in different ethnicities associated with rs16944 in IL-1β gene for the TT genotype compared with the CC + CT genotype
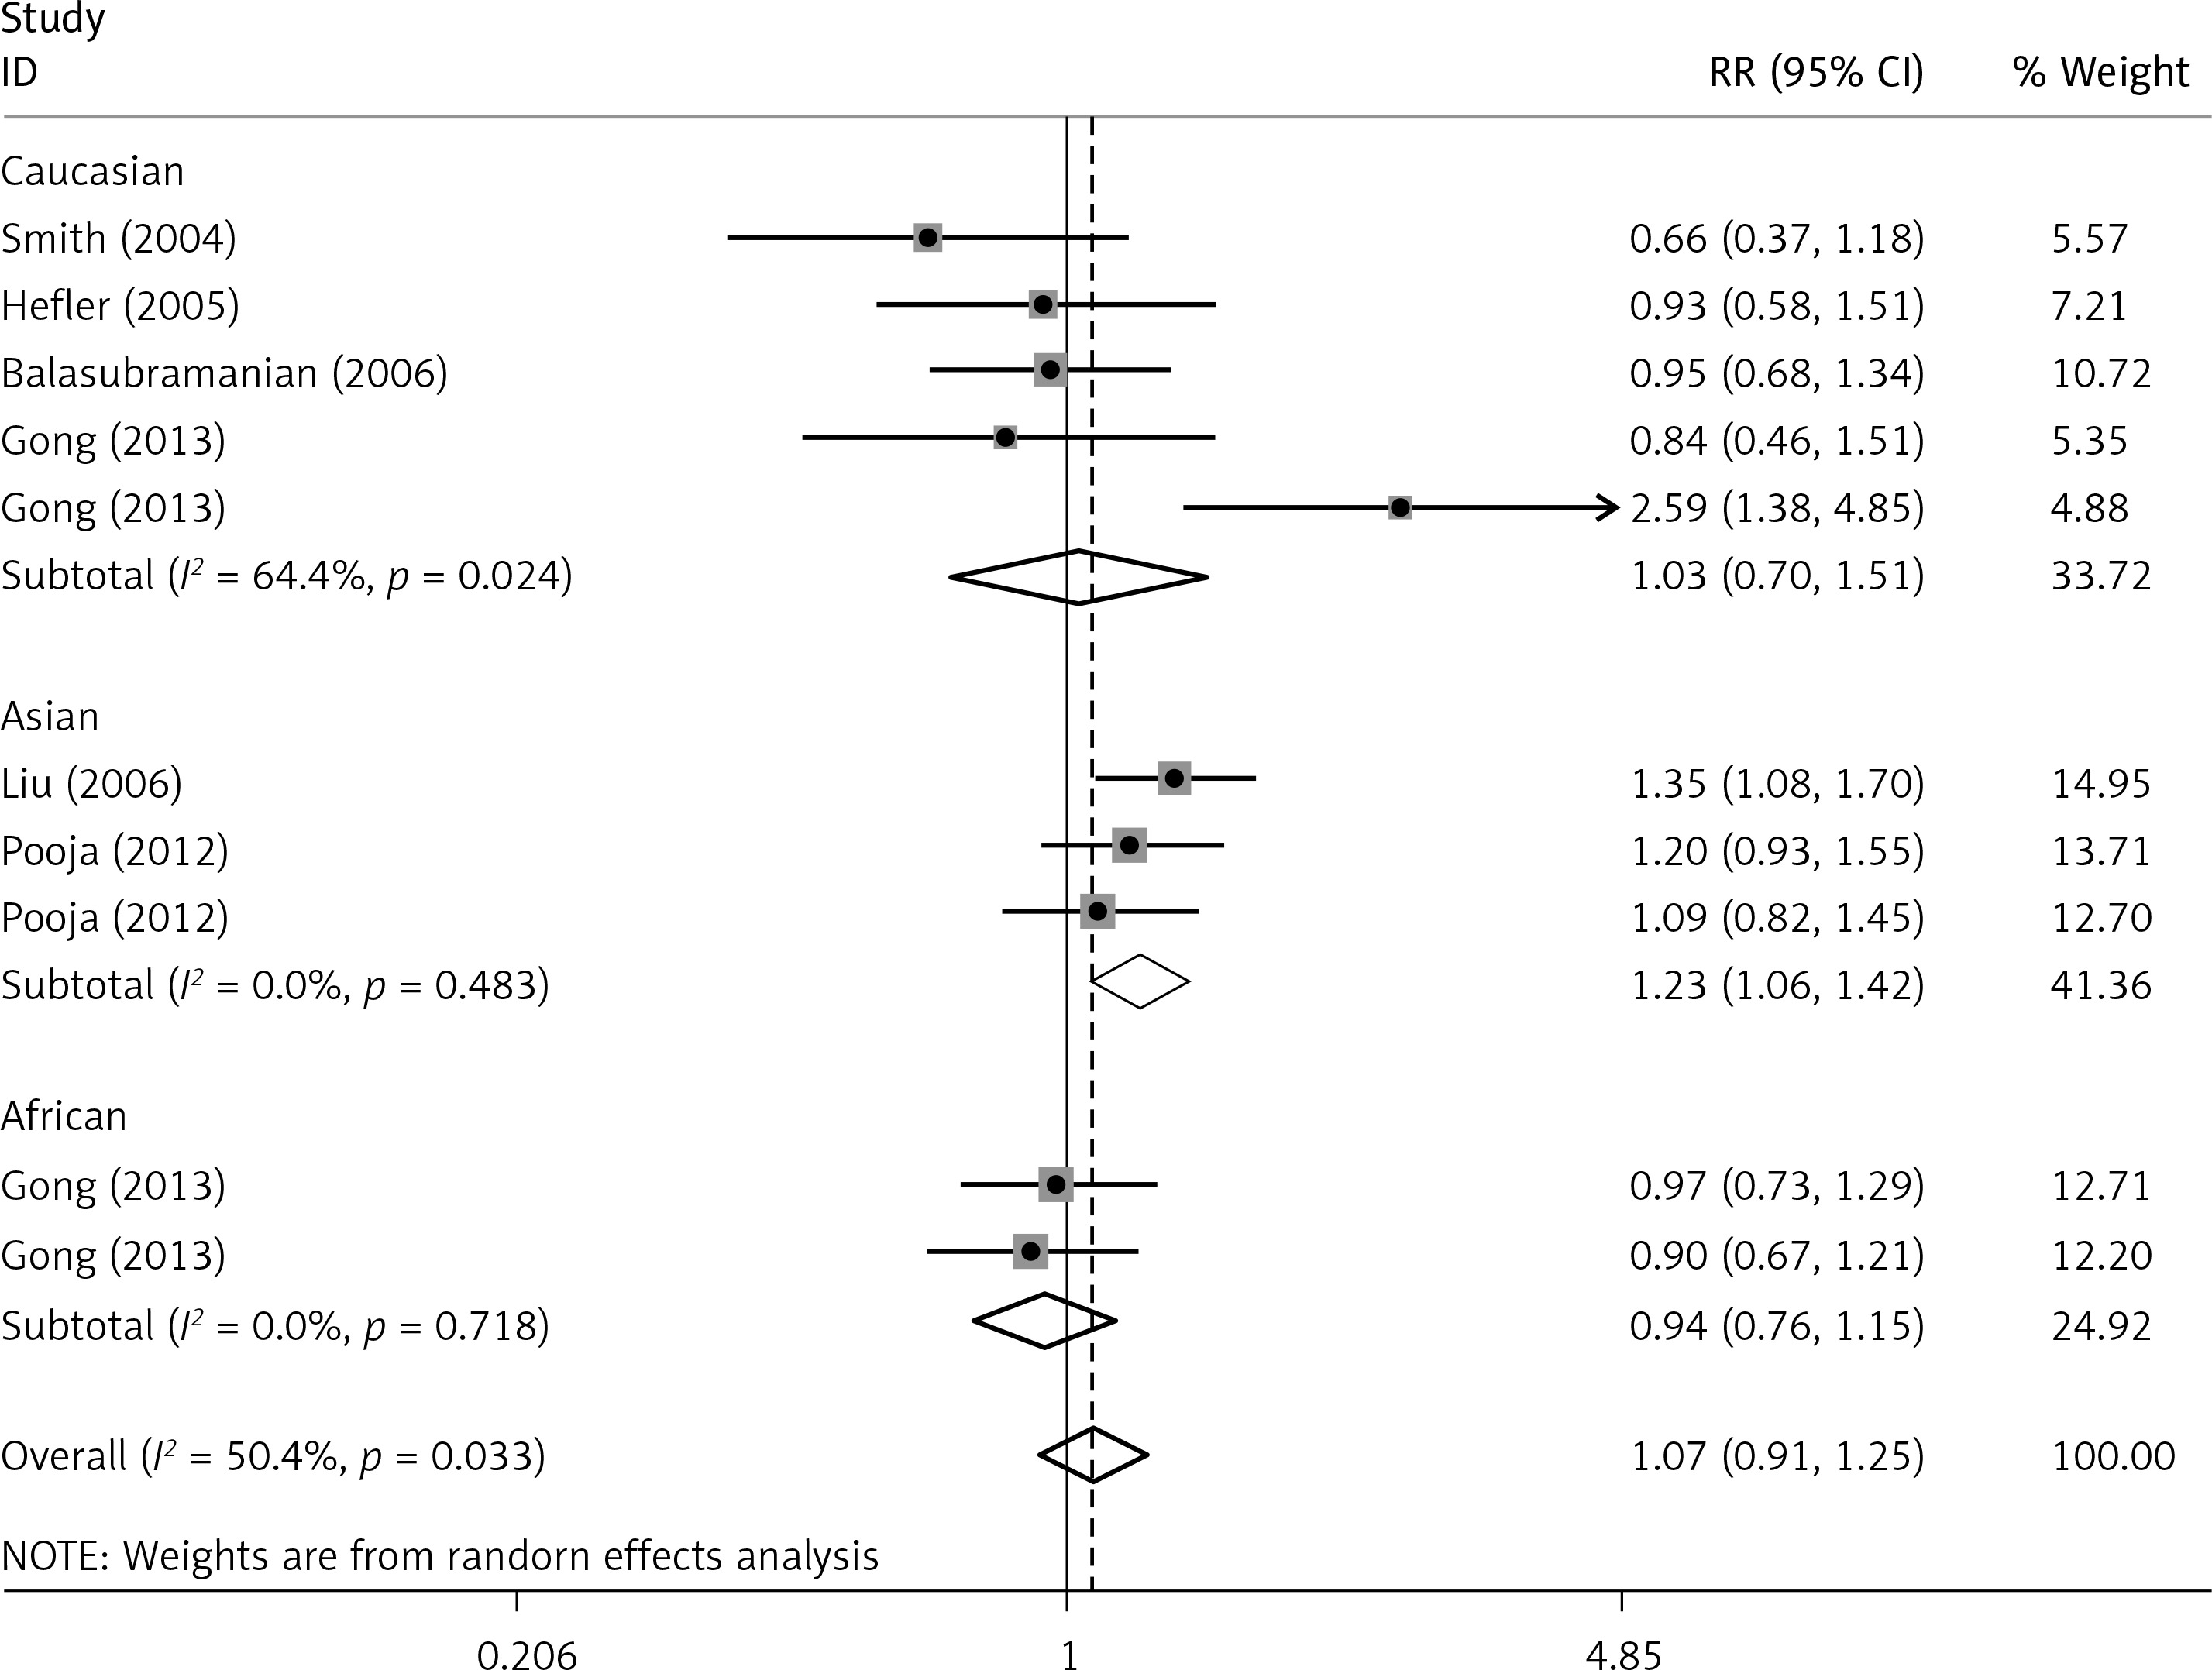
Figure 2
OR of breast cancer in different ethnicities associated with rs16944 in IL-1β gene for the TT genotype compared with the CT genotype
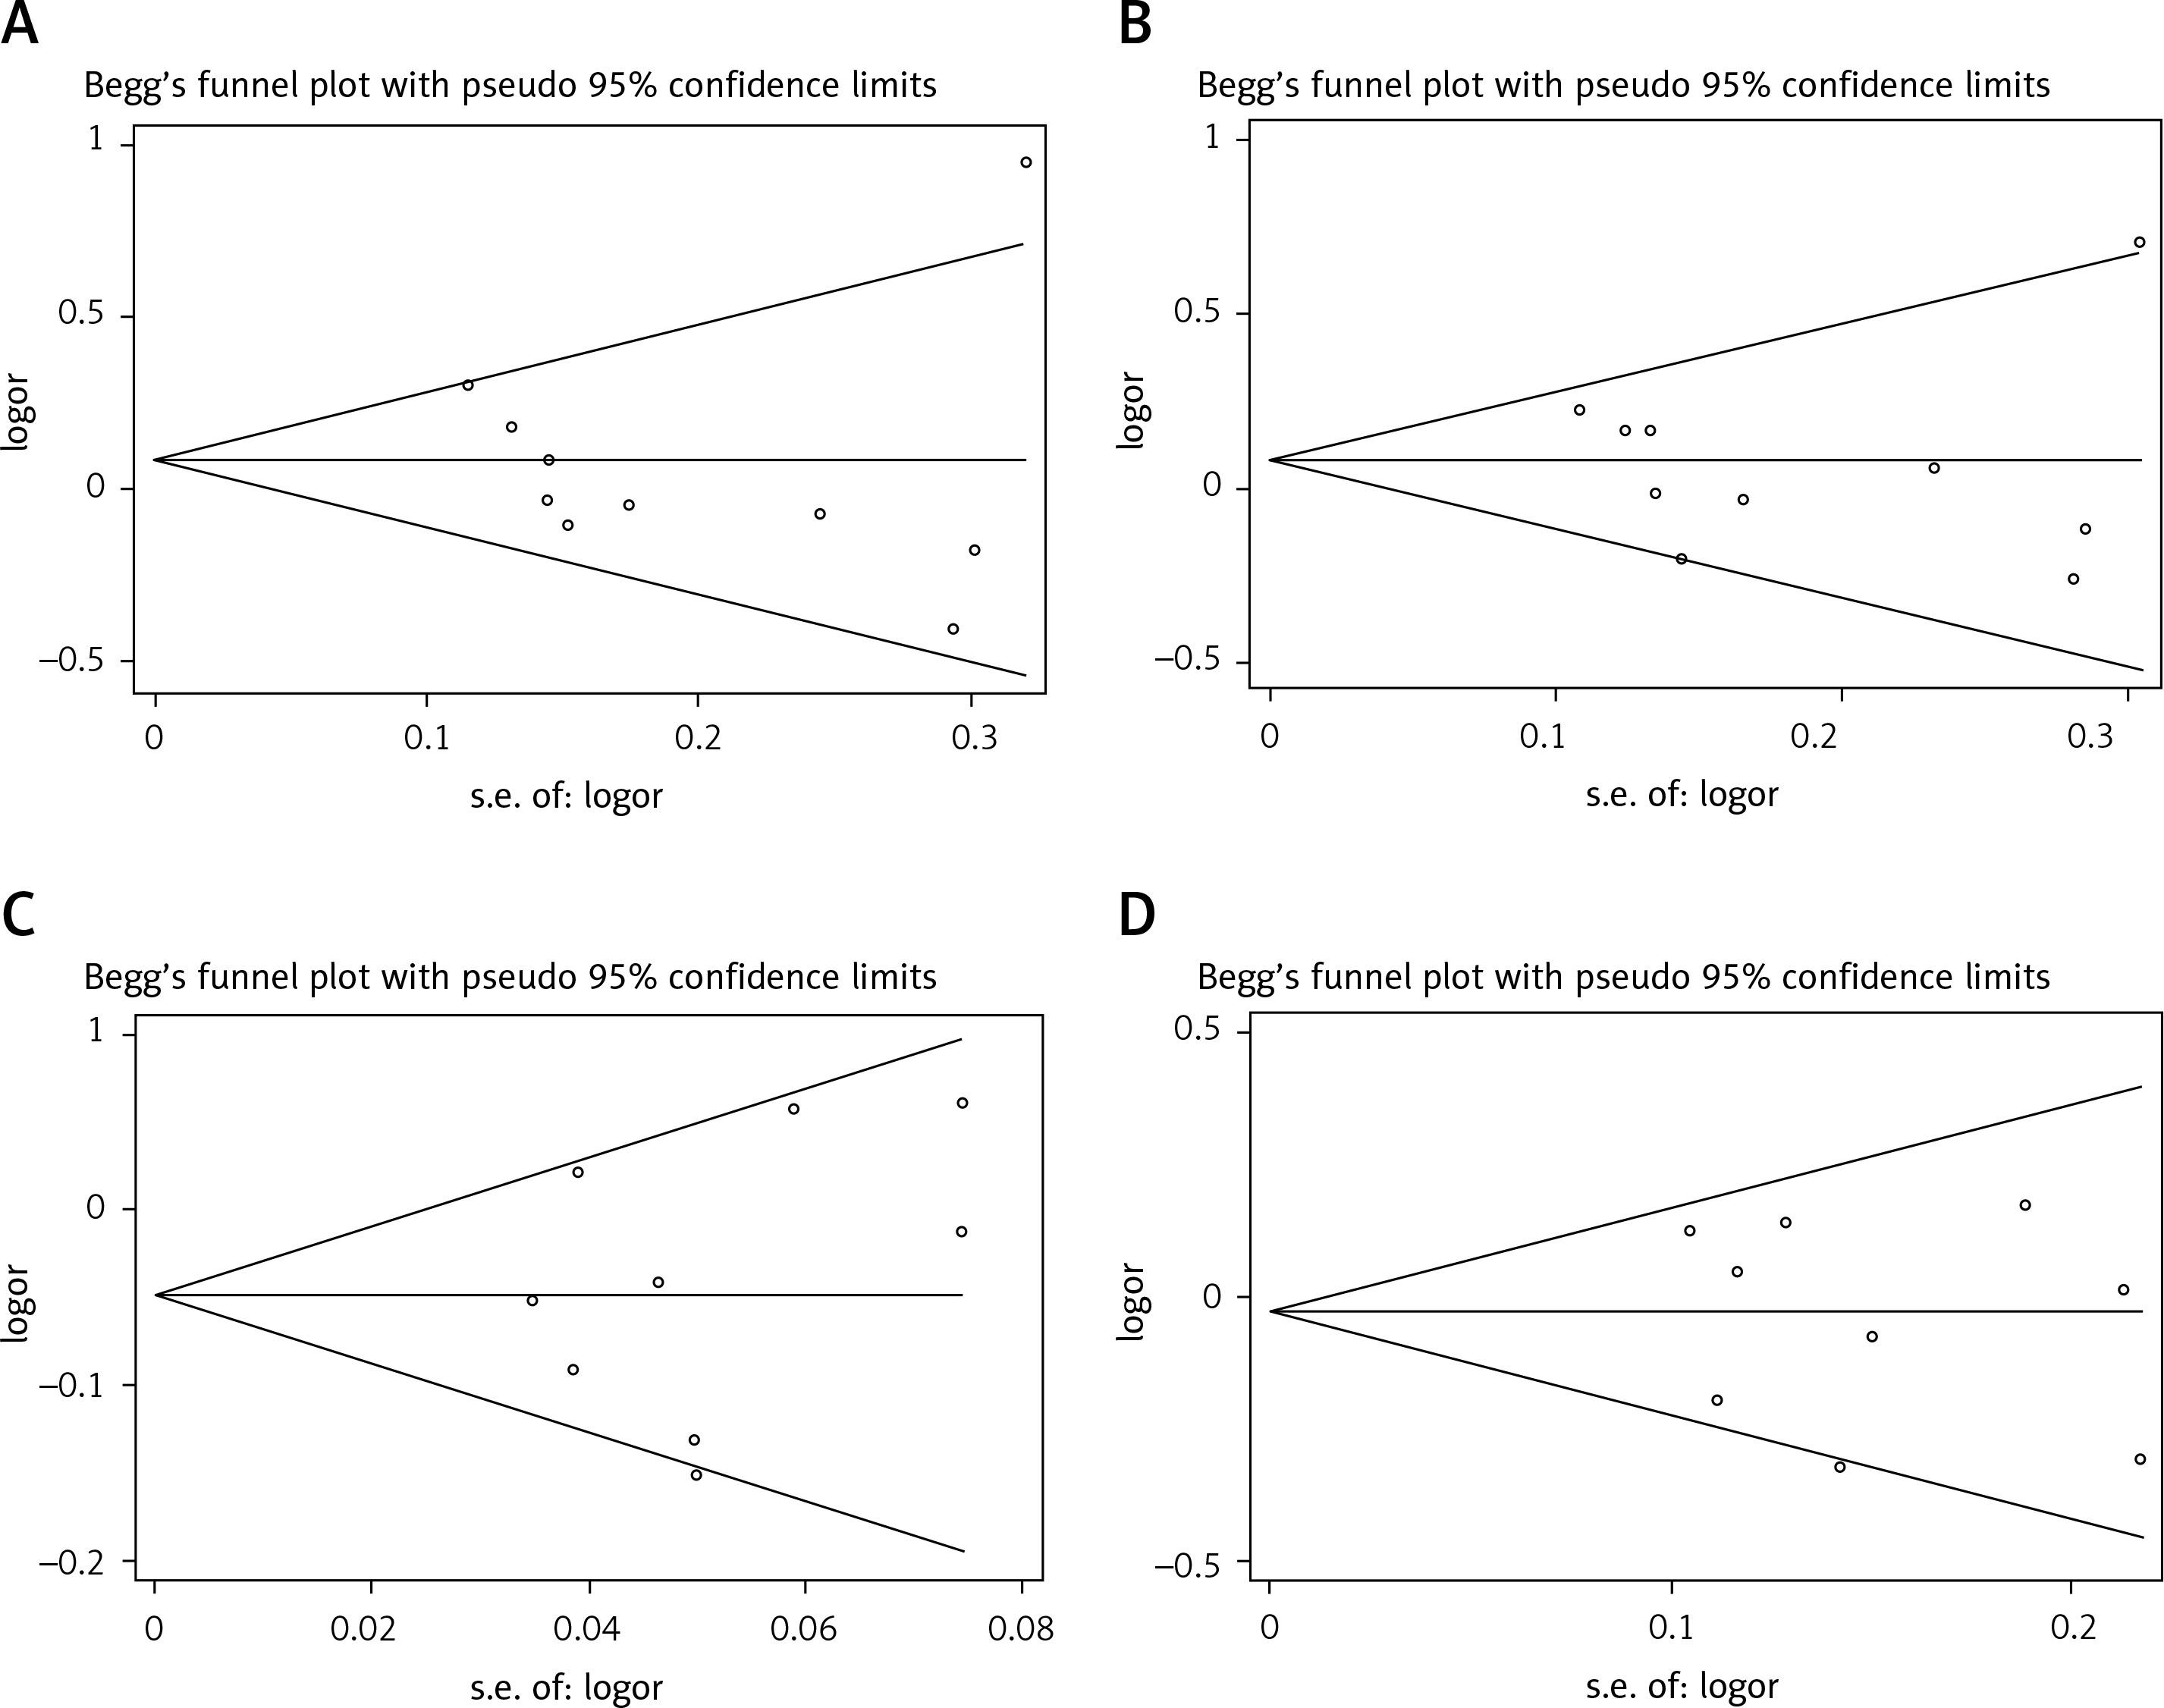
Publication bias
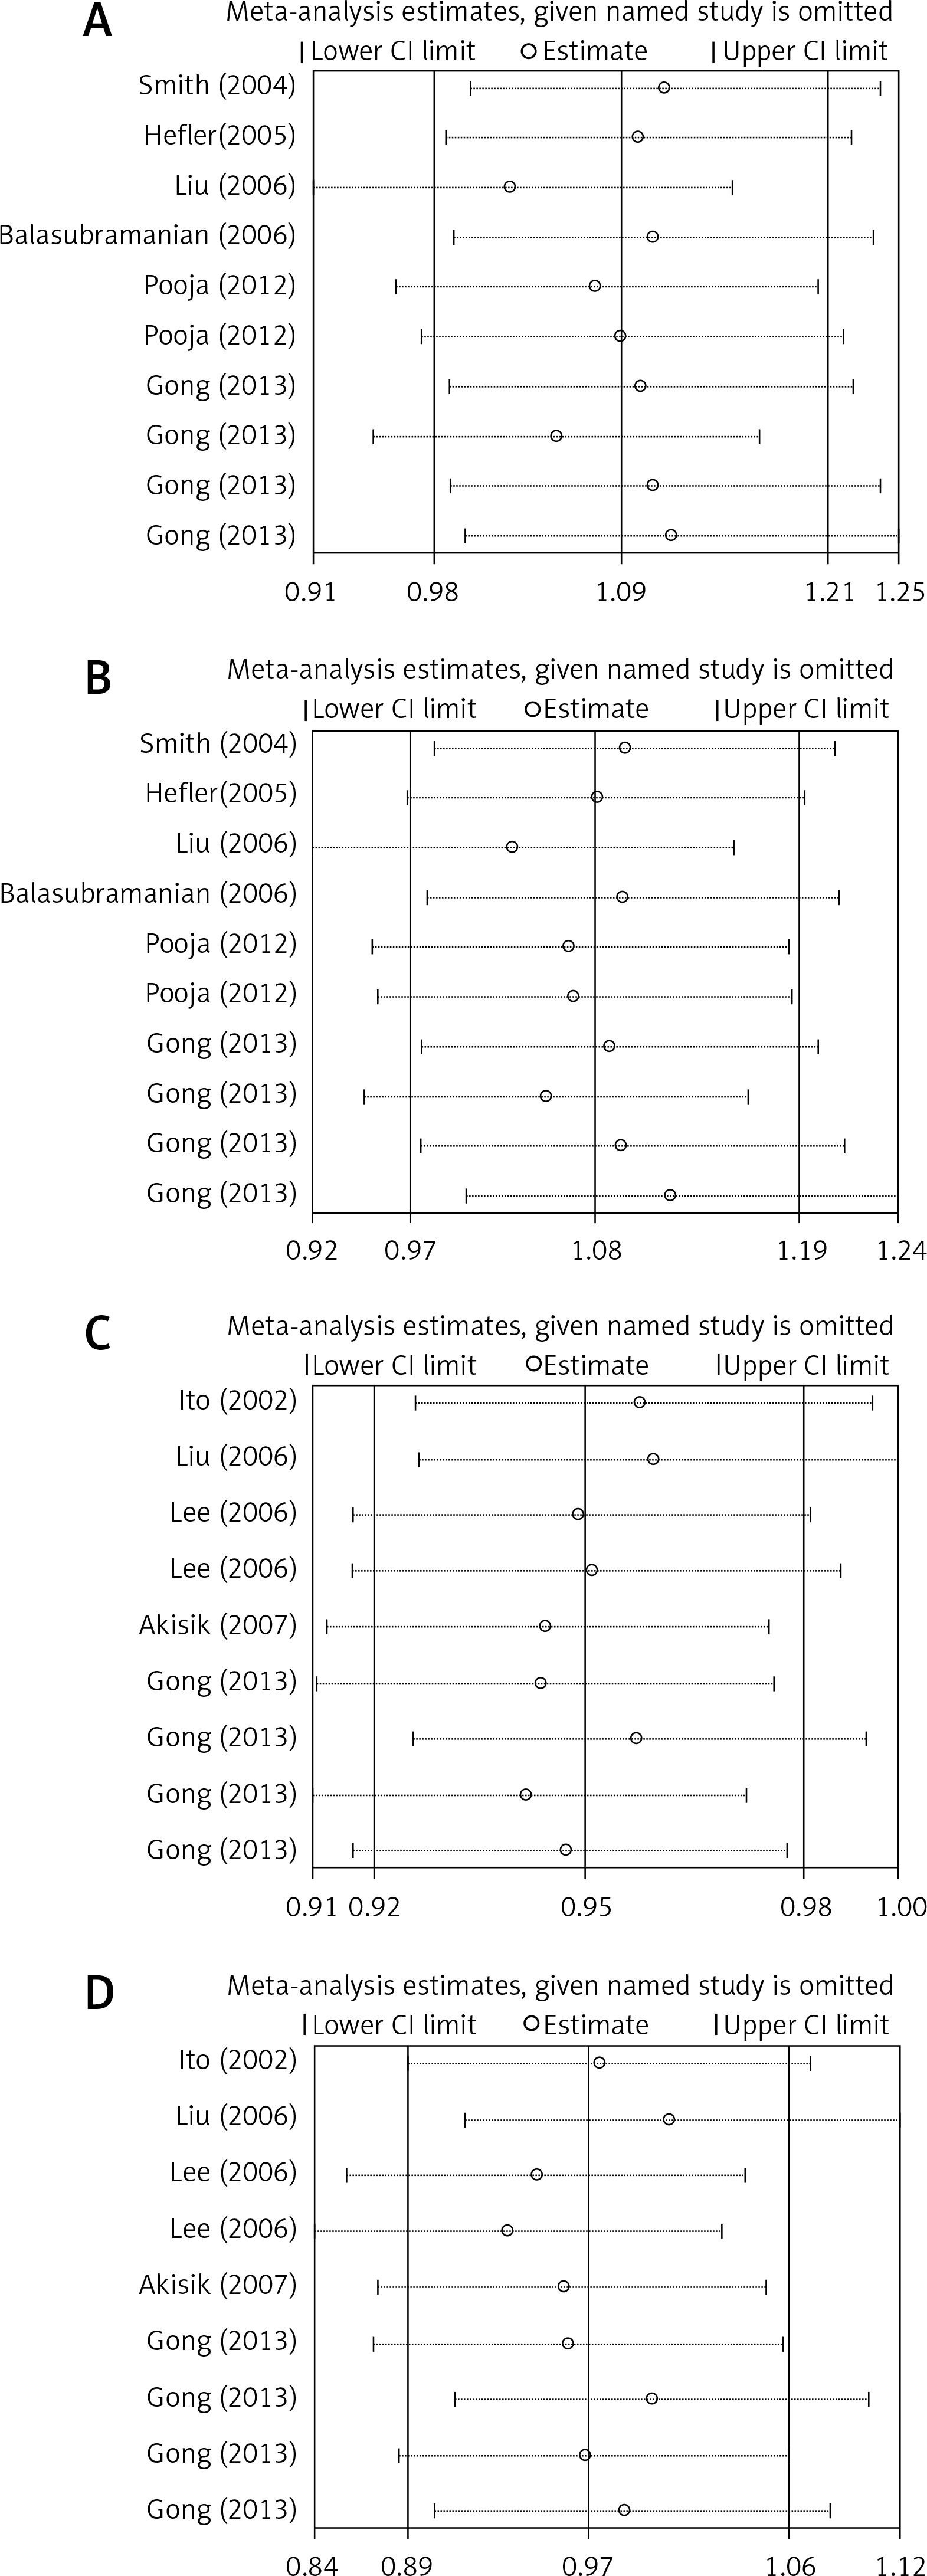
Egger’s test and Begg’s funnel plot were used so that we could evaluate the potential publication bias of the studied literature. No obvious evidence of publication bias was detected in IL-1β (rs16944, rs1143634, rs1143627) (Figure 5). Also, good results were obtained in the sensitivity analysis (Figure 6).
Discussion
It is believed that cytokines are strongly connected to cancer pathogenesis accompanying increasing evidence, which suggests that they participate in tumor initiation, growth and metastasis [2]. Numerous studies about cytokine gene polymorphisms have been conducted to investigate their relations with many inflammatory and neoplastic diseases [14]. Emerging studies have reported the associations between IL-1β polymorphisms and breast cancer risk because of IL-1β’s crucial importance in breast cancer development. The size of samples in a single study was relatively small and the controls of some studies deviated from HWE, so the results were controversial. For example, Ito et al. first reported that rs1143627 was significantly associated with breast cancer risk [10] and another case-control study by Liu et al. verified this conclusion in the Chinese population [16]. However, Lee et al. and Akisik and Dalay did not find significant differences [15, 17]. Studies by Snoussi et al. and Pooja et al. revealed highly significant associations between rs1143634 and the aggressive phenotype of breast cancer [13, 18]. On the other hand, Hefler et al. and Balasubramanian et al. did not find significant differences [12, 14]. For rs16944, some studies indicated that rs16944 genotype reduced the risk of breast cancer, while others showed the opposite results.
Liu et al. conducted a meta-analysis to investigate the relations between three polymorphisms in IL-1β gene and the risk of breast cancer [25]. The variant genotype of rs1143627 was found to be associated with a significantly increased breast cancer risk while the polymorphisms rs16944 and rs1143634 did not represent any associations with breast cancer risk, which was inconsistent with our results. As Wang et al. mentioned [26], the data reported by Liu et al. conflicted with the data from some previous publications, so the results provided by Liu et al. were untrustworthy. Given this situation, we conducted an updated meta-analysis to investigate the associations between three polymorphisms in the IL-1β gene and breast cancer risk.
Some potential limitations in the present meta-analysis should be taken into consideration. First of all, compared to the one included in previous studies, this sample size was larger, but it was still relatively small for some SNPs and stratified analyses. Next, we could not conduct haplotype analysis and linkage disequilibrium, because more details about personal information regarding genotypes of the SNPs (rs16944, rs1143634 and rs1143627) in IL-1β gene were unavailable. Furthermore, it is difficult for us to evaluate potential interactions between gene-environment, gene-gene and multiple polymorphic loci in the same gene. Regardless of these limitations, our present meta-analysis includes a much larger number of eligible studies and a stratified analysis.
In conclusion, our current meta-analysis suggests that the rs16944 polymorphism is significantly associated with increased risk of breast cancer among the Asian population, while the rs1143627 polymorphism reduces the breast cancer risk in post-menopausal women. In the future, we need further large-scale and rigorous studies to validate these findings.