Introduction
Lung cancer (LC), as one of the leading lethal cancers worldwide, causes more than one million deaths every year [1]. Most LC patients are in an advanced stage when diagnosed, and only 16% achieve 5-year survival [1]. What is worse, most LC patients are in metastatic stage IV when detected, which usually results in a higher recurrence rate and lower survival [2]. The mechanism of cancer metastasis is complicated [3], which makes it the major lethal cause in various solid malignancies, including LC [4, 5]. Although several encouraging therapy strategies and medicines have been developed in recent years, the prognosis for LC remains poor [2]. Extensive reports showed that alteration of the metabolic signals is one of the primary drivers for the LC cell invasion/metastasis [3, 4]. Hence, it is vital to explore the primary molecules and mechanisms that underly LC progression and metastasis.
The metabolic reprogramming of tumours is one of the essential drivers for cancer malignant development and progression [6, 7]. Accelerated uptake of glucose, as a major hallmark of cancer cells, provides energy and biosynthetic materials for cancer cell growth and invasion [8]. Increased glycolysis of tumour cells by enhanced glucose uptake makes the production of energy in cancer cells without oxygen or glycolytic intermediates, e.g. amino acids, nucleotides, etc. [4]. Accordingly, the dysregulated expression of glucose transporters or glycolytic enzymes is frequent oncogenic signalling. Hexokinases (HKs), converting glucose into glucose-6-phosphate (G-6-P), are the kinases involved in the first step of glucose metabolism [9]. To date, four major isoforms (HK1, HK2, HK3, and HK4) have been characterised in mammalian tissues [10]. However, only HK2 was found to be highly expressed in multiple cancer cells, which is associated with poor overall clinical outcomes in cancer patients [11, 12]. It was reported that the deletion of Hk2 suppressed tumour burden and increased overall survival of Kras-driven lung cancer and ErbB2-driven breast cancer [9]. In addition, HK2 knockdown also showed inhibitory effects on the tumour growth in glioblastoma, prostate cancer, and pancreatic carcinoma [13–15]. These findings suggest that HK2 is an attractive potential therapeutic target for cancer patients. The results of recent studies also suggested that HK2 expression might contribute to tumour metastasis [16–18]. Therefore, HK2 is an important therapy target for cancer treatment.
To date, few studies have focused on the relationship between the expression of HK2 and LC progression [19, 20]. In this study, we took efforts to address whether HK2 is required for LC cell growth and metastasis in vitro and in vivo, and its relationship between multiple mutations in LC. Our results revealed that HK2 promotes LC cell proliferation and metastasis in various mutation backgrounds of LC cells, indicating that HK2 is a high-potential therapy target for LC treatment.
Material and methods
Subjects and tissue samples
The 56 tumour tissues and corresponding adjacent normal lung tissues were collected from LC patients of the Third Hospital of Jilin University from Jan 2013 to December 2018. The samples were snap-frozen in liquid nitrogen immediately after resection. The diagnosis of lung cancer was confirmed by histopathology. These 56 tumour samples included 15 small cell lung carcinoma and 41 non-small cell lung carcinoma. Once tumour samples were harvested, they were divided into two parts. One was paraffin-embedded, and the other was snap-frozen with liquid nitrogen and stored at –80°C for protein and mRNA extraction. This study was reviewed and approved by the Ethics Committee of Jilin University, and all patients provided written informed consent.
Cell culture and reagents
Three human LC cell lines (A549, H460, and H1299) were purchased from the Cell Bank of Type Culture Collection of the Chinese Academy of Science, Shanghai Institute of Cell Biology. All cells were cultured in RPMI-1640(DMEM) medium (Gibco, Life Technologies, California, USA) supplemented with 10% foetal bovine serum (Gibco) and penicillin (100 IU/ml)/streptomycin (100 mg/ml) (Gibco), and were maintained in an incubator at 37°C with 5% CO2.
Metabolite analysis
Concentrations of glucose and lactate were measured by a YSI 2700 biochemistry analyser (YSI, Yellow Springs, OH). The ATP level was analysed by CellTiter-Glo 2.0 (Thermofisher, Shanghai, China) as described by the manufacturer.
Plasmids, siRNA transfection, and lentiviral transduction
All of the plasmids and the siRNA transfection were conducted using lipofectamine 2000 (Thermofisher) as described by the manufacturer. The pcDNA-flag-WT Keap1 (#28023) and pcDNA-WT p53 (#69003) were purchased from Add-gene (Cambridge, MA, USA). The siRNA for Kras (5′-GUGCAAUGAAGGGACCAGUA-3′) and control (5′-GUACCUGACUAGUCGCAGAAG-3′) were synthe-sised by GenePharma (Shanghai, China). 200 pmol of siRNA or 0.4 µg of plasmids was used to transfect the A549, H460, or H1299 cells in 12-well plates. After transfection overnight, the cells were collected for western blot or mRNA extraction. The lentiviral shRNAs for human HK2 (TRCN0000037670) was purchased from Thermofisher, and the control shRNA (#10879) was purchased from Addgene. For the lentivirus production, shRNA-encoding plasmids were mixed with packaging plasmids (VSVG, REV, and pMDL) (Addgene) and co-transfected into adherent HEK-293T cells. Thirty-six hours later, virus-containing supernatant was collected and the target cell was infected with 8 µg/ml polybrene. To generate stable cell lines, cells were selected with 4 µg/ml puromycin for 5 days, and knockdown efficiency was detected by immunoblotting.
Cell proliferation, apoptosis, and clonogenic formation assay
For cell growth assay, 1 × 10⁴ cells/well were seeded in 96-well plates. At different time points, 3-(4,5-dimethylthiazol-2-yl)-5-(3-carboxymethoxyphenyl)-2-(4-sulfophenyl)-2H-tetrazolium (MTS) assay was performed using the MTS assay kit (Thermofisher, Shanghai, China) according to the manufacturer’s instructions. Chemiluminescence was measured by using a Wallac Victor 1420 Multilabel Counter (Perkin Elmer, Waltham, MA, USA). Each assay was conducted in triplicate and repeated three times. In 5-Bromo-2′-deoxyuridine (BrdU) assay, the cells were cultured for 3 days before labelling with (3 µg/mL) BrdU (Thermofisher) for 4 h. The analysis of BrdU was performed as previously described [21].
The apoptosis of cells was analysed by Hoechst-33258 (Thermofisher) nuclear staining. Briefly, the cells with supernatant were collected and stained with Hoechst-33258 staining medium (0.1% Hoechst, 0.5% NP-40, 4% formaldehyde in PBS). The fracted nuclear was counted in 400 cells in each treatment group. The percentage of fragmented cells was calculated as the percentage of apoptosis.
For clonogenic survival assay, 1 × 10⁴ cells per well were seeded in the six-well plates. After 2 weeks, cell colonies were fixed in 10% formalin and stained with crystal violet (0.1% w/v).
Semiquantitative reverse-transcriptase polymerase chain reaction
For RNA isolation, the AxyPrep™ Purification Kit (Axygen, USA) was used according to the manufacturer’s instructions. The concentration of total RNA was analysed by a Nanodrop 2000 micro-volume spectrophotometer (Thermo Scientific). Real-time PCR (RT-PCR) reactions were performed on an Mx3000P real-time PCR system (Stratagene USA). Glyceraldehyde 3-phosphate dehydrogenase (GAPDH) was used as an internal control. The primers used to amplify the gene were: 5′-CAAAGTGACAGTGGGTGTGG-3′ and 5′-GCCAGGTCCTTCACTGTCTC-3′ for HK2; 5′-ACCACAGTCCATGCCATCAC-3′ and 5′-TCACCACCCTGTTGCTGTA-3′ for GAPDH.
Western blotting
The tissues and cells were lysed with ice-cold lysis buffer (60 mM HEPES pH 7.4, 120 mM NaCl, 2 mM MgCl2, 5 mM EGTA pH 8.0, 1 mM dithiothreitol, 0.5% Triton X-100, 10% glycerol, and protease/phosphatase inhibitor cocktail) for 30 min on ice, and centrifuged at 12,000 rpm for 5 min at 4°C. The supernatants were collected and analysed for protein concentrations using Bradford protein assay (Bio-Rad, Hercules, CA, USA). A total 30 µg of protein lysates was resolved by SDS-PAGE and transferred onto PVDF membranes. Membranes were blocked with 5% non-fat milk in PBS and then probed with indicated primary antibody overnight at 4°C. In this study, the following antibodies were used: Kras (MABS194, Millipore), HK2 (#2867, Cell Signaling Technology), Cleaved Caspase-3 (human) (#9661, Cell Signaling Technology), and Beta-Actin (SC-47778, Santa Cruz Technologies). All of the antibodies were used at 1 : 1000 dilution. After incubation with primary antibodies, the membranes were washed with PBST (0.5% Tween 20 in PBS) three times and incubated with a second antibody for an additional hour at room temperature. The mouse and rabbit source second antibodies were purchased from Santa Cruz and used at 1 : 2000 dilution. After washing with PBST three more times, the western blot was developed using ECL substrate (32106, Thermo Fisher). The densitometry of western blot was analysed using Image J software (version 1.52).
Immunohistochemistry staining
The immunohistochemistry (IHC) was performed on 5 µm tissue sections using the antibodies of HK2 (Cell Signaling Technology). Briefly, after incubation with primary antibody (1 : 100 diluted with 10 % goat serum in PBS) overnight at 4°C, the slides were washed three times with PBS and incubated with biotin conjugated second antibody (1 : 100, #14708, Cell Signaling Technology) for an additional hour at room temperature. The final image of IHC was developed using a DAB kit (Vector, Burlingame, CA, USA) as described by the manufacturer. The results of the IHC analysis were taken with a digital slide scanning system (Panoramic Scan, 3DHISTECH Ltd.). The results were quantified as mean density (IOD/area) by Image J software.
The cell invasion assay
The cell invasion was analysed by the 24-well BD BioCoat Matrigel Invasion Chambers as described by the manufacturer guideline (BD Bioscience). Briefly, 2–4 × 10⁵ cells were added to the upper wells with a thin layer of Matrigel basement membrane matrix (for invasion). The membranes were stained with crystal violet (Fisher Scientific) after removing the non-migrated cells from the top of the membrane. The migrated cells were counted using a light microscope (Zeiss Axio Observer) in five randomly selected fields (magnification; 40×). Each assay was performed in triplicate.
Lung metastasis models
The animal protocol was approved by the Institutional Animal Care and Use Committee of the Third Hospital of Jilin University, and followed the national and international guidelines. To determine the effects of HK2 on the metastasis of lung tumours, tail vein injection experiments were performed. 1 × 10⁶ viable cells/100 µl A549 cells with or without HK2 stable knockdown were injected into the tail veins of six-week-old female nude mice (n = 6 for each group). The mice were anaesthetised by isoflurane (Sigma-Aldrich). The health and behaviour of mice were monitored every 2 days. Three weeks after injection, animals were killed by CO2 euthanasia to obtain the lungs. Lung tumour formation was observed, and tumour nodules were counted under a dissecting microscope. For the survival experiment, the death of tail-vein-injected nude mice (n = 8 for each group) was counted when dead mice were found.
Xenograft mouse model and treatment
To further study the HK2 function on the tumour growth in vivo, the nude mice were subcutaneously injected with control, HK2 knockdown A549 (1 × 10⁶ cells suspended in 100 µl of PBS). Ten days after tumour inoculation, two groups of mice were treated with PBS (control) or cisplatin (Sigma-Aldrich, 5 mg/kg in PBS) by I.P. injection (once every 3 days for 15 days). The tumour progress was monitored every 4 days, and all mice were euthanised at 24 days after injection. Once the xenograft tumours for the study of mice were euthanised, and tumours were dissected and fixed in 10% formalin for histopathology and TUNEL staining. The percentage of TUNEL-positive cells was counted in more than 10 pictures in each group of tumours.
Statistical analysis
Statistical significance was determined by Student’s t-test (paired) for bar graphs or one-way ANOVA analysis for growth curves with Graphad Prism (v.5). P < 0.05 was considered to be a statistical difference. The survival of tail-vein-injected mice was analysed by Kaplan Meier Survival analysis of Graphad Prism.
Results
High HK2 expression in LC tumours is associated with poor survival of LC patients
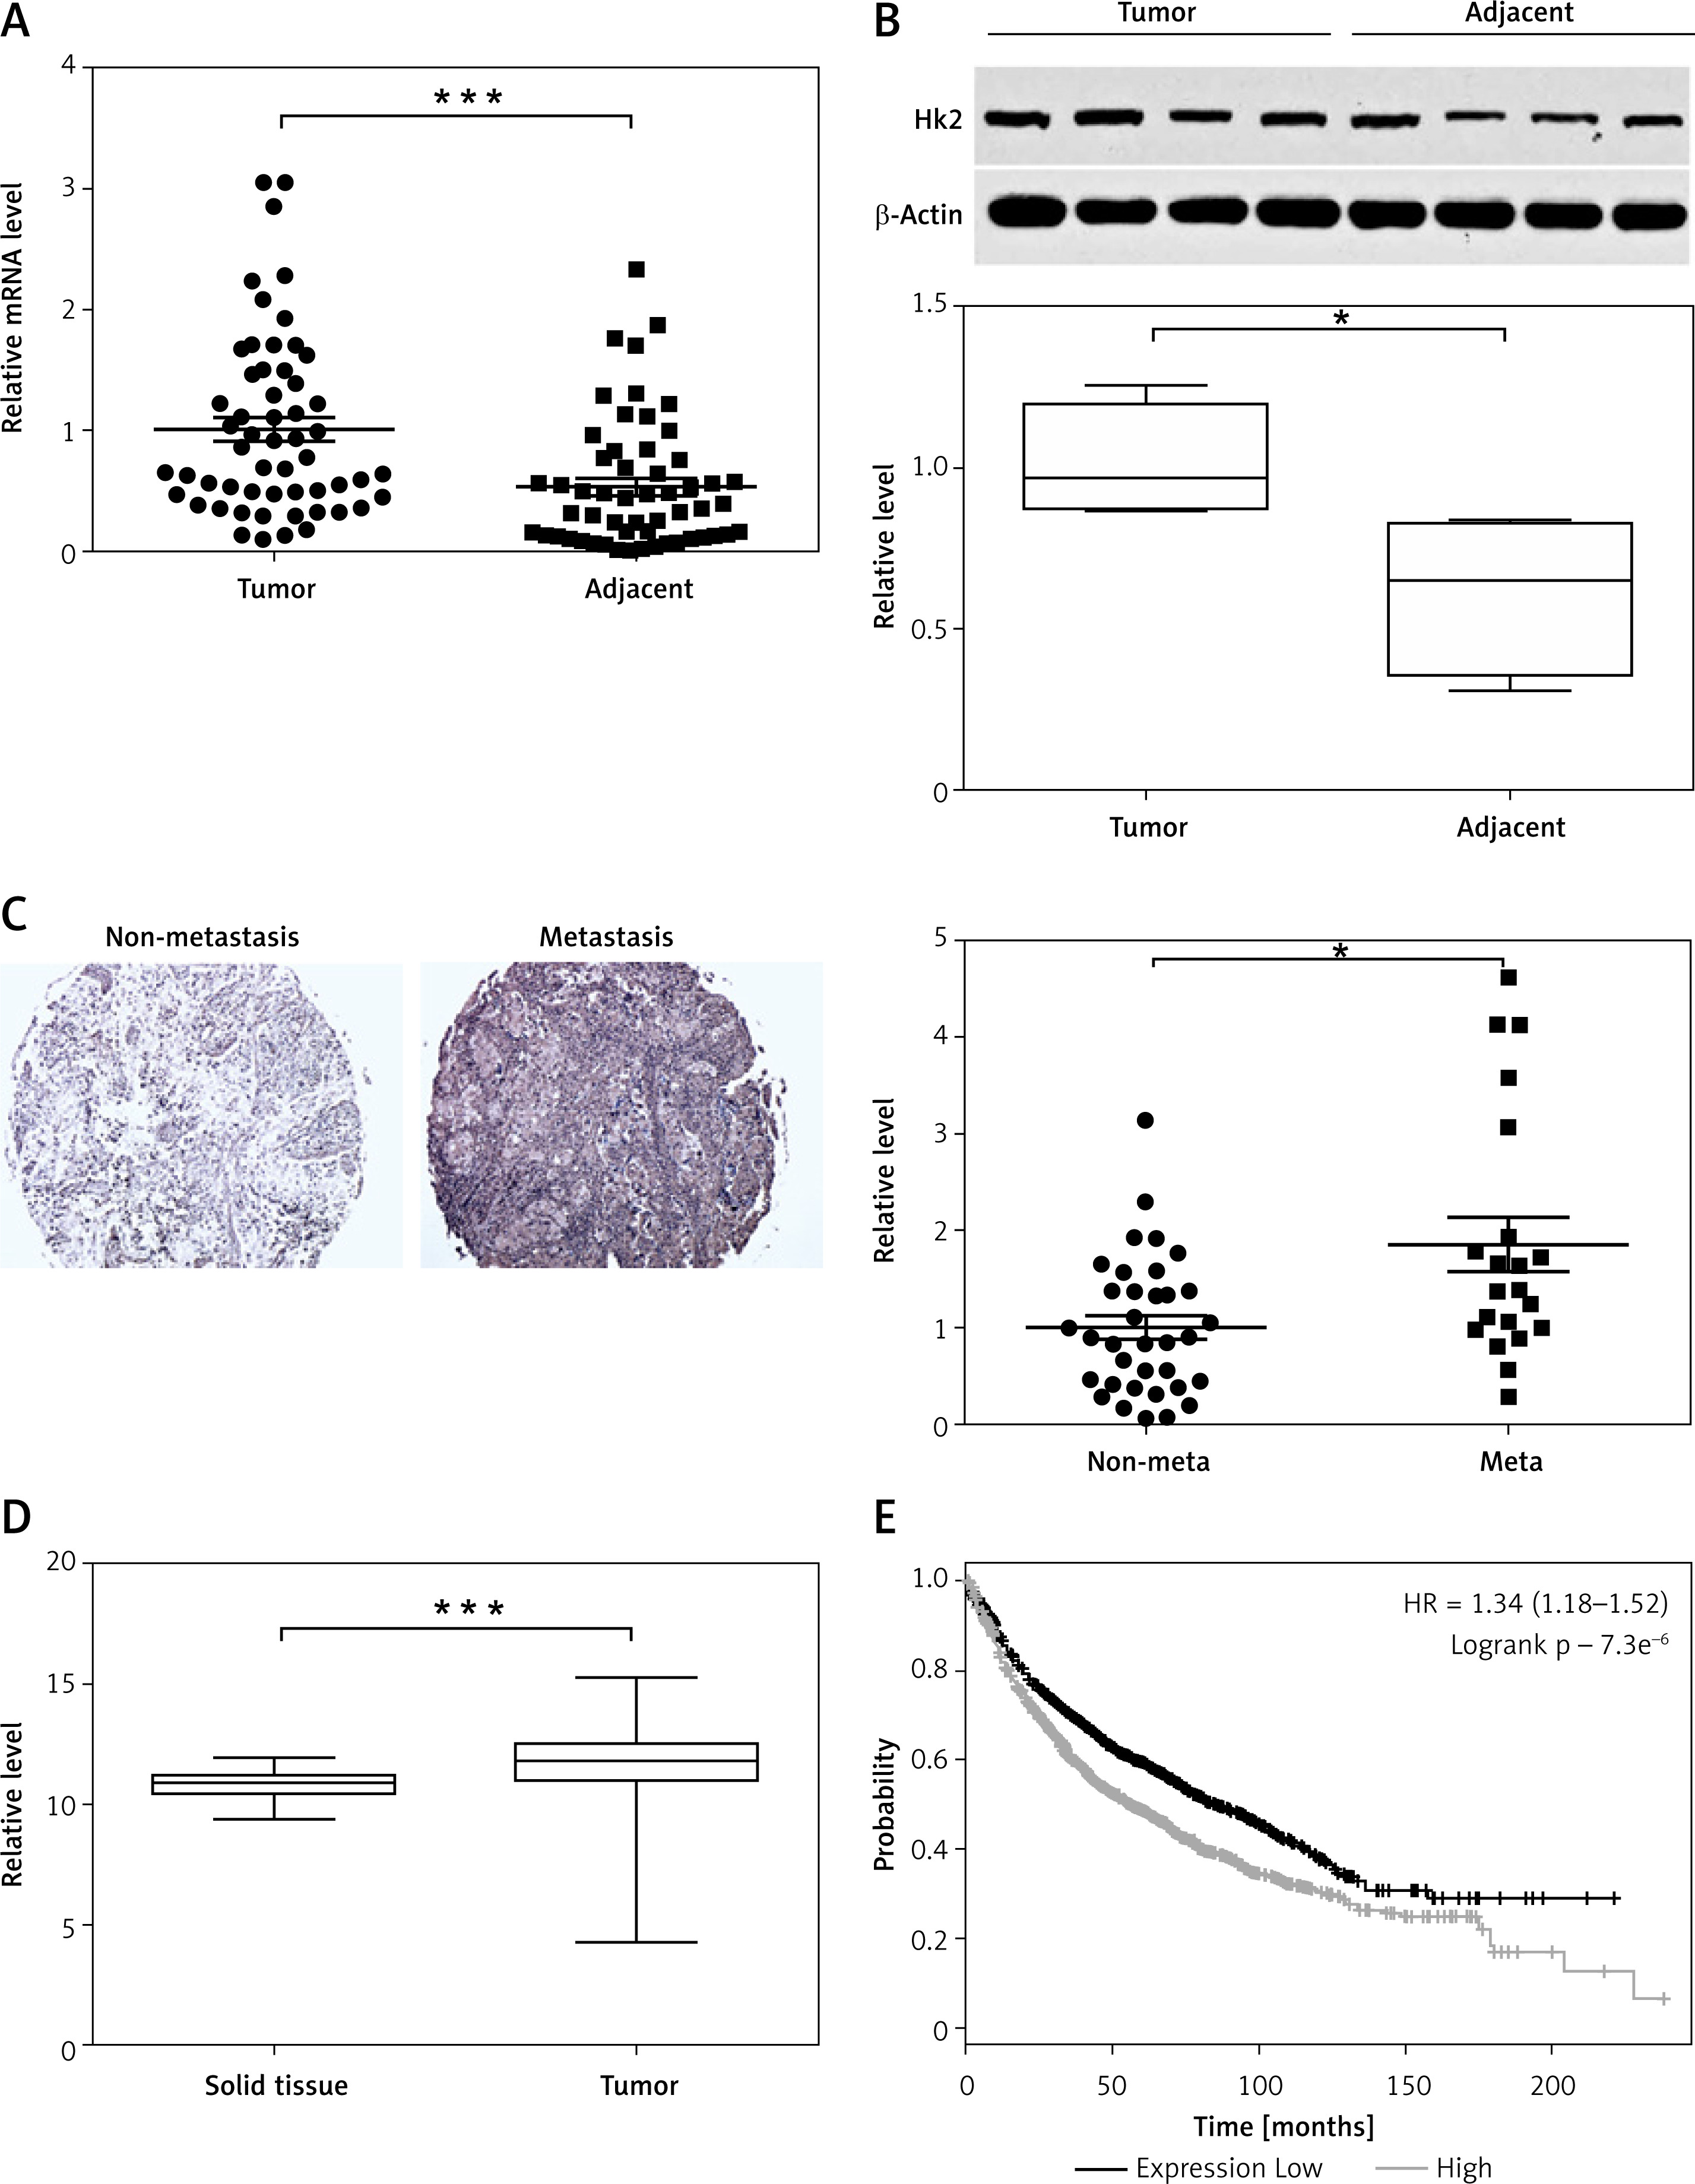
To examine the relationship between deregulated HK2 expression and LC progression and migration, analysis was made of HK2 expression in tissue samples obtained from 56 pairs of LC tumours and adjacent tissue from LC patients. The RT-PCR and western blot analysis revealed that the HK2 was higher in the LC tumours (Figures 1 A, B). Among these 56 patients, 21 were found to have metastases. We then further compared the HK2 expression level in the tumour from these 21 patients to those without metastasis. We found that the patients with tumour metastasis had higher HK2 expression (Figure 1 C), suggesting that HK2 expression might also contribute to LC tumour metastasis. Consistently, the data from the cancer browser (https://xena.ucsc.edu/welcome-to-ucsc-xena/) also suggested that the HK2 mRNA expression level is higher in the LC tumours than in the solid normal tissues (Figure 1 D). Moreover, the Kaplan-Meier plotter analysis (http://kmplot.com/analysis/index.php?p=service) revealed that higher HK2 expression is correlated with poor survival in LC patients (Figure 1 E). Therefore, our data support that HK2 expression is higher in LC tumours, especially in tumours with metastasis, and that high HK2 expression leads to poor clinical outcome in LC patients.
Figure 1
HK2 was highly expressed in LC tumours and correlated with poor survival. A – The mRNA level of HK2 in 56 pairs of adjacent tissues and primary tumours in LC patients. B – The representative western blot for HK2 expression in adjacent tissues and primary tumours (upper panel). The statistical calculation of HK2 expression was analysed (lower panel). C – The representative expression of HK2 in tumours of LC patients with or without metastasis (21 vs. 35, left panel). The statistical calculation of HK2 expression was analysed (right panel). D – The mRNA level of HK2 expression from database of cancer browser. E – The survival of LC patients with high and low HK2 expression from Kaplan-Meier plotter database
*p < 0.05, ***p < 0.001.
HK2 expression is mediated by frequently mutated genes in LC
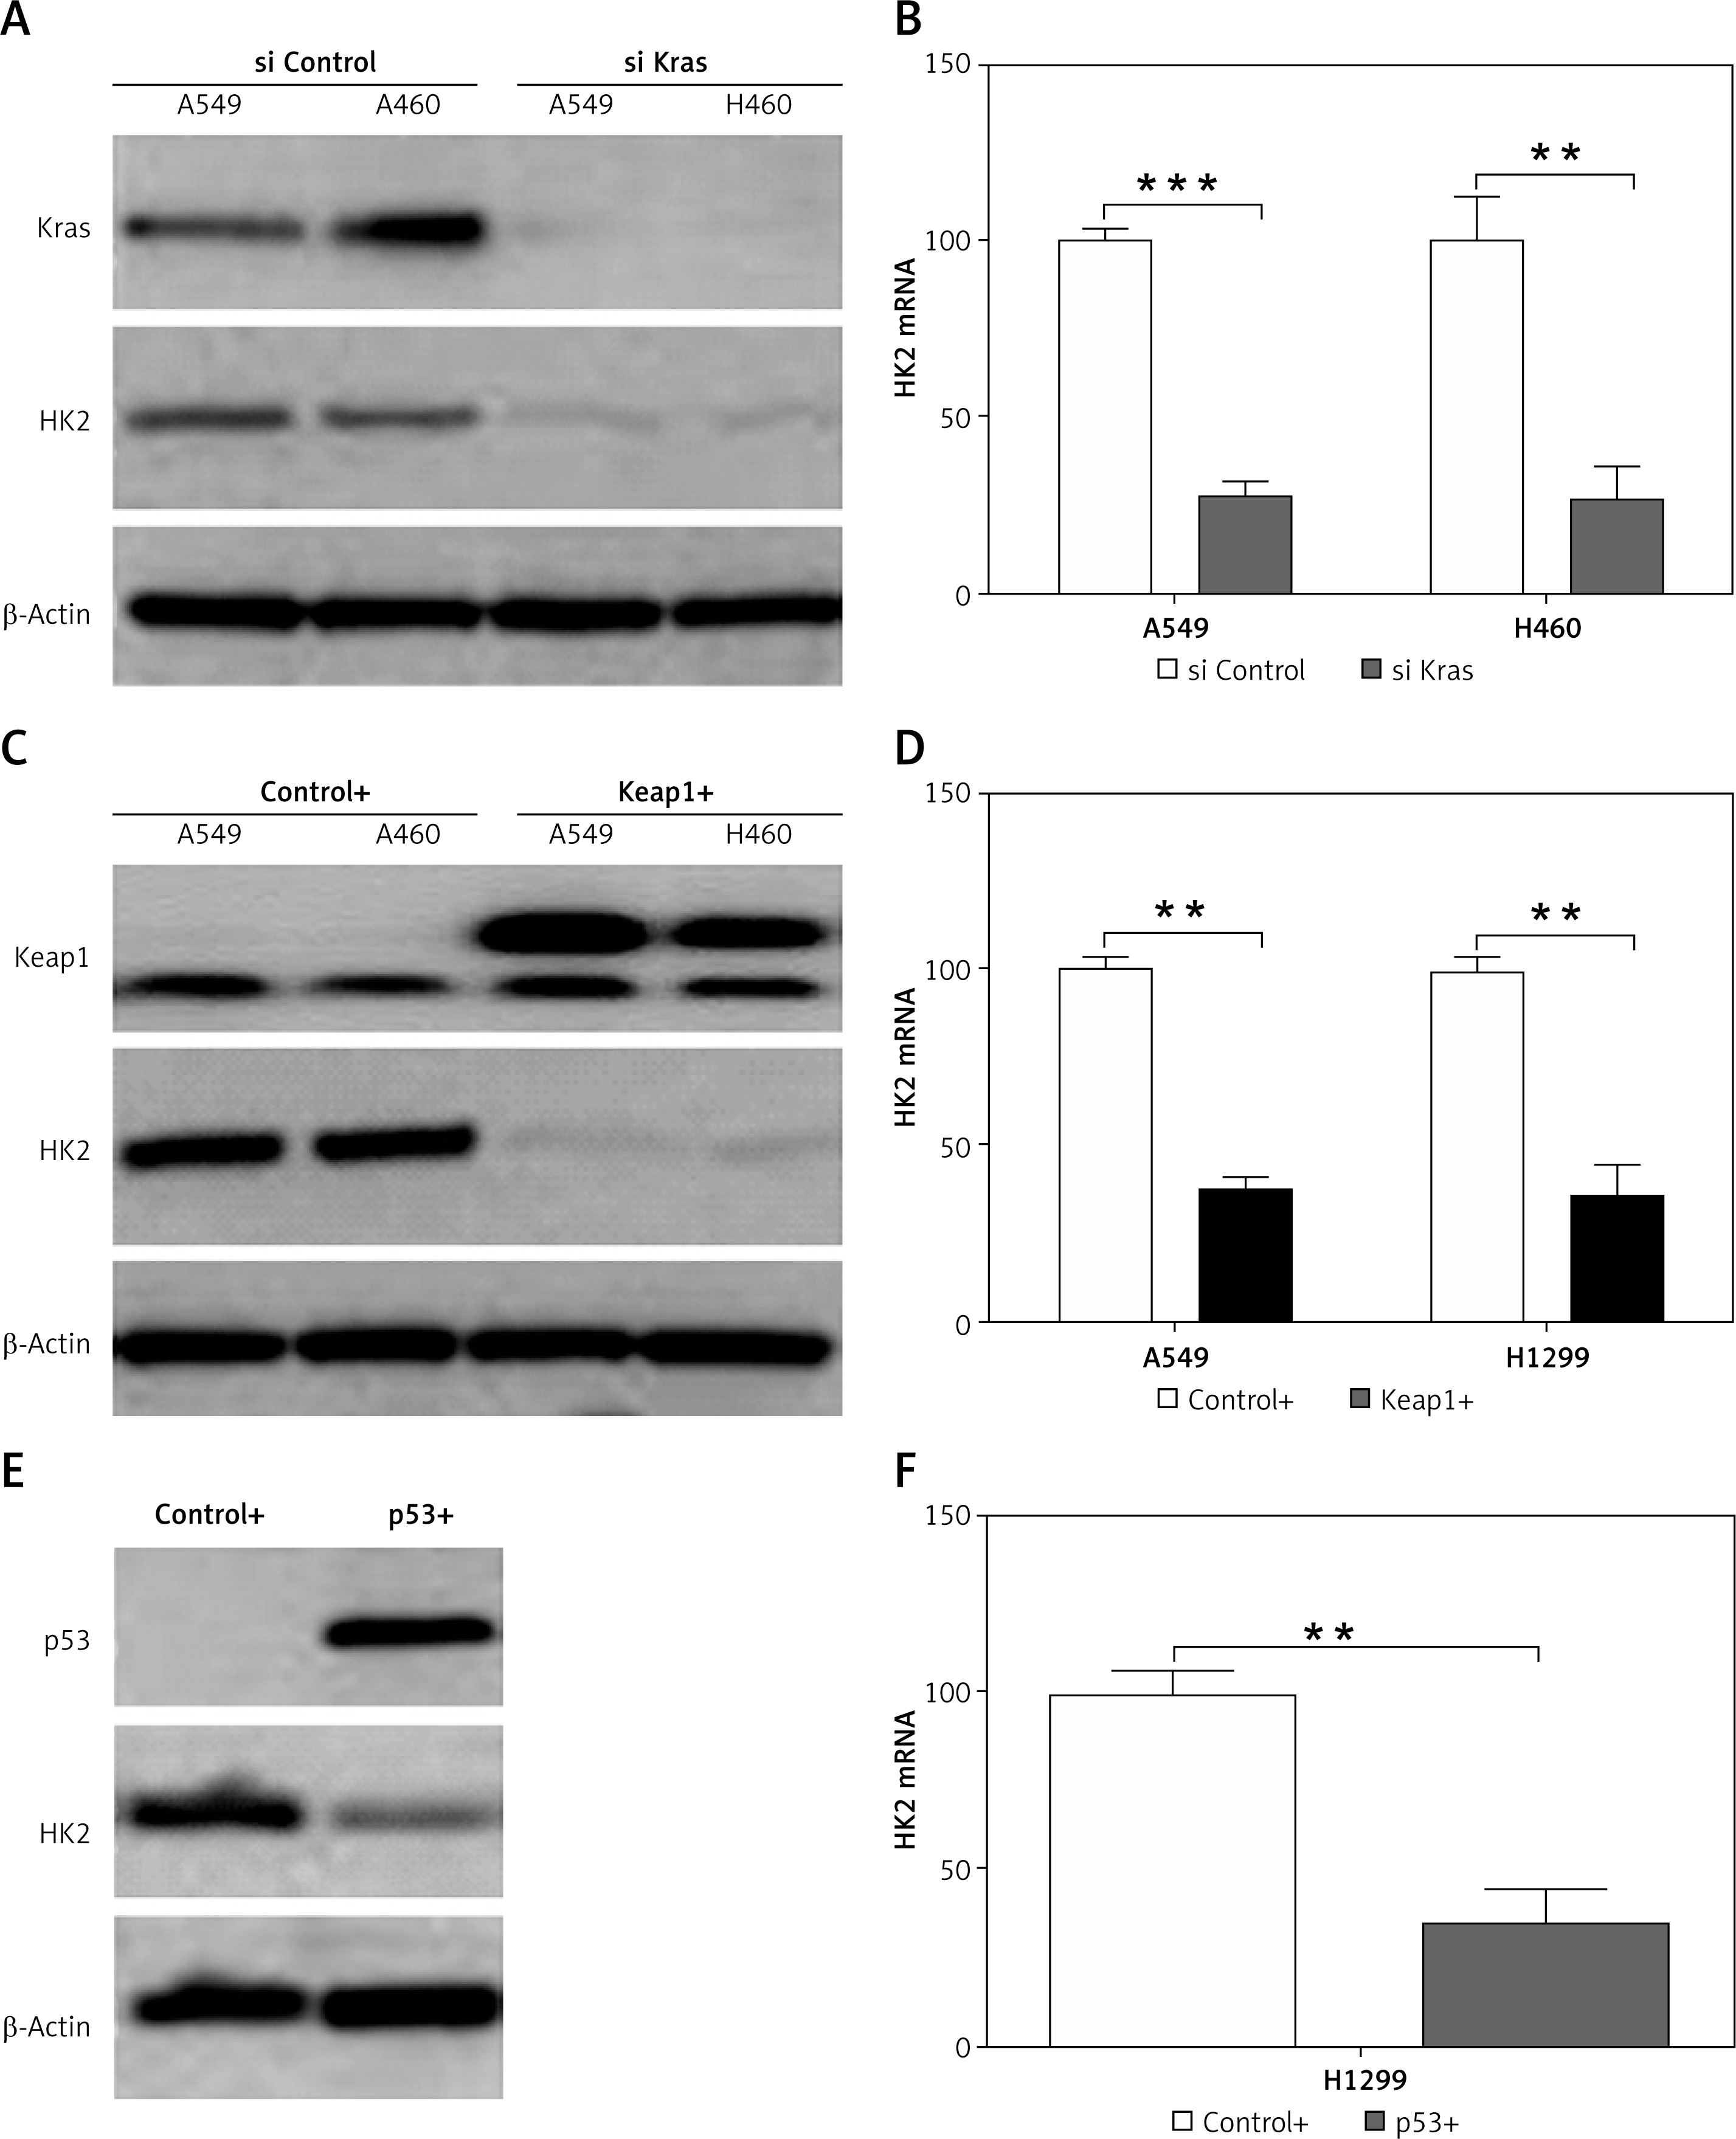
The Kras mutations, loss of function mutations in p53 (50–70%), and Keap1 mutation (~11%) are the most common mutations identified in human NSCLC [22]. We, therefore, investigated whether the expression of HK2 is correlated with the mutation of these several genes. To address this question, several different LC cell lines were used, including Kras and Keap1 double mutant cells, A549 and H460, and p53 null cell, H1299. We found that the depletion of Kras in A549 and H460 suppressed the HK2 expression in protein and mRNA levels (Figures 2 A, B). Similarly, overexpression of WT KEAP1 in A549 and H460 cells also inhibited the protein and mRNA level of HK2 (Figures 2 C, D). Furthermore, overexpression of WT p53 in H1299 had a suppressive effect on HK2 expression (Figures 2 E, F). Therefore, our results suggest that mutations of oncogene or tumour suppressor in LC lead to higher expression of HK2.
Figure 2
The HK2 expression is mediated by the mutation of Kras, p53, and Keap1. A – The expression of Kras and HK2 in A549 and H460 cells with control and Kras siRNA transfection. B – The mRNA level of HK2 in A549 and H460 cells with control and Kras siRNA transfection. C – The expression of Keap1 and HK2 in A549 and H460 cells transfected with control (pcDNA3) and WT Keap1 (pcDNA3 flag-Keap1). D – The mRNA level of HK2 in A549 and H460 cells transfected with control (pcDNA3) and WT Keap1 (pcDNA3 flag-Keap1). E – The expression of p53 and HK2 in H1299 cells transfected with control (pcDNA3) and WT p53 (pcDNA3 p53). F – The mRNA level of HK2 in H1299 cells transfected with control (pcDNA3) and WT p53 (pcDNA3 p53). Each experiment was performed 3 times
**p < 0.01, ***p < 0.001.
HK2 expression promotes LC cells proliferation and invasion
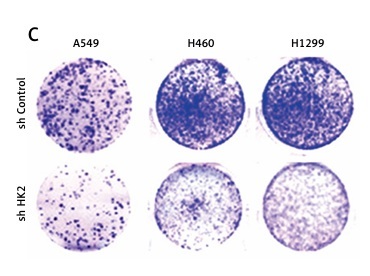
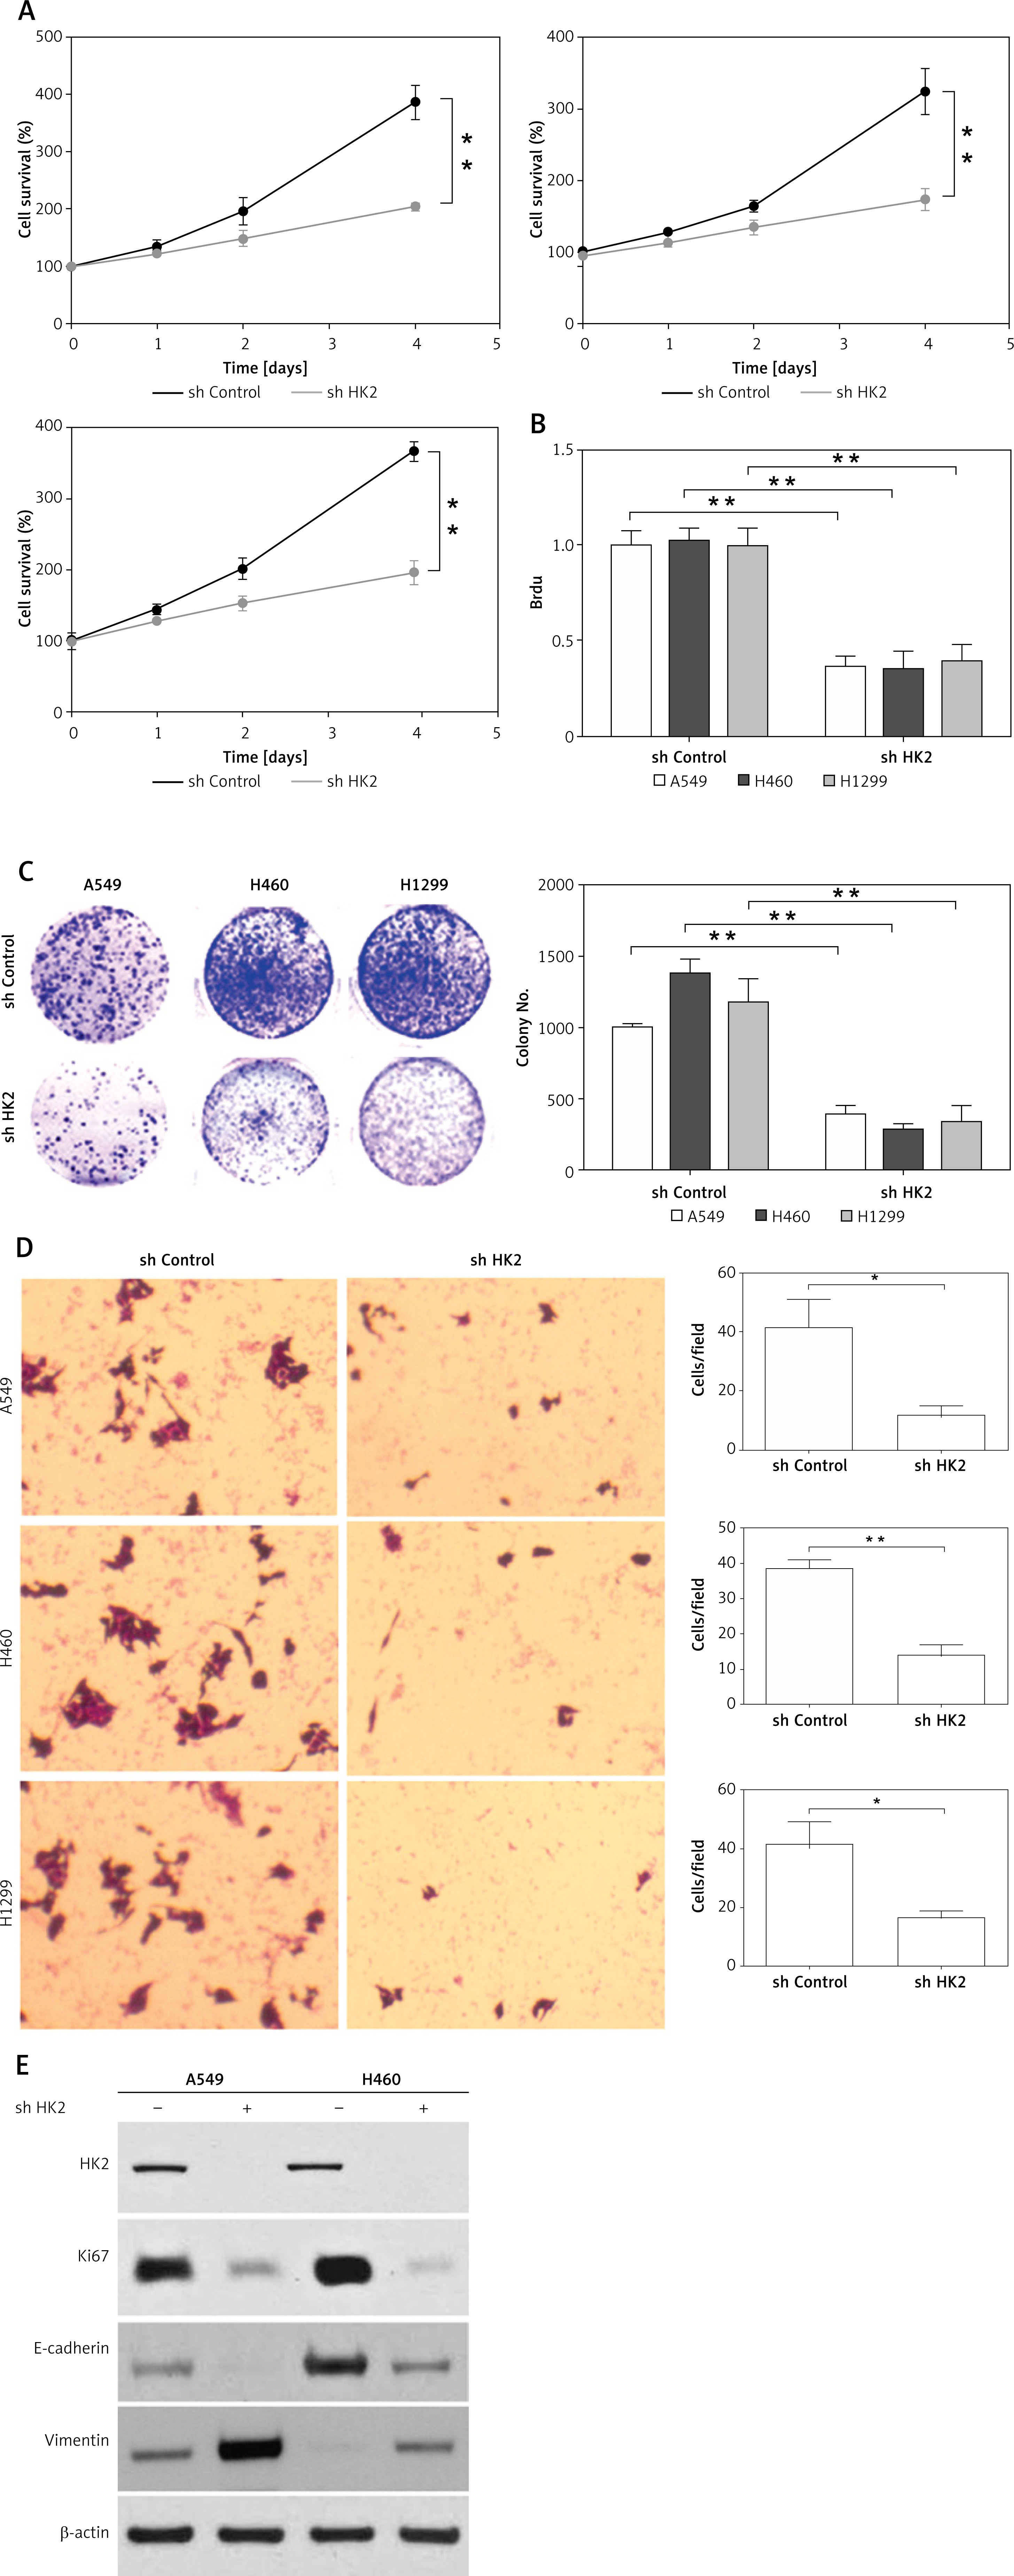
In the next step, we further investigated whether the level of HK2 expression contributes to the LC progression. We knocked down HK2 with shRNA by lentivirus transfection in LC cells with different genomic mutation background, including A549, H1299, and H460 cells. Depletion of HK2 in these three LC cells significantly inhibited cell growth when compared with the cells transfected with control shRNA (Figure 3 A). Brdu assay and colony formation assay further indicated that the proliferation of LC cells was compromised by HK2 knockdown (Figures 3 B, C). Furthermore, we also investigated the effect of HK2 on the migratory/invasive capacity of LC cells. The trans-well assay revealed the absence of HK2 suppressed invasion in A549, H1299, and H460 cells (Figure 3 D). To further confirm the effect of HK2 on LC proliferation and invasion, the expression of proliferation marker, Ki-67, and invasion marker, E-cadherin, and Vimentin, was analysed by western blot. Consistently, the silence of HK2 in A549 and H1299 cells suppressed the expression of Ki-67 and vimentin but enhanced the expression of E-cadherin (Figure 3 E). Therefore, these results indicate that HK2 expression is correlated to the proliferation and invasion of LC cells with different genomic mutations.
Figure 3
Depletion of HK2 in LC cells inhibited cell proliferation and invasion. A – The growth of A549 (first), H460 (second), and H1299 (third) with or without HK2 shRNA transfection was analysed by MTS assay in the indicated time points. B and C. The Brdu assay (B) and colonic formation assay (C) for cell proliferation in A549, H460, and H1299 with or without HK2 shRNA transfection D – The cell invasion of A549 (upper), H460 (middle), and H1299 (lower) with or without HK2 shRNA transfection was analysed by Transwell assay. E – The expression of indicated proteins in A549 and H460 with or without HK2 shRNA transfection. Each experiment was performed 3 times
*p < 0.05, **p < 0.01.
HK2 promotes LC proliferation and invasion by regulating lactate production
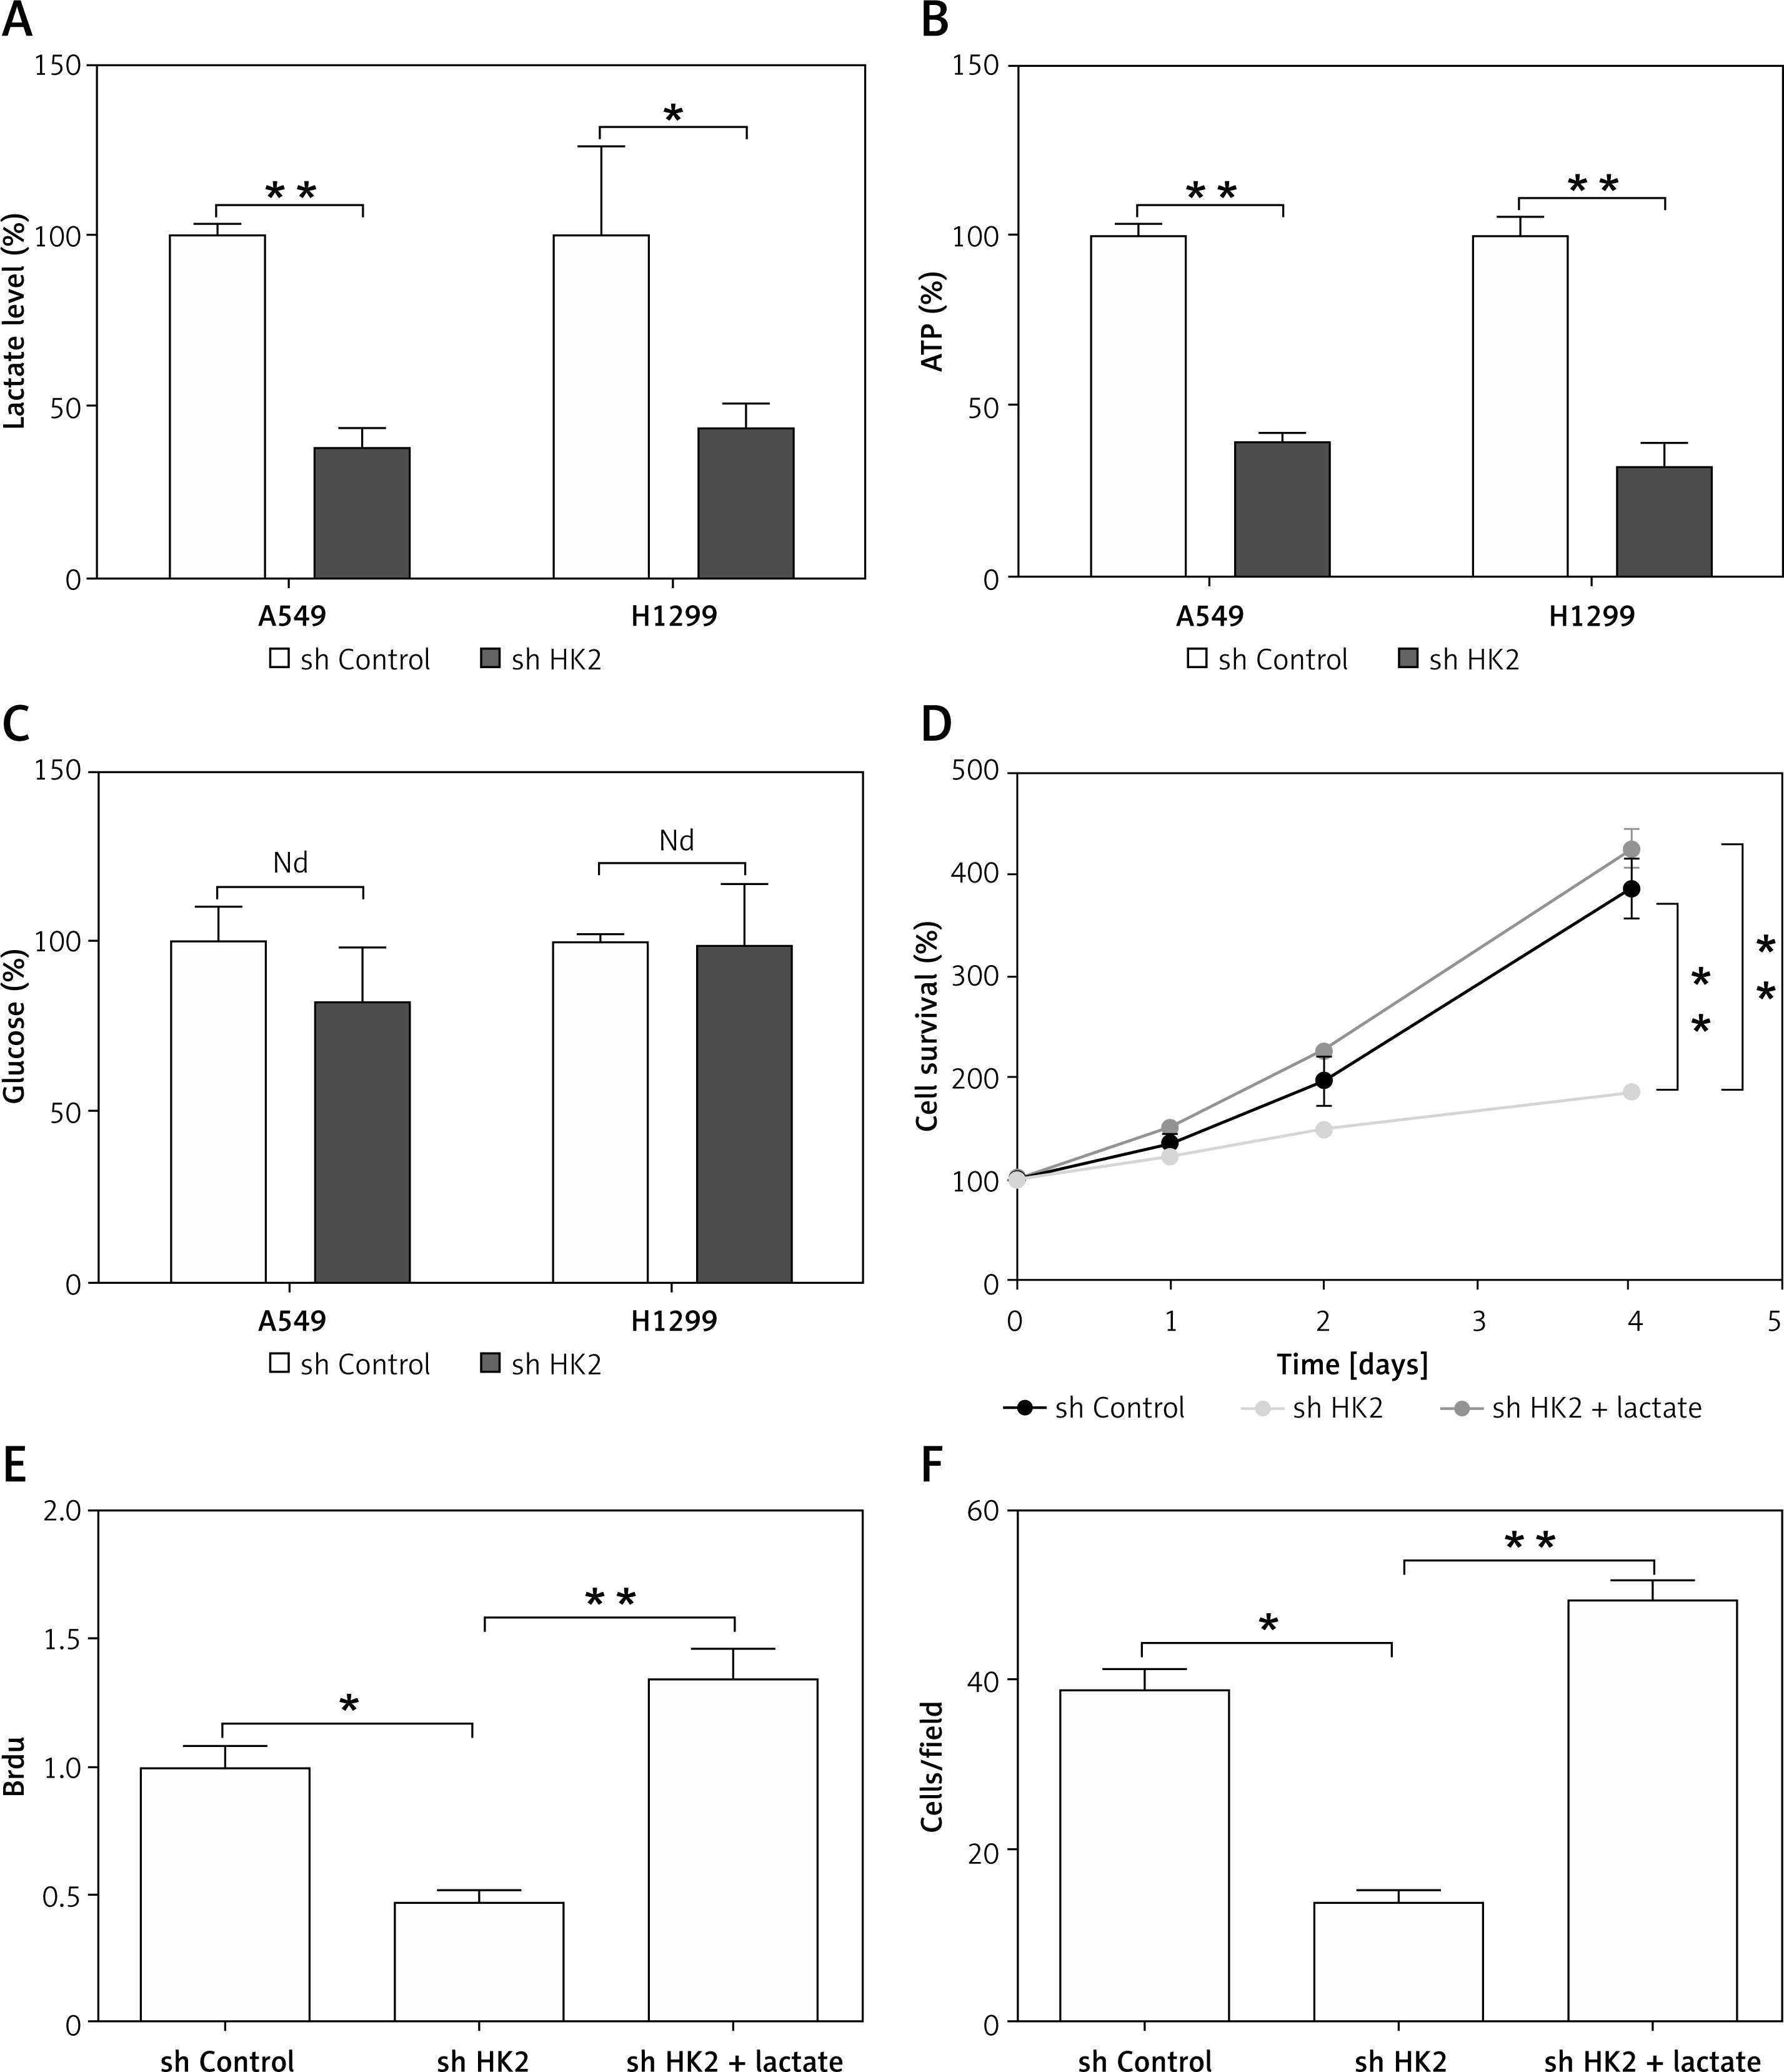
Because HK2 is an important regulator of glycolysis, which has previously been reported to promote cancer progression [4, 23], we hypothesised that the LC proliferation and invasion driven by HK2 was due to changes in glycolysis. Firstly, we measured several glycolysis productions in cell lines with a stable knockdown of HK2, including lactate, glucose, and ATP. To ensure that changes in metabolic production were the consequence of changes in the levels of HK2 but not a change in growth rate, we normalised the value of these product assay to the growth rate of cells as analysed by MTT assay. Consistent with the previous study [15], we found knockdown of HK2 suppressed the lactate and ATP production in A549 and H1299 cells (Figures 4 A, B). However, HK2 depletion did not affect glucose uptake (Figure 4 C). Because lactate is a critical regulator of cancer development [4, 24], we next determined if the addition of extracellular lactate was sufficient to reverse the effect of HK2 depletion. Cells were incubated with media supplemented with lactate (40 mM) for 24 h as previously reported [15]. The addition of lactate rescued the proliferation in A549 cells, which was compromised by HK2 knockdown (Figures 4 D, E). Similarly, the supplement of lactate also enhanced the cell invasion in A549 cells with HK2 silence (Figure 4 F). Therefore, our results indicate that lactate production by HK2 contributes to LC cell proliferation and invasion.
Figure 4
HK2 promotes LC cell proliferation and invasion by production of lactate. A–C – The lactate (A), ATP (B), and glucose (C) level in A549 and H1299 cells with or without HK2 shRNA transfection. D – The A549 cells with or without HK2 shRNA transfection were supplemented with 40 mM lactate. The growth of was analysed by MTS assay at the indicated time points. E – The proliferation of A549 cells treated as in (D) was analysed by Brdu assay. F – The invasion of A549 cells treated as in (D) was analysed by Transwell assay. Each experiment was performed 3 times
Nd p = 0.05, *p < 0.05, **p < 0.01.
Knocking down HK2 expression inhibits LC tumour growth and sensitised to chemotherapy
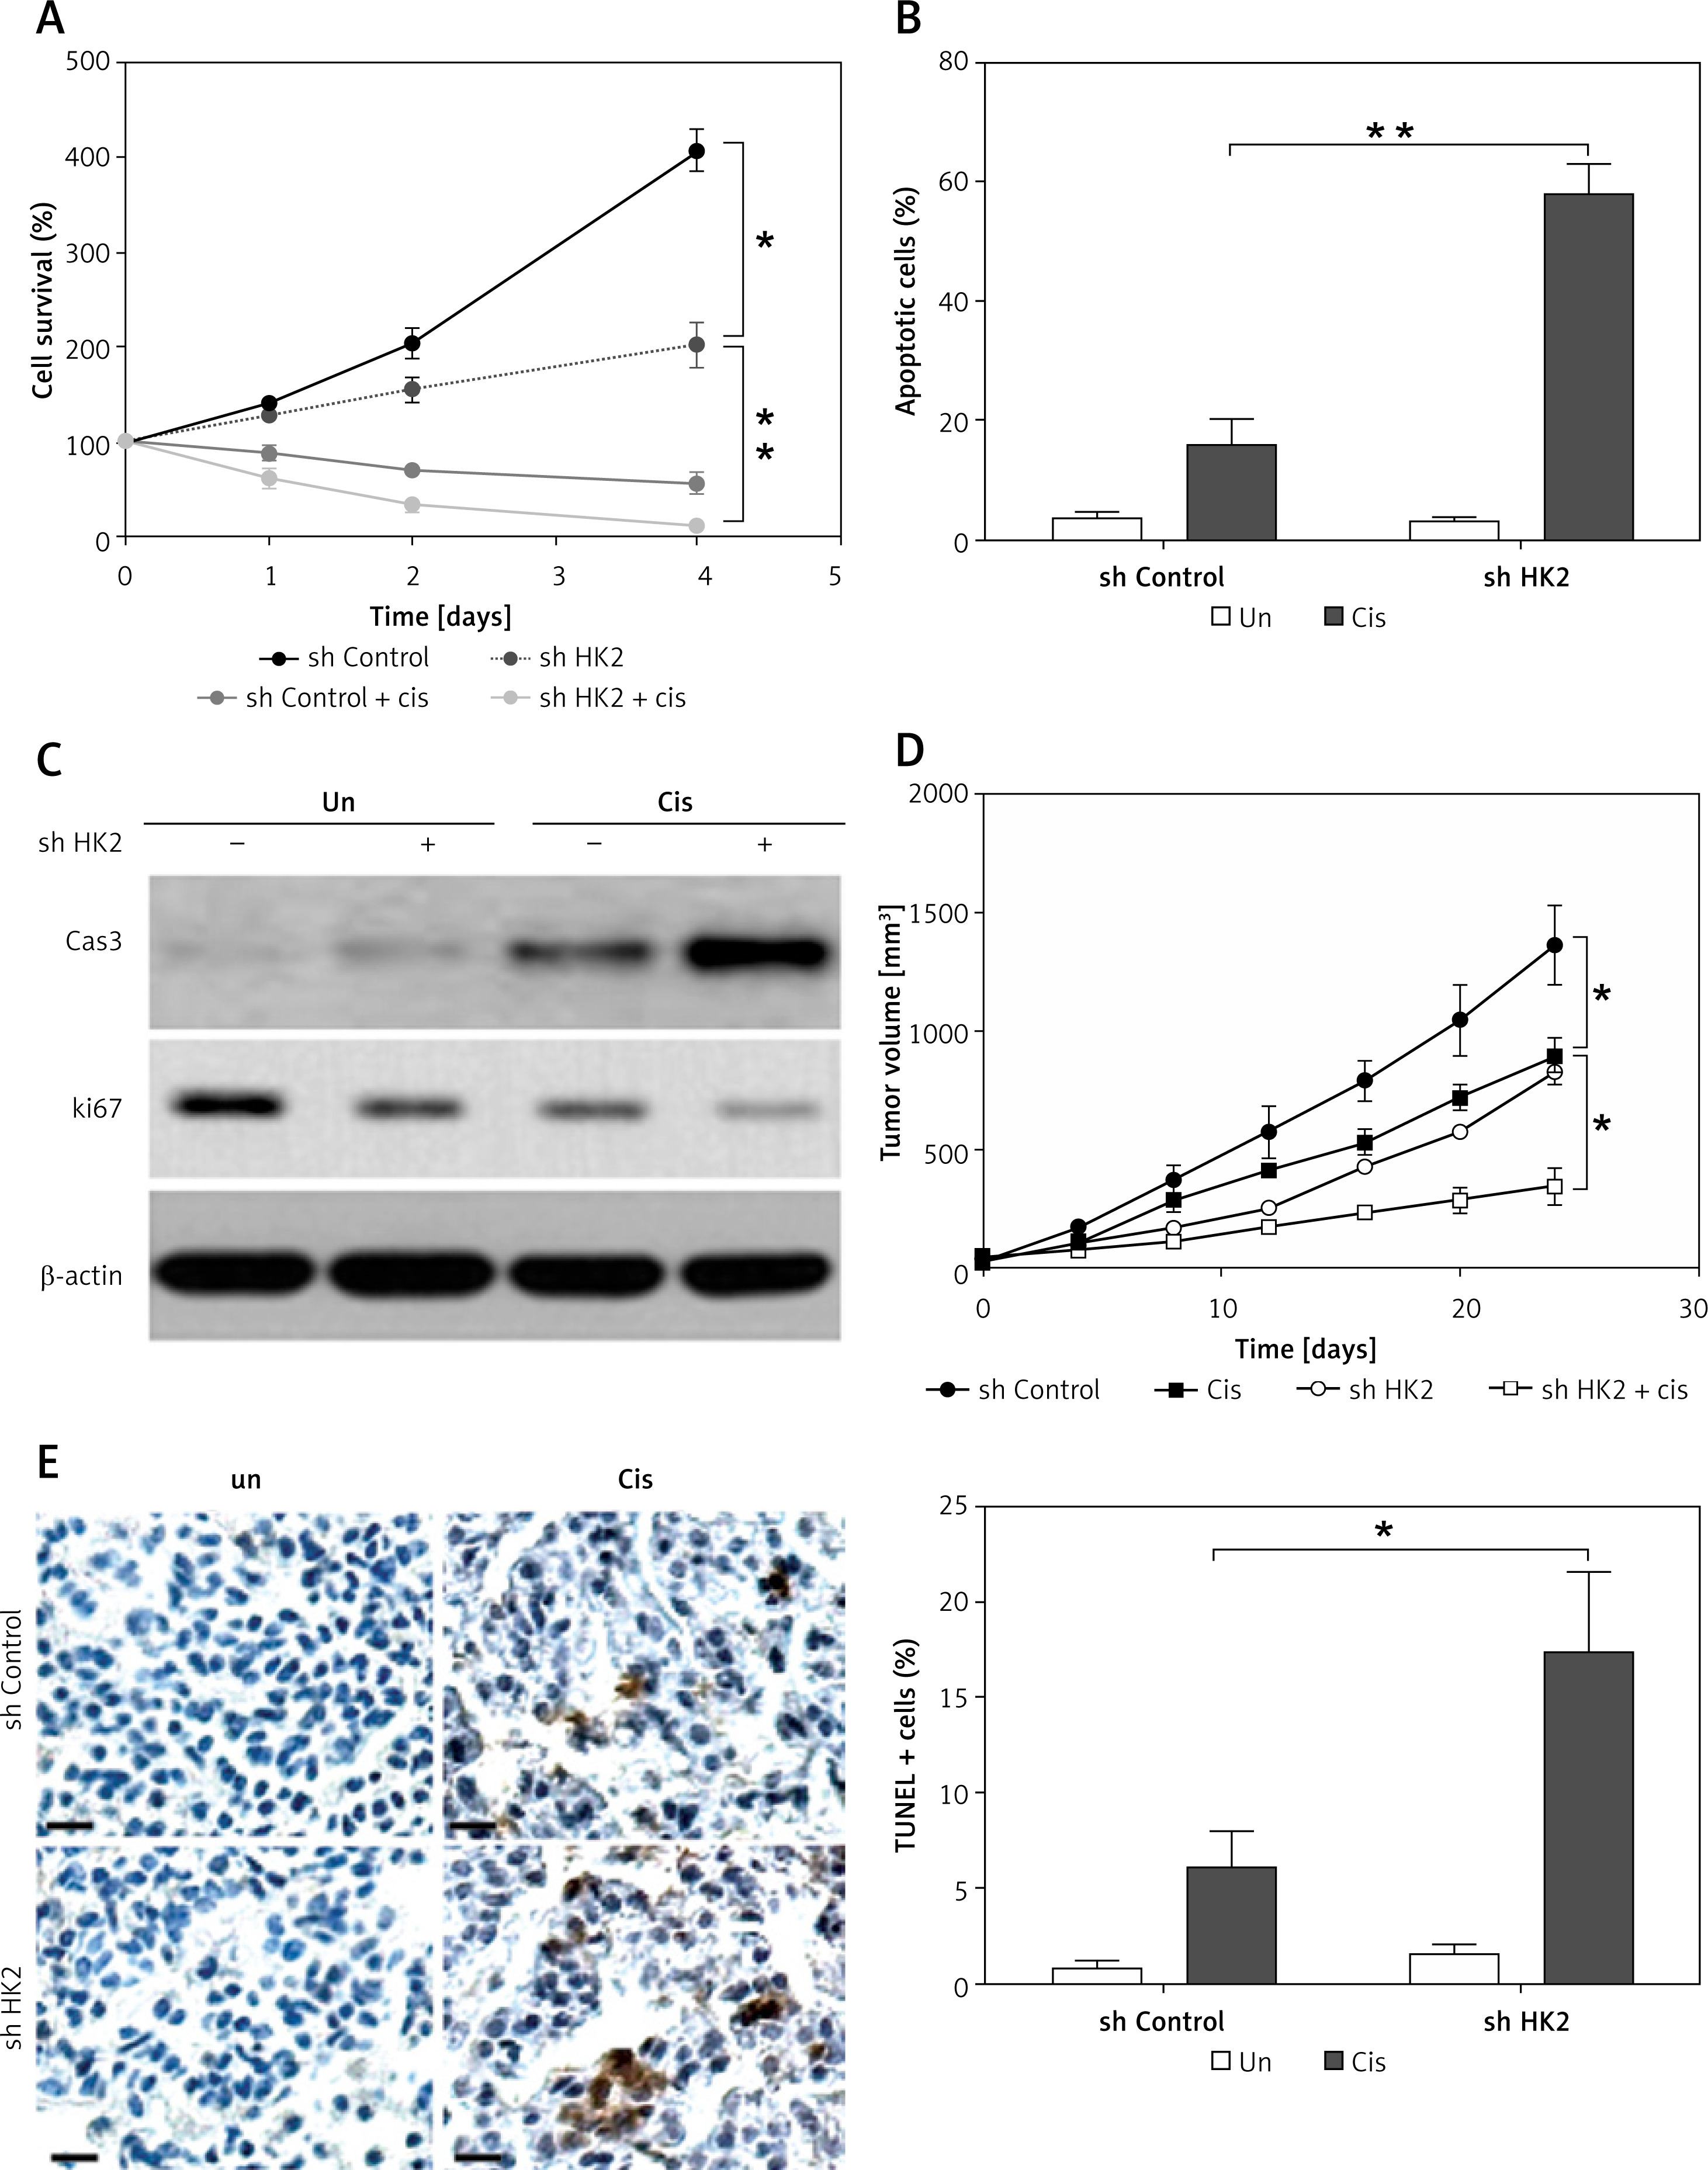
Because the loss of HK2 led to a reduction in glycolysis and suppression of tumour growth, we hypothesised that it might enhance the kill effect of chemotherapy drugs in LC. Therefore, cisplatin, one of the commonly used chemotherapy drugs in LC treatment, was used to treat A549 cells with or without HK2 stably knockdown. As predicted, the absence of HK2 sensitised the A549 cells to cisplatin-induced apoptosis, and dramatically suppressed the cell proliferation (Figures 5 A–C). To confirm that HK2 plays a role in the growth and chemosensitivity in LC in vivo, the growth and A549 xenografts in nude mice were examined. A549 cells with or without stable HK2 knockdown were inoculated subcutaneously into nude mice and treated with cisplatin by I.P injection. The tumours with HK2 knockdown had a slower growth rate and smaller tumour size, when compared with the tumours with control shRNA transfection (Figure 5 D). In terms of chemosensitivity, absence of HK2 also enhanced the tumour-suppressive effect of cisplatin (Figure 5 D). Furthermore, TUNEL staining revealed that depletion of HK2 enhanced the cisplatin-induced apoptosis in xenografted tumours (Figure 5 E). Collectively, these results indicate that HK2 expression mediates tumour growth and chemosensitivity in vivo.
Figure 5
HK2 depletion suppressed tumour proliferation and enhanced the killing effect of cisplatin in vitro and in vivo. A – The A549 cells with or without HK2 shRNA transfection were treated with low lethal dosage of cisplatin (5 μM). The growth of was analysed by MTS assay at the indicated time points. B – The A549 cells with or without HK2 shRNA transfection were treated with 5 μM cisplatin for 48 h. The apoptosis was analysed by Hoechst-33258 nuclear staining. C – The A549 cells were treated as in (B), the expression of cleaved caspase-3 (cas-3) and Ki-67 was analysed by western blot. D – The growth of tumours in nude mice xenografted with A549 cells stably transfected with or without HK2 shRNA, and treated with 5 mg/kg cisplatin. E – The immunochemistry staining of TUNEL in different groups of tumours. Left, the representative pictures, scale bar, 20 μm; right, the statistic calculation of the percentage of TUNEL positive signals
*p < 0.05, **p < 0.01.
HK2 is required for LC metastasis in vivo
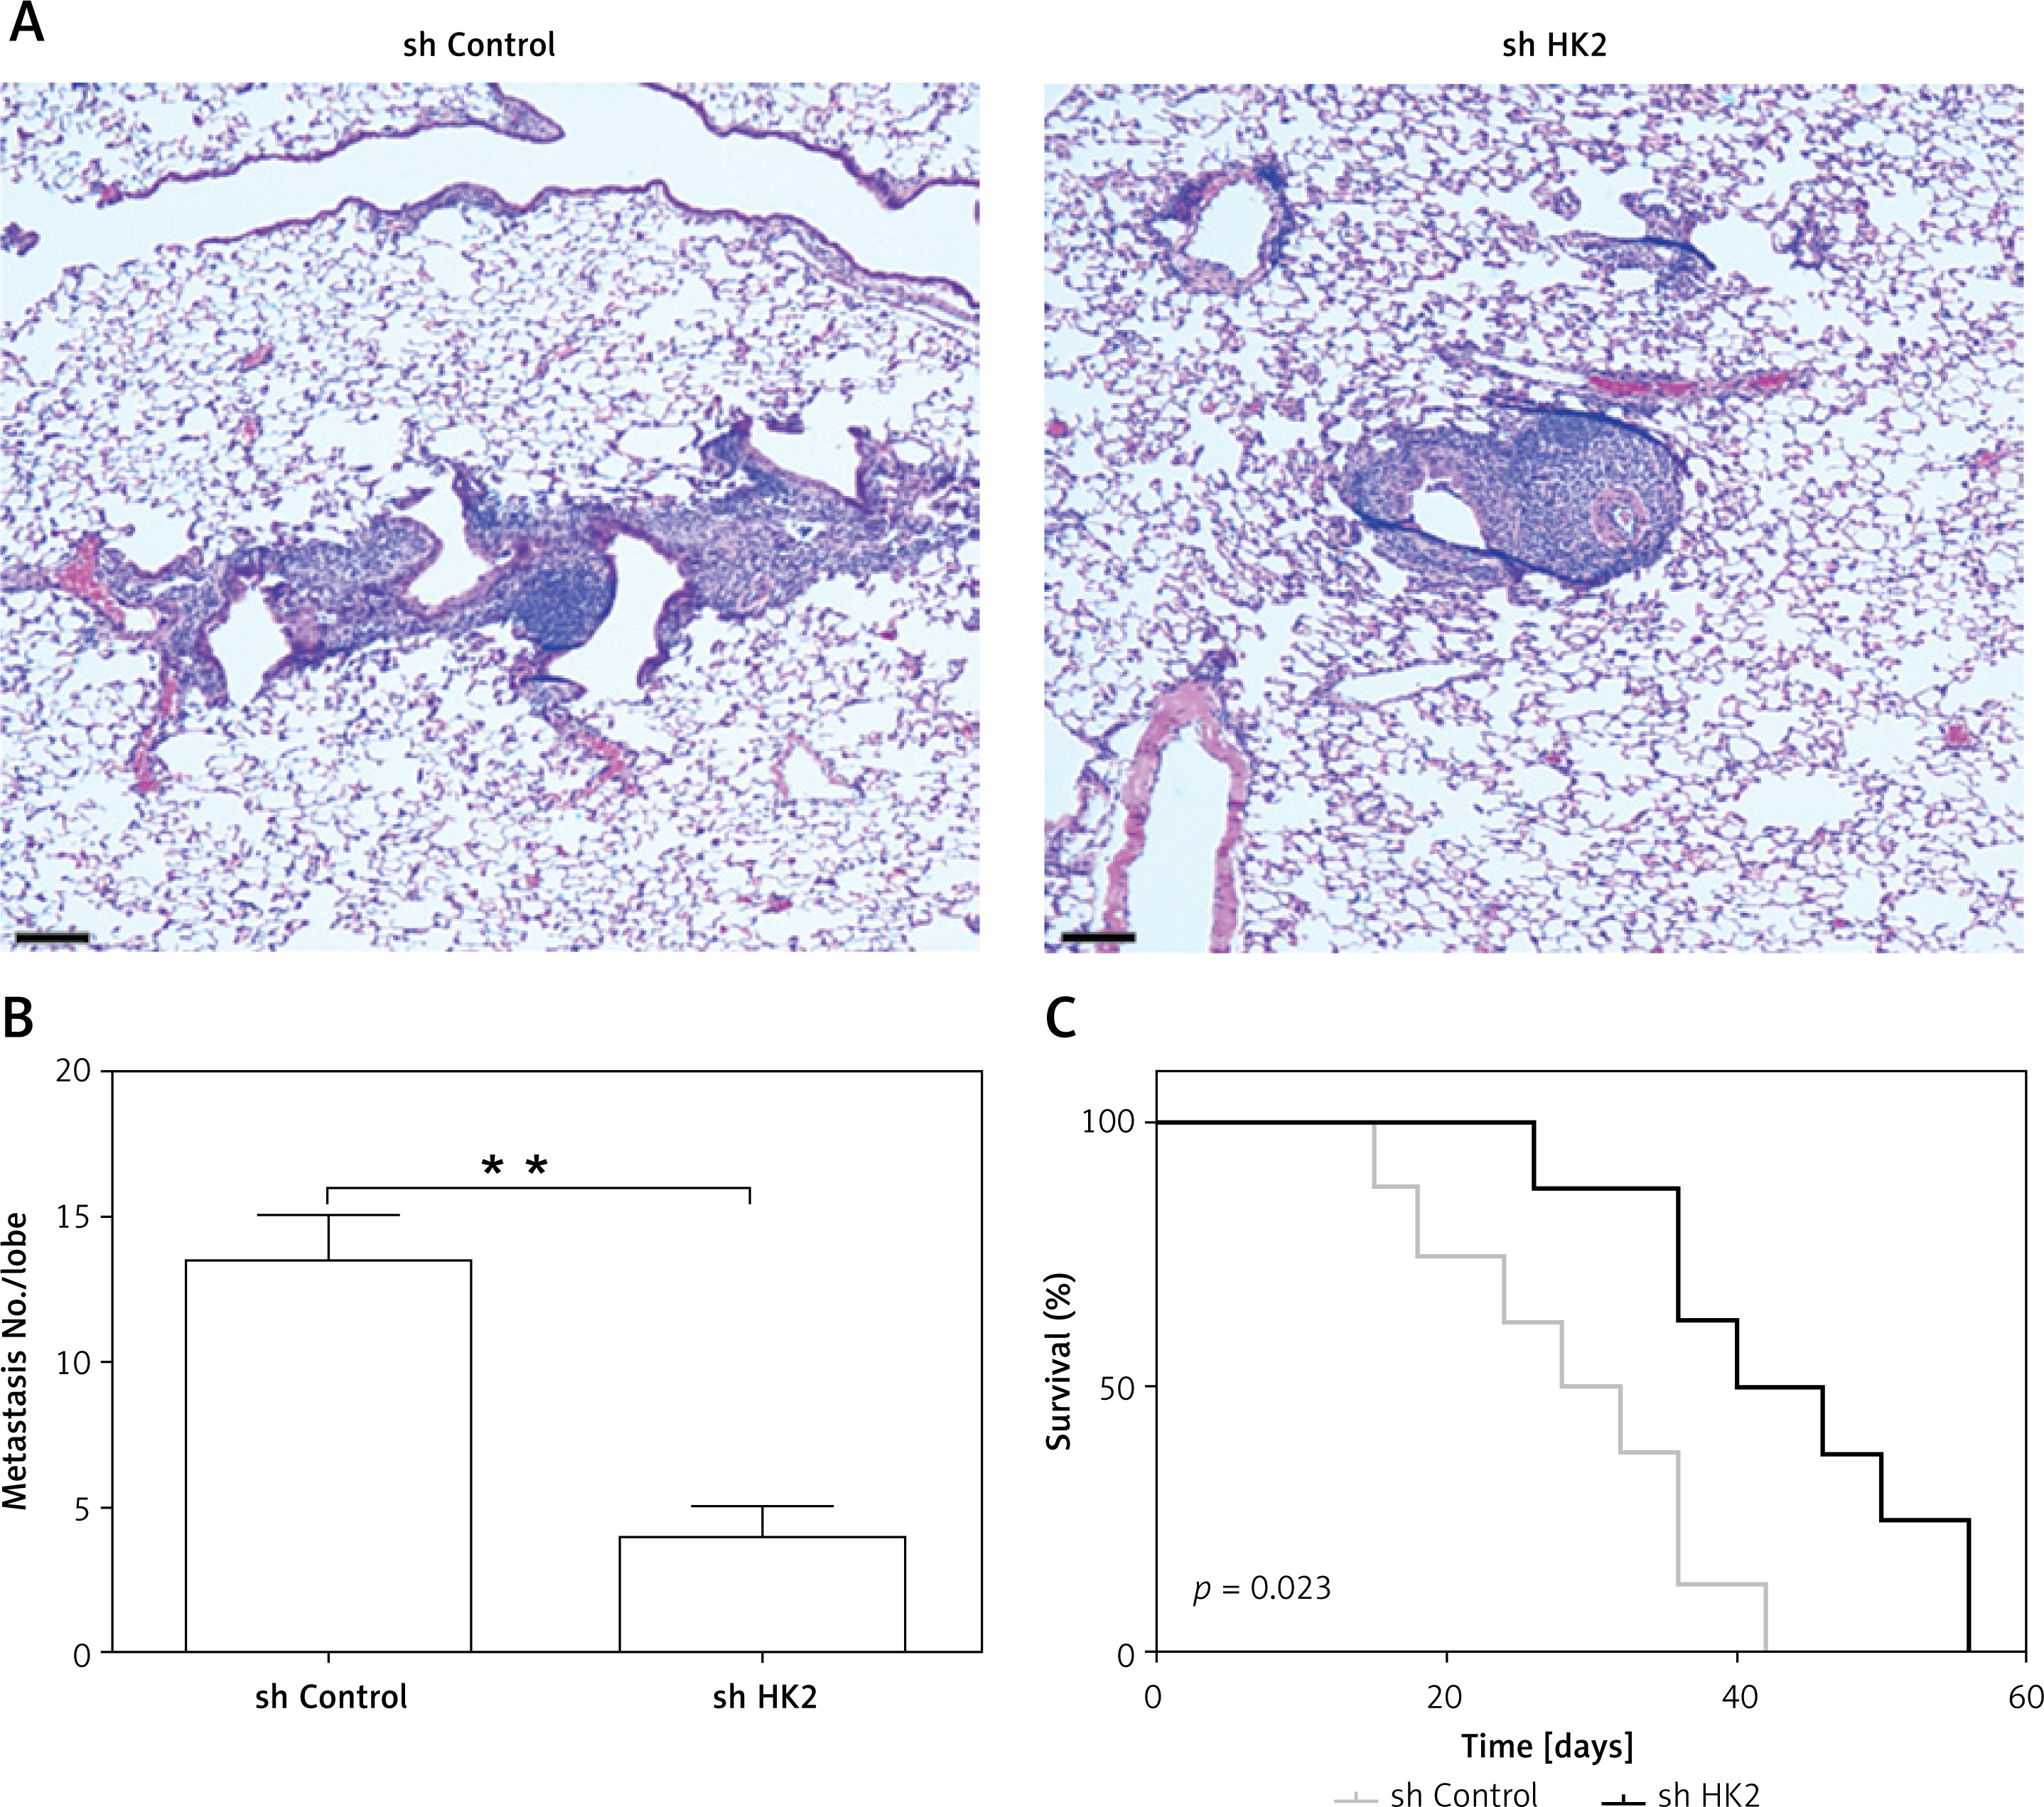
To examine the requirement of HK2 for the LC metastasis, a tail vein tumour metastasis model was used. A549 cells with or without HK2 stable knockdown were injected into nude mice by tail vein injection. Six weeks after injection, mice were sacrificed to observe lung tumour formation. The presence of metastatic tumours was analysed using haematoxylin and eosin (H&E) staining of sectioned lung tissue obtained from mice. We found that the tumour size and number were smaller in the mice with HK2 stable knockdown A549 cells injection (Figures 6 A, B). Without HK2 in tumour cells, the mice had better survival (Figure 6 C). These results show that HK2 expression is also involved in LC metastasis.
Figure 6
HK2 depletion suppressed the tumour metastasis in vivo. The nude mice (n = 5 for each group) were injected with (1 ȕ 106) A549 cells with or without HK2 shRNA transfection. Four weeks later, mice were sacrificed for tumour metastasis analysis. A – The representative of metastatic tumours in lung. Scale bar, 100 μm. B – The quantification of tumour number in different groups. C – The survival of nude mice (n = 8) injected with (1 ȕ 106) A549 cells with or without HK2 shRNA transfection
**p < 0.01.
Discussion
LC is a highly lethal disease with an increased incidence of metastasis and reduced overall survival [25]. It was reported that genes regulating glucose metabolism were upregulated in LC tumours relative to normal lung tissue, suggesting metabolic dysregulation in human tumourigenesis and metastasis [4, 24]. In this study, we also showed that HK2 was upregulated in both LC patients and LC cell lines. The depletion of HK2 results in decreased LC growth in vitro and in vivo, in agreement with previous reports [15, 18, 19]. The absence of HK2 also suppressed the LC tumour metastasis and sensitised the LC cells to chemotherapy-induced apoptosis both in vitro and in vivo. Importantly, high HK2 expression is correlated to multiple frequent mutations, including p53, Kras, and Keap1, and the tumour-suppressive effect of HK2 depletion commonly happens in LC cells with different genomic backgrounds, including Kras, p53, and keap1 mutation. Therefore, our data suggest that targeting HK2 might be widely used in therapy for LC patients with different genomic mutations.
Kras mutations and loss of function point mutations in p53 are the top mutations identified in human LC, which accounts for 10–30% and 50–70%, respectively [25]. The oncogene Kras is the best potential target of oncogenes because it modulates multiple growth regulatory cascades. What is worse, most Kras overexpression patients also show a loss function of p53 [25, 26]. The Kras gene, encoding a small GTP-binding protein, plays critical roles in mediating multiple signal pathways involved in cell growth, differentiation, apoptosis, and cell metabolism. As its function in cellular metabolism, Kras mediates glucose uptake and drives glucose intermediates into pentose phosphate pathways (PPP) [27, 28]. Recently, WT p53, as a tumour suppressor, was reported to negatively regulated glycolysis [29]. However, as a frequently mutated gene, mutant p53 proteins were reported to mediate metabolic changes as a novel gain of function to promote tumour development [30]. Therefore, the strategy to target glycolysis can be an effective therapeutic method to overcome Kras and p53 mutation in LC patients. In this study, we found that depletion of mutant Kras or overexpression of WT p53 can suppress the expression of HK2, which is supported by previous studies [19, 31]. Accordingly, our results also show that depletion of HK2 suppressed the LC cell proliferation and invasion in different LC cells with or without Kras and p53 mutation.
Other than mutation of Kras and p53, Keap1 mutation also frequently occurs in LC patients (~11%) [32]. In the process of lung tumourigenesis, cancer cells enhance their metabolic output, which leads to the production of reactive oxygen species (ROS) [33]. To maintain homeostasis of oxidative stress, about 30% of NSCLCs change the transcription of antioxidant related genes, such as mutations of Nfe2L2 (encoding Nrf2), mutations of Keap1, a negative regulator of Nrf2 [34]. A recent study showed that Keap1 mutation protected the BACH1 from degradation by FBXO22 via the stabilisation of Nrf2, which led to LC metastasis [35]. Another study published at the same time reported that the stabilisation of BACH1 by Nrf2 promoted LC progression via transcription of HK2, and increased glycolysis [36]. In accordance with these studies, we also found that overexpression of WT Keap1 in A549 and H460 cells suppressed the transcription of HK2, and silence of HK2 also reduced the LC growth and invasion in Keap1 mutant LC cells. Therefore, targeting HK2 to suppress the tumour glycolysis can be widely implied in LC patients with Kras, p53, or Keap1 mutations. It will be interesting to study further the function of HK2 in other mutations, such as Braf, EGFR, etc.
HK2 plays an important role in regulating glucose uptake, the upstream of metabolic pathways [9]. Direct targeting of HK2, therefore, can hinder the transportation of glucose, which is necessary for tumour progression [23]. Here, we also show that the upregulation of HK2 in primary tumours is associated with worse overall survival in LC patients. Mechanically, we found that HK2 expression promotes LC cell proliferation, metastasis, and chemoresistance. Along with the observation that HK2 is upregulated in LC primary tumours, these data supported a role for HK2 in the LC tumour progression. The aggressive tumour showed increased rates of glycolysis, indicating that glycolysis may be important for tumour progression and metastasis [37]. We found that HK2 directly promotes LC tumour proliferation and metastasis via regulation of glycolysis, because the supplement of lactate production is sufficient to promote LC cell growth and invasion, even in HK2-absent cells. This result is in agreement with previous studies showing that extracellular lactate promotes migration of LC cell lines [4] and enhances the growth of glioblastoma cell lines [38]. It was also reported that increased lactate production led to poor patient outcomes [4, 24]. Therefore, our results suggest that direct targeting of HK2 or inhibition of glycolysis may improve patient outcomes.
In conclusion, the present study demonstrated that HK2 expression is involved in LC tumourigenesis and metastasis. Our data suggest that the targeting of HK2 may be a promising approach for LC patients with various genomic mutation backgrounds. In the future, it will be interesting to study the mechanism of HK2 abnormal expression in LC, as well as its downstream signal pathway in mediating LC progression.