Introduction
Globally, prostate cancer (PCa) is a significant cause of male illness and mortality. In 2020, more than 190,000 men in the US received a prostate cancer diagnosis, and the disease was was held responsible for almost 33,000 deaths [1]. Metastatic PCa is now considered incurable, while localized PCa is typically associated with better prognoses. In the past twenty years, significant progress has been made in the biological understanding and treatment of metastatic PCa. Since 2004, the US has approved ten novel treatments for metastatic castration-resistant prostate cancer (mCRPC). Consistently, the quality of life of the PCa patients has now improved and the life expectancy is longer. Notwithstanding these major advancements in systems-based management, neoplastic heterogeneity and acquired therapeutic resistance continue to be critical barriers that limit long-lasting remissions and prevent individuals with metastatic illness from being curable [2–4]. To address these challenges, a biomarker-based precision healthcare approach is required.
While the first tumor-specific metabolic alterations were observed approximately a century ago, the subject of carcinoma metabolism has developed as a new theme of interest recently. These explorations of carcinoma cell metabolism have extended our knowledge of the mechanistic and functional consequences of tumor-related metabolic modifications at various phases of oncogenesis. Specifically, the altered metabolism involved in neoplasia includes virtually all stages of cellular interactions with metabolites, with long-term effects on cell fate, including the differentiation of tumor cells themselves as well as the constituent components of the neoplastic microenvironment [5]. The identification of metabolic re-programming as a hallmark of carcinoma has broadened the therapeutic scope of carcinomas [5]. Metabolically, the carcinoma cells maximize the consumption and generation of energy through the activation of multiple molecular processes that form the foundation of a whole range of metabolic adaptations [5]. Additionally, this plasticity in the metabolism of carcinoma cells supports the expansion, aggression, and metastasis of neoplasms [6]. The metabolic characteristics of carcinoma cells have been revealed and are continuously utilized to formulate innovative anti-cancer regimens. The investigations on PCa are following this tendency and endeavoring to uncover the active and functionally related metabolic pathways in prostate tumors [7, 8].
The glucose transporter 1 (GLUT1), also called solute carrier family 2 member 1 (SLC2A1), is a heterodimer that plays a crucial role in astrocyte basal glucose uptake. Widely expressed throughout various tissues, GLUT1 exhibits particularly high levels in the brain and erythrocytes, where it is the primary contributor to basal glucose uptake [9]. The uptake of glucose is dependent on the available extracellular glucose [10]. As soon as glucose has entered the astrocyte, it is transformed into glucose-6-phosphate (G6P) in a process called glycolysis. In glycolysis, enzymes such as glycogen synthase can establish glycogen storage. Mounting evidence has suggested that lncRNAs, as carcinogenic genes or neoplastic suppressors, contribute to the initiation and progression of human carcinomas. Long non-coding RNAs (lncRNAs) have emerged as promising diagnostic tools for prostate cancer due to their differential expression patterns compared to benign prostatic hyperplasia. These molecules exert a significant regulatory influence on hallmarks of cancer progression, including proliferation, metastasis, and programmed cell death. This regulatory function is mediated through interactions with established signaling pathways involving STAT3, NF-κB, PTEN, PI3K/Akt, and miRNAs. Notably, lncRNAs exhibit distinct expression profiles in prostate cancer, with upregulation of tumor-promoting lncRNAs and downregulation of tumor suppressors [11]. Small nucleolar RNA host gene 16 (SNHG16), encoded by a 7571-bp region on chromosome 17q25.1, has recently been recognized as a cancer-related lncRNA. It was originally identified as an oncogenic lncRNA in neuroblastomas and has subsequently been recognized as an oncogenic modulator in various malignancies [12, 13], including prostate cancer [14]. The overexpression of SNHG16 has been implicated in the clinical and pathological characteristics of carcinoma patients and mediates cell proliferation and invasion through a variety of potential mechanisms [15]. Therefore, SNHG16 may be a promising biomarker and therapeutic target for prostate cancer. In addition, the transcription factor Sp1 is regarded as an elementary translational factor and is associated with the role of regulating so-called housekeeping genes [16]. It has been shown that Sp1 is strongly modulated by post-translational modifications, which have both positively and negatively impacted Sp1 activity in a range of genes [17]. Yin et al. identified miR-181b as a tumor suppressor in glioblastoma multiforme (GBM) by targeting SP1, a pivotal regulator of cellular metabolism. This study highlights miR-181b’s significant role in modulating glucose metabolism, a hallmark of cancer progression. By reducing SP1 expression, miR-181b suppresses the levels of PKM2 and Glut1, critical enzymes involved in aerobic glycolysis [18]. Sp1 is commonly overexpressed throughout multiple cancers and simultaneously triggers and represses the performance of several essential carcinogenic genes and neoplastic suppressors, as well as genes involved in essential cellular functions [19]. Although the role of SNHG16/GLUT1 has been studied to some extent [20], the effects of the SP1/SNHG16/GLUT1 axis in prostate cancer are still unclear. Despite significant progress in understanding the biological mechanisms of PCa and the development of novel treatments, challenges remain in addressing neoplastic heterogeneity and therapeutic resistance. One critical aspect of cancer biology that has gained recent attention is the metabolic reprogramming of cancer cells, which supports their growth and survival. While the role of lncRNAs in cancer metabolism is being increasingly recognized, the specific mechanisms through which lncRNAs such as SNHG16, in conjunction with transcription factors such as SP1, regulate key metabolic pathways in PCa are not fully understood. This study aimed to fill this gap by investigating the SP1/SNHG16/GLUT1 axis and its influence on glucose metabolism, using PC-3 and DU-145 PCa cells to determine its role in prostate cancer proliferation and invasion, thereby providing insights into potential therapeutic targets for PCa.
Material and methods
Cell line culture
PC-3 and DU-145 human prostate cancer cell lines were obtained from the Bena Culture Collection (Kunshan, China). Cell lines were maintained in RPMI 1640 culture medium (GIBCO, Gaithersburg) supplemented with 10% (v/v) fetal bovine serum (FBS) and streptomycin. Additionally, cells were cultured in prostate epithelial cell basal medium (PrEGM) supplemented with 10% charcoal-stripped FBS (Sigma). All the experiments were approved by the First Affiliated Hospital ethics committee of Henan University of Science and Technology (Approval No. 2022-04-B162).
Bioinformatics
The public database GEPIA (http://gepia.cancer-pku.cn/) was explored to assess the expression of SNHG16 in the tissues of PCa and normal cases to examine the potential relationship between SP1/SNHG16 and GLUT1.
CCK-8 assay
Around 4,000 cells per well were grown in a 96-well plate. After being left overnight, the cells were adherent to the plate. This was followed by the addition of 10% CCK-8 (Enzo Life Sciences) and incubation at 37°C for an 1 h. The absorption of every well was monitored at 450 nm with an XS microplate. The same experiment was repeated at least three times.
Lentivirus vector and cell infection
To achieve knockdown, siRNA targeting human SP1 or SNHG16 was purchased from Genechem. For overexpression, the full-length cDNA of human SP1 or SNHG16 was cloned into a lentiviral vector, also obtained from Genechem. PC-3 and DU-145 cells were seeded in six-well plates at a concentration of 5 × 10⁴ cells per well when they reached the logarithmic growth phase and were cultured until they reached approximately 30% confluence. The cells were then incubated with the lentiviral vector containing either SP1 or SNHG16 cDNA or their respective siRNAs for 16 h at 37°C. After incubation, the viral medium was replaced with fresh culture medium. To select for stably transfected cells, the cultures were treated with puromycin (2 µg/ml) for 1 week, ensuring stable knockdown or overexpression of SP1 or SNHG16 in the PC-3 and DU-145 cell lines.
Cellular glycolysis tests
Glucose uptake, lactate generation, and ATP levels were tested with colorimetric glucose assay kits (BioVision, USA), lactate colorimetric assay kits (BioVision), and ATP assay kits (Beyotime), respectively.
Transwell invasion assay
The invasion assay was conducted with 8-µm-diameter Transwell plates. During the invasion test, the filtration plates were pre-coated using 40 µl of the diluted ECM gel for 4 h. Around 1 × 10⁵ cells were plated in serum-free medium in various conditions, and 500 µl of 10% neonatal calf serum was plated in the lower chamber. Plates were cultured for 20–24 h and subsequently fixated with methanol for 15 min and stained with 0.1% crystal violet for 15 min. The cells were cleared from the superior side of the filtration filter with a cotton swab, and the filter was washed with PBS. Each experiment was repeated at least three times.
Real-time qPCR
The cells were prepared for the extraction of complete RNA. Total RNA was reverse transcribed according to the protocol using the PrimeScript RT-PCR kits (TaKaRa). Real-time qPCR was performed on an Applied Biosystems 7500 real-time PCR system using 2× SYBR Green qPCR Master Mix (Biotool, US). The settings were as follows: The used primers were obtained from Qingke Biotechnology (China). The cycling conditions included a single circulation for 5 min at 95°C, 40 circulations for 15 s at 95°C, and 34 s at 60°C. The sequences of the primers are listed in Table I.
Table I
List of the primer sequences used in the study
Statistical analysis
All data for this paper were statistically assessed by GraphPad 9.3.1 and SPSS 20.0. One-way ANOVA tests were undertaken for each individual group, and t-tests were done within two independent groups. The correlation between two genes in the public database was explored by Spearman analysis. The value of p < 0.05 was regarded as statistically significant.
Results
Potential relationship among SP1, SNHG16 and GLUT1
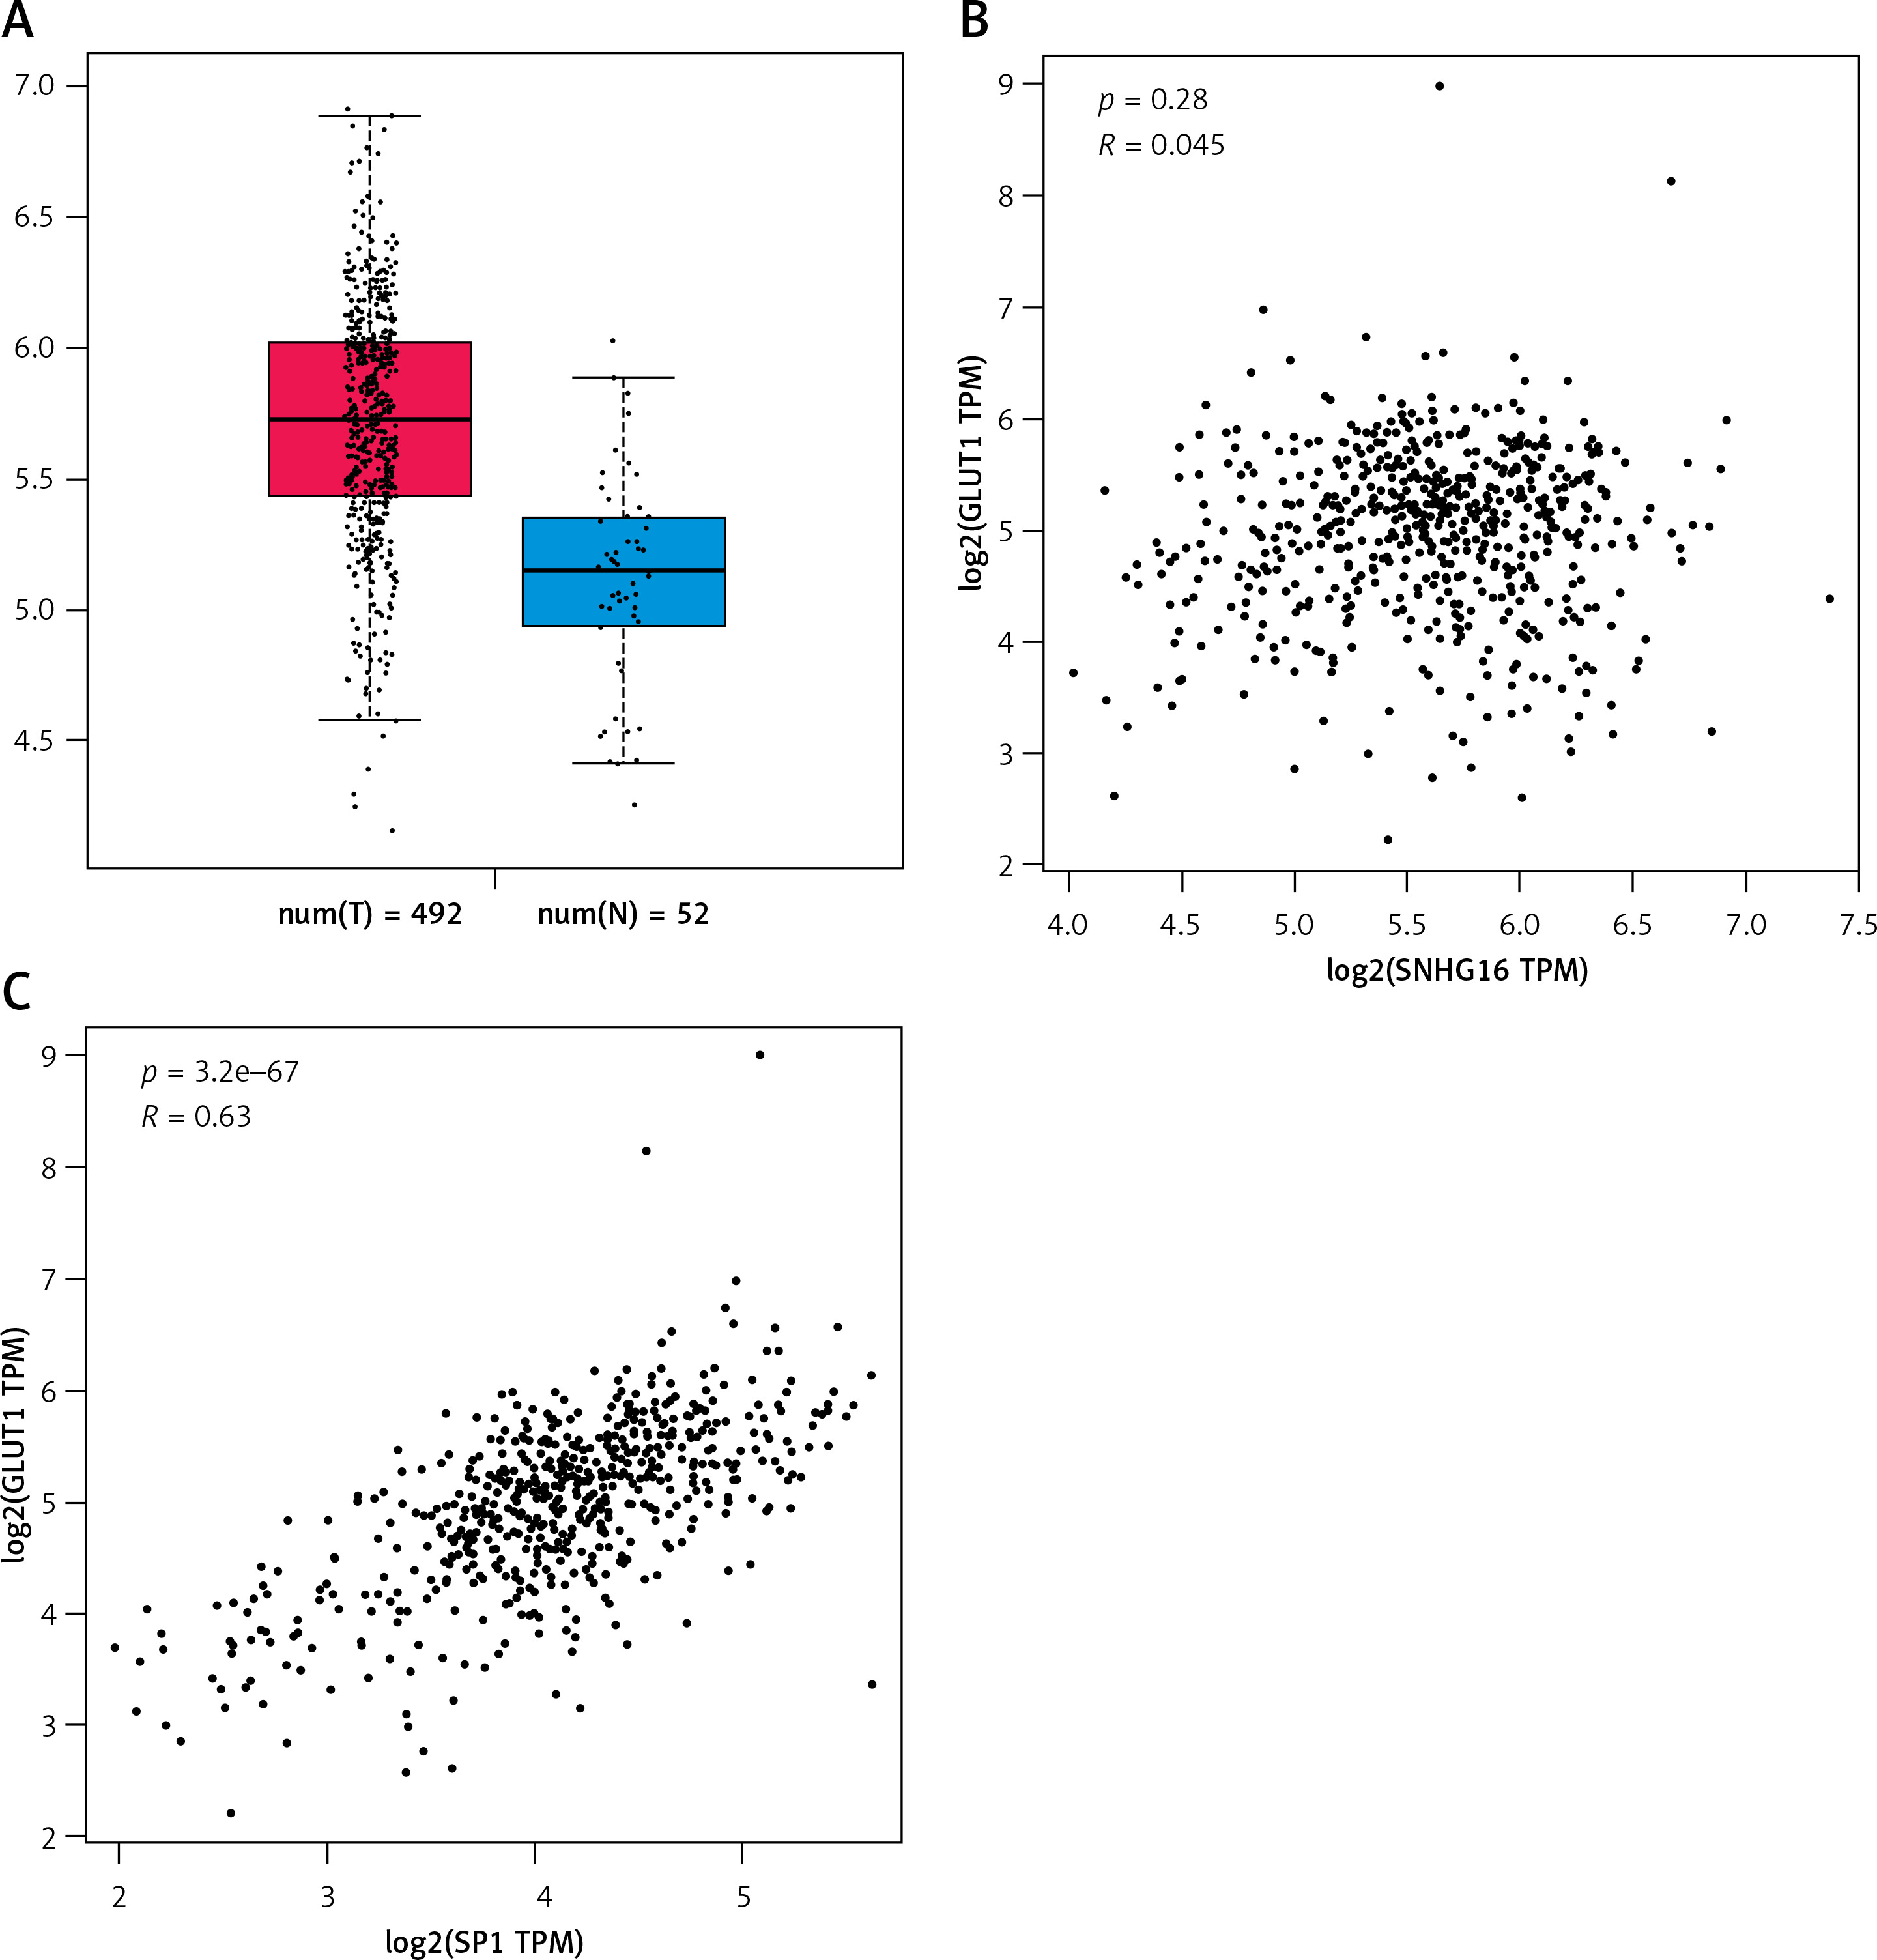
SNHG16 was upregulated in PCa samples compared with the normal cases based on the online GEPIA2 database (Figure 1 C). In the correlation analysis, the expression of SNHG16 was positively correlated with the expression of GLUT1 (SLC2A1) in the PCa tissues (R = 0.45, Figure 1 A) based on the data from the public database (http://gepia.cancer-pku.cn/). Moreover, a positive association between SP1 and GLUT1 (SLC2A1) was also found in the GEPIA2 database (R = 0.34, Figure 1 B). All these findings suggest a relationship among SP1, SNHG16 and GLUT1 genes.
Figure 1
Relationship between SNHG16, GLUT1, and SP1 in prostate cancer. A – Expression of SNHG16 in normal and tumor tissues (*p < 0.05); B – correlation analysis between GLUT1 and SNHG16 expression; C – correlation analysis between GLUT1 and SNHG16 expression. The data sets used were obtained from the online GEPIA database (http://gepia.cancer-pku.cn/). The correlation between two genes was explored by Spearman analysis
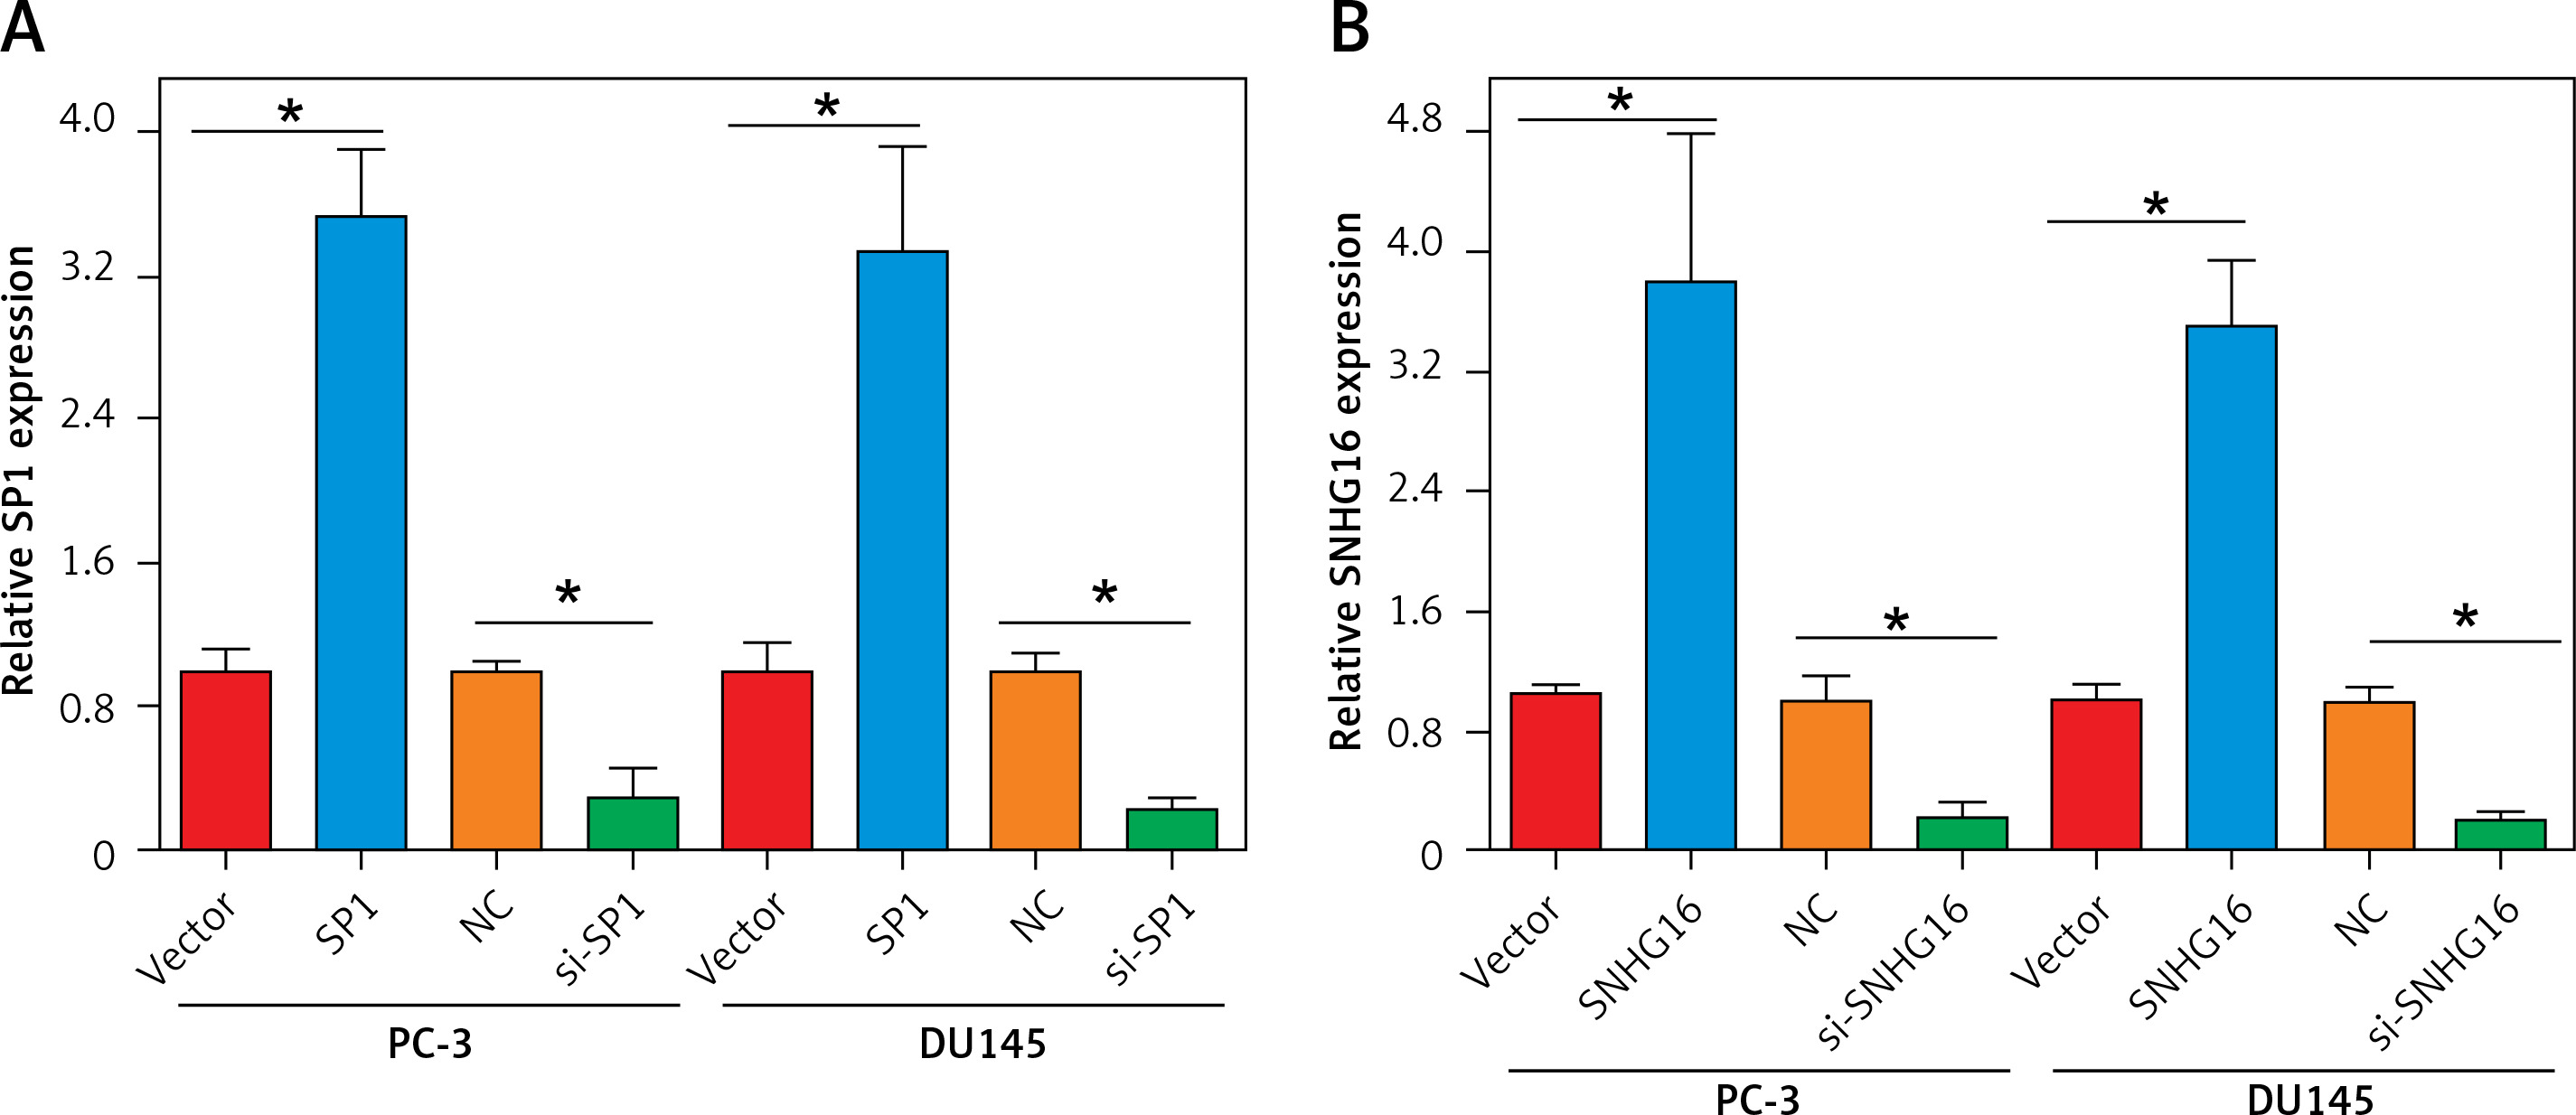
Establishment of SP1/SNHG16 knockdown and overexpression PCa cell lines
To test whether SP1/SNHG16 was essential for the PCa cellular phenotypes, we silenced SP1 and SNHG16 expression in PC-3 and DU145 cells by siRNA transfection and overexpressed SP1 and SNHG16 in PC-3 cells using a plasmid transfection construct, respectively. The results showed that suppression of SP1 was 3.5 fold in both PC-3 and DU145 cells (Figures 2 A, B). Similarly, suppression of SNHG16 was 10-12 fold in PC-3 and D145 cells. On the other hand, the overexpression of both SP1 and SNHG16 was around 3-4 fold in both PC-3 and DU145 cells (Figures 2 A, B).
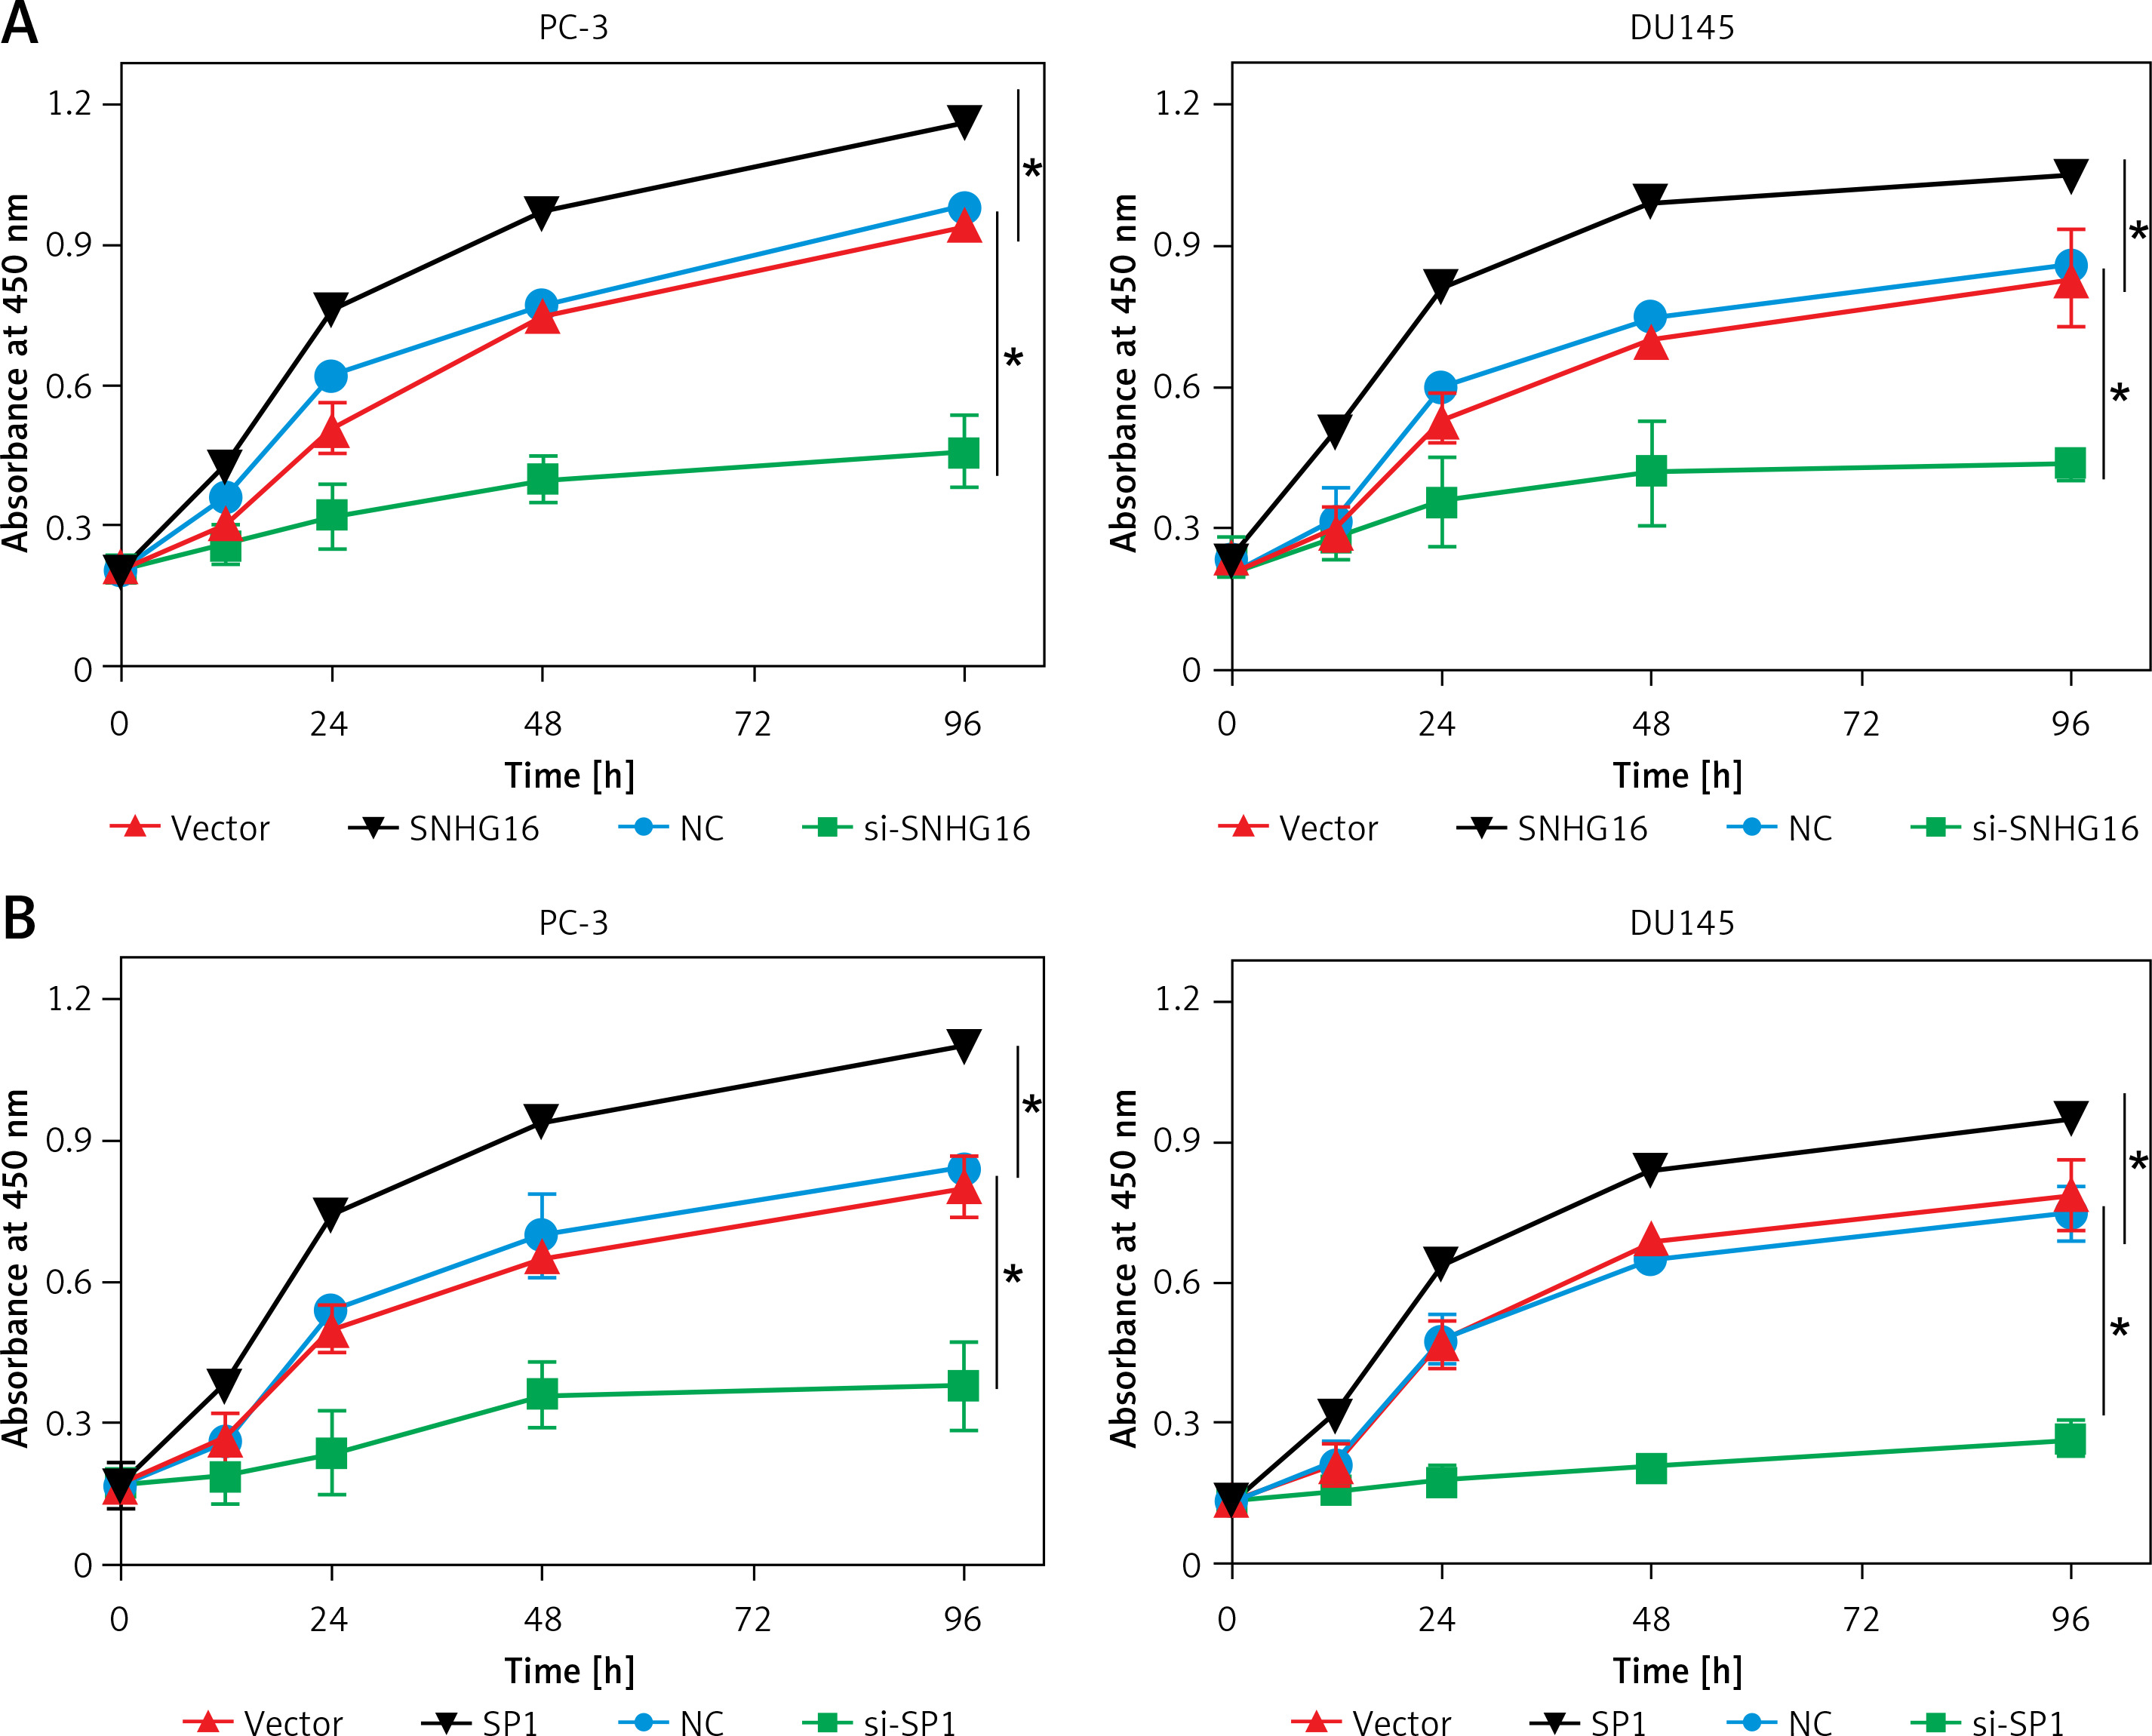
Effect of SP1/SNHG16 expression on PCa cell proliferation
To verify whether the expression of SP1 or SNHG16 has an effect on PCa cellular proliferation, CCK-8 assay was performed in various PC-3 and DU145 cells showing either overexpression or knockdown of SP1 or SNHG3 genes. The results of CCK-8 experiments revealed that compared to the vector group, cell proliferation of SNHG16 overexpressing PC-3 and DU145 cells was higher. Nonetheless, the proliferation of the cells was diminished upon SNHG16 knockdown (Figure 3 A). Similarly, SPI overexpression promoted the proliferation of PC-3 and DU15 cells while SP1 knockdown impeded the proliferation of PCa cells (Figure 3 B). These results indicate that SP1/SNHG16 could contribute to the promotion of PCa cell proliferation and development.
Figure 3
Effect of SP1SNHG16 on proliferation of PCa cells. A – Effect of SP1 overexpression and knockdown on proliferation of PC-3 and DU145 cells. B – Effect of SNHG16 overexpression and knockdown on proliferation of PC-3 and DU145 cells. Experiments were performed in triplicate and presented as mean ± SD (*p < 0.05)
SP1/SNHG16 enhances aerobic glycolysis via GLUT1
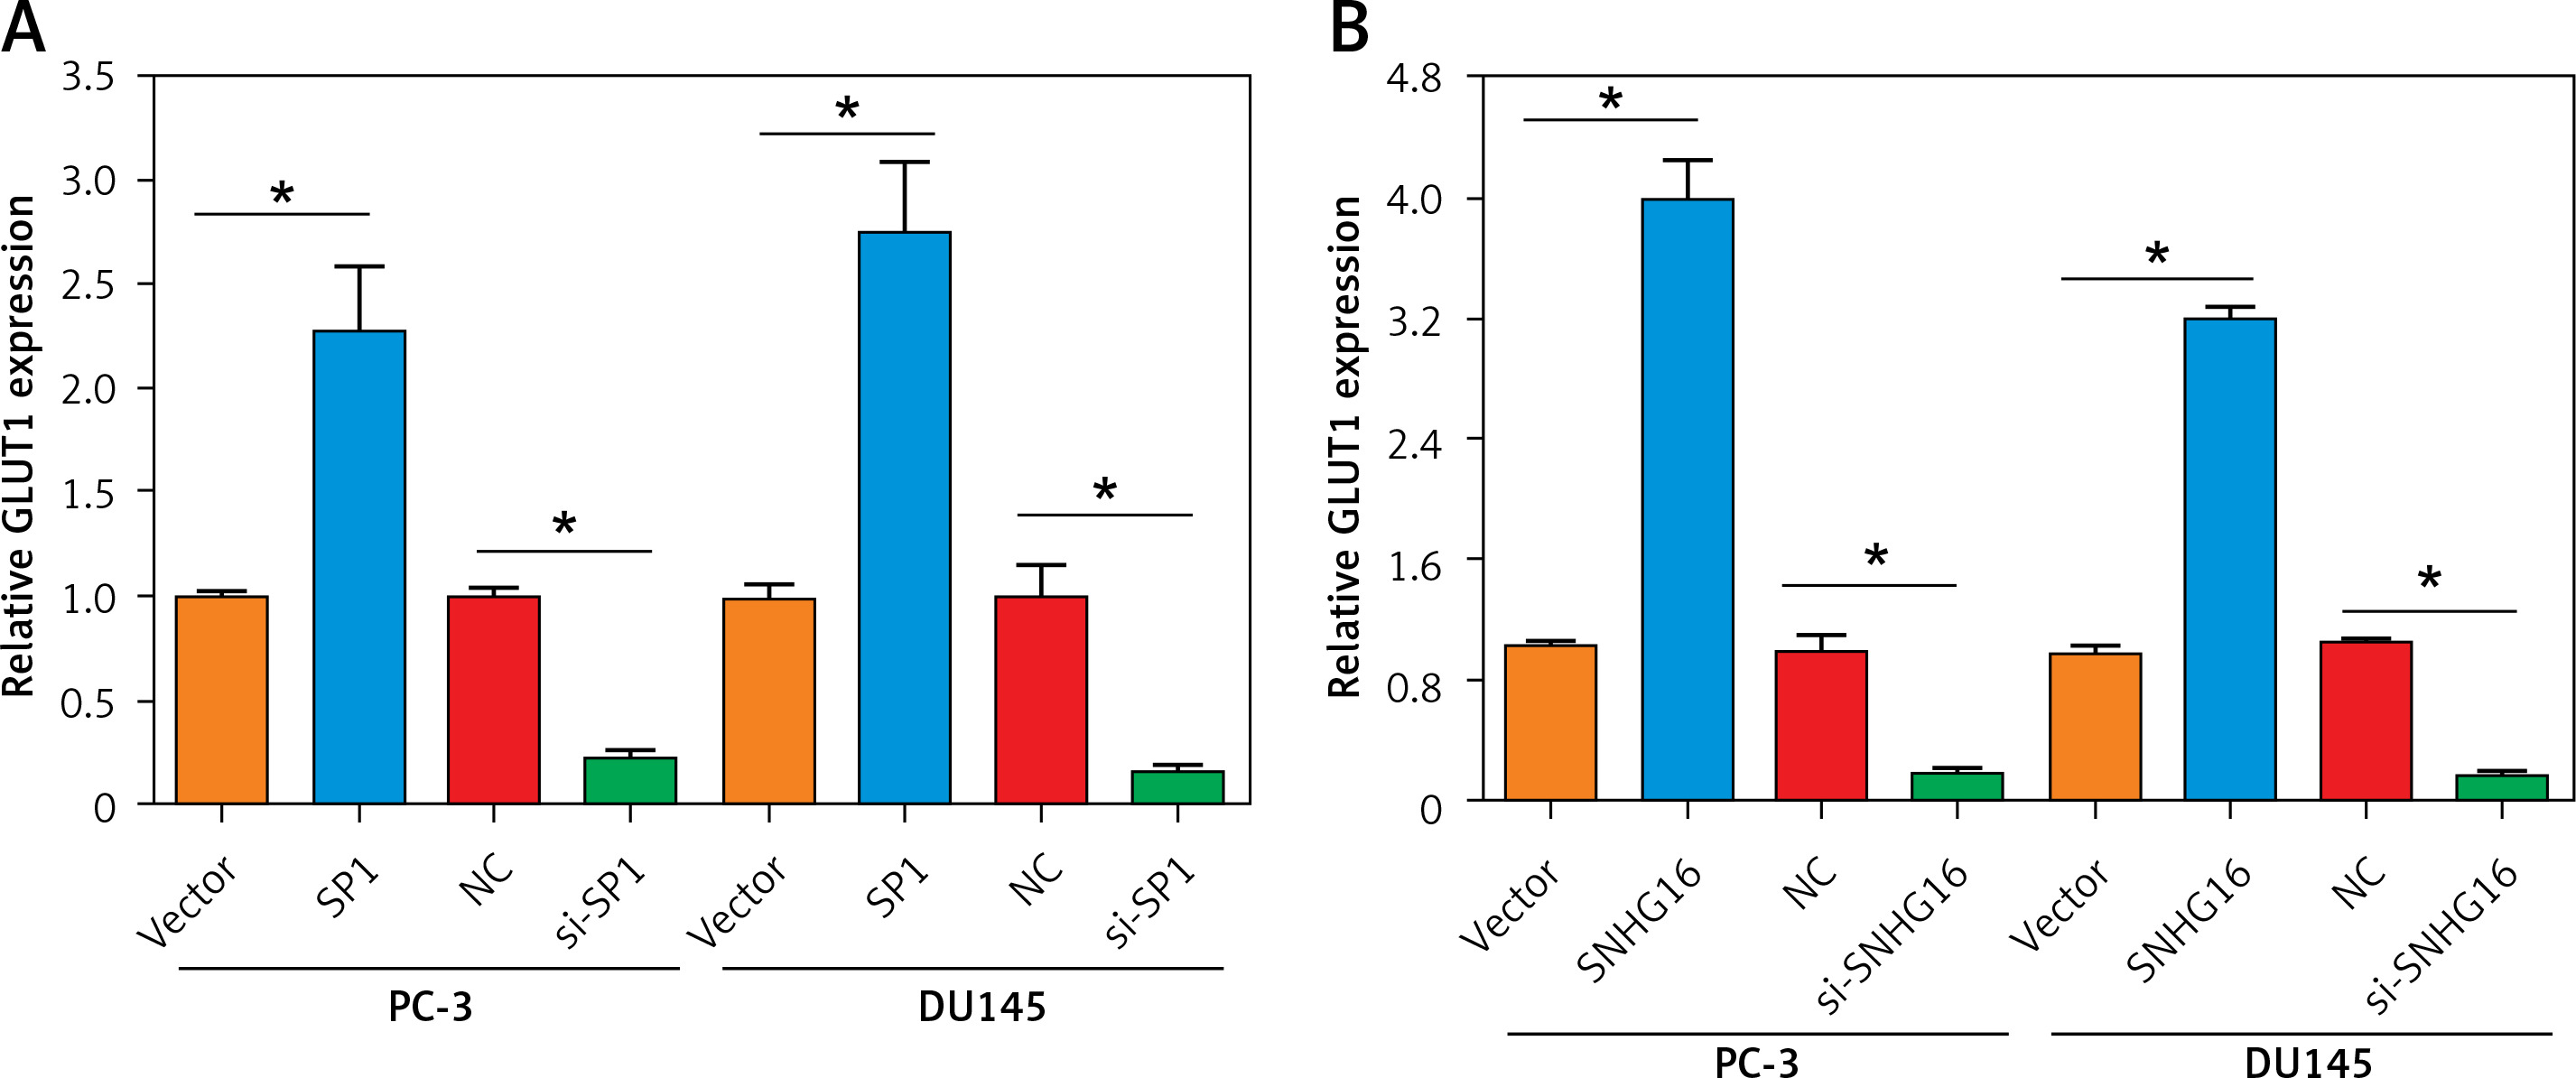
In the correlation analysis, the expression of SP1/SNHG16 was positively correlated with the expression of GLUT1 (SLC2A1) in the PCa tissues (Figures 1 B, C). To test whether SP1/SNHG16 was essential for the GLUT1 expression, we explored GLUT1 expression in PC-3 and DU145 cells during SP1/SNHG16 overexpression and knockdown conditions. The results showed that overexpression of either SP1 or SNHG16 could upregulate the GLUT1 mRNA level, while knockdown of SP1 or SNHG16 downregulated the GLUT1 mRNA level (Figures 4 A, B). Thus, SP1/SNHG16 might be involved in mediating GLUT1 mRNA level in PC-3 and DU145 cells.
Figure 4
Effect of SP1/SNHG16 on GLUT1 expression. A – Expression of GLUT1 under SP1 overexpression and knockdown in PC-3 and DU145 cells. B – Expression of GLUT1 under SNHG16 overexpression and knockdown in PC-3 and DU145 cells. Experiments were performed in triplicate and presented as mean ± SD (*p < 0.05)
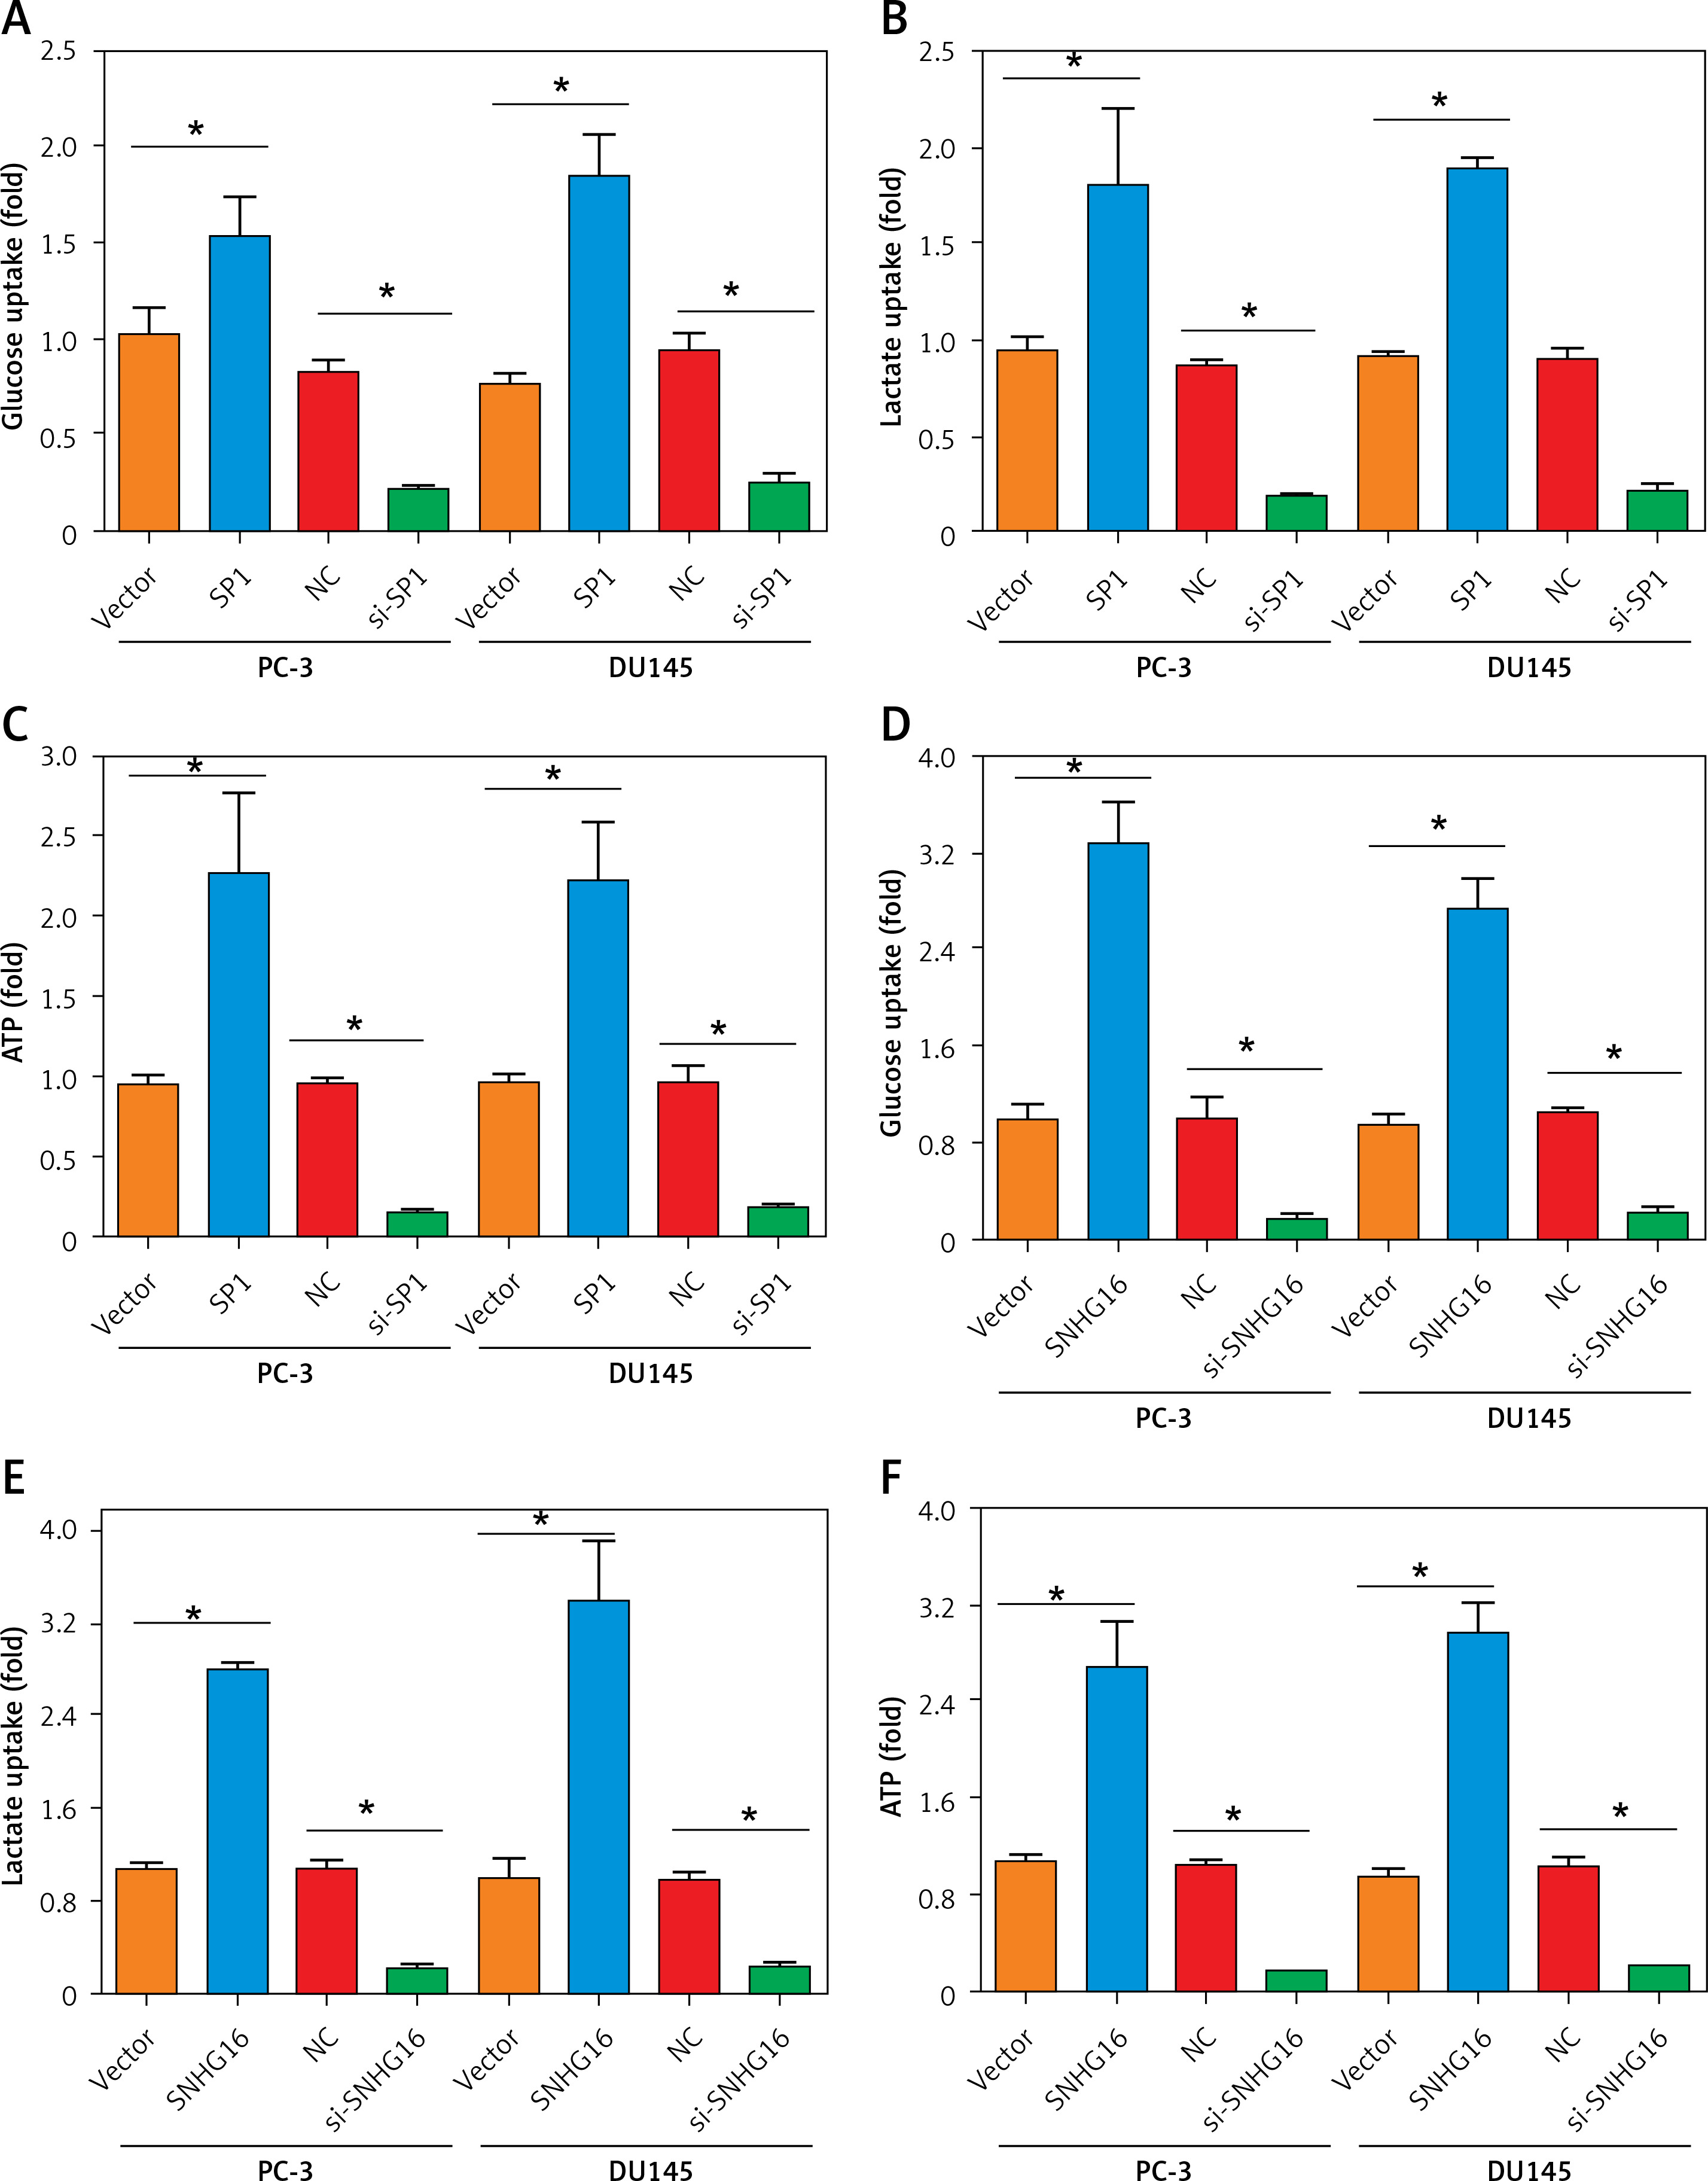
Next, we evaluated the effects of SP1/SNHG16 overexpression and knockdown on glycolysis in PC-3 and DU145 cells, involving glucose uptake, lactate generation, and ATP production. It was found that SP1 overexpression resulted in an increase in the amounts of glucose consumption, lactate generation, and ATP production while SP1 knockdown exhibited opposite effects (Figures 5 A–C). Similarly, the amounts of glucose consumption, lactate generation, and ATP production increased significantly (p < 0.05) in PC-3 and DU145 cell lines upon overexpression of SNHG16, while knockdown of SNHG16 exerted opposite effects (Figures 5 D, E). Taken together, these results point to the role of SP1/SNHG16 in the regulation of aerobic glycolysis in PCa cell lines via modulation of GLUT1 expression.
Figure 5
Effect of SP1SNHG16 on glycolysis in PCa cells. Effect of SP1 overexpression and knockdown on glucose uptake (A), lactate uptake (B), ATP (C). Effect of SNHG16 overexpression and knockdown on glucose uptake (D), lactate uptake (E), and ATP (F) in PC-3 and DU145 cells. Experiments were performed in triplicate and presented as mean ± SD (*p < 0.05)
SP1/SNHG16 regulates the invasion of PCa cells
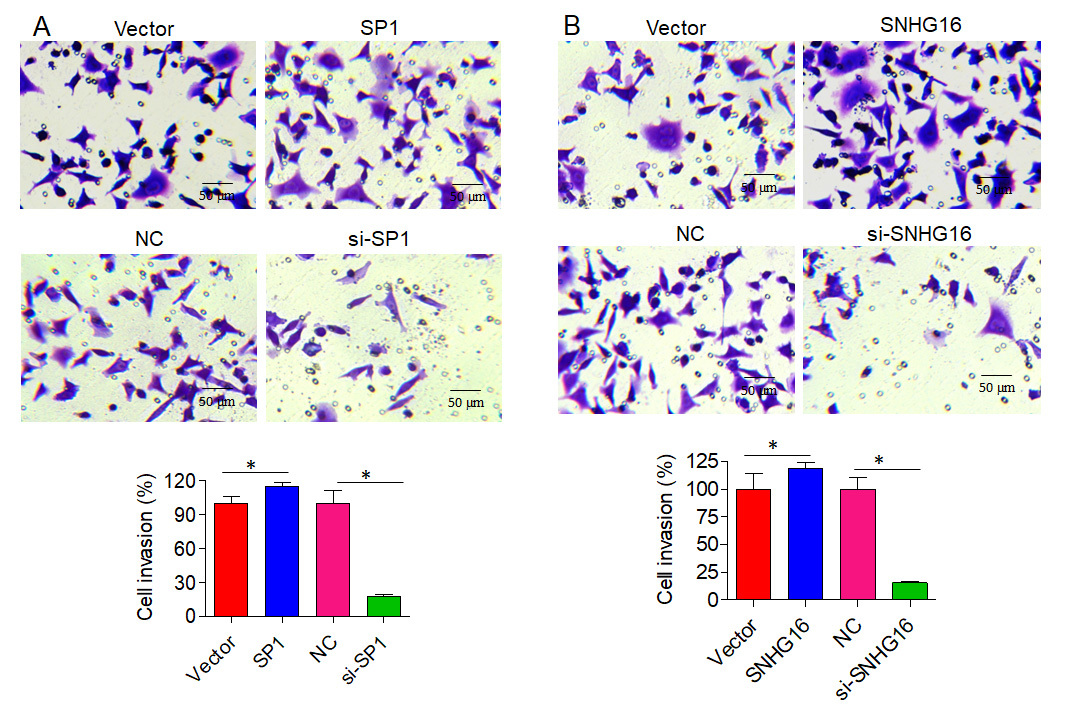
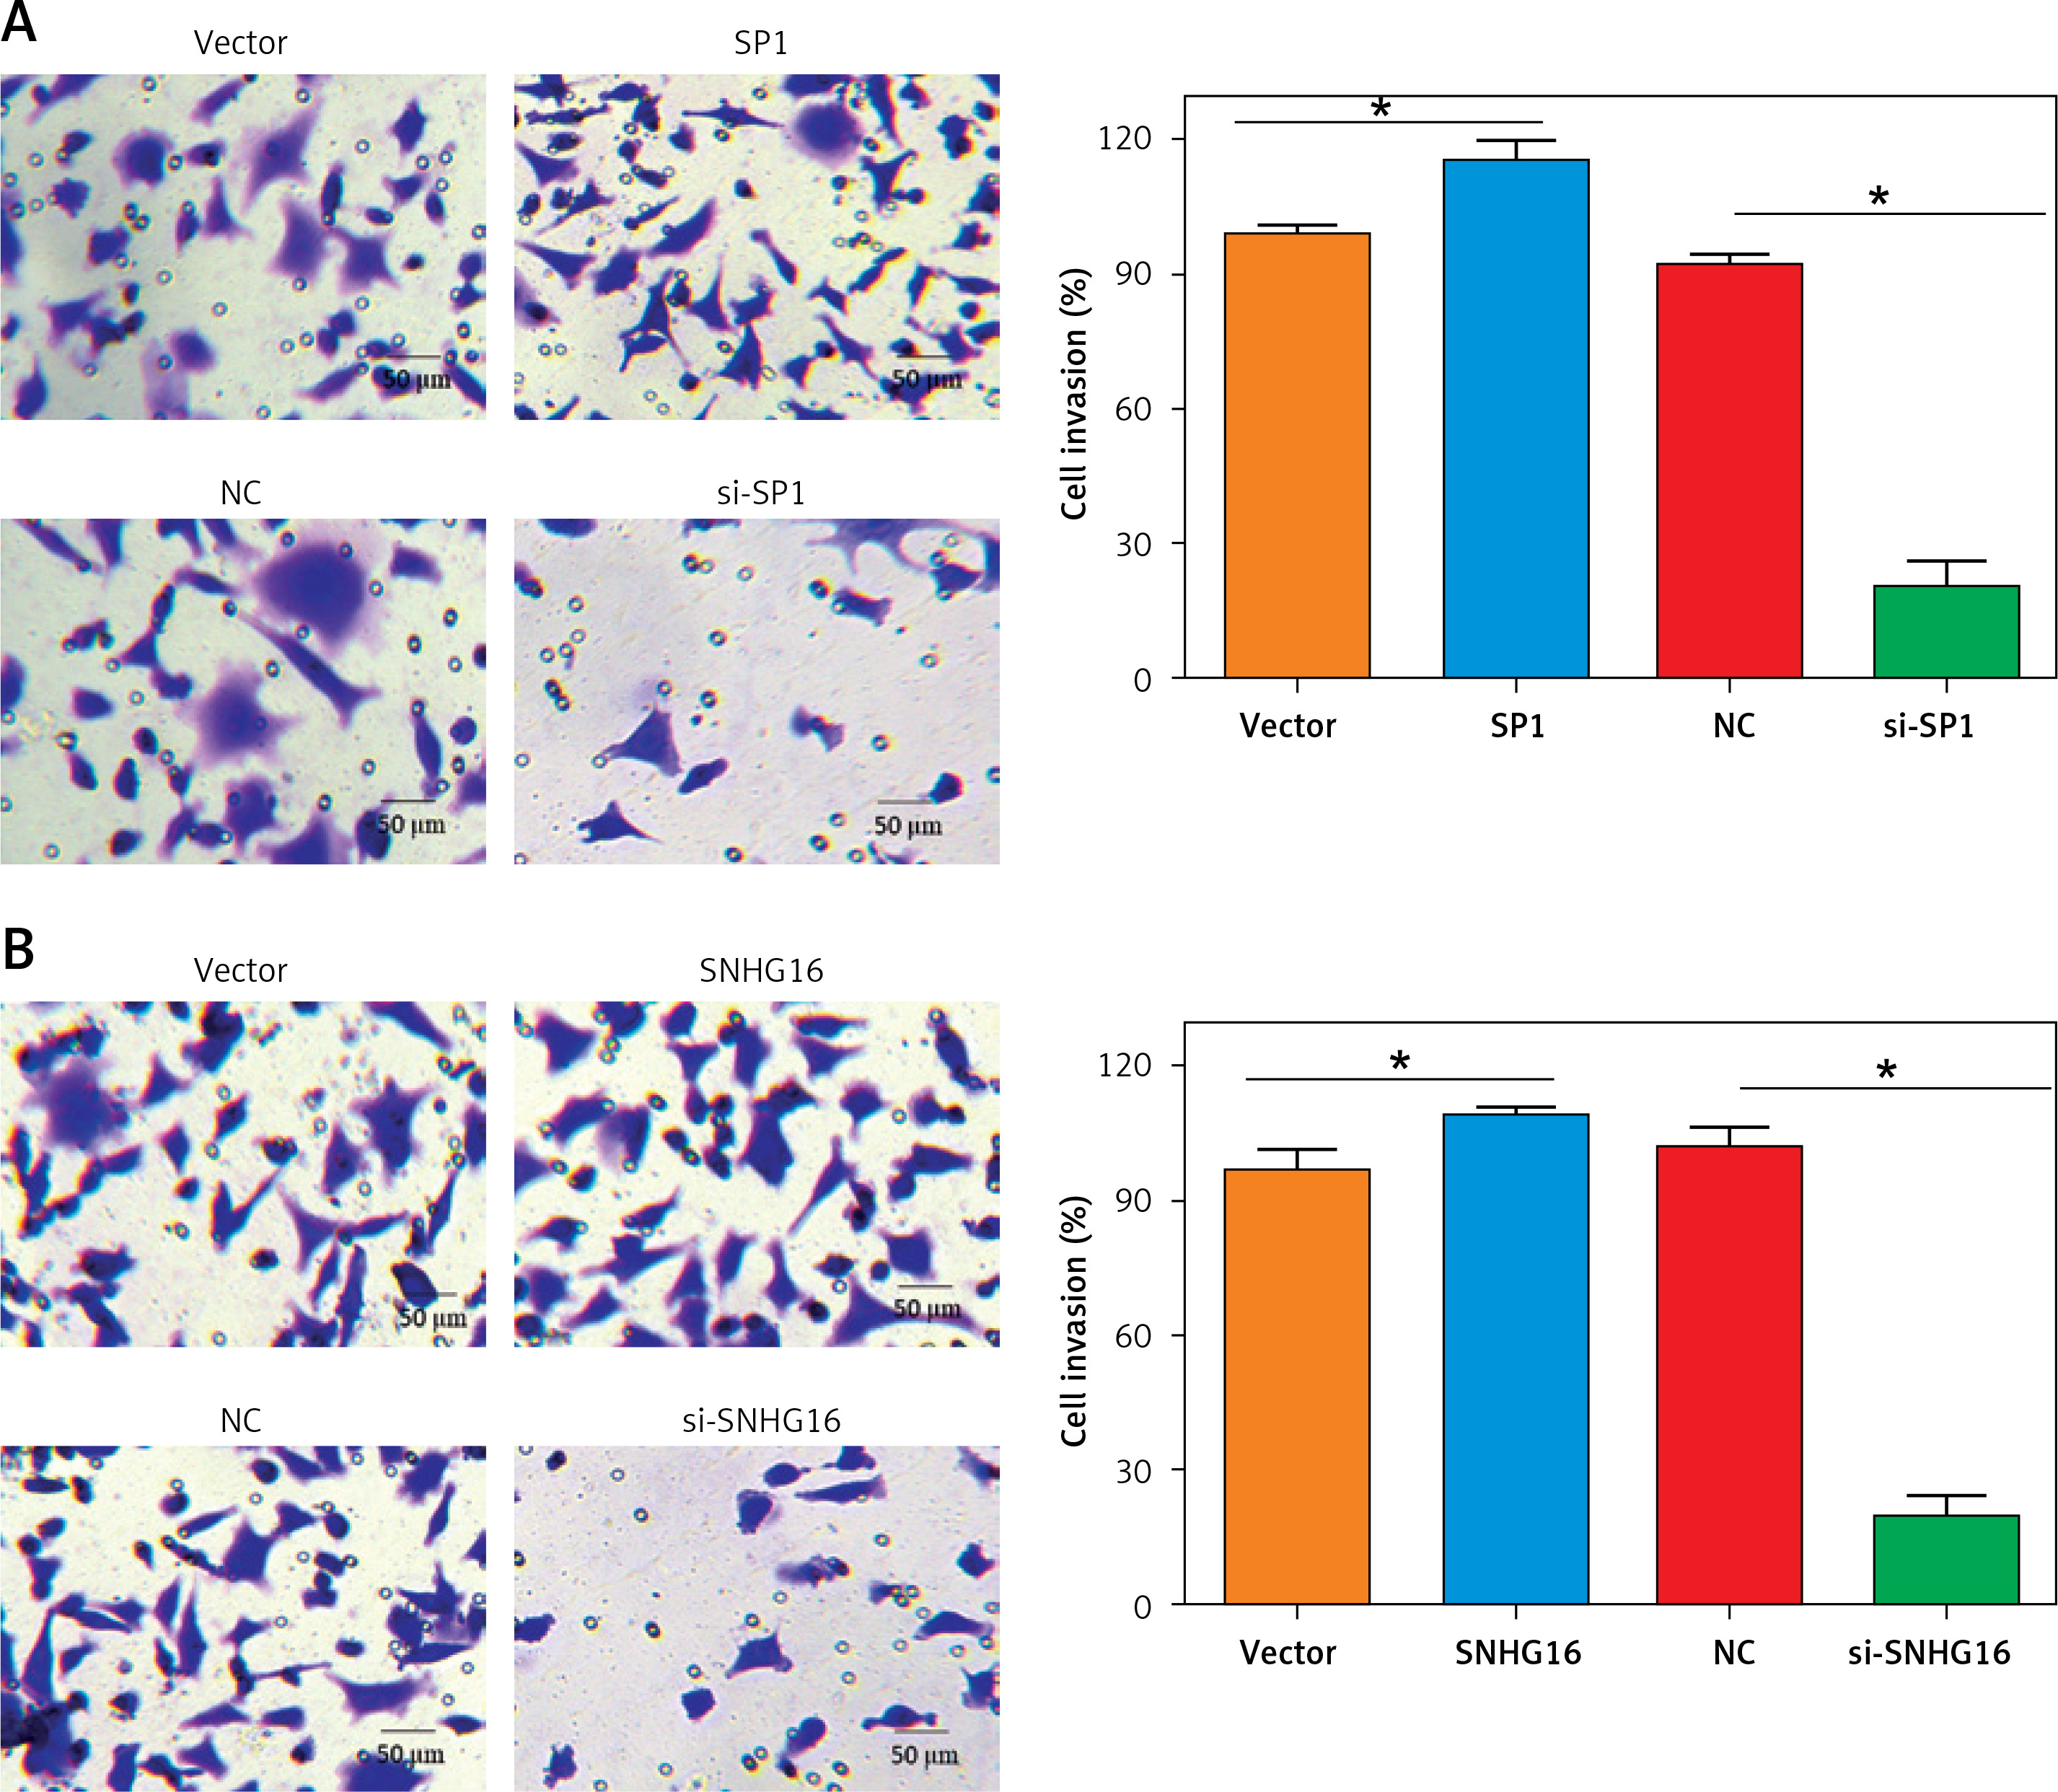
Next, we assessed the effect of SPI/SNHG16 on the invasion of PC-3 and GU145 cells. The results showed that overexpression of SP1 promoted while knockdown of SP1 inhibited the invasion of PC-3 cells, as revealed by the Transwell assay. Similarly, SNHG16 overexpression promoted while SNHG16 knockdown inhibited the invasion of PC-3 cells (Figure 6). Similar results were obtained upon overexpression or knockdown of SP1/SNHG16 in DU145 cells (Figure 7). Collectively, these findings suggest that SP1/SNHG16 has an effect on the invasiveness of PCa cells.
Figure 6
Effect of SP1/SNHG16 on the invasion of PC-3 cells. A – Effects of SP1 overexpression and knockdown on the invasion of PC-3 cells. B – Effect of SNHG16 overexpression and knockdown on the invasion of PC-3 cells. The ‘Vector’ bar represents the control vector, the ‘SP1’ bar indicates SP1 overexpression, ‘NC’ stands for negative control, and ‘si-SP1’ indicates SP1 knockdown. Experiments were performed in triplicate and presented as mean ± SD (*p < 0.05)
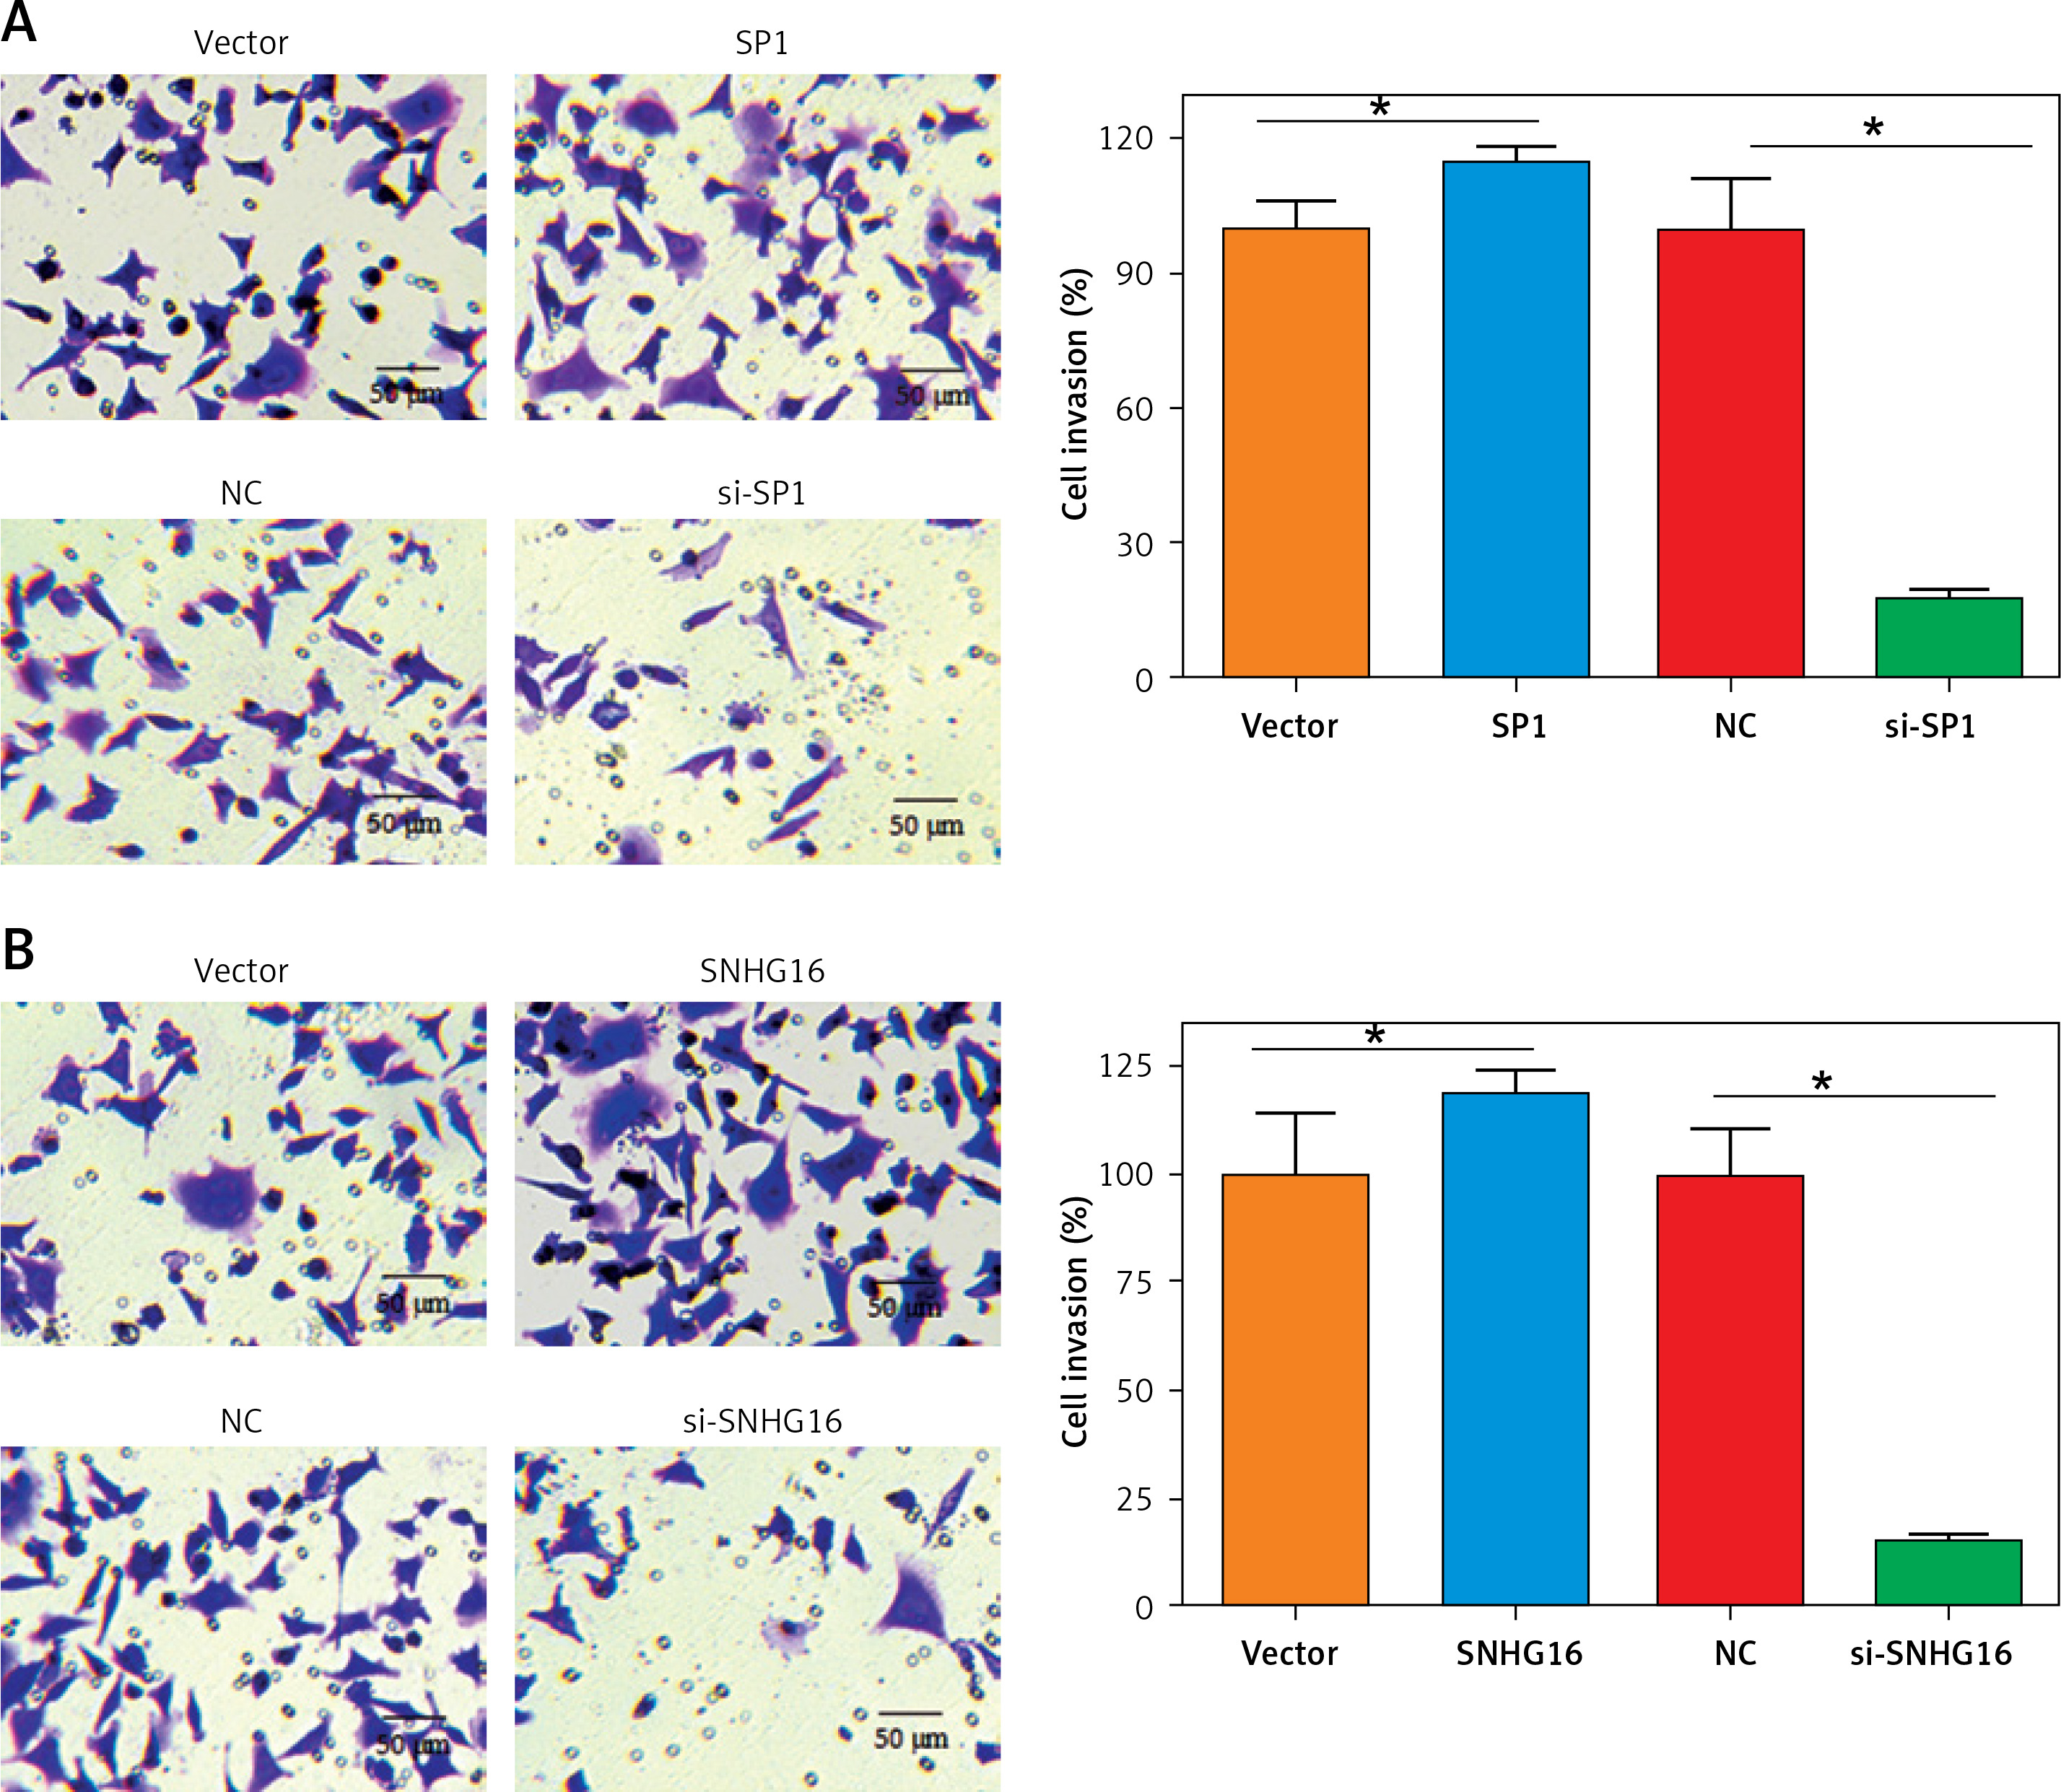
Figure 7
Effect of SP1/SNHG16 on invasion of DU145 cells. A – Effects of SP1 overexpression and knockdown on the invasion of DU145 cells. B – Effect of SNHG16 overexpression and knockdown on the invasion of DU145 cells. The ‘Vector’ bar represents the control vector, the ‘SP1’ bar indicates SP1 overexpression, ‘NC’ stands for negative control, and ‘si-SP1’ indicates SP1 knockdown. Experiments were performed in triplicate and presented as mean ± SD (*p < 0.05)
Discussion
Prostate cancer constitutes around 9% of all cancer deaths in men [21]. The disease is quite complex and heterogeneous in nature, and several factors including genetic, environmental, age, and origin contribute to the development of this disease [3, 22, 23]. Several studies are directed at understanding the mechanisms underlying the development of prostate cancer [20]. The present study was designed to evaluate the SP1/SNHG16/GLUT1 axis as a therapeutic target for the management of prostate cancer. Several previous studies have shown upregulation of SNHG16 in different human malignancies; for instance, in breast cancer, SNHG16 upregulation promotes proliferation and metastasis [23]. Similarly, Lian et al. reported the involvement of SNHG16 in the progression of gastric cancer [24]. Shao et al. discovered that elevated levels of lncRNA-SNHG16 differentiate prostate carcinoma from healthy tissues and are positively associated with GLUT-1 mRNA in tumors. In vitro experiments demonstrated that suppressing lncRNA-SNHG16 using siRNA decreases GLUT-1 expression, lowers glucose uptake, and suppresses cancer cell growth in prostate carcinoma while leaving normal prostate cells unaffected [25]. In another previous study, SNHG16 was shown to be involved in the development of prostate cancer [20]. However, the present study, for the first time, reports the involvement of the SP1 transcription factor in the SNHG16-mediated proliferation of prostate cancer cells. Herein, we found that SP1/SNHG16 promotes the proliferation of prostate cancer cells by enhancing aerobic glycolysis. Despite the fact that glycolysis is not the primary source of energy for primary PCa use, obstruction of this route has demonstrated beneficial therapeutic effects. In general, suppression of glycolysis can reduce the size and metastases of neoplasms, postpone the initiation of castration-resistant prostate cancer (CRPC), increase the production of pro-apoptotic factors, and preserve low levels of prostate-specific antigen (PSA). In addition, suppression of glycolytic activities in PCa cells has a synergistic impact on other anticancer agents [26, 27].
Notably, the effects of the SP1/SNHG16 axis on the remodeling of glucose metabolism were obtained via modulating GLUT1 expression. The role of GLUT1 in glucose metabolism has been studied in colorectal cancer, wherein GLUT1 promoted proliferation by enhancing glucose uptake. GLUT1 has a critical role in oncogenesis and neoplastic progression in multiple carcinoma types. Oxidative stress arises from an imbalance between the generation of reactive oxygen species (ROS) and the cell’s detoxification capacity, leading to cellular damage. GLUT1 is often upregulated in cancer cells to satisfy their heightened metabolic requirements [28]. This upregulation enhances glucose uptake, promoting glycolysis and increasing ROS production. The resultant oxidative stress fosters oncogenic processes such as DNA damage and genomic instability, contributing to tumor progression. Furthermore, oxidative stress activates signaling pathways such as NF-κB and HIF-1, which enhance the expression of genes involved in cell survival, proliferation, and angiogenesis [28]. Consequently, targeting GLUT1 and oxidative stress pathways presents a viable strategy for cancer therapy. In a previous study investigating the involvement of GLUT1 in PCa, GLUT1 was more highly expressed in PCa tissues than in the normal ones contiguous to the neoplasms [20].
Furthermore, SNHG16 can regulate the migration and invasion of cancer cells [29, 30]. In our study, we also found that SP1/SNHG16 promoted the invasiveness of PCa cells, as depicted by the Transwell assay. Thus, it suggests the potential involvement of the SP1/SNHG16 axis in the metastasis of prostate cancer. Collectively, our data are the first to demonstratre the regulation of glycolysis by SP1/SNHG16 and its involvement in prostate cancer proliferation and metastasis.
In conclusion, the findings of the present study reveal that the SP1/SNHG16/GLUT1 pathway may play an important role in PCa proliferation and invasion via glycolysis. While further research endeavors are needed, our investigation pointed to the therapeutic potential of SP1/SNHG16/GLUT1 for the treatment of PCa.