Introduction
Malignant pleural mesothelioma (MPM) and benign pleural thickenings (BPT) are rare diseases originating from mesothelial cells. Both of them are mostly associated with asbestos exposure. Malignant pleural mesothelioma has aggressive behavior with very poor prognosis. Its median survival time is around 12 months. Recent studies reported that the incidence of the disease has increased [1–5]. Malignant pleural mesothelioma is generally detected in advanced stages after a long latency period. Early diagnosis is crucial for prolongation of survival [6–9] and can be achieved with imaging procedures. On the other hand, sometimes BPT and MPM cannot be differentiated properly with imaging methods. This causes unnecessary invasive approaches such as cytological examination or more invasive procedures [10].
Enhanced or unenhanced computed tomography (CT) is the most commonly used method to differentiate asbestos-related pleural pathologies. Nonetheless it does not have sufficient accuracy. Magnetic resonance imaging (MRI) is not commonly used for pleural lesion characterization due to its limited availability, costs and long time of the imaging. Moreover, if invasion does not exist in surrounding tissues, it is also not a reliable method [11]. Because we cannot achieve high accuracy with morphological techniques, 2-deoxy-2-[18F]fluoro-D-glucose positron emission tomography/computed tomography ([18F]FDG-PET/CT) is used nowadays for this purpose. Although it has better results than morphological imaging modalities, [18F]FDG-PET/CT also has insufficient accuracy. In addition, there is no consensus for a standardized uptake maximum (SUVmax) cut-off value to characterize pleural thickening [12, 13]. Because of all these difficulties, pleural thickening with suspected MPM is described as a ‘challenging disease to image by any modality’ by some scientists [7, 10]. At this point, radiologists/nuclear medicine specialists’ reports become very important for patient management. However, due to ambiguity of the imaging results in some patients, they undergo unnecessary cytological examination or biopsy [10].
Our first aim in this study is to determine a cut-off value for SUVmax in patients with asbestos-related pleural thickening. Secondly, we try to answer this question: If we use this cut-off value together with morphological parameters, can we differentiate benign thickening from MPM more accurately? If we achieved a simple and practical diagnostic approach for these patients, it can help us to avoid unnecessary invasive diagnostic procedures. It can reduce costs of the Medicare system, save time for medical professionals and decrease complication rates caused by invasive methods.
Material and methods
Patient selection
The results of 98 patients who underwent [18F]FDG-PET/CT imaging for asbestos-related pleural thickening between 1 January 2013 and 31 December 2017 were reviewed. Thirty-seven patients who did not have distant metastases in pre-biopsy [18F]FDG-PET/CT were included in the study. All of these patients had pathologically proven primary pleural disease. Thirty-one patients’ pleural lesions’ SUVmax was > 2.5 and these patients directly underwent biopsy. Six patients’ SUVmax was < 2.5; however, three of them had pleural effusion and three of them had increasing size of the thickening in follow-up. These patients also underwent biopsy. Their anamnesis, demographic parameters, [18F]FDG-PET/CT and pathology results were found from our database. If size of the thickening, or lesions’ SUVmax value was not mentioned in a previous report, we calculated them from their re-examined [18F]FDG-PET/CT. Pathological results are accepted as gold standard.
Positron emission tomography/computed tomography imaging
After at least 6 h of fasting, if a patient’s blood glucose level was appropriate for injection, approximately 6–8 millicuries of [18F]FDG were administered intravenously (IV). Patients rested in a warm and quiet room for about 60 min and then [18F]FDG-PET/CT (General Electric D600 16 slice, GE Healthcare, USA) was performed. Initially, morphologic imaging was performed with ‘care dose’ CT with 5 mm thickness from the vertex to the mid-thigh. Then, PET imaging was performed in 7–8 bed positions for approximately 3 min for each position. The patients underwent shallow breathing during the PET imaging. CT data were used for attenuation correction and anatomical localization. We did not use oral or IV contrast agents. Images were evaluated by us and SUVmax values of each suspicious lesion were measured.
Statistical analysis
Data were analyzed by Statistical Package for the MedCalc Statistical Software version 18.10.2 (MedCalc Software bvba, Ostend, Belgium; http://www.medcalc.org; 2018). The numerical and categorical data were expressed as mean ± standard deviation and percentage, respectively. Kolmogorov-Smirnov and Shapiro-Wilk tests were used as tests of normality for continuous variables. Fisher’s exact test was used to determine the relationship between two groups and p < 0.05 was considered as statistically significant. Receiver operating characteristic (ROC) curve analysis was performed with Hanley and McNeil methodology. Sensitivity, specificity, positive predictive value (PPV) and negative predictive value (NPV) were calculated.
Results
Fourteen (37.8%) patients were female. The total number of MPM diagnoses was 25 (67.6%). Approximately 61.0% of male and 78.0% of female patients were diagnosed with MPM. Although females had a higher rate of MPM, this was not statistically significant (p = 0.27). Patients’ mean age was 62.8 years (31–90; SD: 13.1). Mean age of the MPM and BPT patients was 65.6 and 62.6 years, respectively. Since 12 patients had BPT, we also calculated the geometric mean for them. This value was 56.0 years (41–75 and 95% CI was 43.7–65.9). Age had a statistically significant relationship with MPM (p = 0.049). The results are summarized in Table I.
Table I
Relationship between age/sex and final diagnosis
| Factor | MPM (n = 25; 67.6%) | BPT (n = 12; 32.4%) | P-value |
|---|---|---|---|
| Mean age [years] | 65.6 | 62.6 | 0.049 |
| Female | 78% | 22% | 0.27 |
| Male | 61% | 39% |
Approximately 2 out of every 3 (66.7%) diffuse thickening patients had MPM. This rate was very similar for nodular thickening patterns (65.2%). The differences were not statistically significant. Approximately 44.4% of MPM patients had pleural calcification. This rate was 55.6% for patients with BPT. Although BPT patients had a higher pleural calcification rate, this also was not statistically significant. On the other hand, 83.3% of the patients with pleural effusion were diagnosed with MPM. The difference between MPM and BPT was statistically significant (p = 0.01). However, only 56.0% of MPM patients had pleural effusion. Mean size of the thickening and mean SUVmax values also had statistically significant differences between groups. The results are summarized in Table II.
Table II
Relationship of some morphological/metabolic parameters and final diagnosis
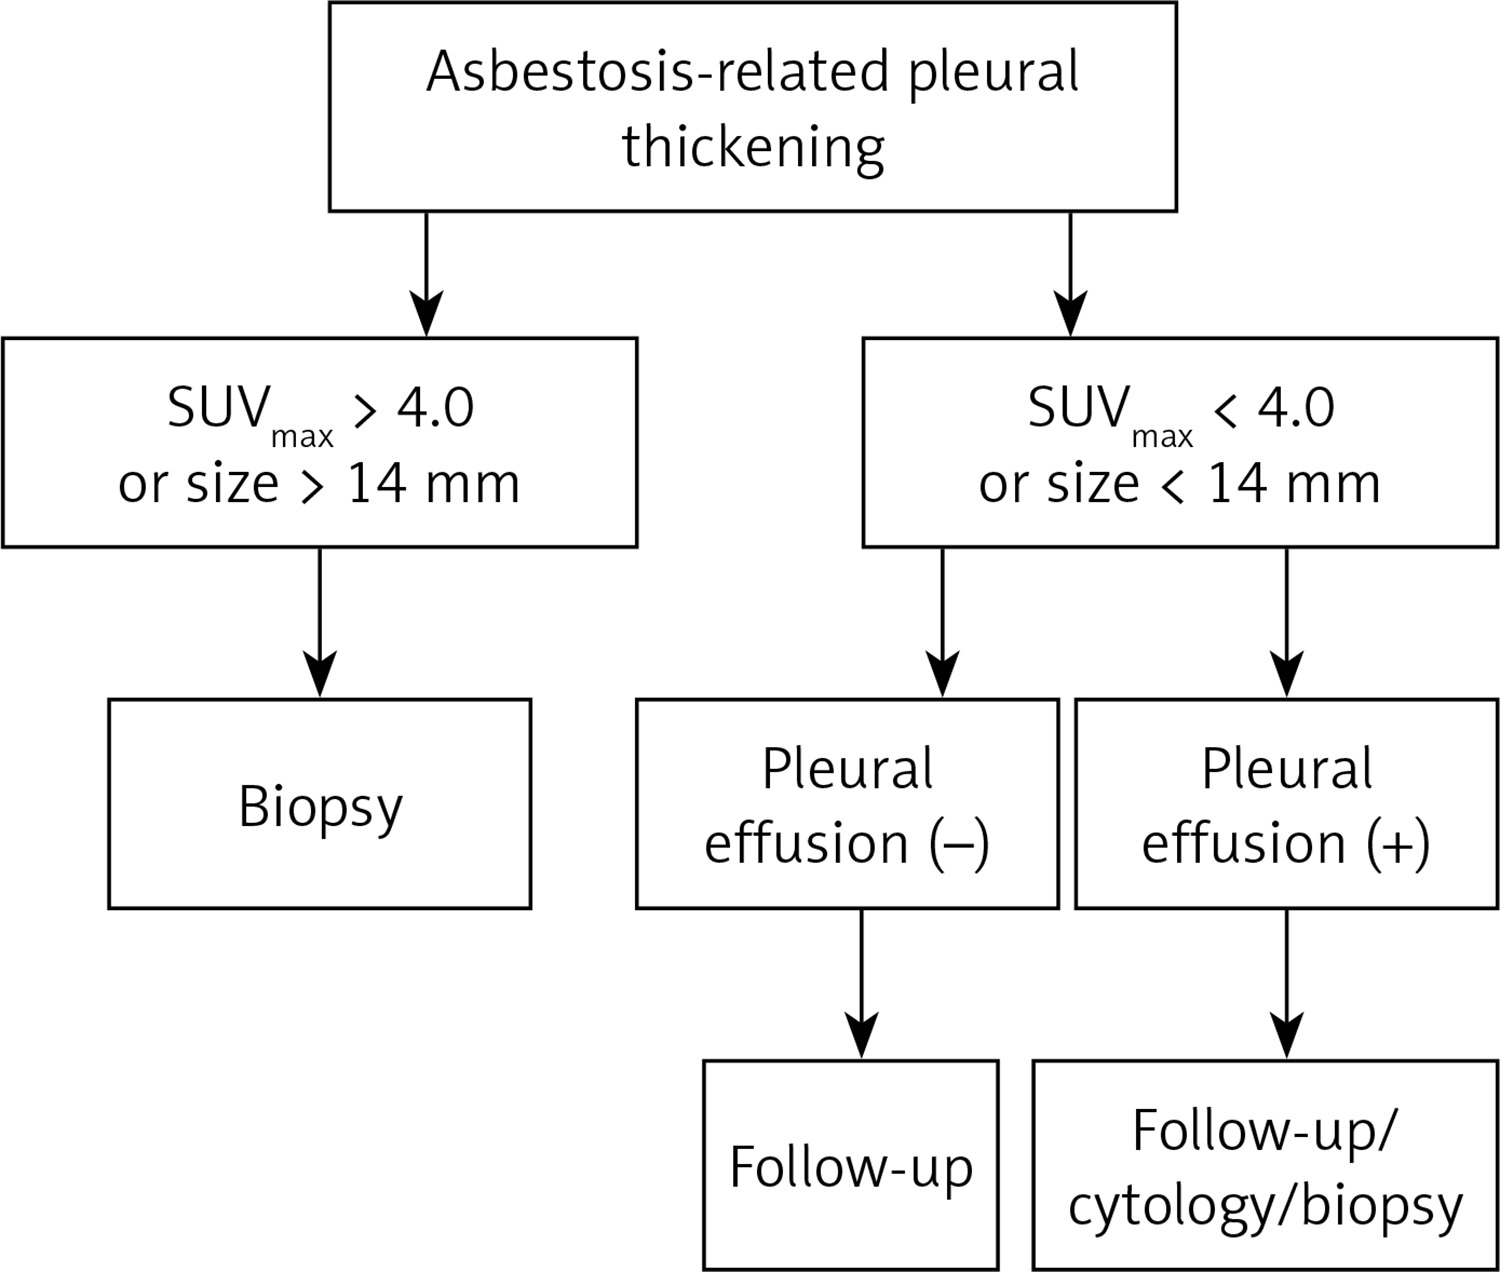
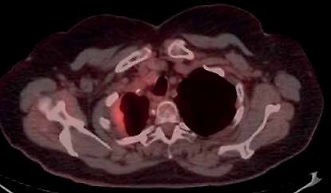
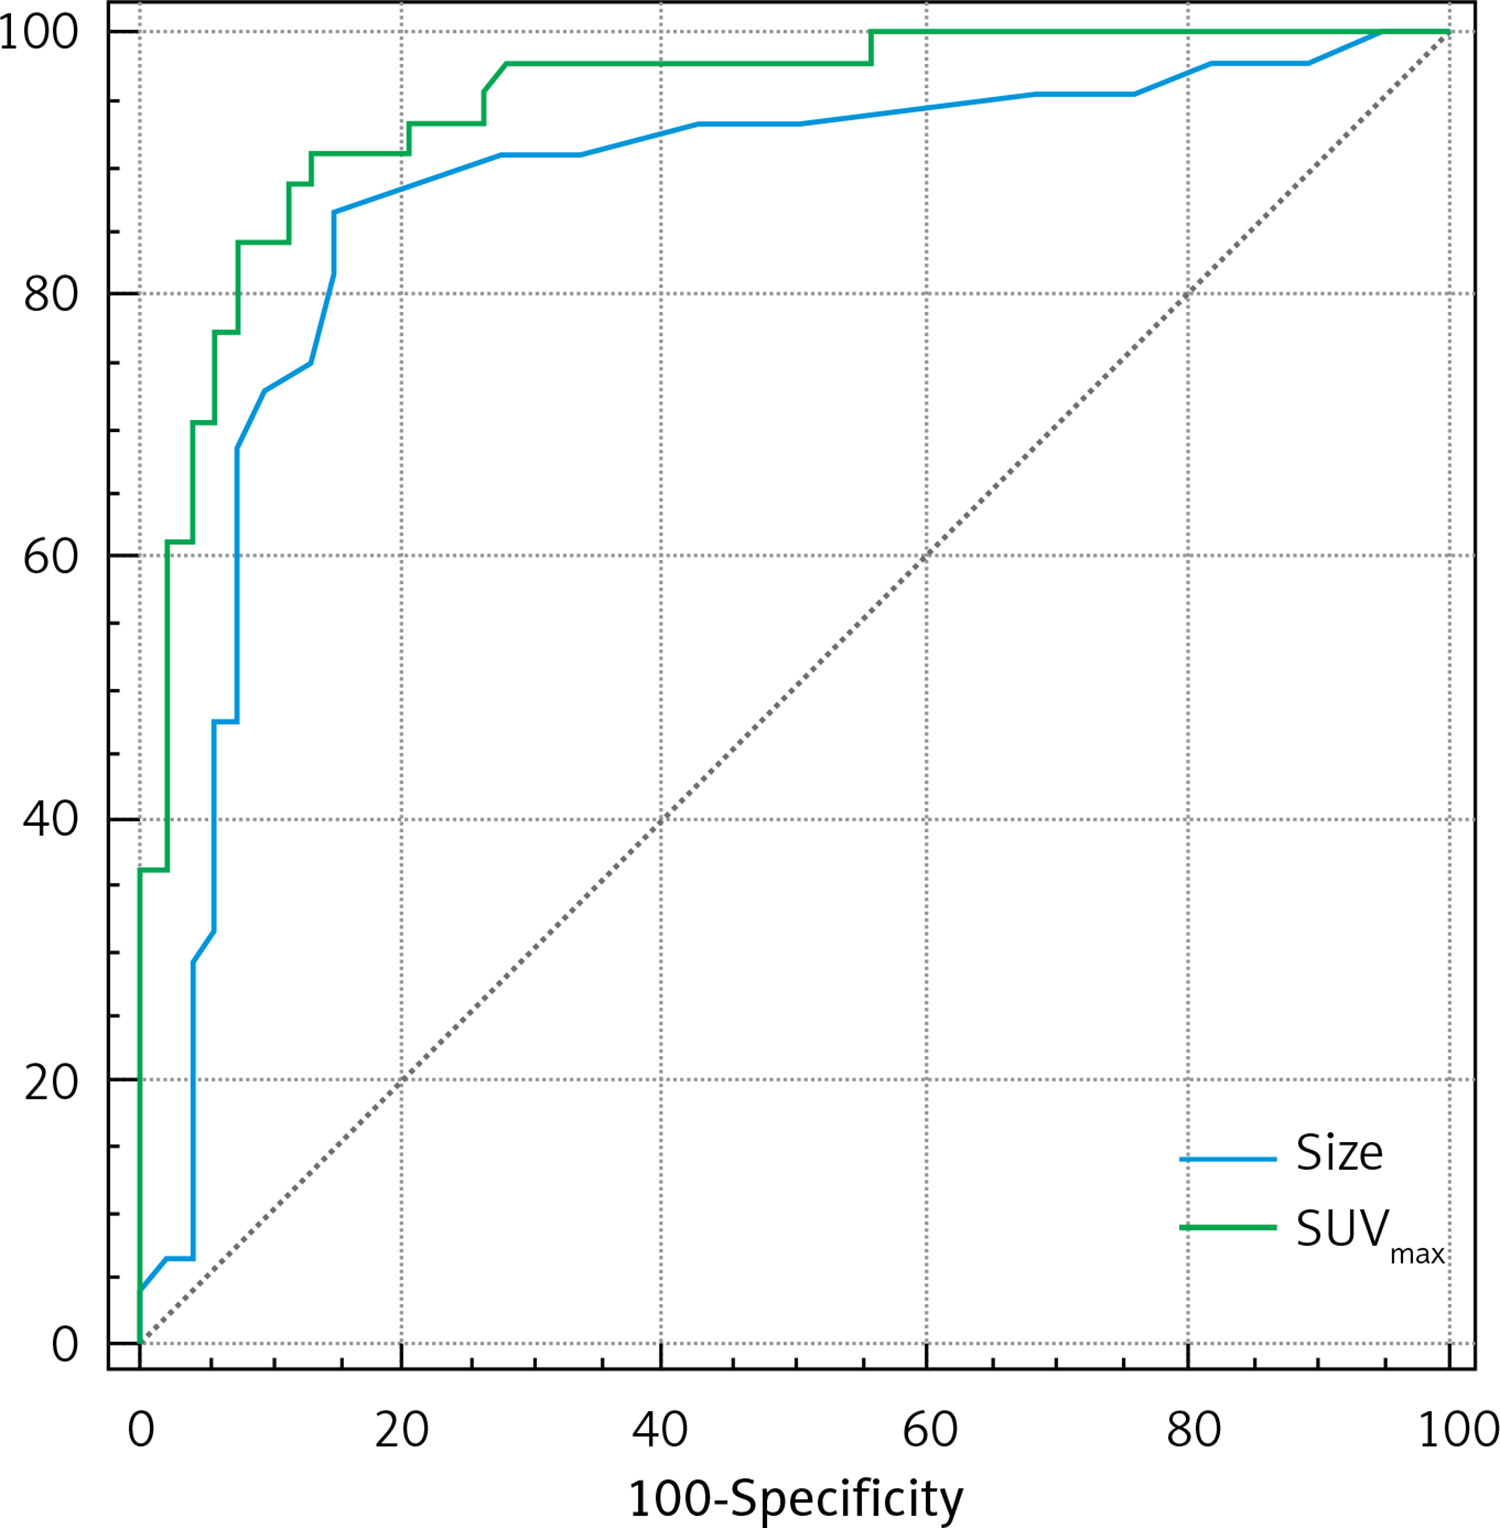
We found size > 14 mm and SUVmax > 4.0 as cut-off values for MPM. The sensitivity, specificity, PPV and NPV of size > 14 mm were calculated as 85.7%, 83.3%, 90.0% and 76.9%, respectively. Area under the ROC curve, standard error and confidence interval were 0.887, 0.05 and 95.0% (0.772–1.0), respectively. This cut-off value had 12.0% false negativity, and 8% of them were epithelioid, while 4% of them were non-epithelioid subtype MPM. For SUVmax > 4.0; sensitivity, specificity, PPV and NPV were 88.0%, 83.3%, 91.7%, 76.9%, respectively. Area under the ROC curve, standard error and confidence interval were 0.895, 0.05 and 95% (0.789–1.0), respectively. It also had 12.0% false negativity. All false patients in this group were epithelioid subtype. On the other hand, false positive results were associated with inflammation. For example, 1 patient who was diagnosed with pleuritis had an SUVmax value of 5.8. ROC analysis is shown in Figure 1. 24 out of the 25 (96.0%) MPM patients had SUVmax > 4.0 or size > 14 mm. The remaining 1 patient with MPM had SUVmax < 4.0 and size < 14 mm. However, he had pleural effusion. When we examined BPT patients, 58.3% (7/12) of them had SUVmax < 4.0, size < 14 mm and had no pleural effusion. Figure 2 provides an example of this.
Discussion
Malignant pleural mesothelioma is an aggressive tumor originating from mesothelial cells of the pleura. This malignancy is mostly related to asbestos exposure and the incidence of it has been increasing [1, 3, 14]. Early diagnosis is crucial for prolongation of survival and it can be achieved with imaging procedures. On the other hand, sometimes benign pleural thickening patients undergo unnecessary invasive procedures due to uncertainty of the imaging techniques’ reports. In such situations, cytological examination, which has low NPV, or more invasive procedures can be applied [10]. This increases costs of the Medicare system and is time consuming. Moreover, it can cause unnecessary morbidity, and increased complication rates in lots of patients.
Radiography is usually used as the first imaging method to evaluate the respiratory system [15]. If there are any suspicious findings, CT is the next step. Studies reported that CT imaging provides helpful information for pleural pathologies. However, CT parameters do not have sufficient accuracy for characterization of them. For example, Seely et al. reported that 43% of MPM patients had calcified pleural pathology, but 57% did not [16]. Leung et al. studied circumferential pleural thickening, nodular pleural thickening, parietal pleural thickening greater than 1.0 cm, and mediastinal pleural thickening patterns, and their relationship with MPM. They found that these parameters could be useful [17]. Hierholzer et al. reported that, if a patient had one or more of these four parameters, the sensitivity was 72% and specificity was 83% [18]. A study published in 2016 reported that circumferential thickening occurs in 31.1% of MPM patients. This rate was 59.2% for nodular thickening [19]. Kato et al. aimed to achieve more accurate results with irregularity. They found that low level pleural irregularity and BPT were associated. Scientists also reported that high level irregularity or mass formation and MPM were associated [20]. Finally, a recent study reported overall sensitivity, specificity, PPV and NPV of the CT imaging were 68.2%, 78.0%, 80.4% and 64.9%, respectively [21]. Due to the lack of highly reliable results with morphological CT imaging, some researchers studied contrast-enhanced CT parameters. Many studies have reported that venous phase contrast-enhanced CT imaging provides more accurate results for pleural lesions’ evaluation [22, 23]. However, in a recent study, even if a venous phase was applied, and CT was reported by a thoracic radiologist, the sensitivity, specificity, PPV and NPV were 69%, 73%, 78% and 63%, respectively. If arterial phase imaging was applied, these values were 27%, 69%, 53% and 40%, respectively [24]. Moreover, Kato et al. reported that there were no significant differences between contrast enhanced and unenhanced CT imaging for characterized asbestos-related pleural thickening [20]. To overcome this difficulty, some other authors studied different MRI techniques. For example, Koc et al. aimed to obtain more reliable results with diffusion contrast enhanced MRI scanning. However, it could not provide high accuracy [25]. Tsim et al. used early contrast enhanced-MRI, which is a novel technique, to achieve high accuracy. With this method the authors reported sensitivity, specificity, PPV and NPV of 83%, 83%, 68% and 92%, respectively. Although it has higher accuracy compared to conventional ones, low PPV is noteworthy [26].
Our study had similar findings as those reported in the literature. 66.7% of the patients with diffuse thickening and 65.2% of the patients with nodular thickening were diagnosed with MPM. In addition, 44.4% of patients with pleural calcification had MPM, and 56.4% had BPT. These results were not statistically significant (p > 0.1). On the other hand, two CT parameters could differentiate BPT from MPM significantly. The first one was presence of effusion. In our patient population, 83.3% of the patients with pleural effusion were diagnosed MPM and only 16.7% of them had BPT. This was statistically significant (p = 0.01). A recent study also mentioned this relationship [27]. Ökten et al. reported that 83% of the pleural effusion patients had MPM. This value was very similar to our results [28]. Nonetheless, only 56.0% of the MPM patients had pleural effusion in our patient population. Chen et al. found that 60.0% of the MPM patients had pleural effusion [29]. According to findings, if a patient has pleural effusion and a history of asbestos exposure, he/she has high risk of MPM. However, if a patient does not have pleural effusion, this finding cannot exclude MPM. The second CT parameter related to MPM was size of the thickening. Moore et al. reported that if a lesion is > 10 mm, the likelihood of malignancy increases significantly [30]. In another study, if pleural thickening > 10 mm, sensitivity was found to be 56% and specificity was 88% [17]. We calculated size > 14 mm as an optimal cut-off value for pleural thickening characterization. With this cut-off value, the sensitivity, specificity, PPV and NPV were found to be 85.7%, 83.3%, 90.0% and 76.9%. When we evaluated all unenhanced CT parameters, pleural thickening pattern (circumferential or nodular) or calcification could not differentiate benign lesions from MPM. On the other hand, presence of effusion, and size of the thickening were able to characterize it. However, if they are used alone, they are not reliable for differentiation of BPT from MPM.
At this point, [18F]FDG-PET/CT is a useful modality. Terada et al. reported that mean SUVmax was 5.3 for MPM and 1.2 for benign pleural disease [8]. Yeom et al. found that mean SUVmax was 2.0 in benign tumors, while it was 3.6 in malignant cases [31]. We calculated that the mean SUVmax of BPT was 2.96 and the mean SUVmax of MPM was 10.6. Our findings supported previous research. On the other hand, this is not the main problem in characterization of asbestos-related pleural thickening with [18F]FDG-PET/CT. The main problem is the lack of a consensus of the SUVmax cut-off value. Abe et al. accepted the SUVmax > 2.0 as a cut-off value, and 30/31 (96.7%) patients of MPM had positive uptake. The remaining 1 patient’s SUVmax value was above 2.0 after the delayed image [13]. However, this value has insufficient NPV. Elboga et al. reported that the sensitivity, specificity, PPV, NPV and accuracy of [18F]FDG-PET/CT were 91.8%, 61.5%, 87.1%, 72.7% and 84%, respectively [32]. In this study SUVmax > 2.5 was accepted as a cut-off value. Terada et al. accepted SUVmax > 3.5 as an optimal value. With this, they found 59.6% sensitivity, 93.1% specificity, 93.3% PPV and 58.7% NPV [8]. There are also some other studies performed to reach more satisfactory results with SUVmax. For example, Yamamoto et al. found that sensitivity, specificity, PPV and NPV were each 88% with qualitative analysis [33]. Yildirim et al. determined the SUVmax > 2.2 as a cut-off value. Scientists reported that the sensitivity, specificity, PPV, and NPV were 94.1%, 100%, 100%, 93.3%, respectively [34]. The methodological differences between studies may have caused the differences. We found SUVmax > 4.0 as an optimal cut-off value by ROC analysis. The sensitivity, specificity, PPV and NPV were 88.0%, 83.3%, 91.7%, 76.9%, respectively. We think that although SUVmax > 4.0 has high PPV, and moderately high NPV, if used alone, it is not a reliable parameter for pleural lesion characterization.
On the other hand, when we used either SUVmax > 4.0 or size > 14 mm, 24 out of 25 (96.0%) MPM patients had one of them. The remaining 1 patient had pleural effusion. When we used SUVmax < 4.0, size < 14 mm, and lack of pleural effusion altogether, all of these patients had BPT. We think these results are within an acceptable range. When this criterion was applied to our patient population, 58.3% of BPT cases were correctly diagnosed without biopsy. This approach could also allow us to avoid one out of every five (7/37) invasive diagnostic methods.
Our study has some limitations. First of all, it has a retrospective nature and inherently has limitations due to this kind of design. Secondly, although our patient population was exposed to asbestos for a long period of their life, due to features of the region, the number of biopsies with proven BPT were still low. We think our biopsy selection criteria caused this. Thirdly, we did not include the MRI or contrast-enhanced CT results in the study. However, [18F]FDG-PET/CT examination is mostly performed without IV contrast and the current study design did not include these techniques. In addition, as mentioned in the text, enhanced CT or MRI techniques also lacked sufficient accuracy for characterization.
In conclusion, before deciding the invasive diagnostic approaches for asbestos related pleural thickening patients, according to unenhanced CT and [18F]FDG-PET/CT findings, we should check firstly the SUVmax value and size of the thickening. If a patient has SUVmax > 4.0, or size > 14 mm these patients must undergo the biopsy. If a patient’s SUVmax < 4.0, size < 14 mm and he/she has no pleural effusion, the likelihood of MPM is low. These patients can undergo the follow-up. If a patient’s SUVmax < 4.0, size < 14 mm but the patient has pleural effusion, this patient has BPT with high likelihood. However, we cannot exclude MPM with this result. Due to the risk of misdiagnosing them, biopsy or cytology may be appropriate for them. This is another subject of research. Figure 3 summarizes this approach. Finally, we think multicentric and high-volume prospective studies may clarify the recommended approach’s usefulness.