Introduction
Malign pleural mesothelioma (MPM) is the primary malignant tumor of the pleura, which usually develops secondary to asbestos or erionite exposure [1, 2]. Overall, the prognosis is poor in patients with MPM, where the survival ranges from 6 to 17 months with a median of 12 months or less [3–5]. Though chemotherapy increases median survival slightly, the response to chemotherapeutic agents is reported to be around 50% [6]. Nevertheless, improved outcomes were reported with multimodal treatment in cases with early-stage, epithelioid-type tumors [7]. As almost all patients receive chemotherapy, identifying those patients with better prognosis via biomarkers is as important as early diagnosis. Moreover, determination of good prognostic factors is critical for the development of novel therapeutic regimens and identification of biologically distinct subgroups of the disease which will respond to the therapy.
Younger age, early-stage disease, epithelial type tumor, and good performance status are among well-accepted clinical factors indicative of better outcome. Positron emission tomography–computed tomography (PET-CT) and biomarkers also have potential value in this manner [8, 9]. Biomarkers draw great attention not only because of their ease of use in blood samples and being less expensive and repeatable, but also because the monitoring of their presences is relevant to the emergence and development of the tumor. However, no biomarker has been jointly agreed upon yet to determine the prognosis or to monitor the therapy in MPM.
In this study, we aimed to identify biological markers that could be used to determine the prognosis in MPM. To achieve this purpose, in tumor tissue, at diagnosis we examined midkine (MDK) [10], syndecan-1 (SDC1) [11], and hyaluronan synthase-2 (HAS2) [12], which we analyzed in our previous studies of MPM patients. We further studied sestrin-1 (SESN1) and laminin subunit alpha-4 (LAMA4), which was predicted to affect the prognosis by the Unsupervised Survival Analysis Tool (USAT) [13]. Fibulin-3 (FBLN3), which is widely studied as a potential diagnostic and prognostic marker [14, 15], was included in the study.
Material and methods
The study was performed between March 2015 and March 2017 in Eskisehir Osmangazi University Lung and Pleural Cancers Research and Clinical Center after being approved by the Ethics Committee for Clinical Research of Eskisehir Osmangazi University (Approval no: 80558721/69). Written informed consent was obtained from all patients.
Study population
A total of 54 patients who received chemotherapy and had an established diagnosis of MPM were included in the study. At the planning stage of the study, the sample size was calculated as at least 54, assuming a medium effect size α error of 0.05 and β error (1-power) of 0.20. Age, sex, smoking status, asbestos exposure, clinical findings, and Karnofsky Performance Score (KPS) of the subjects were recorded. Their diagnostic, therapeutic, and prognostic follow-up data were documented with diagnosis data, histopathological type of the tumor, disease stage, chemotherapy regimens, treatment responses, and recurrence and mortality date. All of the patients included in the study have died. The stage was determined according to the 8th edition of TNM classification [16–18]. These parameters were further analyzed in the epithelioid MPM subgroup since such cases constitute the majority of all MPM patients and chemotherapy and other treatment modalities are more effective in these patients.
Biological analyses
We examined expression of MDK, SDC1, HAS2, SESN1, LAMA4 and FBLN3 in this study. We identified SESN1 and LAMA4 using an in house R-based script, Unsupervised Survival Analysis Tool (USAT), as defined elsewhere [13]. The GSE17118 dataset was analyzed using USAT to identify candidate genes that could be associated with prognosis of mesothelioma patients. USAT uses Cox proportional hazard regression, maximally selected rank statistics and log-rank tests with different types of expression data and stage stratification to determine stage-independent prognostic gene markers. Any gene is considered as significant when any of its probesets are significant in all those three statistical tests. We also chose to test FBLN3 as a potential prognostic marker [14, 15].
Pleural tissue specimens used in the study were histopathologically confirmed MPM samples that were obtained by diagnostic image-guided needle biopsy or medical thoracoscopy before the treatment. These tissue specimens were stored at –80°C until the laboratory studies were initiated.
RNA isolated from tissue samples (Norgen Animal Tissue RNA Isolation Kit [#25700] kit) were used for qPCR. cDNA was prepared from 200 ng of RNA (Genedirex GScript RTase kit). Glucose-6-phosphate dehydrogenase (G6PD) and TATA-box binding protein (TBP) were selected as housekeeping genes. Primers were designated to exon-span to avoid amplification of genomic DNA contamination. A Roche LightCycler 480 Real Time PCR (qPCR) device and ABM EvaGreen qPCR Mastermix-S kit were used to quantify expression of the determined genes in the tissue samples. qPCR results were pre-analyzed with Roche Relative Quantification. Crossing point (Cp) values of all samples were obtained after qPCR.
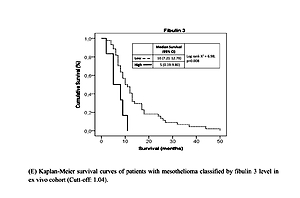
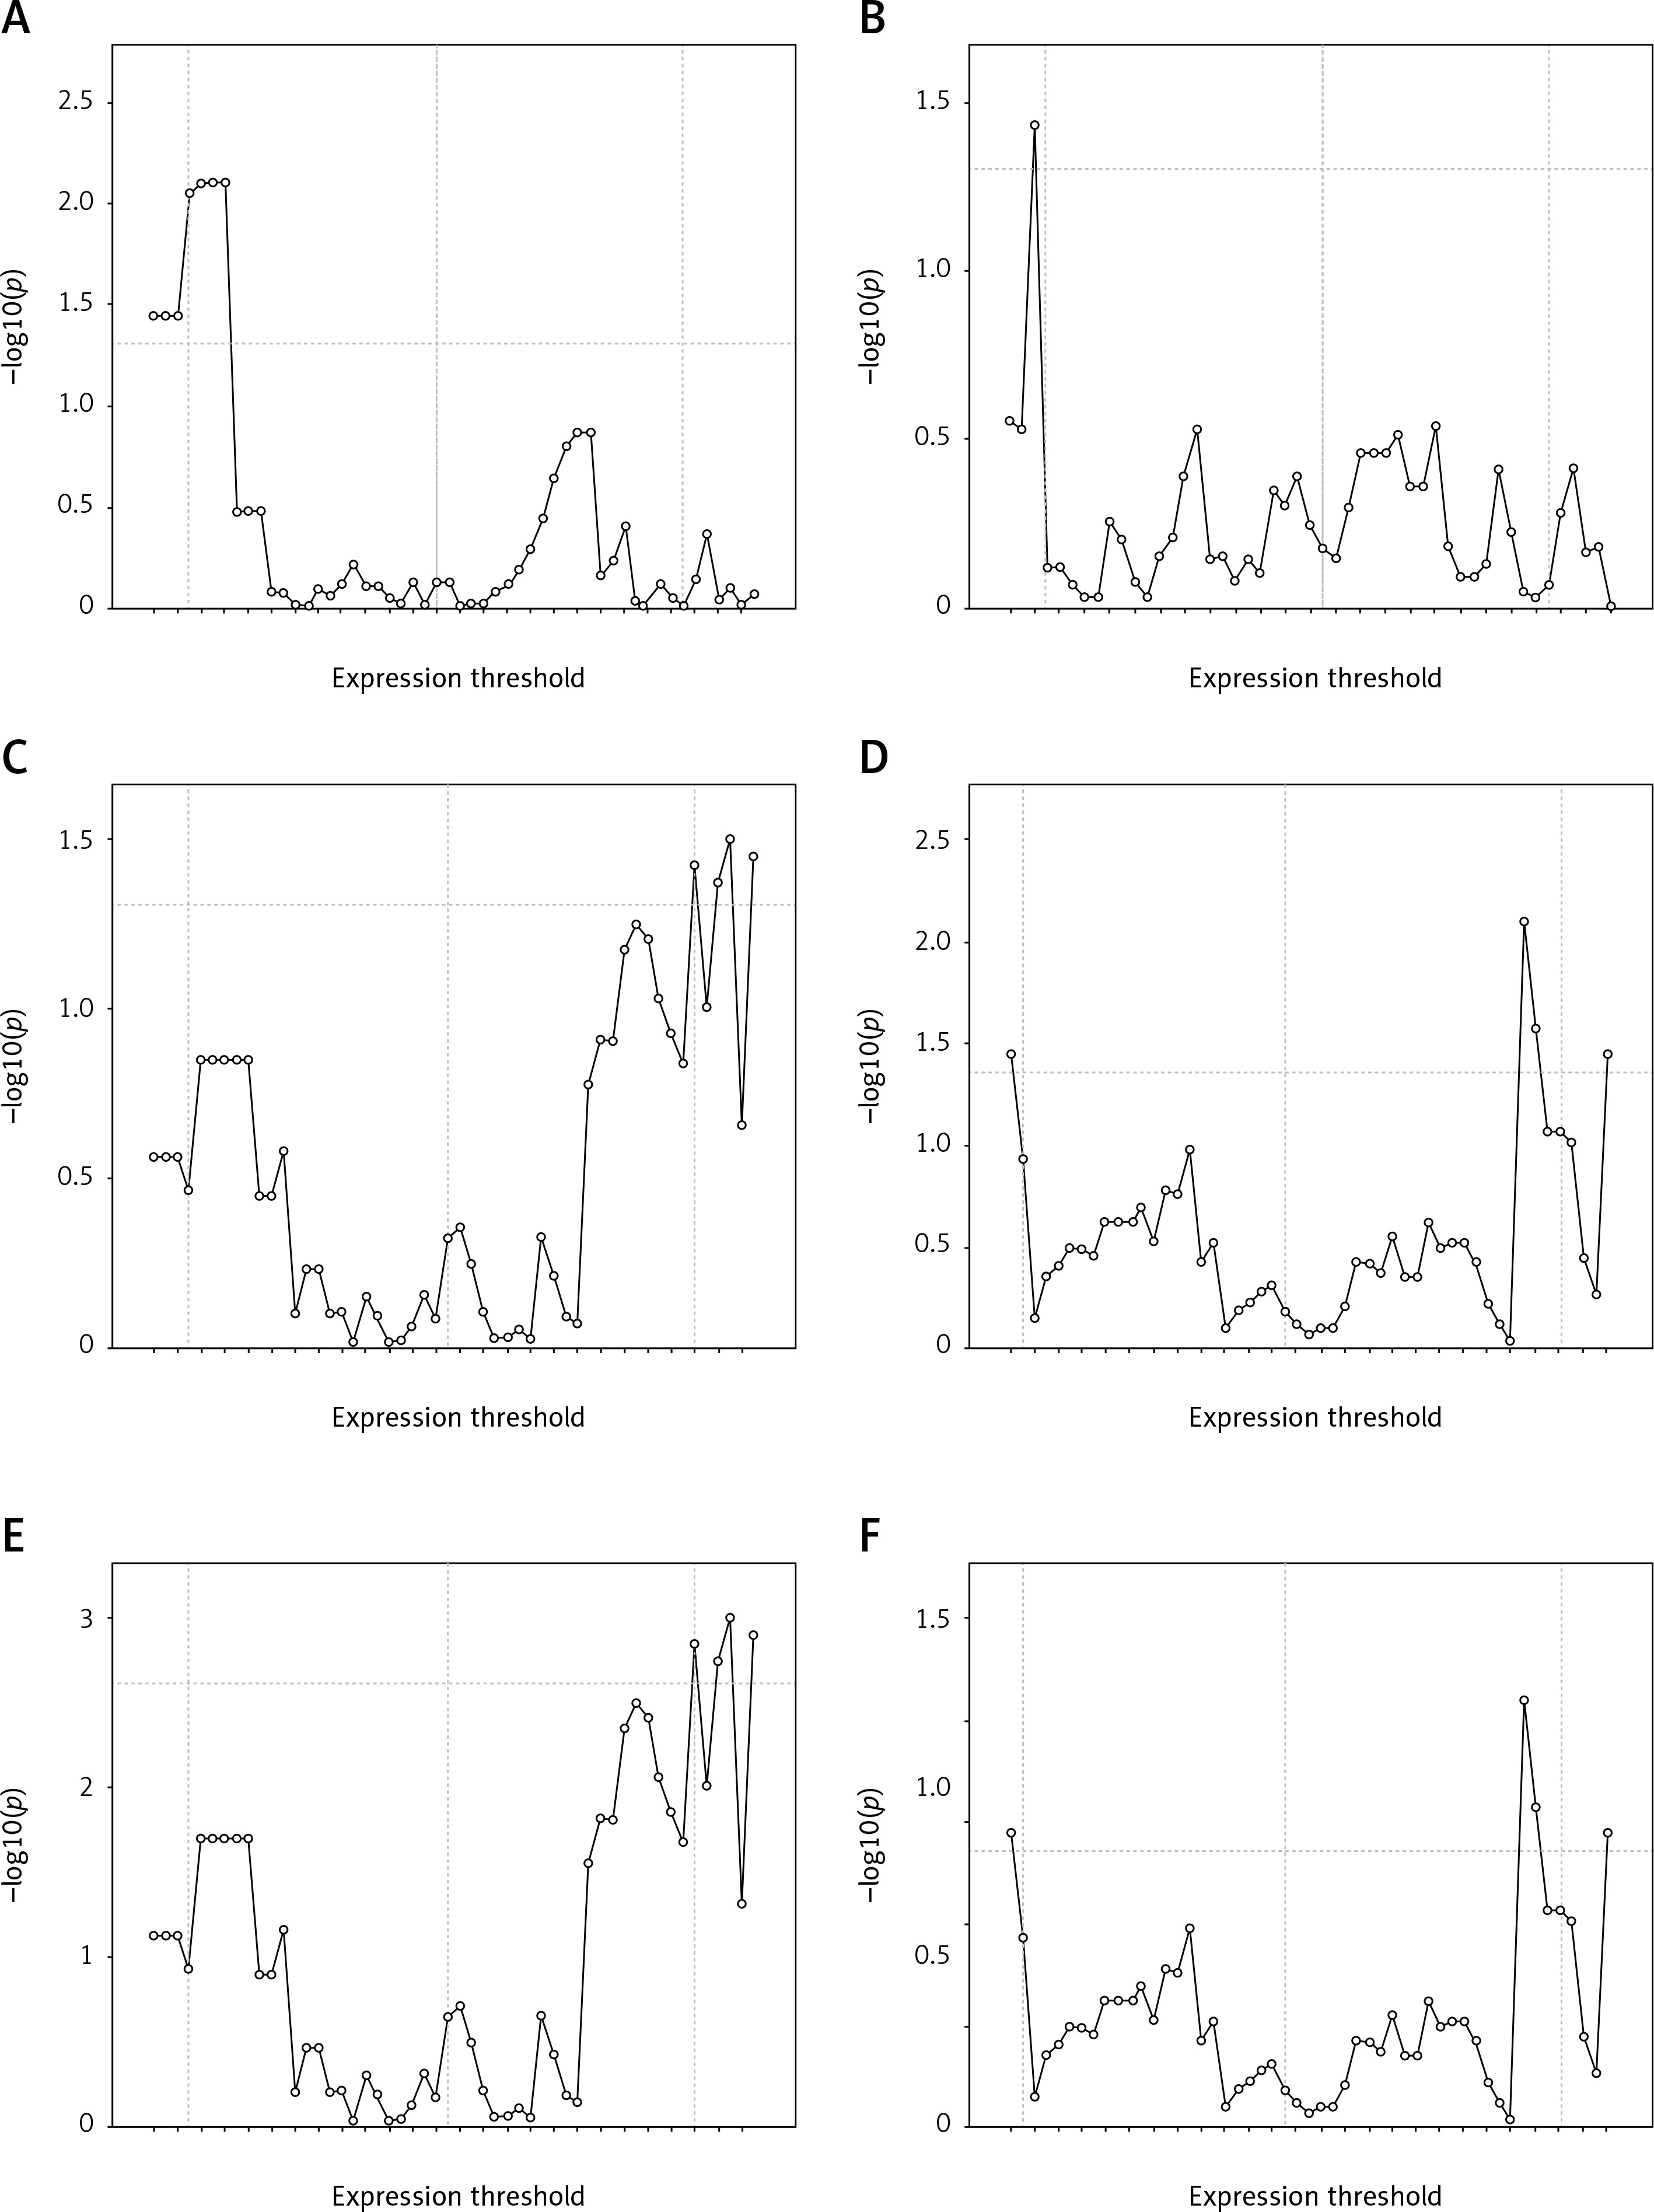
qPCR based expression of the 6 genes in the ex-vivo cohort was assessed and used for log-rank multiple cut-off analysis (LRMC) (Figure 1). The cut-off with the lowest p-value within the 10th and 90th percentiles was determined as threshold for each gene for further Kaplan-Meier analysis. The cut-off values of MDK, SDC1, HAS2, SESN1, LAMA4, and FBLN3 genes were 2.04, 0.04, 0.55, 0.9, 0.9, 1.04 for good prognosis, respectively. The median survival times for low (< 0.9) and high expression (≥ 0.9) of LAMA4 were 9.0 (6.8–11.2) months and 10.1 (6.8–13.2) months, respectively (log-rank = 0.137; p = 0.711).
Statistical analysis
Continuous variables were expressed as mean ± standard deviation (SD), median, and minimum-maximum values whereas categorical variables were expressed as percentages. The ΔCp value was calculated by subtracting the reference gene’s Cp value from the test gene’s Cp value. The reference gene’s Cp value was the geometrical mean of the Cp value of housekeeping genes. The calculation of ΔΔCp involved subtraction by the ΔCp calibrator value. The fold changes for relative gene expression were determined by 2−Δ(ΔCp).
Log-rank multiple cut-off analysis was used to determine appropriate cut-off values for each gene as described previously [19]. Briefly, patients were divided into two groups based on all gene expression values, and log-rank p-values were calculated for the resulting strata. Graphs featuring –log10(p) values (y axis) and cut-off values (x axis) for each gene were then created. In all LRMC figures the first, second, and third vertical lines indicate the 10th percentile, median, and 90th percentile, respectively. The horizontal line indicates the negative logarithmic value (1.30) of p = 0.05, which was accepted as the margin of statistical value. Optimal cut-off values were determined by accepting the values above the horizontal line and between the 10th and 90th percentiles.
Overall survival was calculated from the date of diagnosis to death, or else censored at the last follow-up date. Survival analyses for each gene were performed with the Kaplan-Meier test based on the appropriate cut-off values. Adjustment was made according to stage and KPS to determine the effect of each gene on prognosis using Cox regression analysis. Then, factors affecting the prognosis (genes, stage, histopathology and KPS) were determined by Cox regression analysis for all of the variables with p < 0.20. Statistical analyses were performed using IBM SPSS Version 15.0 Software (IBM Corp., Armonk, NY). Statistical power was calculated by G * Power (Version 3.1.9.2) statistical software. After the study, actual power in post-hoc power analysis was calculated as 0.8040880.
Results
In order to evaluate the prognostic value of the expression of MDK, SDC1, HAS2, SESN1, LAMA4, and FBLN3 genes, we used an ex-vivo MPM cohort. Demographic and clinical characteristics of the MPM patients in the study are presented at Table I.
Table I
Patient characteristics
All patients had a history of asbestos exposure, 92.6% of which was environmental and the remaining 7.4% occupational. The percentage of MPM cases with smoking history was 37%. The chemotherapy regimen in the study was cisplatin plus pemetrexed.
The associations between patients’ median survival and studied gene expressions are shown in Figure 2.
Figure 2
Kaplan-Meier survival curves of patients with mesothelioma classified by: A – midkine level in ex-vivo cohort (cutt-off: 2.04); B – syndecan-1 level in ex-vivo cohort (cutt-off: 0.04); C – hayluronan sybthase-2 level in ex-vivo cohort (cutt-off: 0.55); D – sestrin-1 level in ex-vivo cohort (cutt-off: 0.09); E – fibulin 3 level in ex-vivo cohort (cutt-off: 1.04)
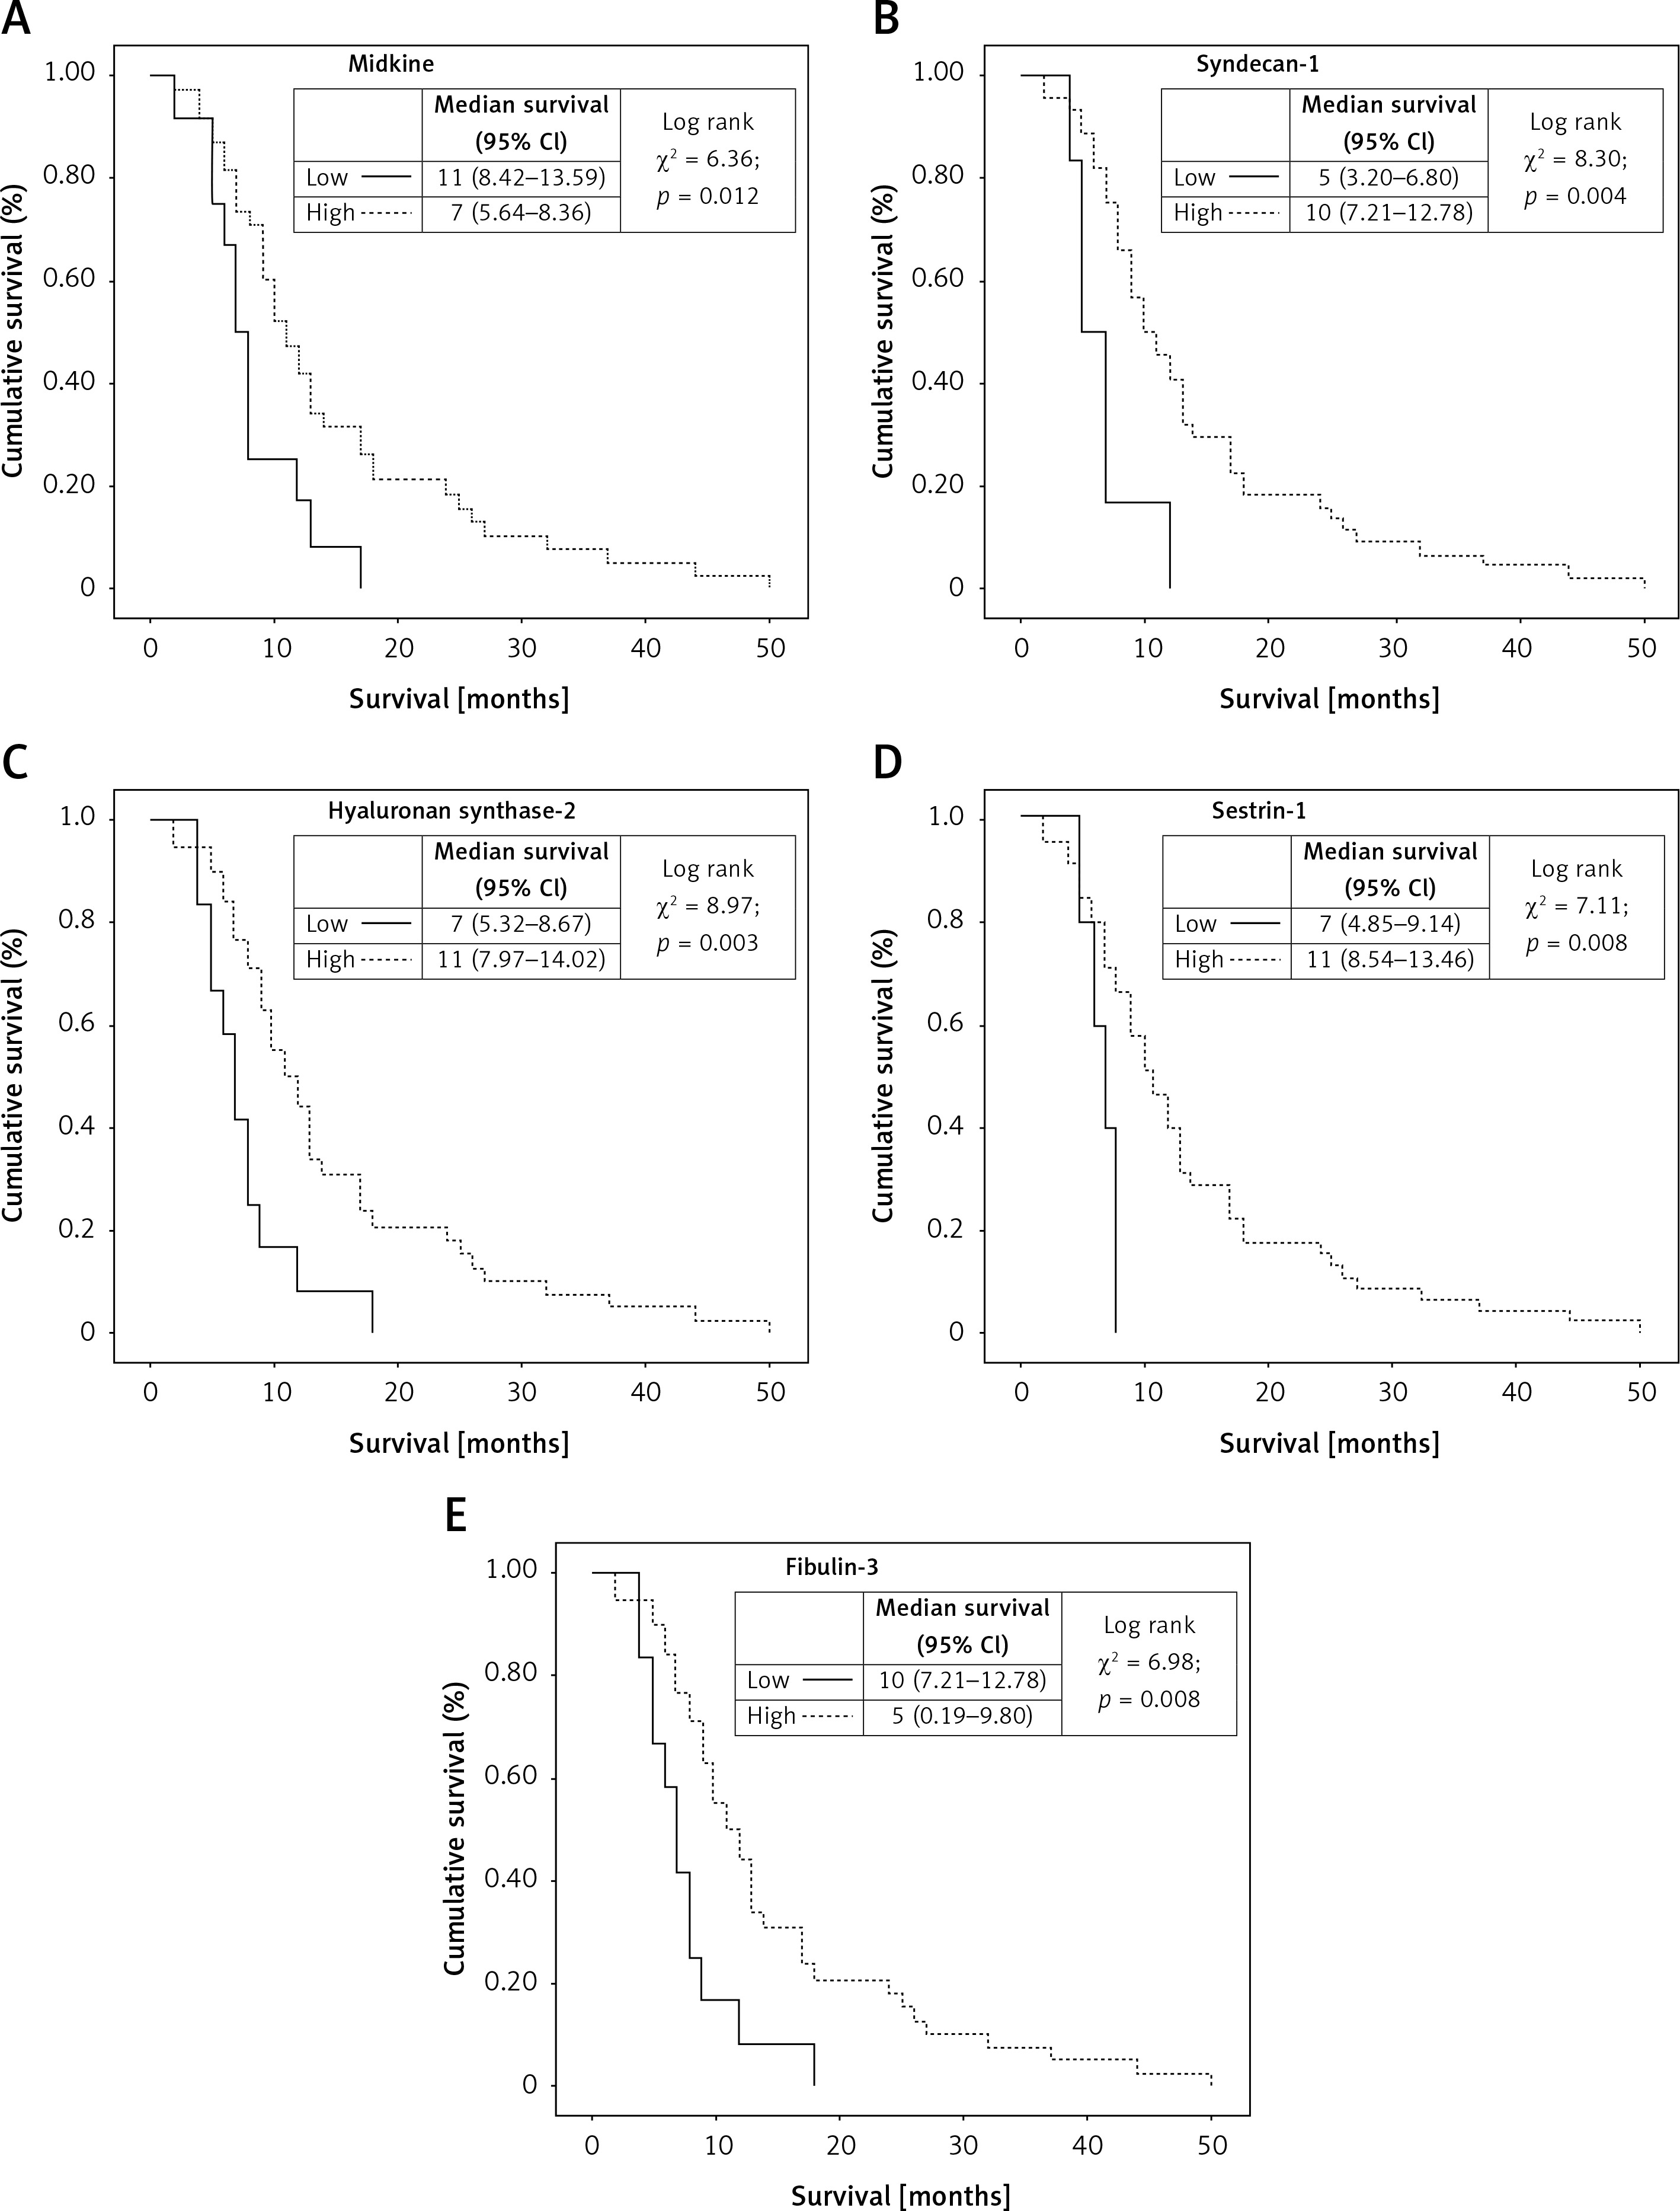
The prognosis was significantly worse in patients with tumors overexpressing MDK (≥ 2.04) and FBLN3 (≥ 1.04) genes (Figures 2 A, E). On the other hand, the prognosis was significantly better in patients where SDC1 (≥ 0.04), HAS2 (≥ 0.55), and SESN1 (≥ 0.09) overexpression was detected (Figures 2 B, C, D). LAMA4 was not significantly associated with survival.
After adjustment for stage and KPS, Cox regression analysis showed that overexpression of MDK (p = 0.021), SDC1 (p = 0.009), HAS2 (p = 0.005), and SESN1 (p = 0.014) was associated with prognosis while FBLN3 (p = 0.657) and LAMA4 (p = 0.472) overexpression was not (Table II). In multivariate analysis, parameters of histopathology, stage, KPS and overexpression of MDK (p = 0.007), HAS2 (p = 0.008) and SESN1 (p = 0.014) genes were found to be independently and significantly associated with survival in MPM patients (Table II).
Table II
Survival outcomes of malignant pleural mesothelioma patients in multivariate analysis models
| Parameter | HR (95% CI)* | P-value | HR (95% CI)** | P-value |
|---|---|---|---|---|
| Histopathology: | ||||
| Epithelioid | Ref | 0.001 | Ref | 0.001 |
| Others | 3.70 (1.69–8.08) | 4.51 (1.90–10.67) | ||
| Stage: | ||||
| I–II | Ref | 0.020 | Ref | 0.027 |
| III–IV | 2.90 (1.18–7.10) | 2.92 (1.13–7.59) | ||
| KPS: | ||||
| ≥ 80 | Ref | 0.040 | Ref | 0.001 |
| < 80 | 3.05 (1.05–8.83) | 7.27 (2.22–23.79) | ||
| MDK: | ||||
| Low | Ref | 0.021 | Ref | 0.007 |
| High | 2.91 (1.17–7.23) | 3.89 (1.46–10.40) | ||
| SDC1: | ||||
| High | Ref | 0.009 | Ref | 0.053 |
| Low | 3.47 (1.37-8.77) | 2.77 (0.99-7.74) | ||
| HAS2: | ||||
| High | Ref | 0.005 | Ref | 0.008 |
| Low | 2.72 (1.35–5.46) | 2.77 (1.30–5.92) | ||
| SESN1: | ||||
| High | Ref | 0.014 | Ref | 0.014 |
| Low | 3.67 (1.30-10.37) | 4.0 (1.33-12.01) | ||
| LAMA4: | ||||
| High | Ref | 0.472 | ||
| Low | 0.80 (0.44-1.46) | |||
| FBLN3: | ||||
| Low | Ref | 0.657 | ||
| High | 0.78 (0.25–2.38) | |||
Epithelioid mesotheliomas constituted 79.6% of MPM cases in this study. After adjustment for stage and KPS, overexpression of HAS2 (p = 0.023) and SESN1 (p = 0.19) was associated with prognosis (Table III). Karnofsky Performance Score and overexpression of MDK (p = 0.014), FBLN3 (p = 0.029), HAS2 (p = 0.014) and SESN1 (p = 0.045) genes were found to be independently and significantly associated with survival in multivariable Cox regression analysis in epithelioid MPM patients (Table III).
Table III
Survival outcomes of epithelioid malignant pleural mesothelioma patients in multivariate analysis models
| Parameter | HR (95% CI)* | P-value | HR (95% CI)** | P-value |
|---|---|---|---|---|
| Stage: | ||||
| I–II | Ref | 0.051 | Ref | 0.144 |
| III–IV | 2.93 (0.99–8.61) | 2.30 (0.75–7.05) | ||
| KPS: | ||||
| ≥ 80 | Ref | 0.362 | Ref | 0.043 |
| < 80 | 1.98 (0.46–8.56) | 5.17 (1.06–25.30) | ||
| MDK: | ||||
| Low | Ref | 0.081 | Ref | 0.014 |
| High | 2.65 (0.89–7.96) | 4.47 (1.35–14.78) | ||
| SDC1: | ||||
| High | Ref | 0.058 | Ref | 0.074 |
| Low | 2.92 (0.97–8.83) | 3.09 (0.90–10.63) | ||
| HAS2: | ||||
| High | Ref | 0.023 | Ref | 0.014 |
| Low | 2.53 (1.14–5.64) | 2.90 (1.24–6.80) | ||
| FBLN3: | ||||
| Low | Ref | 0.133 | Ref | 0.029 |
| High | 3.12 (0.71–13.76) | 5.93 (1.20–29.22) | ||
| SESN1: | ||||
| High | Ref | 0.019 | Ref | 0.045 |
| Low | 4.11 (1.26–13.39) | 3.74 (1.03–13.61) | ||
| LAMA4: | ||||
| High | Ref | 0.214 | ||
| Low | 0.64 (0.32–1.27) | |||
Discussion
Determination of prognosis is very important in MPM both for life expectancy of the patient and selection and initiation of the best treatment options. There are some clinical factors associated with prognosis in MPM [20–22]. Nonetheless, clinical factors are not useful for longitudinal follow-up of patients. With a focus on identifying prognostic biomarkers in MPM, this study evaluated the markers that we analyzed previously or were detected to be potentially effective by appropriate data software media yet there are no known data in the literature. It might be thought that a prognostic biomarker could be elevated both in the blood and pleural fluid, facilitating the analysis of biomarkers in these body fluids. However, recent studies reported that investigation of prognostic biomarkers might be useful when initially analyzed in tumor tissues [23–25]. It may be more appropriate to examine tumor tissue since a limited number of samples will be studied in the first step of biomarker determination. If the presentation of a gene in the tumor tissue has been determined, then it can be analyzed in the body fluid samples of larger patient groups. Our study indicated that overexpression of MDK was associated with poor prognosis in tumor tissue of MPM patients whereas overexpression of HAS2 and SESN1 was associated with good prognosis, where a potential use of these biomarkers could be suggested.
Midkine encodes a heparin-binding growth factor that promotes survival, growth, and cellular migration. Its genetic expression is especially present during embryogenesis [26], yet its level decreases until reaching a nadir in healthy adults [27]. Midkine is associated with a mitogenic effect, angiogenesis promoting effect, anti-apoptotic activity, and fibrinolytic activity in the development of malignancy. In the study where we investigated use of MDK and mesothelin in the diagnosis and prognosis of MPM, we detected that MDK was positively correlated with disease stage, and higher serum level of MDK was associated with poor prognosis after adjustment for disease stage, histological type, and treatment modalities [10]. In the current study, the prognosis was poorer in patients who had MDK overexpression, which was consistent with our previous findings.
Syndecan-1 encodes a cell surface proteoglycan, which regulates a variety of biological process including cellular division, differentiation, invasion, migration, and angiogenesis [28]. These functions imply a pathophysiological role for SDC1 in malignant neoplasms [11]. The extracellular component of SDC1 undergoes proteolytic breakdown by the metalloproteinases, incorporating into the body fluids. Therefore, the level of SDC1 may alter in several pathological conditions such as during the course of the cancer, or development of metastasis, suggesting a potential target for association with prognosis. Kumar-Singh et al. in their study observed that the cases which had > 25% SDC1 immunoreactivity in their MPM tumor cells had better prognosis compared to those with < 25% SDC1 immunoreactivity. They further reported that disappearance of SDC1 genetic expression could play a key role in epithelial mesenchymal transformation [29]. In a study where our clinic was also included, when we accepted the estimation value of SDC1 in pleural fluid samples of MPM cases as 100.2 ng/ml, the prognosis was found to be poorer in patients who have SDC1 values above the estimation value compared with those below the estimation value (7.8 months vs. 17 months); however, no significant association was found between prognosis and serum SDC1 values [11]. This indicated that different findings were obtained when SDC1 levels were measured in different biological products. In our study, the prognosis was better in patients in whom the SDC1 gene was overexpressed, which was also found after adjustment based on the stage and KPS but not confirmed in multivariate analysis. A study reported that SDC1 could have either a tumor suppressing or a tumor triggering function based on the type of the tumor [30]. It is obvious that SDC1 warrants further research in this respect.
Hyaluronan (HYA) is a high-molecular weight glycosaminoglycan found in nearly all tissues. It is produced by both tumor cells and stromal cells. Hyaluronan was shown to be the predominant glycosaminoglycan that forms the connective tissue within the tumor [31]. Its production is increased during wound healing and tissue repair. Recent experimental studies underlined the importance of HAS2 in HYA synthesis [32]. A study examined genetic expression profiles of HYA, HAS1, HAS2, and HAS3 in MPM cell lines and cell culture, where only HAS2 was found to be overexpressed in all cell lines and cell culture [33]. Naked mole rats have a relatively very long life-span compared with equal-sized house mice (32 years vs. 4 years). A study reported that naked mole rats never developed cancer throughout their life-span [32]. The study by Tian et al. attributed this cancer refractoriness to excessive production of high-molecular weight HYA [34]. Reduced genetic expression of HAS2 that was involved in HYA synthesis was shown to cause tumor development in naked mole rats [32]. For this reason, HAS2 might be more useful than HYA for the prognosis of MPM. There has been no study yet to investigate the association of HAS2 and MPM prognosis.
In the study by Thylen et al., it was detected that elevation of serum HYA levels was positively correlated with tumor burden in MPM cases that featured high HYA levels in pleural fluid at the beginning, and it was further suggested that HYA could be used in clinical follow-up of these patients [35]. Another study by Creaney et al. reported poorer prognosis in MPM patients who had lower pleural levels of HYA compared to those having higher levels (12.6 months vs. 18 months) [23]. In our study, the prognosis was significantly better in patients with HAS2 gene overexpression. Similarly, the prognosis was also better in epithelioid MPM patients who had overexpression of the HAS2 gene. The association of HAS2 gene overexpression with survival was statistically significant in both overall MPM and epithelioid MPM.
Fibulin-3 is involved in formation of intercellular matrix, cellular replication, and migration, and mediates intercellular and cell-matrix connections [36]. Fibulin-3 is released from fibroblastic elastic tissues and vascular structures. Also, genetic overexpression of FBLN3 was observed in mesenchymal condensation and growth of bone and cartilaginous structures. A multicenter study by Pass et al. performed with MPM patients showed a significant decline of plasma FBLN3 levels after cytoreductive surgery and increased levels when progression occurred. It was further reported that FBLN3 level in pleural fluid was an independent prognostic indicator of survival in MPM patients who underwent cytoreductive surgery, where high pleural fluid FBLN3 level was associated with poor prognosis [37]. Creaney et al. reported that pleural fluid FBLN3 level was a significant independent prognostic factor in patients with MPM [14]. Consistently, Kirschner et al. reported an independent association of high pleural fluid FBLN3 level with poorer prognosis in MPM patients [15]. However, another study did not find any association between prognosis of MPM and plasma FBLN3 level [38]. Kaya et al. in their study where they accepted the threshold for serum FBLN3 level as 36.6 ng/ml reported the diagnostic sensitivity and specificity of this parameter to be above 90%, albeit insufficient to determine the prognosis [39].
In our study, the prognosis was poor in patients who had an overexpressed FBLN3 gene, but no effect on survival could be observed after it was adjusted according to the stage and KPS. However, our data showed the effect of FBLN3 on survival of epithelioid mesothelioma patients. Higher levels of FBLN3 in biphasic and sarcomatoid tumors and reduced FBLN3 genetic expression in epithelial tumors may explain the negative association of FBLN3 with the prognosis [14]. Moreover, inconsistent findings with previous studies could be attributed to the absence of a correlation between pleural fluid, plasma, and serum levels of FBLN3 [14, 37].
In order to identify novel independent biomarkers in MPM, SESN1 and LAMA4, the genes that were determined by USAT script were included in this study. Sestrin-1 encodes a member of the sestrin family which has regulatory functions in lipid deposition, and metabolic balance, muscle, and heart functions [40]. The protein encoded by SESN1 inhibits the protein target of rapamycin (TOR) by activating adenosine monophosphate activated protein kinase, and hence causing cessation of cellular growth [41]. Sestrin-1 was stressed to be a strong modulator of cellular growth and proliferation [42]. Sestrin-1 was suggested to be a potential therapeutic target in breast and colon cancers. However, no study has been undertaken so far in MPM. In our study, the prognosis was better in patients where the SESN1 gene was overexpressed both in the main MPM group and the epithelioid type subgroup. These findings might be explained by the strong modulatory role of SESN1 for cellular growth and proliferation. As there is no study in this respect, it appears very critical to test this unique finding in further research.
Laminin subunit alpha-4 encodes a member of the laminin family, which is a member of extracellular matrix glycoproteins and a major non-collagenous component of the basal membrane. They are involved in cellular adhesion, differentiation, migration, signaling, and axonal growth [43]. Genetic overexpression of LAMA4 in tumor cells was observed in tumor progression and epithelial-mesenchymal transition. Huang et al. reported overexpression of LAMA4 in tumor tissue, where they further associated this overexpression with tumor invasion and metastasis. The authors suggested that LAMA4 protein was located at the basal membrane of the tumor blood vessel, and could have a potential association with tumor angiogenesis [44]. In our study, LAMA4 expression was not associated with survival.
Mesothelin was not included in this study, because mesothelin is a well-studied biomarker for mesothelioma diagnosis and prognosis. In a recent meta-analysis, high levels of mesothelin were associated with poor prognosis [45]. However, this is not always the case. It is known that mesothelin levels may vary depending on various factors. One of them is polymorphism in the mesothelin gene. It was reported that mesothelin levels were high in some healthy people due to polymorphism [46]. It should be taken into account by studies about mesothelin levels in mesothelioma.
The limitation of our study was the small size of the study population, which did not allow us to assess and discuss cellular subtypes other than MPM.
In conclusion, MDK, HAS2, and SESN1 were identified as potentially useful biomarkers in MPM patients, where overexpression of MDK was associated with poor prognosis and HAS2 and SESN1 overexpression was associated with better prognosis. Overexpression of the latter two genes was further found to be associated with good prognosis also in epithelioid MPM. However, overexpression of MDK and FBLN3 was associated with poor prognosis in epithelioid MPM patients. Our findings are unique assessments with respect to the biological markers. These results should be confirmed in a larger group of patients. Beyond this point, it will be possible to study these prognostic biomarkers in sera and pleural fluids of the mentioned patient groups.