Introduction
Rheumatoid arthritis (RA) is a systemic autoimmune disease characterized by erosive polyarthritis [1]. The typical clinical manifestations of RA include joint swelling, pain, and morning stiffness. These frequently recurring symptoms often lead to chronic disease progression, resulting in joint deformity and functional impairment, disability, and loss of ability to work [1]. In addition, RA can cause life-threatening complications and diseases of the extra-articular organs, such as the heart, nervous system, and respiratory system [2].
The Global Burden of Disease (GBD) database, which provides a systematic scientific assessment of the global burden of 369 diseases and injuries in 204 countries and territories, is currently one of the most widely used data sources for assessing disease burden [3]. It is important to understand the current burden of RA and the related differential trends worldwide for developing effective prevention strategies and reducing the global burden of RA.
Thus, we analysed the global incidence, disability-adjusted life-years (DALYs), and estimated annual percentage change (EAPC) of RA from 1990 to 2019 using the GBD 2019 data.
Material and methods
Data sources
The burden of RA was stratified by geographical region, SDI region, sex, and age. This study included data from the GBD 2019 study, which was performed by the Institute for Health Metrics and Evaluation at the University of Washington. It provides a scientific estimate of the global disease burden of 369 diseases and injuries in 204 countries or regions [3]. The Institutional Review Board of Yuyao People’s Hospital, China, reviewed and approved this study (2022).
The Global Health Data Exchange (http://ghdx.healthdata.org) is a data catalogue. The GBD 2019 study used the DisMod-MR 2.1 system to estimate the incidence of RA with internal consistency. This system is an epidemiological analysis tool developed by the GBD Research Group using a Bayesian meta-regression method, and it ensures consistency in epidemiological indicators (incidence, prevalence, etc.); even when the data are sparse, this tool provides good performance. Details about the estimation strategy and modelling process can be found in the literature [3].
The 95% uncertainty intervals (UIs) for the incidence and DALYs of RA according to sex, country, and territory were obtained from the GBD 1990–2019 data for 204 countries and territories; the UI is a series of values that reflect the certainty of an estimate. In the GBD database, every estimate is calculated 1000 times, each time sampling from the distributions rather than point estimates for data inputs. The 95th UI is determined by the 25th and 975th values out of 1000 values after ordering them from the smallest to largest.
The following data were extracted from the GBD 2019 study: sex, age, socio-demographic index (SDI) region, geographic region, and country. The SDI is a composite indicator that assesses the level of socio-demographic development in association with health status [4]. In short, the SDI is the geometric mean of the total fertility rate of those aged less than 25 years, the average education level of those aged 15 years and over, and the lagged per-capita income distribution, and its value ranges from 0 to 1 [4]. The 204 countries and territories included in the GBD study are divided into 5 regions based on the SDI: low, low-middle, middle, high-middle, and high.
Estimation framework
Using GBD 2019 study data, the present study mainly assessed the incidence rate and DALYs as indicators to evaluate the disease burden of RA. DALYs, as a comprehensive index, refer to all healthy life-years lost from disease onset until death; in short, DALYs are constituted by the years of life lost due to disease (years of life lost) and those lost due to disability due to disease (years lived with disability) and can be calculated using the following formula: DALYs = years of life lost + years lived with disability.
Statistical analysis
When calculating the EAPC based on the age-standardized rate, the calendar year is set as an independent variable, and a linear regression fit analysis is performed with the natural logarithm of the age-standardized rate using the following formula: y = a + bx + ε [where y = ln (age-standardized rate); x = calendar year; and EAPC = l 00 × (exp(D) − 1), where D is the estimated value of the slope b]. We then calculated the 95% confidence interval (CI), obtaining the standard error from the fitted regression line. If both the EAPC estimate and the lower level of its 95% CI are > 0, the age-standardized rate is considered to be increasing. By contrast, if both the EAPC estimate and the upper level of its 95% CI are < 0, the age-standardized rate is considered to be decreasing [5]. All calculations were performed using R software (version 3.5.1).
Results
Incidence of RA
From 1990 to 2019, the global age-standardized RA incidence increased by 6.47% from 12.21 to 13 (Table I); a consistently increasing trend was observed, with an EAPC of 0.30 (95% CI: 0.25–0.34) (Table I, Figure 1 A, Supplementary Figure S1 A). The global age-standardized RA incidence in both sexes increased between 1990 and 2019 (EAPC for men = 0.30; EAPC for women = 0.28) (Table I, Figure 1 A, Supplementary Figure S1 A); the age-standardized RA incidence was lower in men than in women (Table I).
Table I
The age-standardized incidence rate (ASIR) of rheumatoid arthritis in 1990 and 2019 and its temporal trends
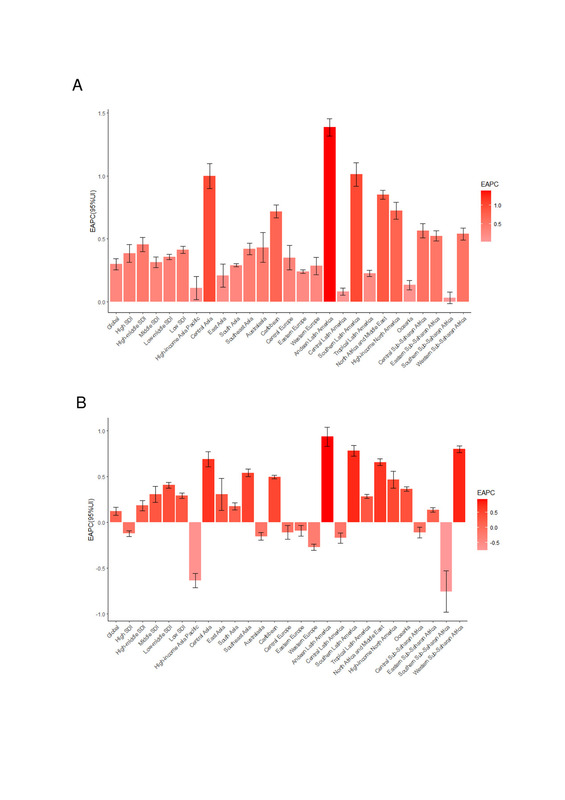
Figure 1
The EAPC of rheumatoid arthritis ASRs from 1990 to 2019, by regions. A – The EAPC of ASIR. B – The EAPC of age-standardized DALY rate
EAPC – estimated annual percentage change, ASRs – age-standardized rates, ASIR – age standardized incidence rate, DALY – disability adjusted life-year.
The male-to-female ratio of RA incidence peaked in the 65–69 years age group globally; the ratio also peaked in the same age group in the high- and low-middle-SDI regions. Moreover, the ratio peaked in the 55–59 years age group in the high-middle-SDI regions, in the 60–64 years age group in the middle-SDI regions, and in the 15–19 years age group in the low-SDI regions (Supplementary Figure S2). The global incidence of RA peaked at ages 60–64 in all SDI regions (Supplementary Figure S3).
As shown in Table I and Supplementary Figure S1 A, the age-standardized RA incidence was substantially higher in the high-SDI regions than in the other regions. In 2019, the high-SDI regions (17.13 per 100,000 population; 95% UI: 15.77–18.61) recorded the highest age-standardized RA incidence, followed by the low-middle-SDI regions (15.31 per 100,000 population; 95% UI: 13.90–16.84). The greatest increase in the age-standardized RA incidence was noted in the high-middle-SDI regions, where the EAPC peaked at 0.45 (Table I, Figure 1 A).
The EAPC of the age-standardized RA incidence was positively associated with both the age-standardized RA incidence (ρ = 0.090, p = 0.198) (Supplementary Figure S4 A) and the SDI (ρ = 0.011, p = 0.870) (Supplementary Figure S4 B). In 2019, the low-middle-SDI regions reported the highest RA incidence among adults (i.e. the 50–69 years age group), as did regions wherein the SDI increased between 1990 and 2019 (Supplementary Figures S5 A and S5 B). The annual RA incidence increased among younger people but decreased among older adults (Supplementary Figure S6 A).
In 2019, the highest regional age-standardized RA incidence was observed in North America (a high-income country; 21.46 per 100,000 population; 95% UI: 20.02–23.09), followed by central Latin America (21.12 per 100,000 population; 95% UI: 19.29–23.07) and Australasia (20.89 per 100,000 population; 95% UI: 18.75–23.34); the lowest regional age-standardized RA incidence was observed in Oceania (3.92 per 100,000 population; 95% UI: 3.40–4.51), followed by western sub-Saharan Africa (4.63 per 100,000 population; 95% UI: 4.09–5.23) and southeast Asia (5.54 per 100,000 population; 95% UI: 4.92–6.24) (Table I, Supplementary Table SI). From 1990 to 2019, the greatest increase in the age-standardized RA incidence was noted in Andean Latin America (EAPC = 1.39; 95% CI: 1.32–1.45), southern Latin America (EAPC = 1.01; 95% CI: 0.92–1.10), and central Asia (EAPC = 1.00; 95% CI: 0.90–1.10), whereas the lowest increase was reported in southern sub-Saharan Africa (EAPC = 0.03; 95% CI: –0.01 to 0.08), central Latin America (EAPC = 0.08; 95% CI: 0.05–0.11), and Asia Pacific (a high-income region; EAPC = 0.11; 95% CI: 0.02–0.20) (Table I, Figure 1 A, Supplementary Table SI).
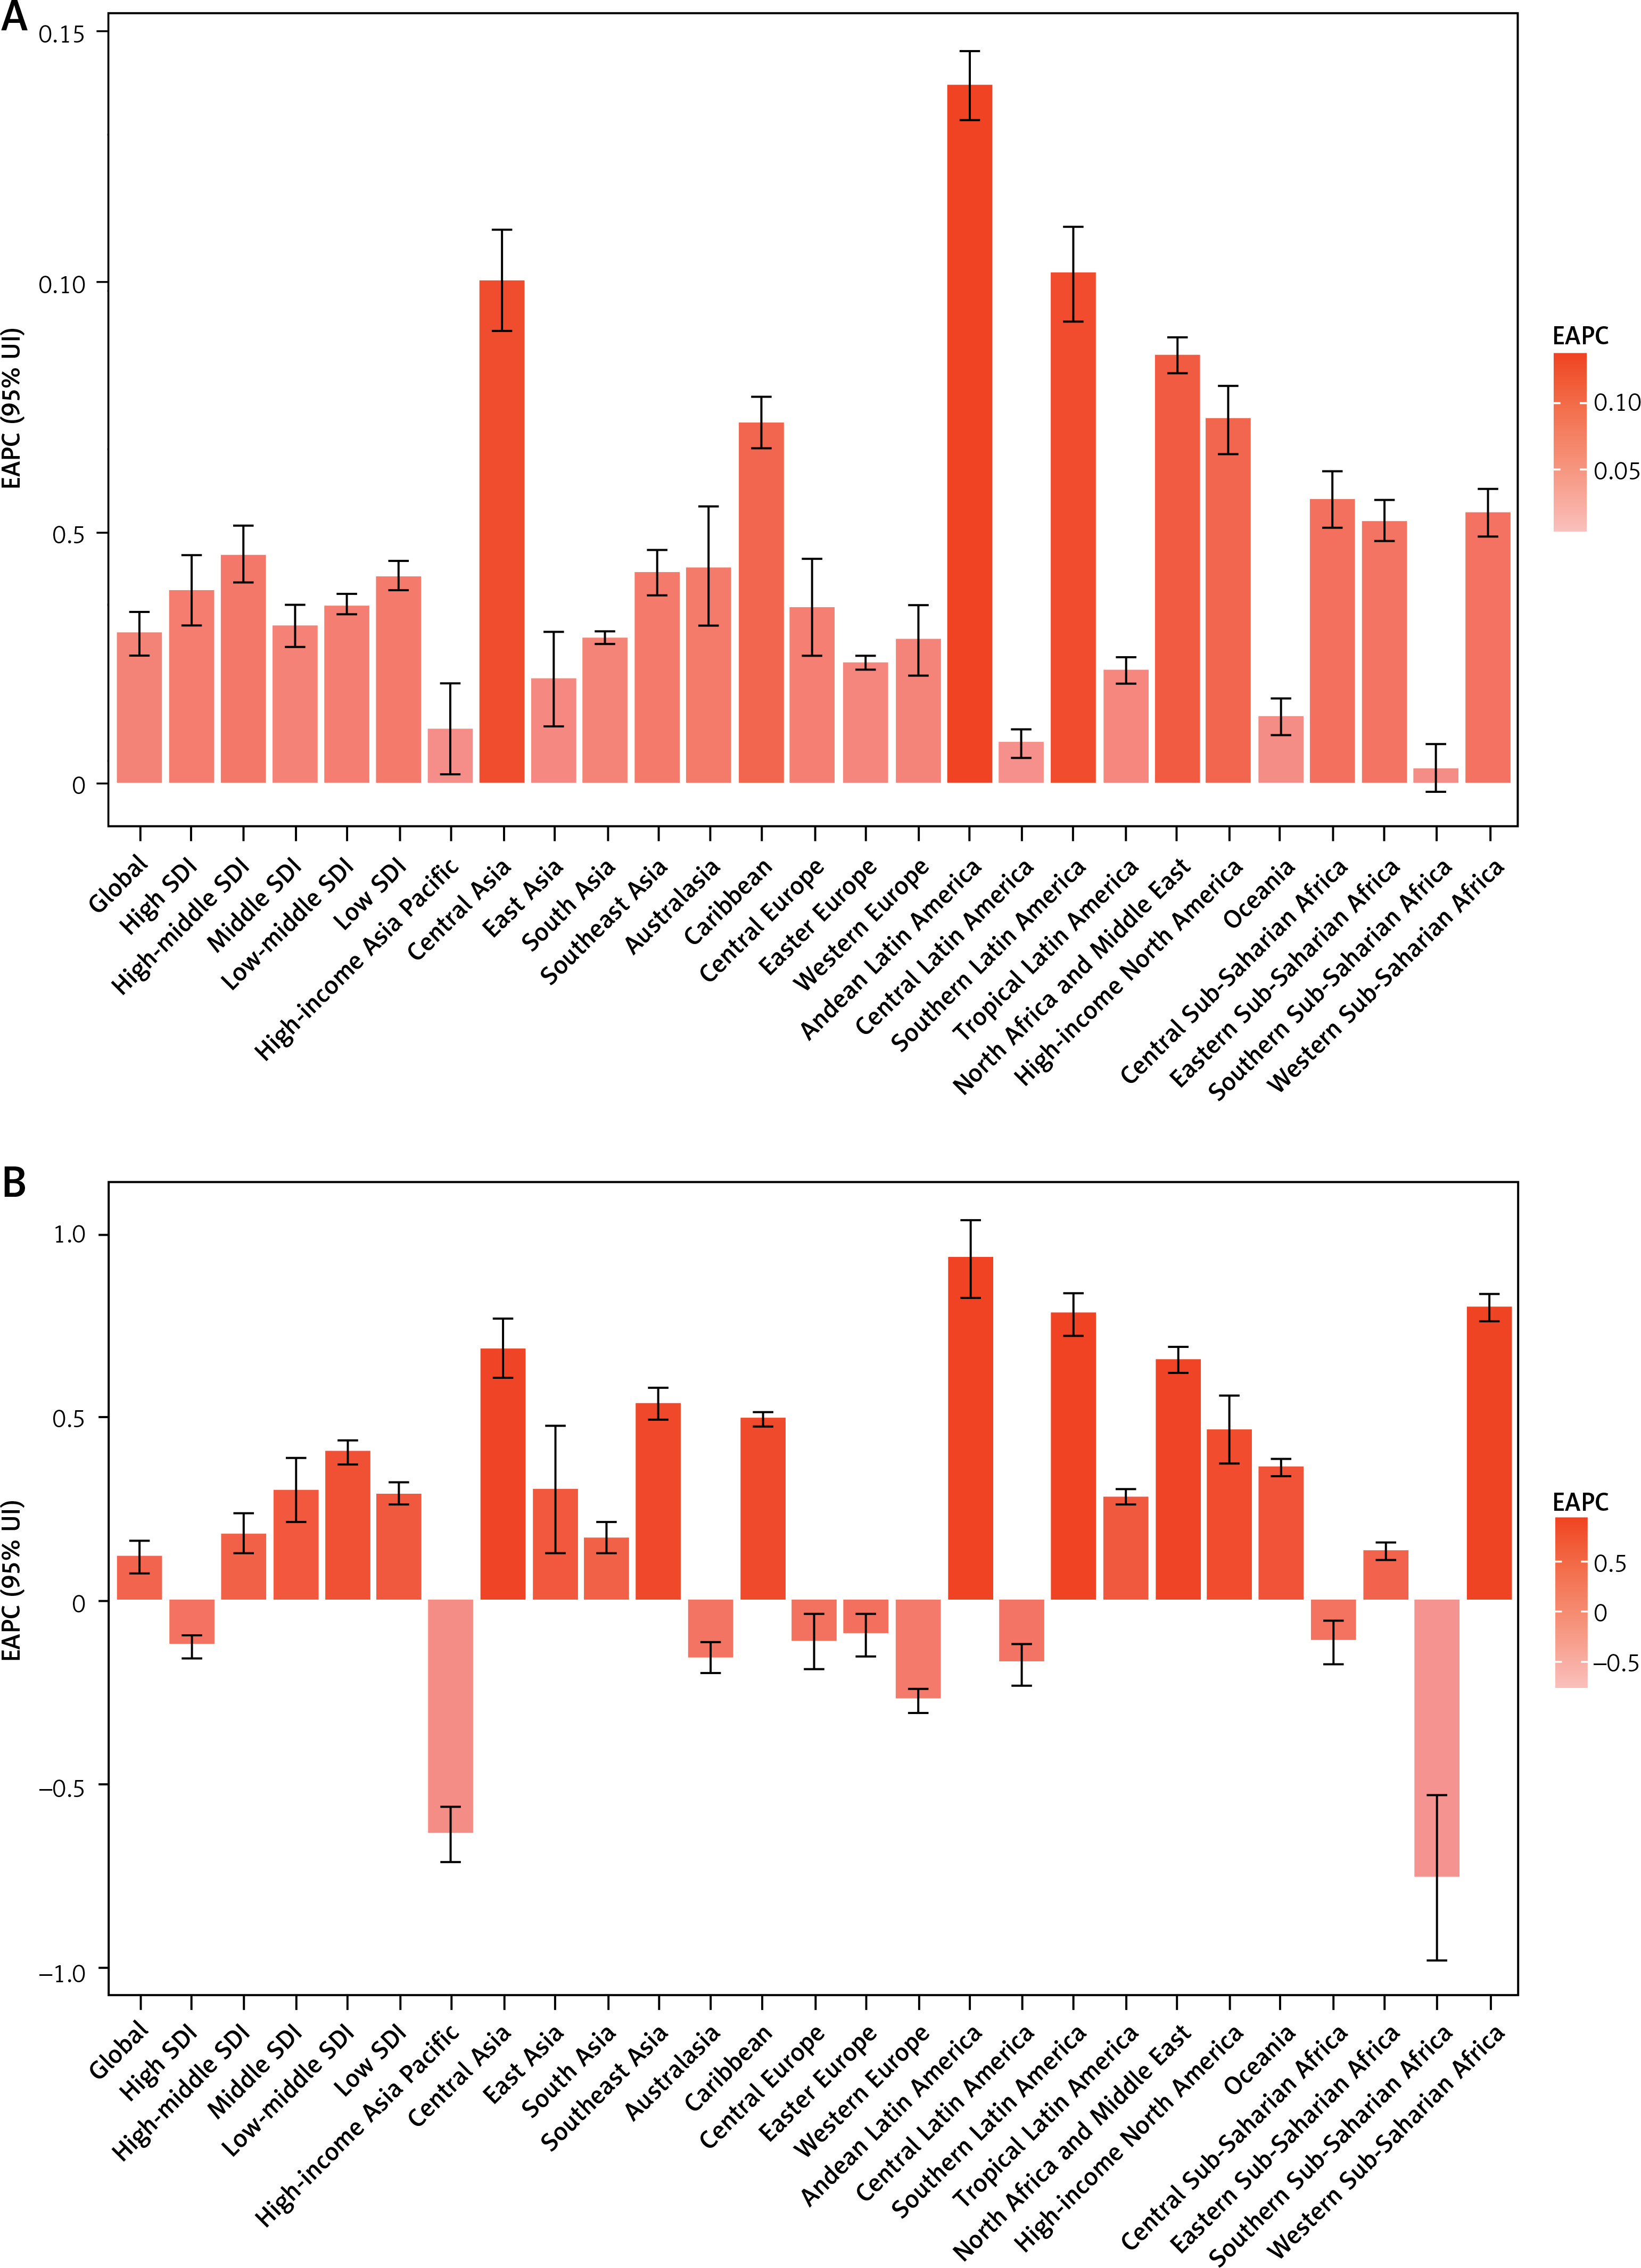
In terms of countries, in 2019, the highest age-standardized RA incidence was observed in Ireland (30.03 per 100,000 population; 95% UI: 26.97–33.31), followed by Finland (27.89 per 100,000 population; 95% UI: 25.50–30.76) and Kazakhstan (25.50 per 100,000 population; 95% UI: 23.45–28.01). The lowest age-standardized RA incidence was observed in Kiribati (3.47 per 100,000 population; 95% UI: 2.96–4.10), followed by Yemen (3.75 per 100,000 population; 95% UI: 3.23–4.37) and Papua New Guinea (3.76 per 100,000 population; 95% UI: 3.26–4.34) (Supplementary Tables SII and SIII). From 1990 to 2019, the age-standardized RA incidence decreased the most in the Democratic People’s Republic of Korea (overall EAPC = –0.40; EAPC for men = −0.24; EAPC for women = –0.24) and increased the most in Equatorial Guinea (overall EAPC = 1.78; EAPC for men = 1.80; EAPC for women = 1.88) (Figure 2 A, Supplementary Tables SII and SIII).
RA-associated DALYs worldwide
From 1990 to 2019, the global age-standardized RA-related DALYs increased by 1.15% from 39.12 to 39.57 (Table II). By contrast, the age-standardized DALYs showed an increasing trend, with an EAPC of 0.12 (95% CI: 0.08–0.17) (Table II, Figure 1 B, Supplementary Figure S1 B). The age-standardized number of DALYs increased in both men and women from 1990 to 2019 (EAPC for men = 0.16; EAPC for women = 0.12) (Table II).
Table II
The age-standardized DALY rate of rheumatoid arthritis in 1990 and 2019 and its temporal trends
From 1990 to 2019, the age-standardized RA-related DALYs were lower in men than in women, as reflected by the male-to-female ratios of 0.47 in both 1990 and 2019 (Table II). The male-to-female ratio of DALYs peaked in the 75–79 years age group across the world; the ratio also peaked in the same age group in the high-, high-middle-, and low-SDI regions. Moreover, the ratio peaked in the 85–89 years age group in the middle-SDI regions and in the 80–84 years age group in the low-middle-SDI regions (Supplementary Figure S7). The incidence of age-standardized RA-related DALYs peaked at ages 80-84 globally and in low-SDI regions (Supplementary Figure S8).
As shown in Table II and Supplementary Figure S1 B, the age-standardized RA-related DALYs were substantially higher in the low-middle-SDI regions than in the other regions in 2019. Moreover, in 2019, the highest regional age-standardized DALYs were observed in the low-middle-SDI regions (48.38 per 100,000 population; 95% UI: 37.95–59.54), followed by the high-SDI regions (45.02 per 100,000 population; 95% UI: 33.28–57.74). The age-standardized RA-related DALYs increased the most in the low-middle-SDI regions, where the values of EAPC peaked at 0.41 (95% CI: 0.38–0.44) (Table II, Figure 1 B).
The EAPC of the age-standardized RA-related DALYs was negatively associated with the age-standardized DALYs (ρ = –0.341, p < 0.001) (Supplementary Figure S4 C) and the SDI (ρ = –0.173, p = 0.013) (Supplementary Figure S4 D). In 2019, the highest incidence of age-standardized RA-related DALYs across all regions was observed among older adults (i.e. individuals aged > 70 years); moreover, regions in which the SDI increased from 1990 to 2019 witnessed higher rates of DALYs among older adults (Supplementary Figure S5 C and S5 D). Overall, the annual rate of DALYs increased among younger people but decreased among older adults (Supplementary Figure S6 C).
Across regions, the highest age-standardized RA-related DALYs in 2019 were observed in central Latin America (68.69 per 100,000 population; 95% UI: 52.71–86.70), followed by southern sub-Saharan Africa (56.76 per 100,000 population; 95% UI: 43.29–71.95) and North America (a high-income region; 53.53 per 100,000 population; 95% UI: 39.82–68.25). The lowest rates were observed in western sub-Saharan Africa (13.29 per 100,000 population; 95% UI: 9.80–17.09), followed by Oceania (13.77 per 100,000 population; 95% UI: 9.89–18.40) and southeast Asia (18.48 per 100,000 population; 95% UI: 13.76–23.64) (Table II, Supplementary Table SI). From 1990 to 2019, the age-standardized rates of RA-related DALYs increased the most in Andean Latin America (EAPC = 0.94; 95% CI: 0.83–1.04), western sub-Saharan Africa (EAPC = 0.80; 95% CI: 0.77–0.84), and southern Latin America (EAPC = 0.78; 95% CI: 0.72–0.84) and decreased the most in southern sub-Saharan Africa (EAPC = –0.75; 95% CI: –0.98 to –0.53), Asia Pacific (a high-income region; EAPC = –0.63; 95% CI: –0.71 to –0.56), and western Europe (EAPC = –0.27; 95% CI: –0.30 to –0.24) (Table II, Figure 1 B, Supplementary Table SI).
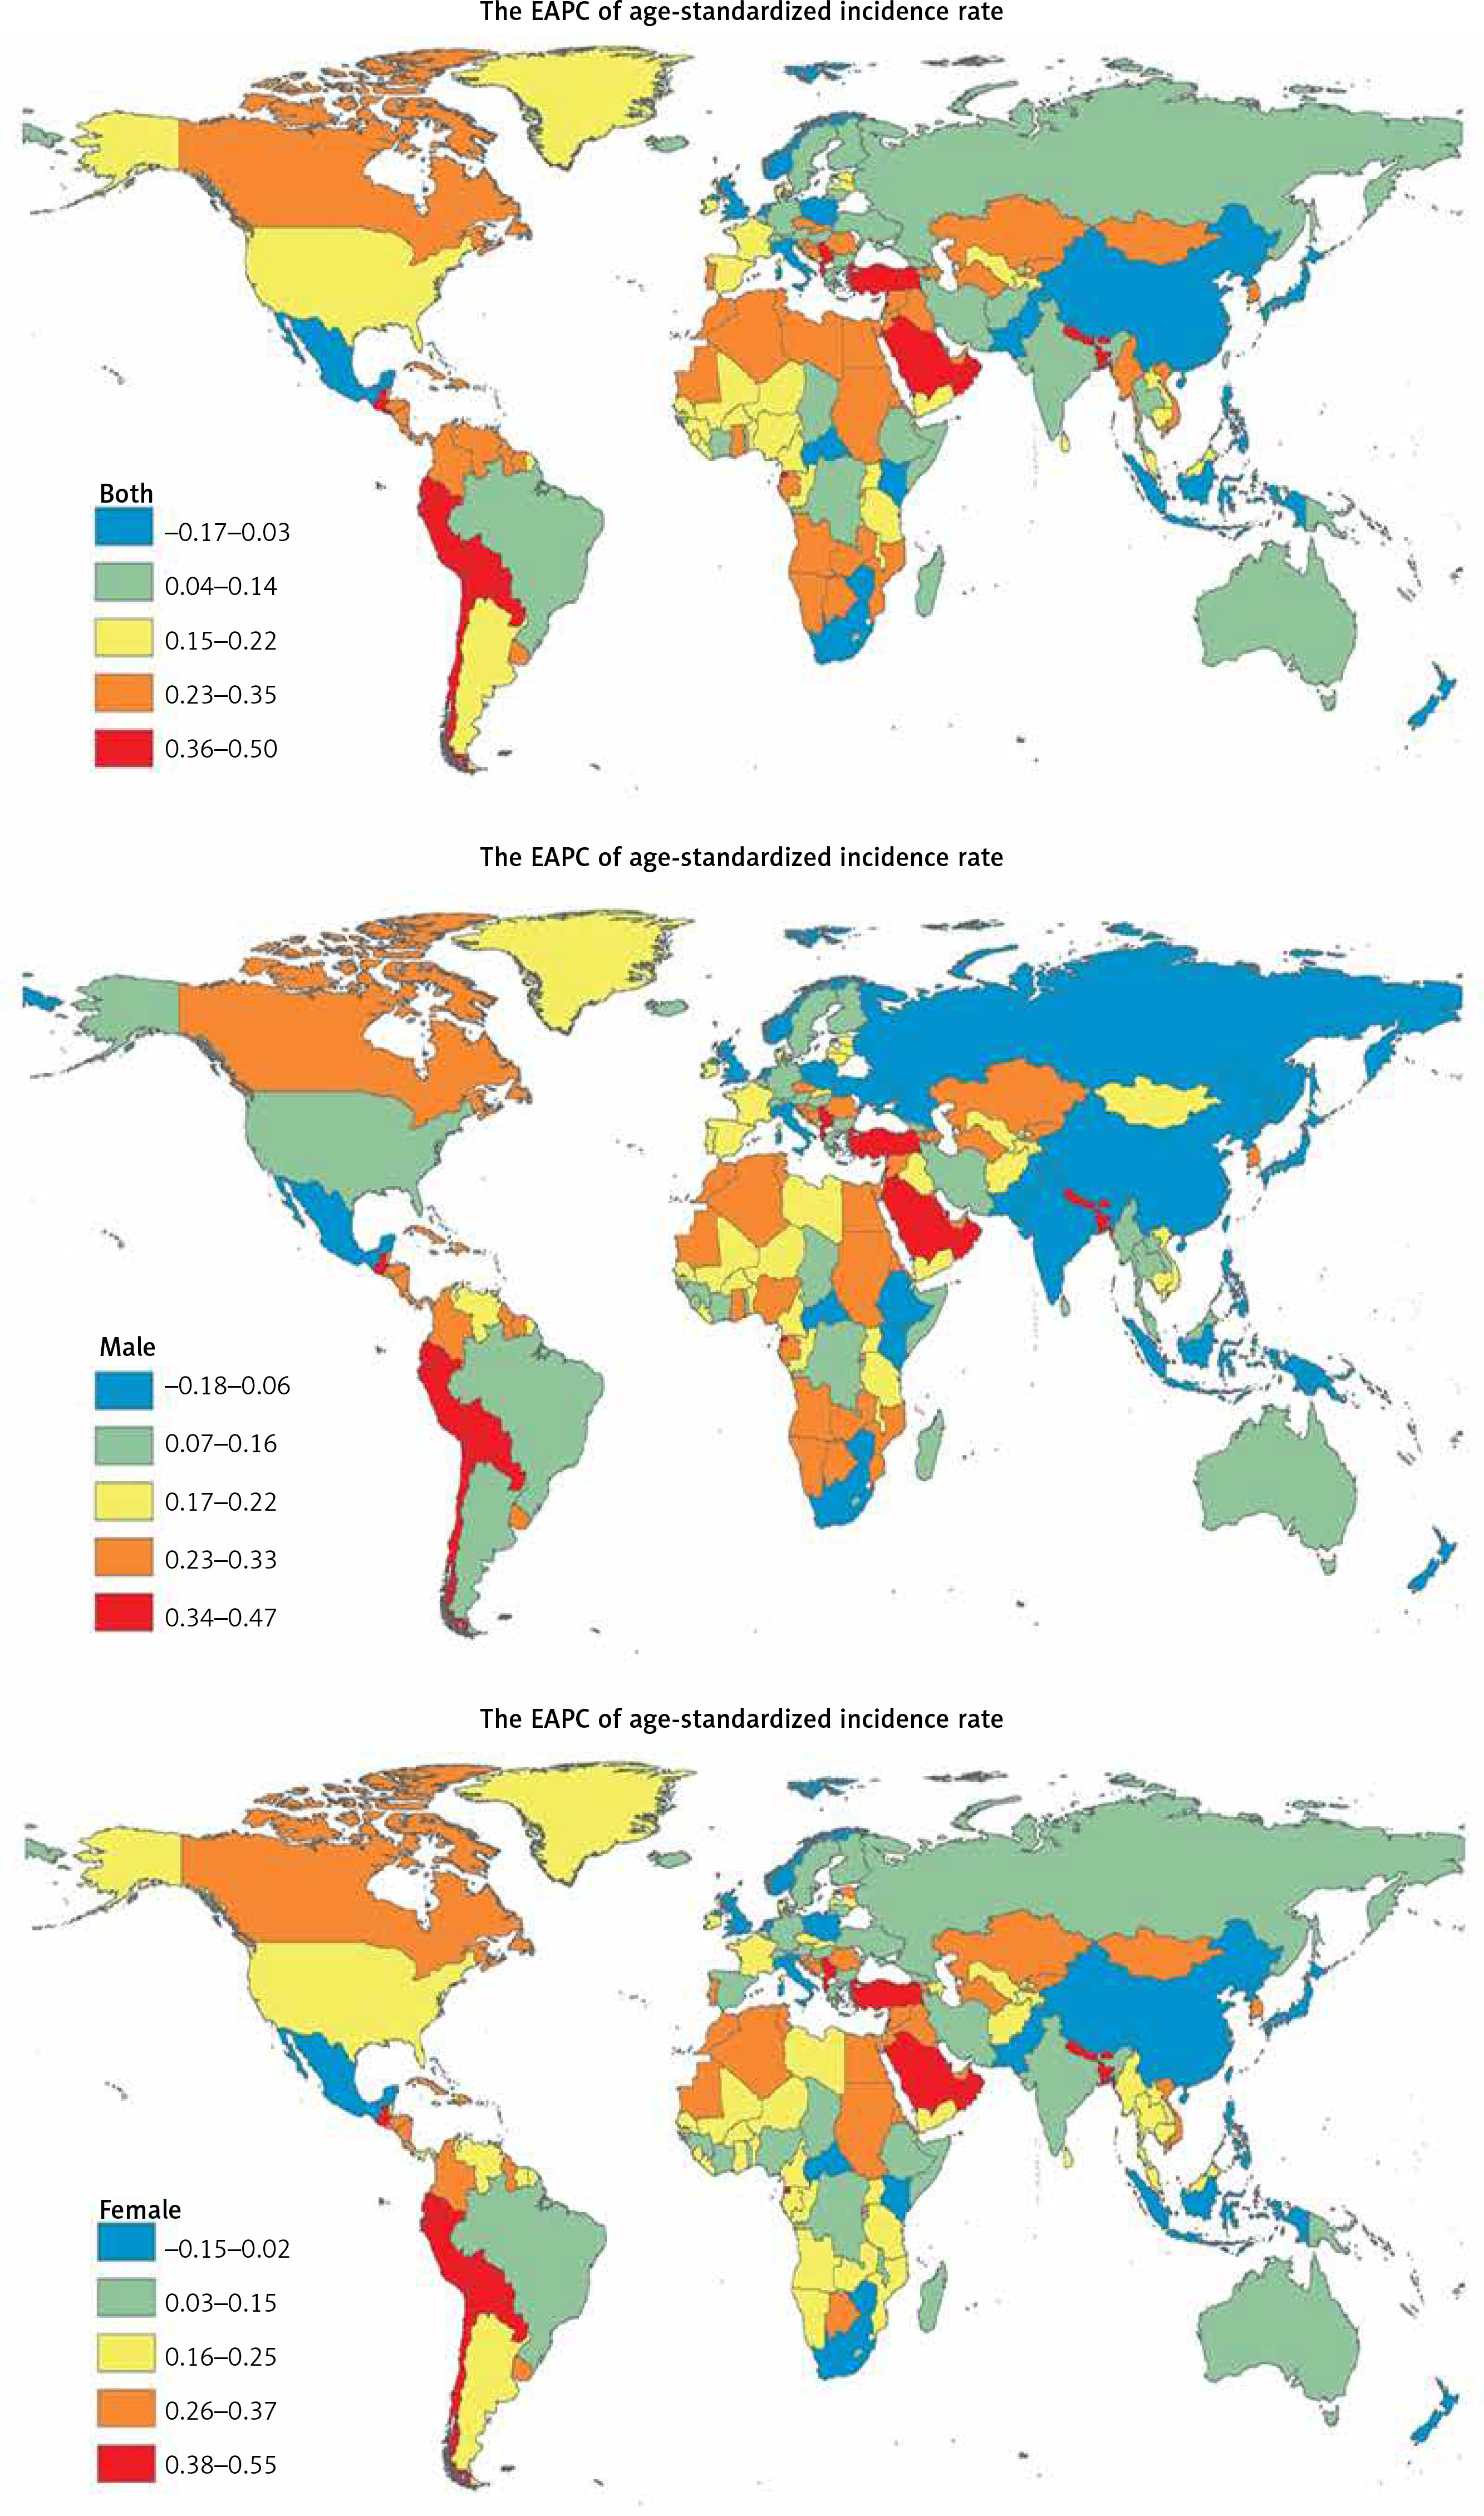
Across countries, the highest age-standardized RA-related DALYs in 2019 were observed in Honduras (90.15 per 100,000 population; 95% UI: 66.48–114.15), followed by Mexico (83.46 per 100,000 population; 95% UI: 64.55–106.40) and Ireland (74.84 per 100,000 population; 95% UI: 55.16–96.37), whereas the lowest age-standardized RA-related DALYs were observed in Yemen (12.50 per 100,000 population; 95% UI: 8.86–16.44), followed by Cabo Verde (12.52 per 100,000 population; 95% UI: 8.51–16.78) and Fiji (12.56 per 100,000 population; 95% UI; 8.74–17.24) (Supplementary Tables SII and SIV). Between 1990 and 2019, the age-standardized RA-related DALYs decreased the most in Poland (overall EAPC = –1.07; EAPC for men = –1.10; EAPC for women = –0.96) and increased the most in Paraguay (overall EAPC = 2.61; EAPC for men = 2.77; EAPC for women = 2.54) (Figure 2 B, 3, Supplementary Tables SII, SIV–SVI).
Discussion
The present study analysed the global RA burden from 1990 to 2019 using data from the GBD 2019 study. The major findings are as follows. Globally, the age-standardized incidence and DALYs of RA increased from 1990 to 2019. During this period, the age-standardized RA incidence increased the most in the high-middle-SDI regions. Regionally, the age-standardized RA incidence increased the most in Andean Latin America, southern Latin America, and central Asia. The age-standardized RA incidence was lower among men than among women. Finally, positive correlations were found between the EAPC of the age-standardized RA incidence and the SDI.
The incidence of RA is increasing, perhaps due to the increased survival of patients with RA [6]. Our study findings show that the age-standardized RA incidence was significantly higher in the high-SDI regions than in the other regions. Moreover, the age-standardized RA incidence increased the most in the high-middle-SDI regions, perhaps due to the availability of more human and financial resources in developed countries, which helps to increase the rates of early detection of RA and improve treatment efficacy; this phenomenon may also be related to the more advanced medical practices and greater access to care in these regions. This lower RA incidence may be partly attributable to the lower RA incidence in developing countries; however, it may also reflect differences in the age distribution between the study populations. Moreover, depending on the access to medical care, patients with mild RA may be less likely to be diagnosed.
From 1990 to 2019, the age-standardized RA incidence increased the most in Andean Latin America, southern Latin America, and central Asia. These geographical differences in the risk of RA are attributable to regional differences in the behavioural factors, climate, environmental exposure, RA diagnosis, and genetic factors [7]. In addition, the incidence of RA differs with temporal and geographic differences, which may be influenced by genetic and environmental factors. A study conducted in southern European countries also reported a relatively low RA incidence as compared with those conducted in northern and North American countries [8]. Dietary factors, such as the consumption of olive oil and fish and a Mediterranean diet, may provide protection against disease development and the disease itself [9].
A typical symptom of RA is the subjective feeling of poor joint mobility when getting up in the morning; this symptom is a nonspecific reaction to joint inflammation and an indicator for RA diagnosis. Although the aetiology of RA is currently unknown, many studies have shown that the occurrence of RA is related to factors such as infection and sex hormones, especially the proliferation of the joint synovial-lining cell layer and the destruction of cartilage and bone tissue caused by arthritic reactions due to infection. Immune abnormalities, metabolic abnormalities, and bone degeneration can also lead to the occurrence of RA [10, 11].
RA can occur in individuals of all ages; however, it is seen more in women who perform manual labour jobs in humid environments, generally between 30 and 50 years of age, and women are usually more affected than men [12]. According to the present study, the age-standardized RA incidence rate was lower among men than among women. This may be attributable to the fact that more women perform manual labour jobs in humid environments, the increased susceptibility of the female body, and physiological causes (menstruation, pregnancy, childbirth, and breastfeeding); moreover, the female system is subject to severe hormonal changes, and alterations of metabolic levels can easily lead to endocrine disorders and increase the risk of RA [1, 2, 11]. Thus, compared with men, women are 2–3 times more susceptible to RA [13–15]. Moreover, RA progresses faster and is more severe in women than in men. The pathogenesis of RA is unclear, the associated morbidity rate is high, the prognosis is unsatisfactory, and the disease is difficult to cure; these factors increase the medical burden caused by RA and the social pressure caused by the loss of labour force on society and the family. Therefore, early diagnosis, prevention, and targeted treatment are extremely important for managing RA.
Currently, no pharmacological treatments have been shown to reduce the risk of RA development in the medium to long term. Because RA is a joint lesion that can lead to the loss of joint deformities, from the perspective of prevention, we should attach great importance to early detection and early treatment. We should exercise regularly, supplement calcium in time, maintain normal weight, prevent excessive fatigue, and pay attention to keeping warm, which can reduce the risk of RA.
The GBD study analysed the disease burden according to different indicators across countries/territories and populations worldwide through dynamic monitoring and evaluation of the global health status, quality of life, and DALYs; it also determined the main disease types and high-risk groups across different countries/territories and analysed the main risk factors so as to aid decision-making by governments to understand the health status of their citizens, identify health gaps in countries and territories, and strive to improve the people’s health, formulate effective health development plans, and rationally allocate health resources. By analysing the global EAPC of RA from 1900 to 2019, the effectiveness of current strategies for RA prevention can be determined, and the resultant findings can aid in the development of more targeted strategies.
Our study has some limitations. The accuracy of the GBD study findings depends on the quality and quantity of the collected data, and potential biases due to the misclassification and miscoding of diseases may compromise the robustness and accuracy of the GBD estimates. Differences in the diagnostic criteria between countries and over time can also compromise the accuracy of the estimates.
Increasing trends in the age-standardized RA incidence and DALYs worldwide were shown from 1990 to 2019, the values of these measures remained high in the low–middle- and high-SDI regions, respectively. In particular, central Latin America, southern sub-Saharan Africa, and North America experienced the largest burden of RA; moreover, globally, RA was more frequently reported in women than in men. Future strategies for RA prevention should focus on women and older adults, as well as individuals from Andean Latin America, southern Latin America, central Asia, western sub-Saharan Africa, and other high-risk regions.