Introduction
Cervical spondylotic myelopathy (CSM) is a common disease that can cause paralysis [1]. Surgery is the optimal treatment approach, but after complete decompression, not all of the postoperative CSM cervical cords are restored to their normal morphology (expansion ratio: 27.8–50.0%) and signal intensity (recovered proportion 54.5%) [2]. Cross section areas of some postoperative cervical cords are still reduced. Additionally, in some cervical cords, T2 high signal intensity (T2-HSI) remains after surgery. To our knowledge, postoperative cervical cords with abnormal imaging signs have not been sufficiently investigated. The studies involving postoperative abnormal imaging signs were focused on the relationship with the preoperative cervical cord rather than the postoperative microstructure itself [2, 3]. It would be useful to identify the microstructural changes in externally abnormal cervical cords to enable better recognition of abnormal signs and evaluation of CSM cervical cords.
Compared with conventional magnetic resonance imaging (MRI), diffusion MRI (dMRI) has the advantage of enabling non-invasive assessment of the microstructure of cervical cords with higher sensitivity (79.31–82.76%; by Xiang et al. 2014) [4–7]. Neurite orientation dispersion and density imaging (NODDI) is a new dMRI technique developed from diffusion weighted imaging in recent years. Using the three-compartment model, rather than idealized Gaussian distribution, and the orientation-dispersed cylinder model, NODDI can distinguish water molecules in different practical environments, including intracellular, extracellular, and free water, and can show neurite orientation dispersion [8, 9]. Therefore, the most commendable feature of NODDI is the specificity to evaluate neurite density (intracellular volume fraction, Vic), free water fraction (isotropic volume fraction, Viso), and neurite orientation dispersion (orientation dispersion index, ODI). Since 2012, NODDI has been applied in various studies, including spinal cord diseases, and most studies have confirmed that NODDI enabled more specific and pathology-related evaluations, involving stroke, glioma, multiple sclerosis, and normal mouse brain [10–13]. In our previous study, the correlation between the NODDI metric and functional score could be found in postoperative CSM cervical cords, indicating that the NODDI metric could reflect the functional status of postoperative cervical cords in CSM [14]. Therefore, we assumed that NODDI would be useful for identifying structural abnormalities in postoperative CSM cervical cords.
In this study, we evaluated the microstructural changes in postoperative CSM with abnormal signs (T2-HSI and reduced area (RA)) by NODDI and explored those clinical implications.
Material and methods
Subjects
This was a prospective study, which was conducted from September 2016 to March 2018. CSM patients who prepared to receive posterior cervical laminoplasty with artificial bone (Figures 1–3) for treatment were recruited from inpatients by two senior spinal surgeons (J.C.W. and Q.P.S.; both with > 5 years of experience) in Beijing Jishuitan Hospital from September 2016 to March 2017. Patients provided informed consent. CSM was diagnosed by preoperative conventional MRI scan, with the criterion being the observation of compression only on cervical cords from protruding intervertebral disc, osteophyte, and thickened posterior longitudinal ligament and ligamentum flavum. Other types of cervical spondylosis (for example, cervical spondylotic radiculopathy) and other spinal diseases (e.g., trauma, tumor, infection) were excluded. The reason to choose this procedure was elimination of the metal susceptibility artifact, which artificial bone does not have [15]. These recruited patients were informed to revisit the hospital about 12 to 14 months after surgery because the cervical cords in this period are comparatively stable [16] and the phone reminder was offered. The postoperative MRI scans, including conventional and NODDI sequences, were performed in the revisit. Postoperative conventional MRI could confirm that the cervical canal stenosis was relieved by surgery and no new stenosis outside of the operation area was observed.
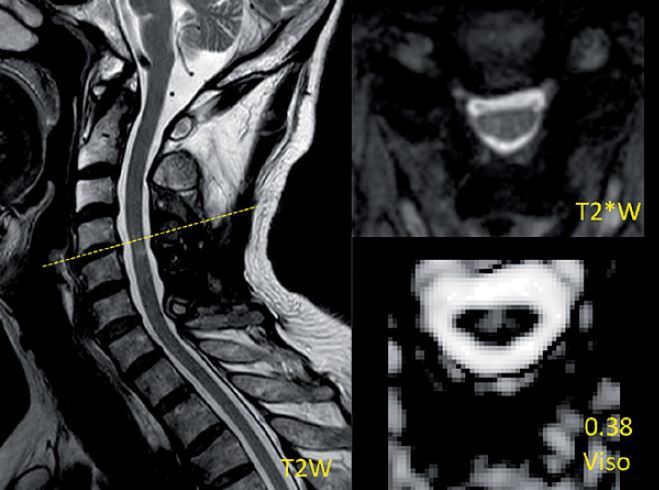
Figure 1
Demonstration of the measurement of a reduced-area (RA) level and images of T2*WI and NODDI metrics and region of interest (ROI) drawing at the level with RA and T2 high signal intensity (T2-HSI) in a postoperative CSM patient. The measurement is the ratio of the most compressed cross section area (Slice 1) to the proximal normal area in the cranial direction (Slice 2). The ratio of this case is about 0.48 and thus this case was placed in the RA group. The values of NODDI metrics in the ROI are presented above the metrics description
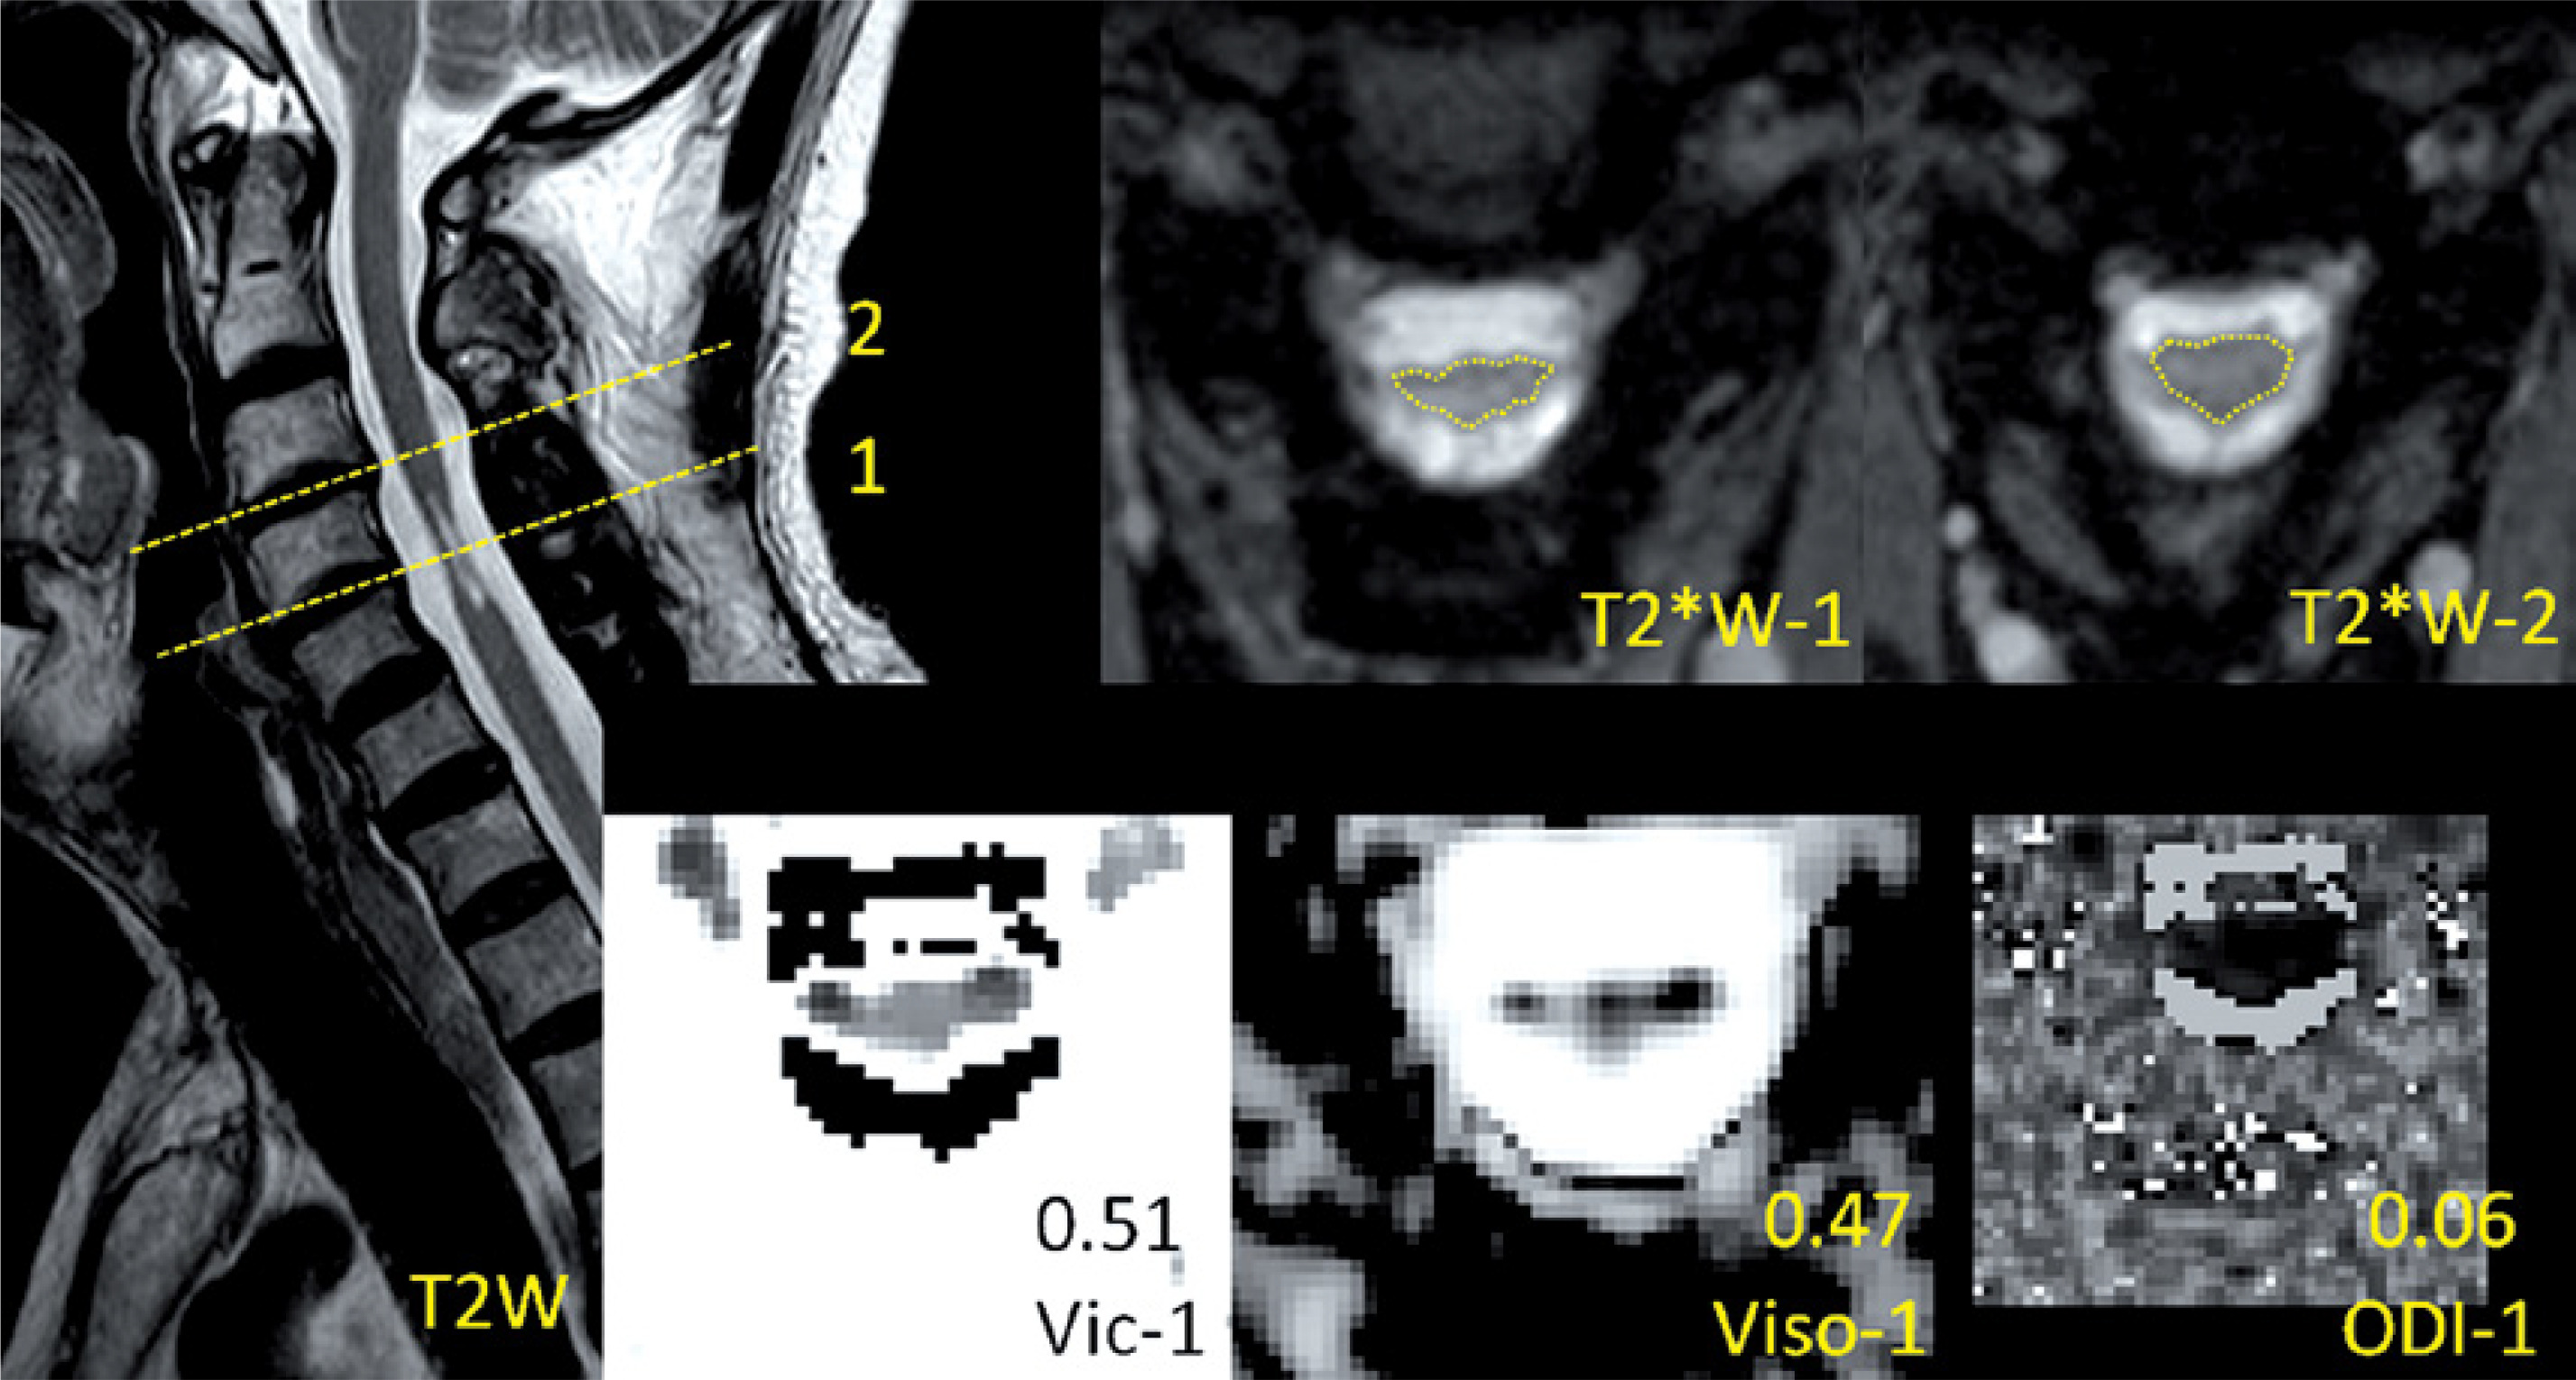
Figure 2
Demonstration of the images of T2*WI and NODDI metrics at the level with normal area (NA) and T2 high signal intensity (T2-HSI) in a postoperative CSM patient. The values of NODDI metrics in the level are presented above the metrics description
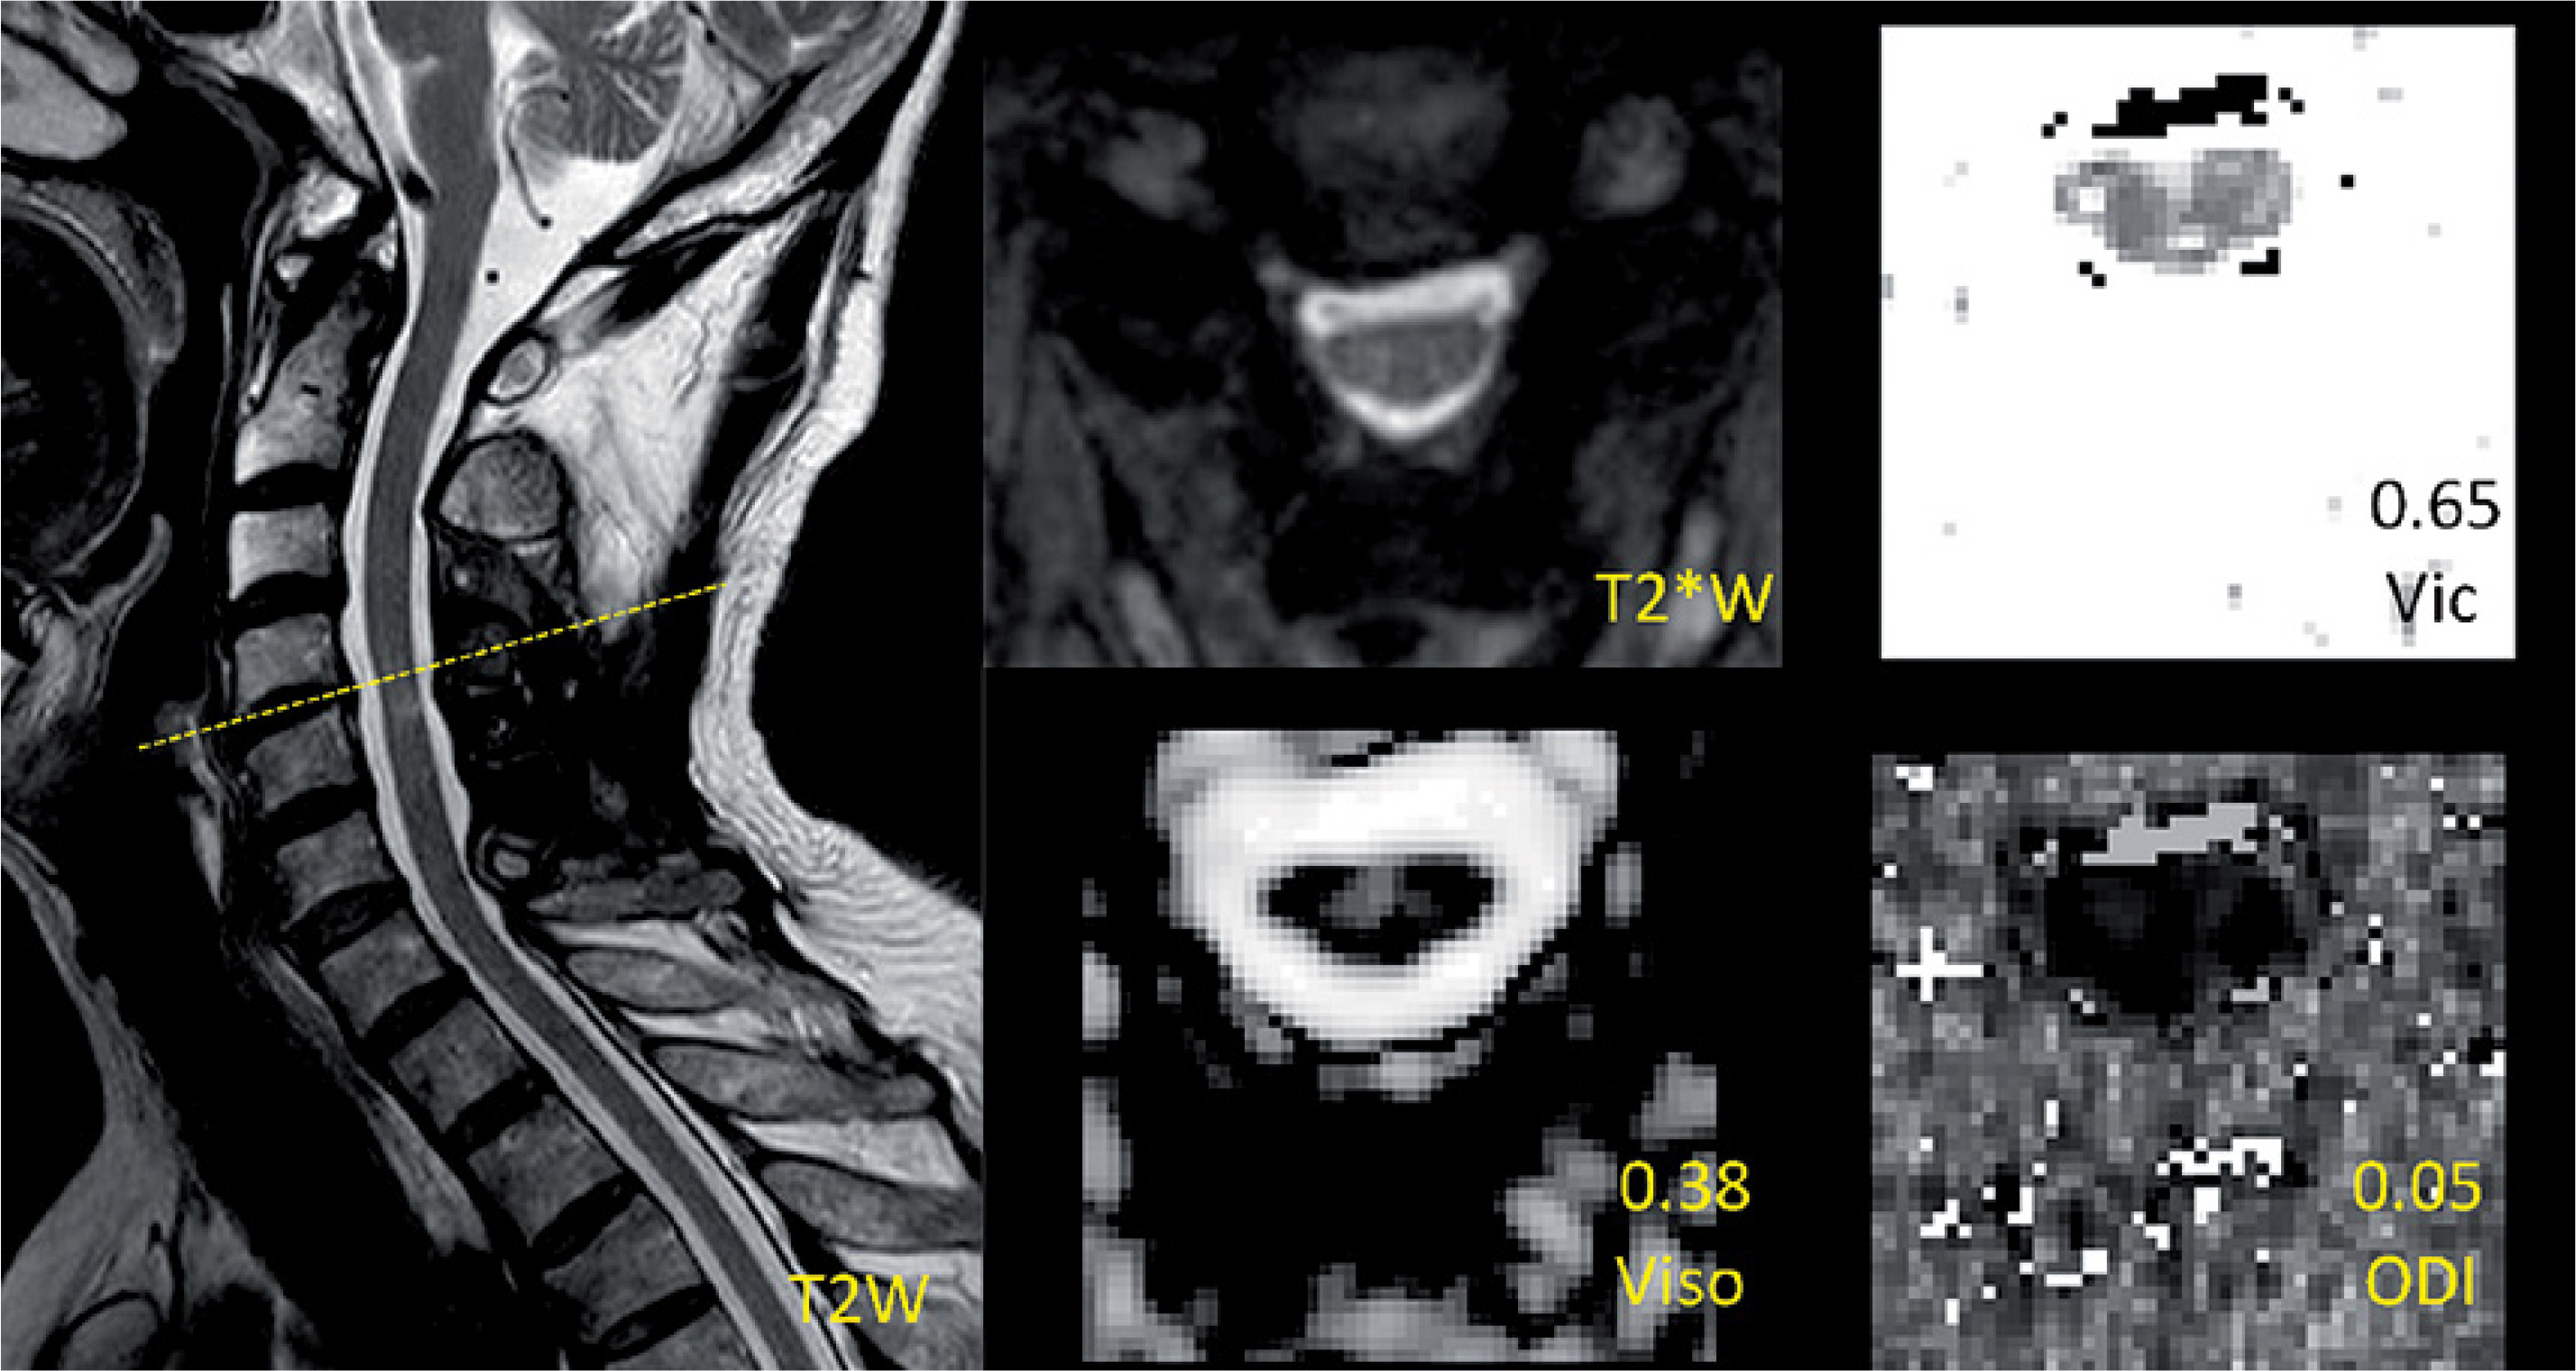
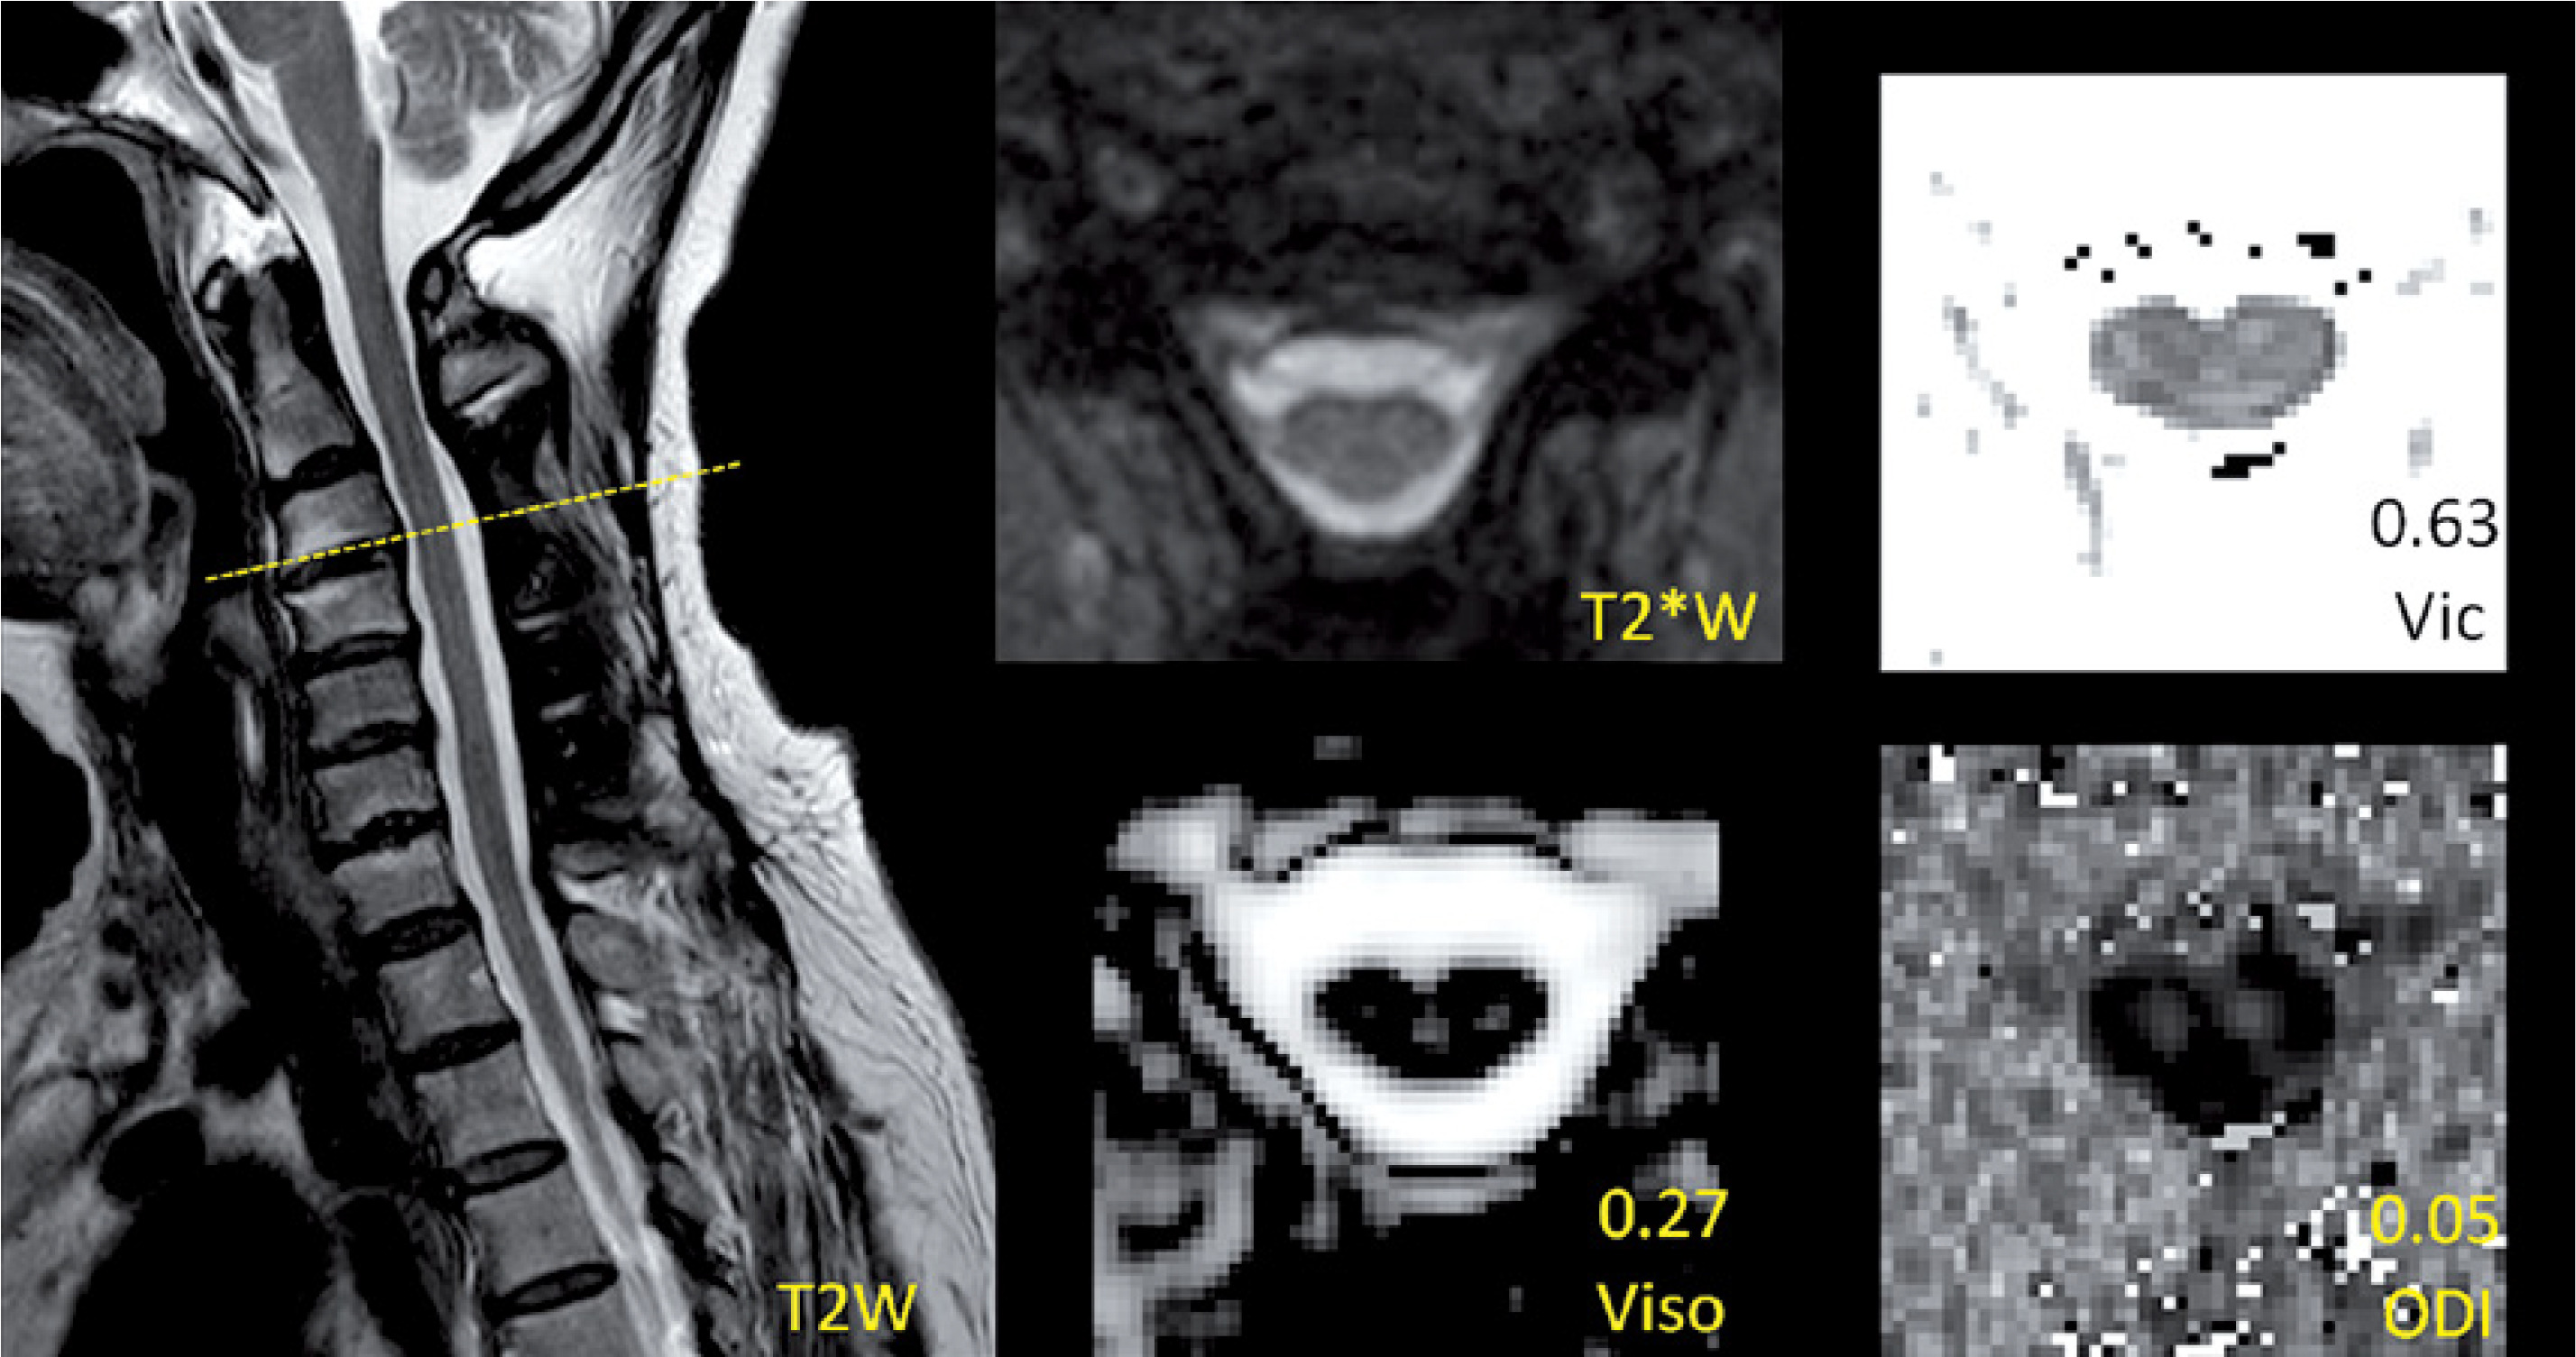
Figure 3
Demonstration of the images of T2*WI and NODDI metrics at the level with normal area (NA) and non-T2 high signal intensity (nT2-HSI) in a postoperative CSM patient. The values of NODDI metrics in the level are presented above the metrics description
The institutional review board of research ethics approved all study procedures. The ethics approval number is 201606-03 and the approval year is 2016. Informed consent was obtained from all individual participants included in the study and was in accordance with the ethical standards of the institution and with the 1964 Helsinki Declaration and its later amendments or comparable ethical standards.
Clinical evaluation
For each patient, the standardized modified Japanese Orthopaedic Association (mJOA) score was assessed by senior spinal surgeons (X.H. and D.H.L.; both with > 5 years of experience) as functional evaluation at 12–14 months after surgery. The mJOA scoring system is the most commonly used functional assessment for CSM. It comprises motor and sensory functions of upper and lower extremities, sensory function of trunk, and bladder function, and the score range is from 0 (no function) to 17 (no functional disorder).
Image acquisition
A 3.0T Ingenia MRI scanner (Philips, Best, Netherlands) with a 16-channel head-neck coil for reception was used to scan all the patients. Each patient was placed in the supine position and was informed to hold still during scanning.
Anatomical images were obtained by conventional MRI sequences, which comprised T1 weighted and T2 weighted turbo spin echo sequences in sagittal view and a T2 weighted multi-echo fast-field echo (FFE) sequence in axial view. The sagittal parameters were as follows: repetition time (TR)/echo time (TE), 474/6.3 ms for T1 and 3000/100 ms for T2; field of view (FOV), 160 × 250 mm2; slice thickness, 3 mm; slice gap, 0.3 mm; slice number, 12; resolution, 0.80 × 1.01 × 3.0 mm3 for T1 and 0.7 × 0.94 × 3.0 mm3 for T2. The axial parameters were as follows: TEs = 8/14/20 ms; TR, 250 ms; FOV, 200 × 152 mm2; slice thickness, 4 mm; slice gap, 2 mm; slice number, 17; resolution, 0.8 × 0.8 × 4.0 mm3.
NODDI data were obtained by a single-shot echo-planar sequence in axial view. The parameters were as follows: diffusion directions, 32; b, 1000/2000 s/mm2; TR/TE, 4500/77 ms; FOV, 60 × 160 mm2; slice thickness, 4 mm; slice gap, 2 mm; slice number, 17; resolution, 1.5 × 1.5 × 4.0 mm3; scan time, 5 min. It should be emphasized that the slice thickness, gap, and locations for NODDI were the same as those for the T2 FFE (T2*) axial image.
Image analysis and processing
The image analysis was performed by two senior radiologists (W.J. and A.H.Y.; both with > 5 years of experience). The most compressed level can be determined by the minimum cross section area of each compressed cervical cord level on preoperative MRI. The measurement attempted to cover the entire cross section of the cervical cord if possible. The level of interest in the postoperative cervical cord was the same slice as the most compressed level in the preoperative image. According to the ratio of the most compressed postoperative cross section area to the proximal postoperative normal area in the cranial direction (Figure 1), a value of ≥ 0.9 indicated a relatively normal area of cervical cord (NA), whereas that of < 0.9 indicated an RA. The threshold value was acquired by the ratio of the minimum cross section area to the maximum area in normal cervical cords [17, 18]. According to the postoperative presentation of T2-HSI in the most compressed level, patients with and without T2-HSI (nT2-HSI) were distinguished. It should be noted that there was no T2-HSI in the other levels of the cervical cord. To avoid interference, patients were divided into the RA-T2HSI, RA-nT2HSI, NA-T2HSI, and NA-nT2HSI groups, representing combined reduced area and T2 high signal intensity, single reduced area, single T2 high signal intensity, and normal area and signal intensity, respectively (Figures 1–3).
The NODDI data were preprocessed by the motion correction function in the Spinal Cord Toolbox (version 3.0.3), and the image quality was carefully checked by two experienced researchers (H.G. and G.Q.L.). Then, NODDI metrics (Vic, Viso and ODI) were acquired by the NODDI MATLAB Toolbox (version 0.9).
The region of interest (ROI) was drawn manually in the axial Viso image by two senior radiologists (W.J. and A.H.Y.; both with > 5 years of experience) using DTI Studio (version 3.0.3). The drawing process, like the process for area measurement, was to cover the entire cross section of the cervical cord at the most compressed level possible. However, to avoid CSF contamination, ROIs were carefully placed away from the margin of the cervical cord. To test the reproducibility of the ROI drawing, reproducibility tests were performed between 20 axial Viso images (approximately 1/3 subjects in this study) from different subjects that were randomly extracted. Intraclass correlation coefficients of the ROI drawing for inter- and intra-observer (between two radiologists and between two drawings by one of the radiologists over 6 months) variability were 0.993 and 0.995, respectively.
Statistical analysis
Statistical differences in NODDI metrics between the RA-T2HSI, RA-nT2HSI, NA-T2HSI, and NA-nT2HSI groups were assessed using the Kruskal-Wallis H test. The postoperative mJOA scores were compared between the RA-T2HSI, RA-nT2HSI, NA-T2HSI, and NA-nT2HSI groups using the Kruskal-Wallis H test, too. The significant threshold was p = 0.05. But for the reason of multiple comparisons, a Bonferroni correction should be used and the level of significance would be adjusted according to the comparison number. All data analyses were performed using SPSS software (version 25.0).
Results
A total of 66 patients provided informed consent, but 4 patients could not revisit the hospital due to physical reasons and 2 patients were excluded for not bearing the scan time and 2 for postoperative cervical canal stenosis. Finally, a total of 58 patients (14 women and 44 men; mean age: 58.7 years; age range: 36–74 years) were recruited. In this study, no patient could be classified as RA-nT2HSI. Hence, the comparisons were performed among the RA-T2HSI, NA-T2HSI, and NA-nT2HSI groups. The comparison number was three, and thus the level of significance was adjusted to p < 0.017.
There was no statistically significant difference in any NODDI metric between the RA-T2HSI and NA-T2HSI groups or between the NA-T2HSI and NA-nT2HSI groups. In the comparison between the RA-T2HSI and NA-nT2HSI groups, only Vic (p = 0.003) showed a significant difference. Even so, there were notable results that the median of Vic was RA-T2HSI < NA-T2HSI < NA-nT2HSI, and the median of Viso was RA-T2HSI = NA-T2HSI > NA-nT2HSI. However, the median ODI had no such distinct trend. These results are presented in Table I.
Table I
Comparisons of NODDI metrics (Vic, Viso and ODI) in postoperative cervical cords between reduced area and T2 high signal intensity (RA-T2HSI), normal area and T2HSI (NA-T2HSI), and NA and non-T2HSI (NA-nT2HSI) groups
[i] NODDI – neurite orientation dispersion and density imaging, RA-T2HSI – reduced area and T2 high signal intensity, NA-T2HSI – normal area and T2 high signal intensity, NA-nT2HSI – normal area and non-T2 high signal intensity, Vic – intracellular volume fraction, Viso – isotropic volume fraction, ODI – orientation dispersion index.
As to the postoperative mJOA score, there was a statistically significant difference only between the RA-T2HSI and NA-nT2HSI groups (p = 0.009). Although the differences between the RA-T2HSI and NA-T2HSI groups and between the NA-T2HSI and NA-nT2HSI groups were insignificant, the median mJOA score was RA-T2HSI < NA-T2HSI < (slightly) NA-nT2HSI. These results are presented in Table II.
Table II
Comparisons of mJOA score in postoperative cervical cords between reduced area and T2 high signal intensity (RA-T2HSI), normal area and T2HSI (NA-T2HSI), and NA and non-T2HSI (NA-nT2HSI) groups
Discussion
This study showed that RA and T2-HSI in postoperative CSM cervical cords, evaluated by NODDI, could indicate different microstructural changes and have implications for clinical function.
In our previous study, NODDI was able to distinguish between postoperative patients and control subjects; that is, Vic in patients was lower than the control subjects and Viso was higher [19]. In the present study, NODDI was able to identify further differences in postoperative cervical cords. Although the difference between the RA-T2HSI and NA-T2HSI groups was insignificant, both the median and distribution range of Vic were lower in the RA-T2HSI group than in the NA-T2HSI groups, as presented in Table I. Vic represents the density of neurites and neurons [11]. Along with a postoperatively still RA, decreased Vic indicates neurite or neuron loss at this level of the cervical cord. Therefore in postoperative RA cervical cords, there is probable presence of nervous tissue loss. This finding was consistent with the results of previous pathological studies [20, 21]. Furthermore, both the median and minimum postoperative mJOA scores in the RA-T2HSI group were lower than those in the NA-T2HSI groups, as presented in Table II, which also indicated that injury was more serious in the RA group (or combined with T2-HSI) than in the group with single T2-HSI because of the irreversible loss of nervous tissue.
However, a relatively NA does not indicate an absolutely unchanged structure because of other signs indicating microstructural changes in cervical cords, for example, T2-HSI. In several previous studies [22–24], T2-HSI was presumed to represent various impairments, including edema, vascular ischemia, necrosis, myelomalacia, and gliosis because of compression on cervical cords. Even after decompression, reperfusion could also cause injury to cervical cords [25]. All of these pathologic changes affect diffusion of water molecules, and thus diffusive functional imaging can evaluate this sign. To our knowledge, this is the first study to explore T2-HSI in CSM cervical cords by NODDI. Comparison of the NA-T2HSI group with the NA-nT2HSI group showed differences in both Vic and Viso, even though the differences were not very significant, as presented in Table I. The median and range of Viso were higher in the NA-T2HSI group than in the NA-nT2HSI group, which indicated a higher proportion of free water in the former. Actually, except for gliosis, all of the other pathologic changes associated with T2-HSI can increase the water content in cervical cords, which can explain the present outcome. Additionally, changes such as necrosis and myelomalacia indicating nervous tissue loss can cause further density decline on the basis of free water increase, which was shown in the present study by a lower median Vic in the NA-T2HSI group than in the NA-nT2HSI group, as presented in Table I. These results indicated that the primary microstructural change in postoperative T2-HSI cervical cords may be increased free water and decreased density of nervous tissue. However, the statistical insignificance of these results may be related to the counteraction from the pathologic variety in T2-HSI. For example, gliosis represents restricted diffusion of water molecules and reconstruction for tissue, which can cause elevated Vic, decreased Viso, and a certain degree of functional recovery [11]. Therefore, the result that both the median and range of the postoperative mJOA score in the NA-T2HSI group were almost the same as those in the NA-nT2HSI group, as presented in Table II, may be for the same reason of the counteraction from the pathologic variety in T2-HSI. Also, the single presence of T2-HSI in postoperative CSM cervical cords may not provide adequate evaluation for functional status.
Comparison of the RA-T2HSI group with the NA-nT2HSI group showed significantly decreased Vic and a lower mJOA score and insignificantly increased Viso in the former, as presented in Tables I and II, which could be regarded as the verification for the above. This finding indicated that the postoperative combination of RA and T2-HSI might represent a very serious injury to cervical cords, for the reason that nervous tissue loss existed in RA as mentioned before. However, the value of ODI was unremarkable in any comparison, which may be because of the operative relief of neurite orientation disorder [26, 27]. In short, postoperative MRI signs (RA and T2-HSI) can be used for brief microstructural and functional evaluation of postoperative CSM cervical cords.
The present study had some limitations. First, the ROI covered the entire cross section of the cervical cords. Because the single-shot model is used to shorten the scan time for clinical application, the limited resolution of NODDI is unable to distinguish white matter from gray matter. However, the entire coverage showed excellent repeatability in this study. Additionally, some researchers consider that NODDI can be applied to gray matter [11]. Second, the subject size was limited so that the results could not be demonstrated adequately. The surgical procedure, patients’ compliance to revisit and endurance in the scanning restricted the subject size. Third, different segments of cervical cords were not differentiated and respectively compared because of the limited subject size. Therefore, future work is planned to increase the sample volume for excluding the impact from cervical cord segments.
In conclusion, our study showed that microstructural changes in postoperative CSM cervical cords with RA and T2-HSI were different and could be evaluated by NODDI metrics and had certain clinical implication. These MRI signs could be used for brief evaluation for postoperative CSM cervical cords.